
Abstract
Titanium nitride (TiN) nanocrystallites exhibiting high specific surface area  for electrochemical capacitor application were obtained by a two-step halide approach comprised of a room-temperature
  reaction followed by heat-treatment under
  atmosphere. The synthesized nitride powders were agglomerates containing spherical crystallites
  in diam and exhibit a specific surface area ranging from
  depending on the heat-treatment temperature. The specific capacitance evaluated by cyclic voltammetry in
  KOH electrolyte ranged from
  depending on the heat-treatment temperature and the scan rates employed. Structural characterization was performed using X-ray diffraction, helium pycnometry,
  adsorption for specific surface area measurements using the Brunauer-Emmett-Teller method, Fourier transform infrared spectroscopy, and high-resolution transmission electron microscopy. Results of these studies are presented and discussed.
Export citation and abstract BibTeX RIS
Electrochemical capacitors, also called supercapacitors or ultracapacitors, have acquired considerable attention due to their high power density  and long cycle life
  compared to other electrochemical energy storage systems including batteries. Furthermore, supercapacitors exhibit higher energy density
  compared to conventional dielectric capacitors.1, 2
The major classes of materials applied for electrochemical capacitors include various forms of carbon, conductive polymers, and transition metal oxides. These electrochemical capacitor materials can be divided into two types depending on the electrical charge storage mechanisms. Electrochemical capacitors that involve a separation of charges at the electrode-electrolyte interface are called the electrical double layer capacitors (EDLC) while those that involve a Faradaic reaction occurring at the electrode surface at a specific potential are called pseudocapacitors. Because both mechanisms rely on the electrode-electrolyte interface reactions, understanding and modifying the surface property is crucial in achieving high power and energy density. The most widely studied EDLC materials at present are carbon based, as high specific surface area greater than  can be achieved.3 Nevertheless, the highest specific capacitance reported for carbon-based materials is around
  in aqueous electrolytes.4
Ruthenium oxides, on the other hand, are widely known pseudocapacitor materials with anhydrous crystalline  powders exhibiting specific capacitance of
  due to the redox activity confined to the electrode surface via adsorption of protons from the solution.5, 6 In addition, amorphous
  synthesized by sol-gel methods exhibit a specific capacitance as high as
  in an acidic electrolyte. However, the expensive nature of ruthenium limits its potential for commercialization despite its superior performance.4, 7 Hence, much effort has been directed to identifying alternative materials which are inexpensive while exhibiting high specific capacitance comparable to that of ruthenium oxide. Identification of such a material though desirable still remains a major challenge.
The material properties required for use as an electrochemical capacitor include good electronic conductivity, chemical stability to alkaline and acidic electrolytes, low cost, high density, and high specific surface area. Transition metal nitrides appear to be suitable materials for supercapacitor application, as they exhibit good electronic conductivity  , excellent chemical resistance to acids/alkali, and high mass density
  .8, 9 Earlier, Thompson et al. explored transition metal nitrides and carbides for supercapacitor application although no detailed studies have been reported on each system.8–10 Furthermore, in an earlier study we reported that nanocrystalline VN synthesized by ammonolysis of halides showed stable pseudocapacitance behavior generating a specific capacitance as high as
  with a specific surface area of only
  .11, 12
In the present study, we have extended the approach to TiN and we report the two-step ammonolysis reaction involving first the reaction of liquid  with ammonia at room temperature followed by heat-treatment in ammonia to obtain nano-crystalline TiN powder at relatively low temperatures
  . The nitrides obtained at different heat-treatment temperatures have been characterized for structure, composition, and morphology while also analyzing and comparing their electrochemical response.
Experimental
All of the TiN synthesis procedures were conducted in an ultrahigh purity (UHP)-Ar atmosphere, as liquid  (99.9% Aldrich) is extremely air sensitive and hygroscopic. The specific procedure consisted of the following. First,
  was dissolved in anhydrous chloroform (
 : 99.8%, ACROS) inside a glove box (Vacuum Atmosphere;
 ). Chloroform was dried before use using
  following standard procedures.13 After
  of mixing, the solution was transferred to an Ar-filled glove bag (Atmosbag: Aldrich) connected to a Schlenk line where the dissolved
  was reacted with anhydrous
  gas (Matheson; 99.99%, flow
  ) for
) for  . The as-prepared powders were then collected after evaporation of the solvent at
  under flowing
  gas. For the final nitridation,
  of the as-prepared powder were heat-treated at various temperatures for
  under anhydrous
  atmosphere (flow
  ) employing a heating and cooling rate of
  . When heat-treated at temperatures lower than
  , the powders were oxygen passivated before exposing to air by flowing UHP-Ar containing 0.1% oxygen for
  at room temperature. This procedure stabilized the nano-sized powders and prevented them from being pyrophoric.
To determine the phase, the TiN powders were subjected to X-ray diffraction (XRD) analysis (X'pert Pro, Philips) using  radiation
  from 10° to 80° angles with a step size of 0.0334 and a
  exposure time. The crystallite size was calculated from the full width at half-maximum (fwhm) of the (200) peak at 42.7° using the Scherrer equation. High-resolution transmission electron microscopy (HRTEM) was used for estimating the crystallite size and analyzing the morphology. The specific surface area was measured using a multipoint (8) Brunauer-Emmett-Teller (BET) technique (Quantachrome Inst., NOVA-2000). The electronic conductivity was measured using the four-point probe method, which comprised 3D adjustable probes and a digital source meter (Keithley 2400). The TiN was compacted into a pellet by employing a uniaxial pressure of
  prior to measuring the electronic conductivity. Elemental analysis of the nitride was conducted using EDAX and the composition was calculated by differential thermal and thermo gravimetric analysis (DTA-TGA) following the method reported by Saeki et al.14 The electrochemical response of the synthesized TiN was studied by cyclic voltammetry (CV, Arbin Instruments) using a standard half-cell (three-electrode) configuration. The electrode was comprised of the active nitride material, super P and poly(vinylidene fluoride) (PVDF) in a weight ratio of 85:5:10 dispersed in N-methylpyrrolidinone (NMP) solution. The slurry was coated on a nickel disk (
 diam).
  was used as a reference electrode along with Pt wire serving as the counter electrode. CV was conducted over the potential range of
  employing scan rates starting from
  and then decreasing to
  in
in  KOH electrolyte. The average specific capacitance was calculated by integrating the enclosed area of the anodic and cathodic currents in the CV plot. The total charge was then divided by the mass and potential window used for the test. Impedance spectroscopy (IS) analyses on the nanocrystalline TiN electrode synthesized at
  have been performed using a CHI 660A (CH Instruments, Austin. TX) electrochemical workstation by applying a
  amplitude over a frequency range of
  . The IS data collected at potential ranging from
  have been analyzed using ZVIEW (Scribner Associates, Inc., Southern Pines, NC) for plotting and correlating the obtained impedance data to the appropriate equivalent circuit model.
Results and Discussion
Figure 1 shows the XRD patterns of the as-prepared and TiN powders synthesized at different temperatures under  atmosphere. Based on the XRD data, it appears that the as-prepared powder is primarily comprised of a mixture of amorphous titanium chloro-amides and crystalline ammonium chloride
  by-product.15 After heat-treating the as-prepared powder in
  atmosphere, cubic (Fm3m) TiN powders were obtained at a temperature as low as
  . The XRD peaks sharpened with increasing temperatures indicating the expected grain growth of the nitride. The broadening of the X-ray peak was used to calculate the crystallite size using the Scherrer equation summarized in Table I. The crystallite size of TiN synthesized at
  was
was  in diameter yielding a specific surface area of
  whereas TiN synthesized at
  exhibited a crystallite size of
  with a reduced specific surface area of
  . HRTEM images of the TiN powder synthesized at
  are shown in Fig. 2. The TiN powders consist of agglomerates of uniform spherical
  crystallites, which are smaller than the average crystallite size determined by the Scherrer equation, as the bright field HRTEM images were collected from extremely fine powders dispersed in the supernatant methanol solution. The nano-crystallite show lattice fringes, indicating well-formed crystallites with no obvious line defects. The lattice fringes were analyzed by converting into an intensity profile, and the distance between fringes was measured to be
  with respect to the distance bar used as a reference, indicating that the fringes correspond to the (200) plane. However, the slightly shorter (200) plane distance compared to
  corresponding to the (200) plane of stoichiometric TiN suggests the existence of possible point defects due to excess nitrogen or from the error created by the reference scale bar.
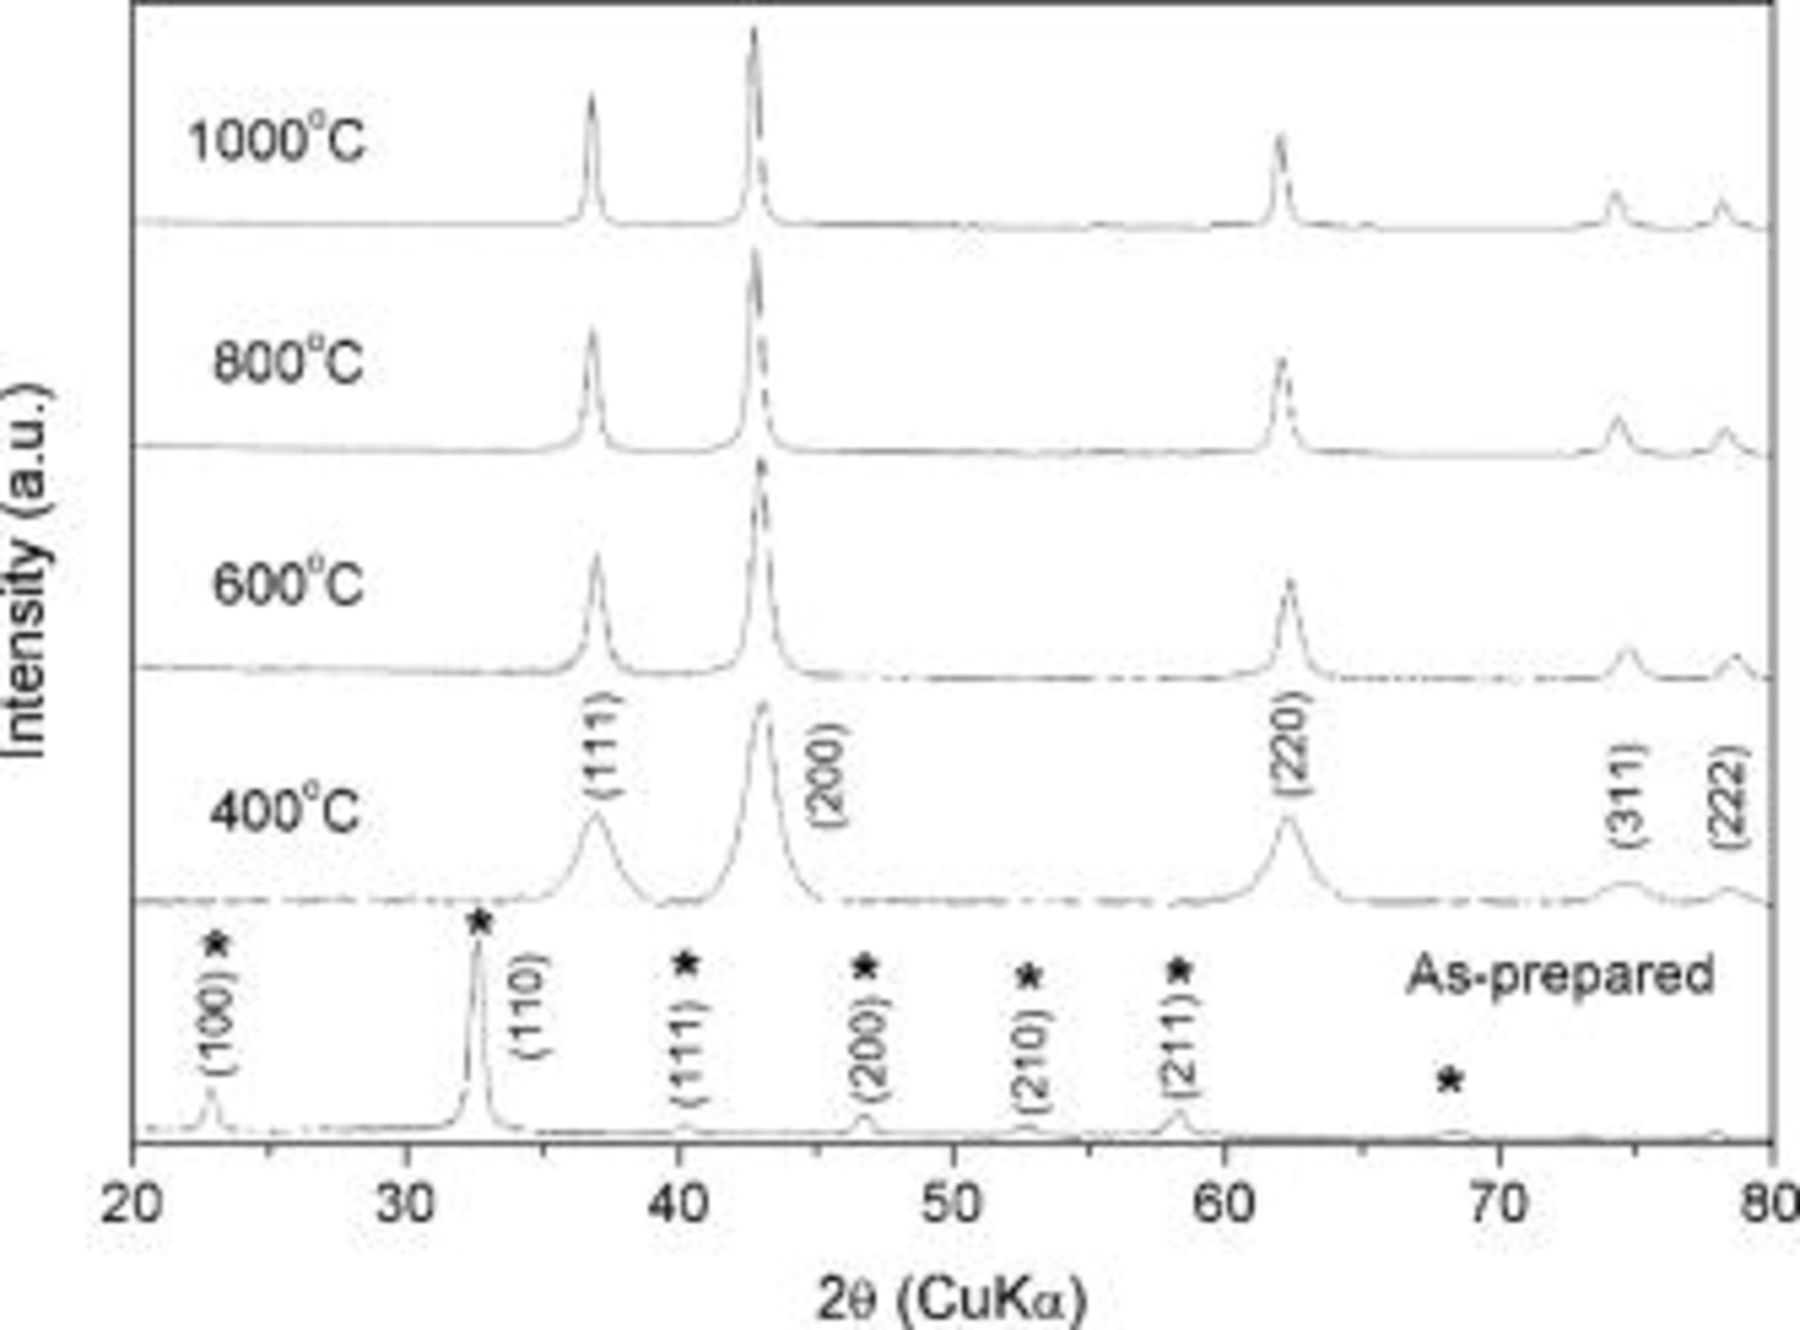
Figure 1. XRD patterns of TiN synthesized at various temperatures under anhydrous  atmosphere (flow
  ).
). 
Table I. Microstructural and physical properties of TiN synthesized at different temperatures.
| Properties | Synthesis temperature (°C) | ||||||
|---|---|---|---|---|---|---|---|
| 400 | 500 | 600 | 700 | 800 | 900 | 1000 | |
| Crystallite size (nm) | 8.23
| 15.98
| 16.21
| 19.73
| 20.03
| 24.64
| 27.03
|
| Lattice constant (Å) | 4.219 | 4.211 | 4.214 | 4.222 | 4.228 | 4.229 | 4.234 |
Spec. surf. area 
| 128.7 | 47.17 | 46.67 | 32.05 | 31.48 | 30.66 | 22.65 |
| Density (g/cm3) | 3.76
| 4.73
| 4.71
| 4.73
| 4.74
| 4.83
| 4.9
|
Electronic conductivity
| 26.62
| 42.32
| 51.62
| 51.69
| 60.78
| 93.55
| 197.86
|
| Composition |

| ||||||

| 1.274 | 1.223 | 1.214 | 1.187 | 1.103 | 1.083 | 1.024 |

| 0.172 | 0.032 | 0.024 | 0.022 | 0.016 | 0.012 | 0.008 |
aDetermined by XRD analysis using Debye-Scherrer equation and the fwhm of the TiN (200) Bragg peak  . bLattice constant measured by Rietveld refinement of the XRD peaks. cBET surface area measured by
  adsorption. dMass density measured by pycnometer using micro-cell
  . eDetermined by four-point probe measurement of TiN pellet
  . fElements were analyzed by EDAX and the amounts determined by DTA-TGA analysis in Ar and Air.
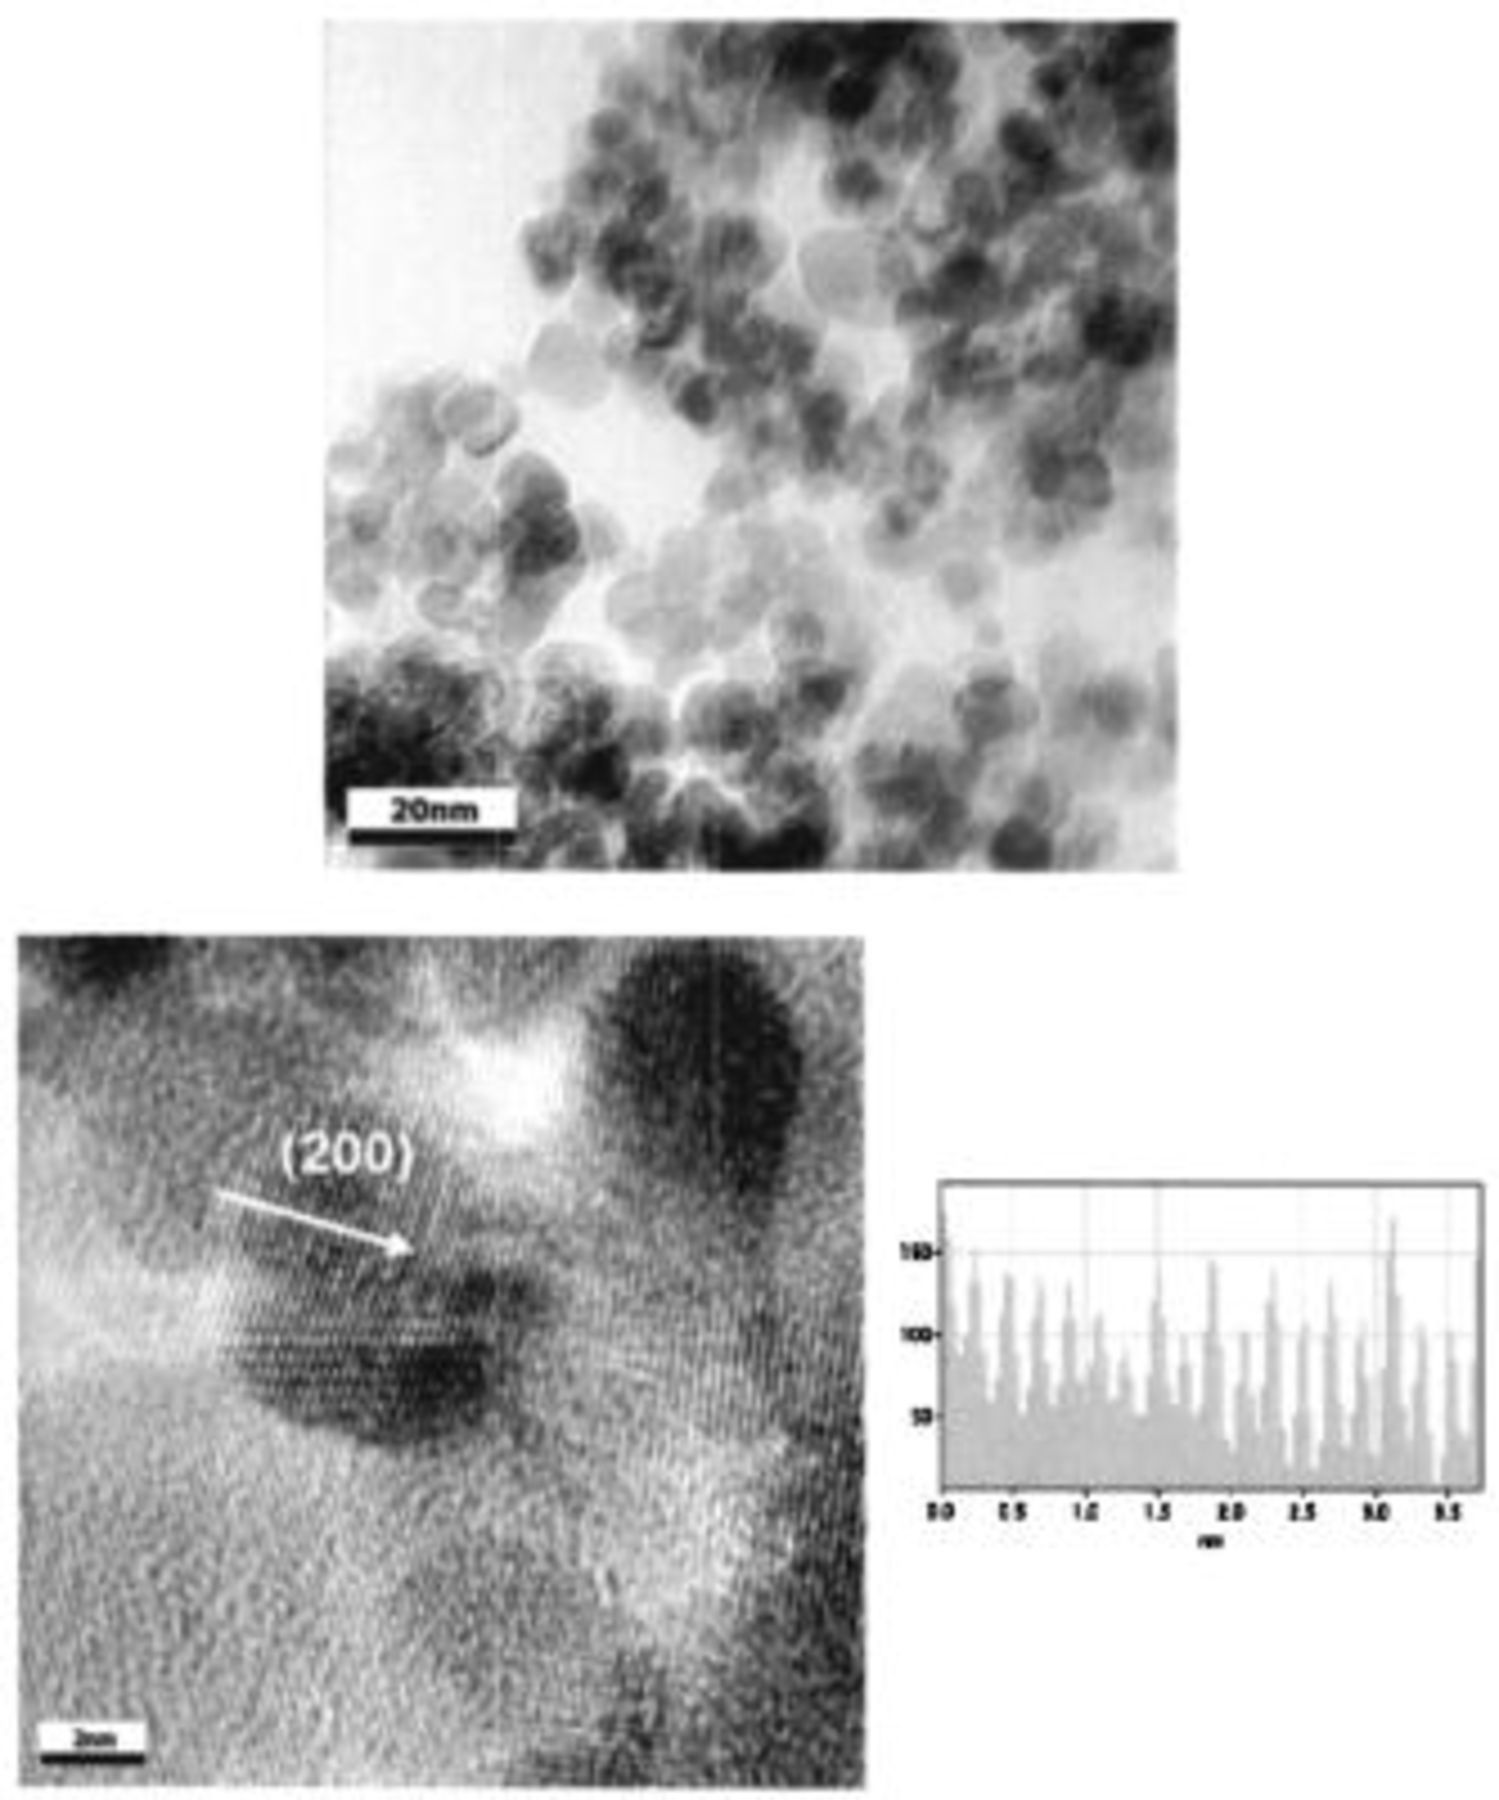
Figure 2. HRTEMs and line intensity profile of TiN powder synthesized at  by heat-treatment of the as-prepared precursor under
  atmosphere.
The chemical compositions of the TiN synthesized at different temperatures are shown in Table I. The synthesized TiN contains excess nitrogen with chlorine impurities especially for those obtained at lower temperatures. A detailed account of the procedure used for determining the chemical composition has already been reported elsewhere.15
The electrochemical response of the synthesized TiN powder was performed by CV on the TiN electrode scanned at various scan rates  as shown in Fig. 3. The shape of the CV at low voltage sweep rate of
  can be approximated to a rectangle for both the charge and discharge portions taken together which is reflective of an ideal capacitive behavior. The absence of faradaic peaks in the CV curves over a complete cycle even at low scan rates indicates the absence of a redox reaction between the different ionization states of titanium in the applied potential window region which resembles the response to be representative of an electrical double layer (EDL) type capacitor. However, the current generated solely from the EDL formation is high for TiN exhibiting a relatively low surface area compared to that of carbon-based capacitors. This indicates the possibility of continuous chemisorption of cations/anions related to pseudo capacitance throughout the potential range applied. Chemisorption is likely to occur due to the presence of the transition metal, which is different from carbon-based capacitors that cannot undergo valence state transitions. Furthermore, the transition metal surface is more susceptible to be polarized showing a strong affinity for the
  and
and  generated at the TiN/electrolyte interface. When the single ionization state is stable throughout the potential window, no peak related to the faradaic reaction will be observed as relatively constant electron transfer occurs throughout the linear voltage sweep. Therefore, the possible energy storage mechanisms for the capacitive response of TiN can be attributed to both EDL formation and pseudocapacitance arising from the chemisorptions of cations/anions.
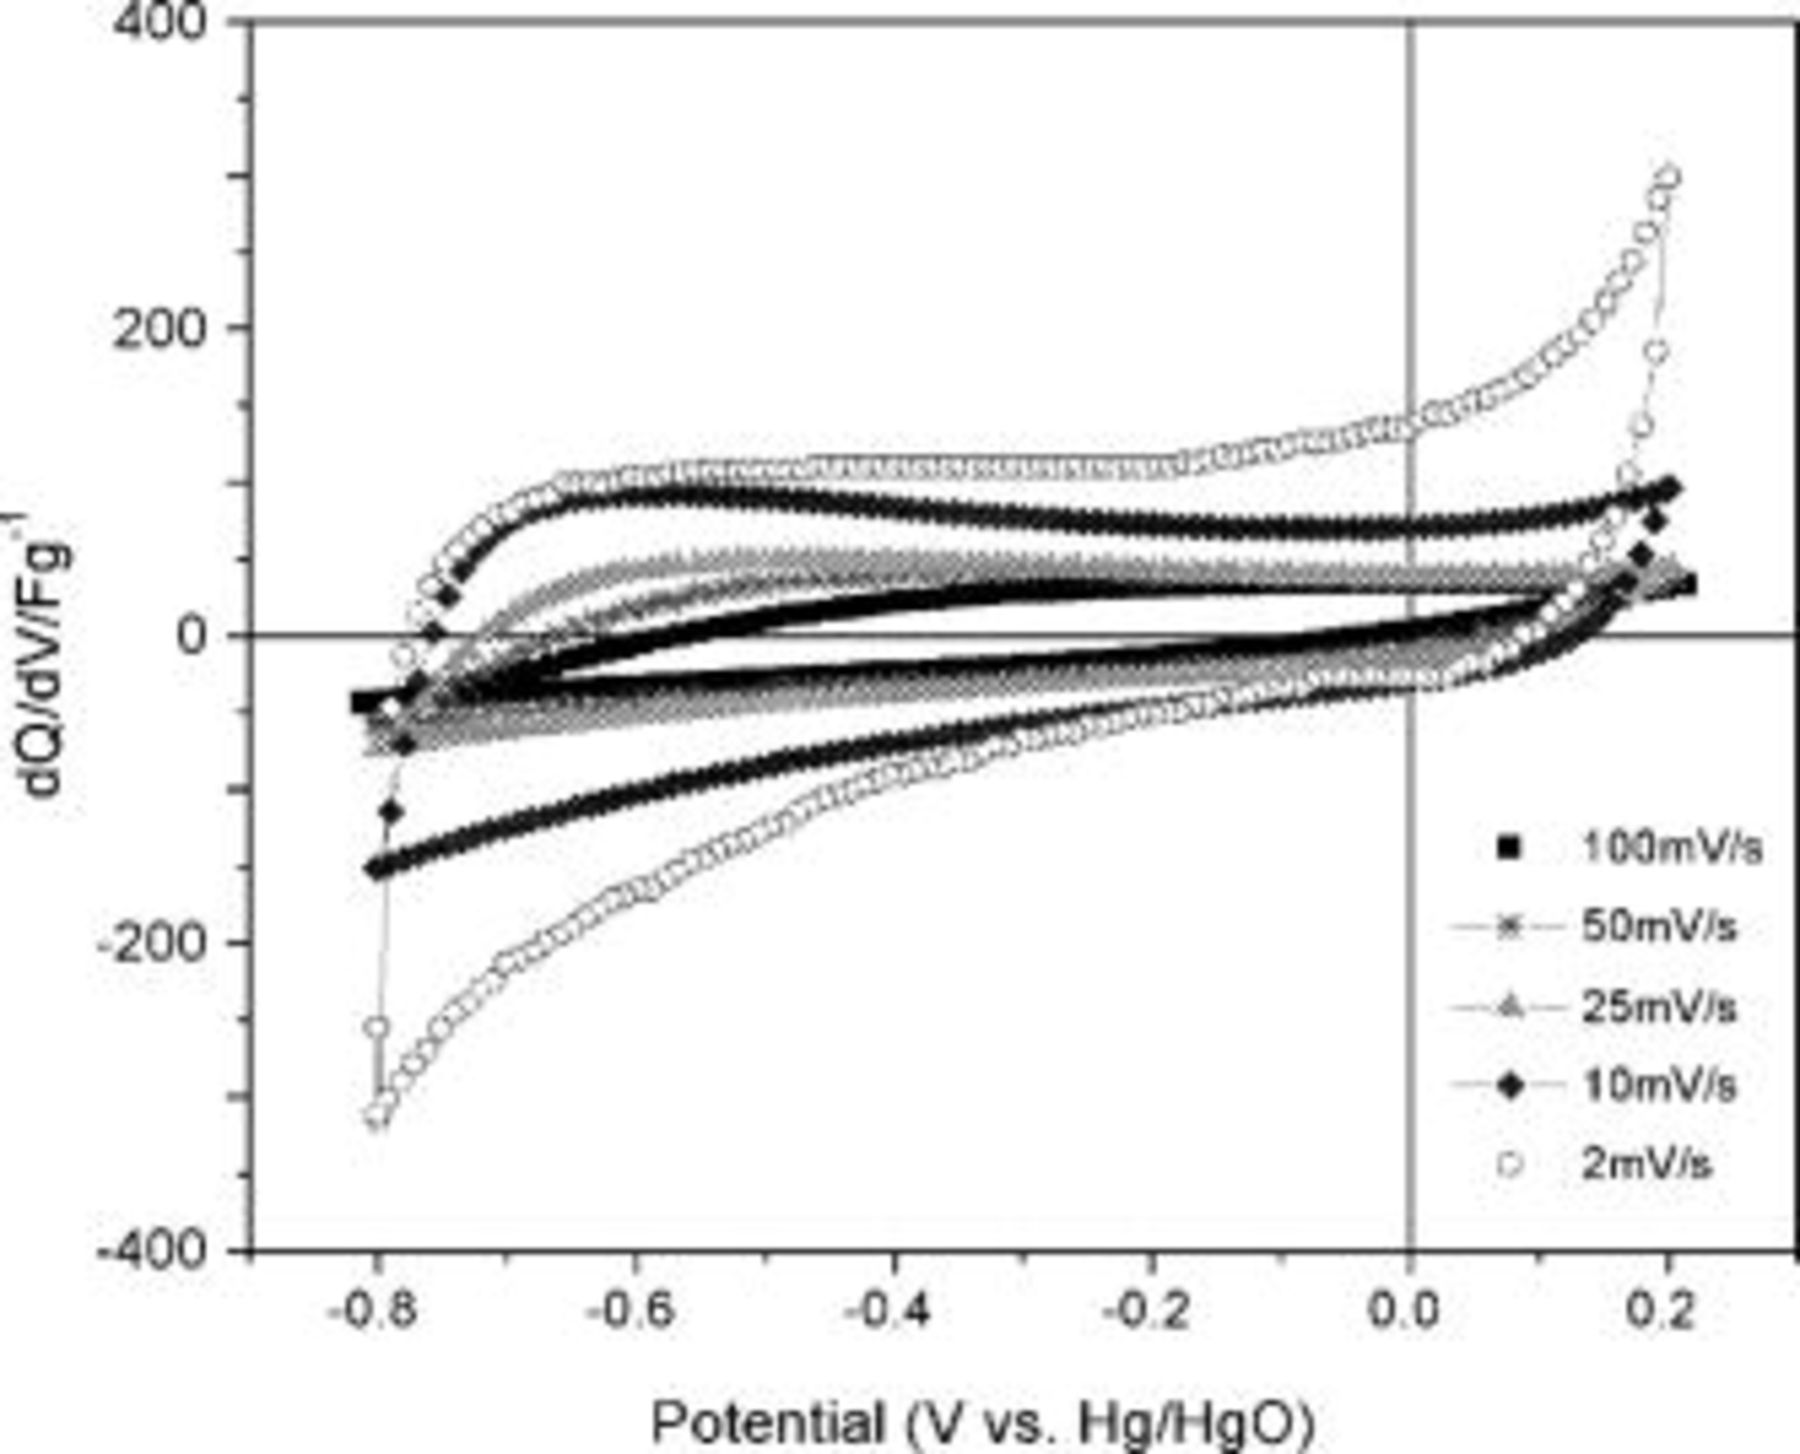
Figure 3. CV of TiN synthesized at  scanned between
  and
and  vs
vs  at various scan rates
  .
.
The influence of sweep rate on the performance of the TiN electrode can be seen in the CV plot where the scan rates have been gradually decreased from  . As the sweep rate increases, the rectangular shaped CV curve gradually collapses and becomes more inclined (45° to the voltage-axis) indicative of a poor capacitive response.16, 17 As a result, the specific capacitance is determined to be sensitive to the voltage sweep rate due to the capacitive (RC) time constant of the sample. Such a deviation of current density at higher scan rate is similar to that observed in other high surface area carbon based EDLCs. The overall specific capacitances calculated for TiN synthesized at various temperatures are plotted in Fig. 4. The highest specific capacitance of
  was exhibited by TiN synthesized at
  when scanned at
  (specific surface area =
  ). Even though the scan rate employed was low, the capacitance obtained is high compared to other EDLCs, which typically display a specific capacitance of about
  .18 The lowest capacitance of
  was obtained for TiN synthesized at
  (specific surface area =
  ) when scanned at
  while yielding
  when scanned at
  . The increase in specific capacitance with decrease in synthesis temperature is expected to arise from the utilization of the higher specific surface area for pesudocapacitance and electrical double layer formation. The surface related phenomena attributed to the high specific surface area related to the small crystallite size of the nitride are especially critical for supercapacitors. Assuming a spherical morphology of the crystals observed in the HRTEM images, the effective crystallite size,
  can be related to the specific surface area,
  as follows

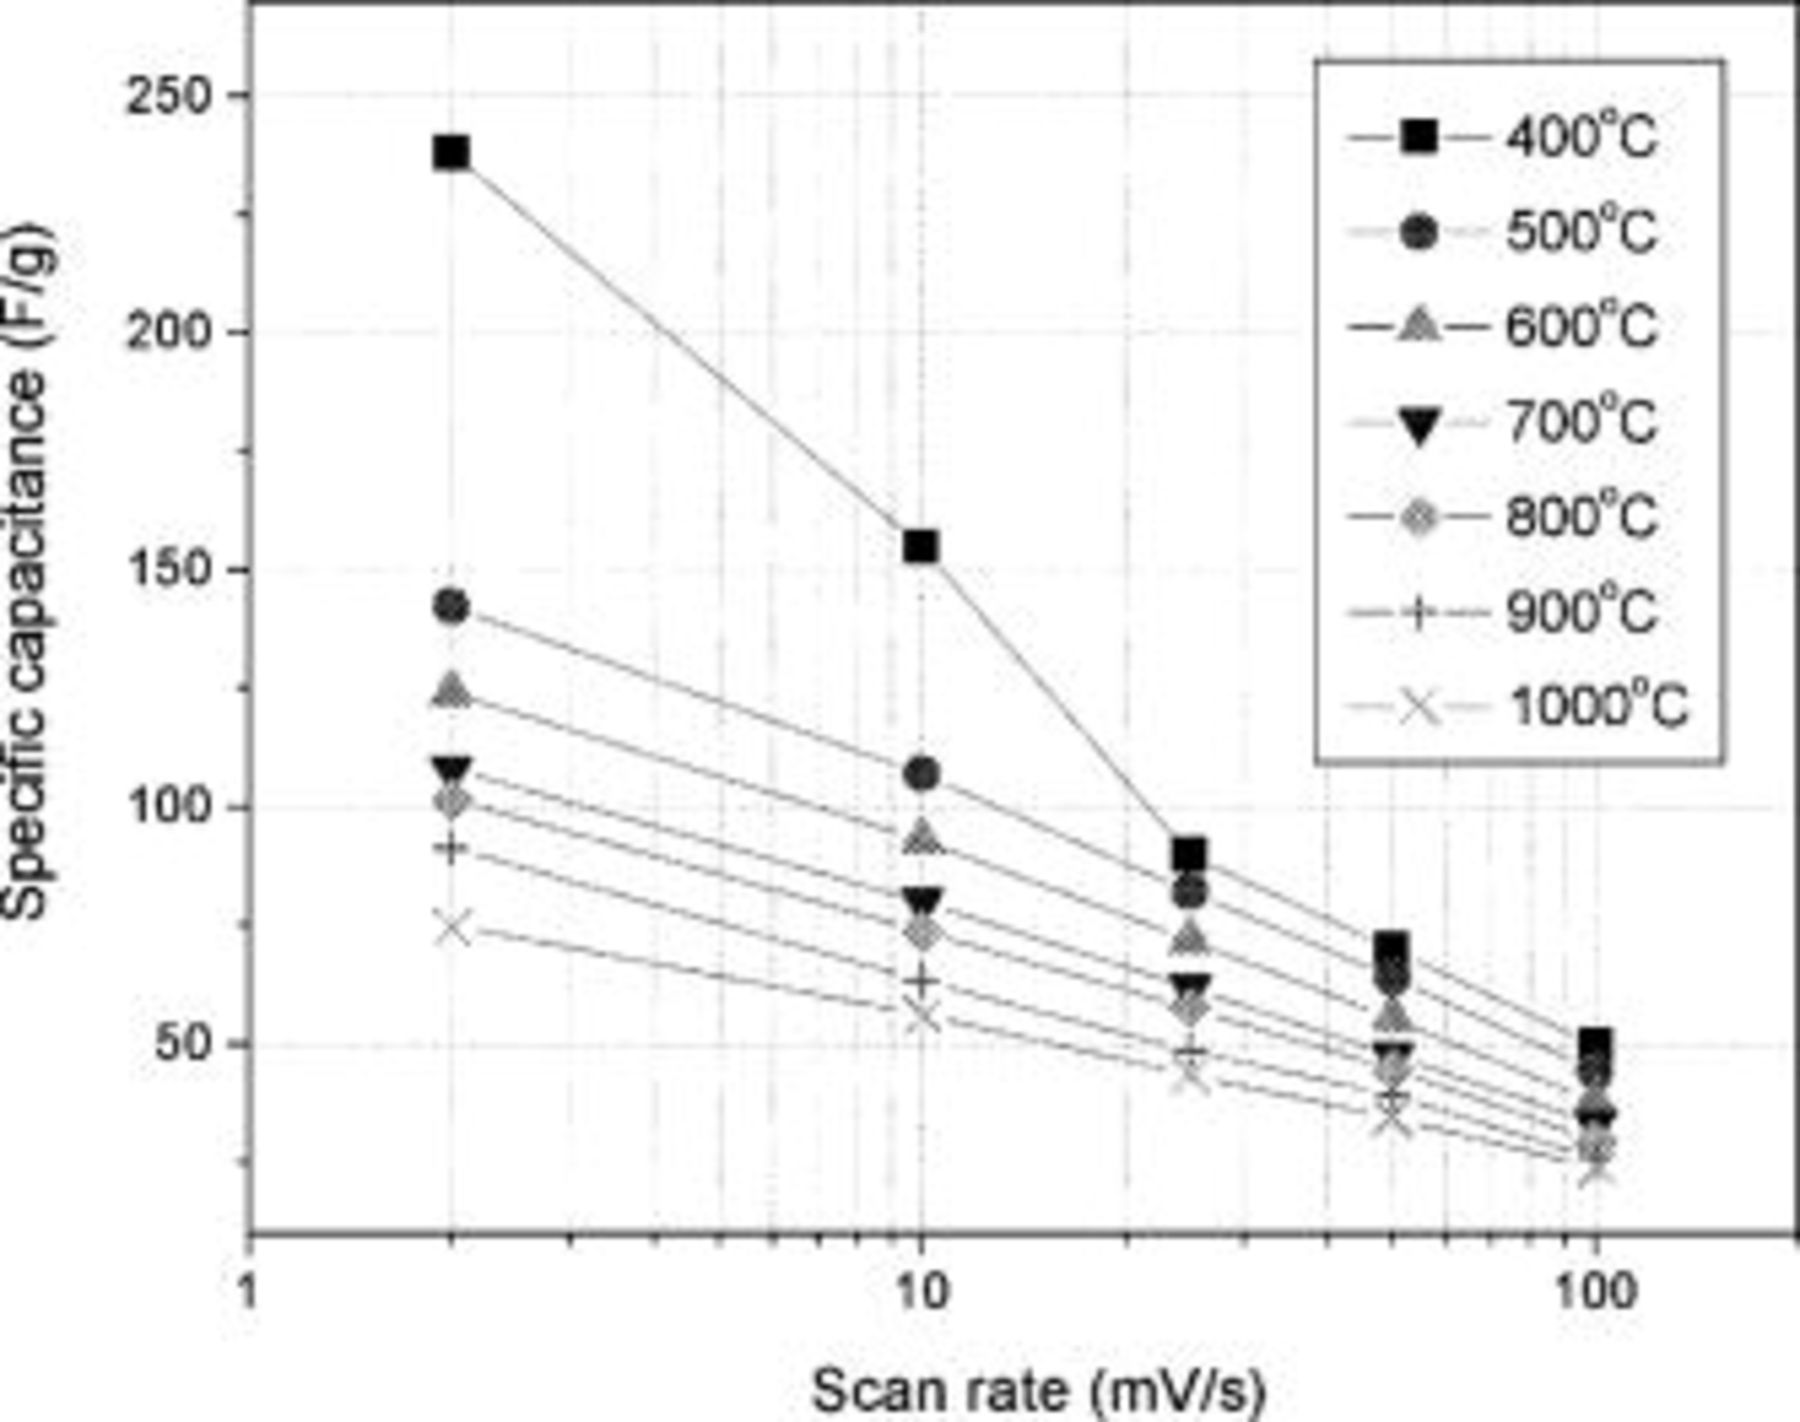
Figure 4. The specific capacitance (F/g) of TiN nano-crystallites synthesized at different heat-treatment temperature scanned at various scan rates  in
in  KOH.
KOH.
Considering the theoretical density of TiN  and
and  measured using the BET technique, the crystallite sizes calculated for all the heat-treatment temperatures agree well with the value determined by XRD. The slight deviation is inevitable due to the surface area lost at the grain boundaries. The two-dimensional interfacial (electrode surface-electrolyte) charge density,
  was evaluated by16

where C is the measured specific capacitance (F/g), A is Avogadro's number,  is the potential window, F is the Faraday constant,
  is the measured specific surface area
  , and
, and  is the area occupied per transition metal atom in a given crystallographic packing plane. The cubic (Fm3m) TiN with a lattice constant of
  has
has  of 2.248 and
  in (111) and (100) planes, respectively, the former representing the most densely packed plane in the rock salt structure. Generally,
  larger than 1 implies the occurrence of charge transfer and oxidation-reduction reactions attributed to a typical pseudocapacitance behavior. The
  value of typical carbon based EDLCs exhibit
  while pseudocapacitors exhibit 2.5 electrons per atom of accessible surface.15 The calculated
  values using the averaged
  from (111) and (100) planes for TiN synthesized at 1000 and
  was 0.85 and 0.57 when tested at a scan rate of
  , respectively. However, the
  values decreased to 0.27 and 0.11 when the scan rate was increased to
  for TiN synthesized at 1000° and
  , respectively. Such a result indicates that the charge storage mechanism is related to the pseudocapacitance as
  values are high for a conventional EDLCs. The
  value was quite independent of heat-treatment temperature at a given scan rate for TiN synthesized above
  but TiN obtained at
  had lower
  value. This is probably due to the more porous structure and lower electronic conductivity of the nitrides synthesized at lower temperatures making it less effective in utilizing the larger surface area created.
From these results, it is shown that the utilization of the surface area and specific capacitance decreases with increase in scan rate. Such a rate limitation is mainly due to three contributions—the chemisorption rates of anions/cations, the electronic conductivity of the electrode, and the ionic diffusion of the electrolyte. The electronic conductivities of the synthesized nano-crystalline TiN powders are shown in Table I. The electronic conductivity increased with increase in crystallite size and also with the stoichiometry approaching closer to that of stoichiometric TiN. Nevertheless, at all temperatures, the electronic conductivity was higher than carbon  but lower than crystalline
 . At all temperatures, however, the electronic conductivity was two order of magnitude lower than bulk TiN
  .9, 19 The electronic conductivity decreased with decrease in heat-treatment temperature as smaller crystallites increase the number of grain boundaries that consequently increases the electrical resistance. Another factor that limits the rate response of the electrode is ionic diffusion related to the porous electrode. The pore size distribution has a strong influence on the frequency response of porous electrodes where the pore size must be large enough to enable fast accessibility of the ionic species into the pores to eventually form an electrical double layer or chemisorption in response to changes in electrode polarization. In the case of aqueous media, pores should be no less than
  to allow charge accumulation on their inner surface and pore sizes of
  are preferred.20 Special attention must be paid to the pore diameter values determined by the BET technique for electrochemical application. According to Shi et al. , if a single
  molecule
  is adsorbed at
  , one can expect the electrosorption of the solvated ions with an identical size such as
  and
and  in aqueous media.21 Figure 5 shows the pore size distribution calculated by the Barret-Joyner-Halendo (BJH) desorption isotherm for the TiN nano-crystallites synthesized at different temperatures. As shown, the pore sizes are distributed mostly within the mesopore
  range.22 When lower synthesis temperatures were employed, the pore volume increased but no significant change in size distribution was observed. Thus, the pore sizes of all the nitrides synthesized at different temperatures should be easily accessible to the solvated
  and
and  species in the electrolyte.
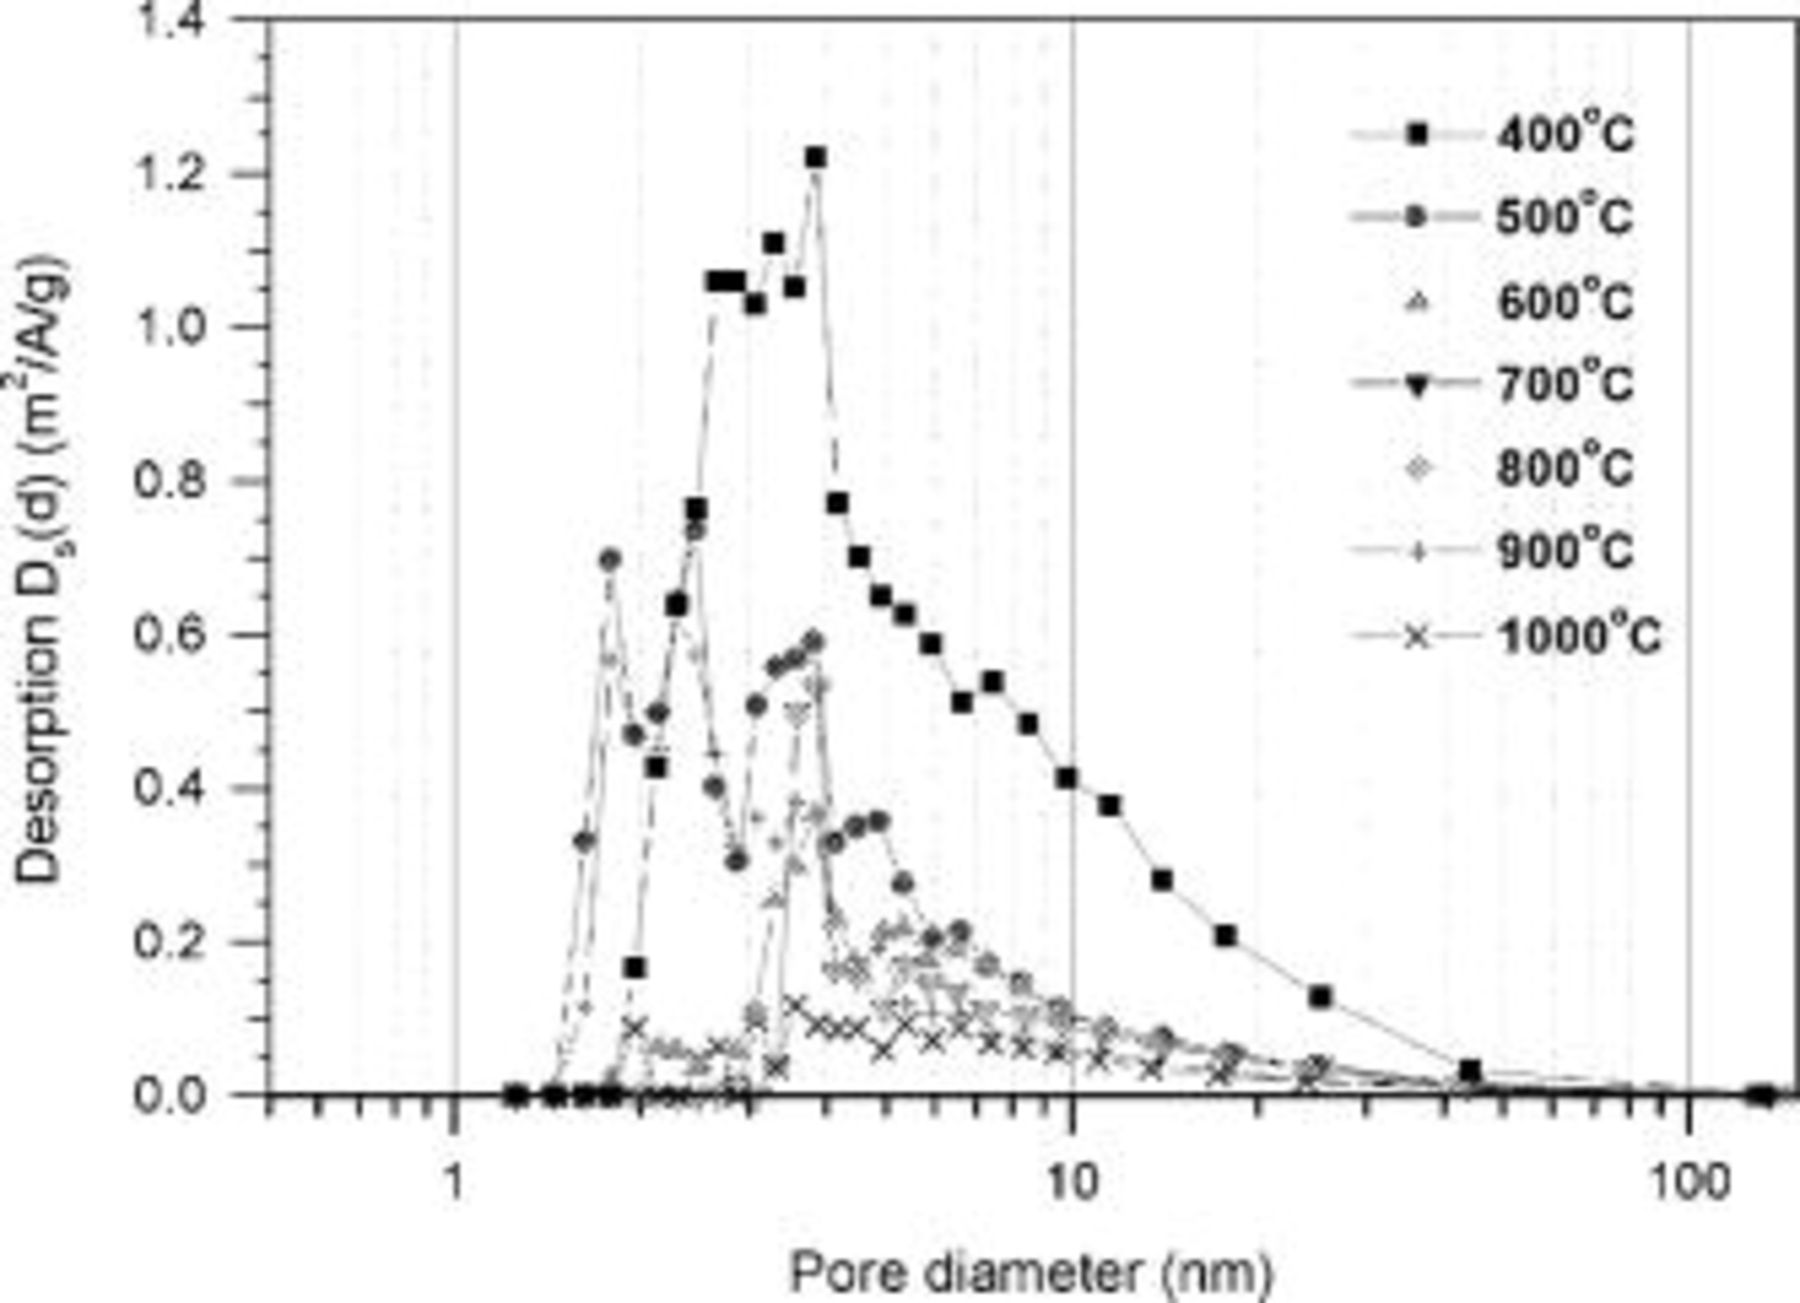
Figure 5. The pore-size distribution of nanostructured TiN powder synthesized at various temperatures in  atmosphere.
It is therefore difficult to numerically evaluate the rate limiting factors from above results. However, the low  value for TiN obtained at
  compared to those obtained at higher temperatures indicates that utilization of its surface is limited more by electronic conductivity rather than the pore size. Thus it is conceivable that at low temperature of
  , the nonstoichiometric and the nano-crystalline nature of the nitride contributed to the lower electronic conductivity which prevent the complete utilization of the high surface area of
  observed at
  .
.
The origin of the capacitance was further analyzed by ac impedance analysis on the TiN synthesized at  under different potentials (
 ,
,  , and
, and  vs
vs  ) as shown in Fig. 6a. These potentials were chosen to represent the different charge and discharge states during cycling. The equivalent circuit model representative of over potential deposition (OPD) matching that of experimental impedance spectra are shown in Fig. 6c, where the faradaic resistance and a constant phase element (CPE) associated with the pseudocapacitance has been included. The impedance of a CPE is given by a power law frequency dependence as
  , where T and φ are constants,
  , and ω is the angular frequency (
 ,
,  being the frequency).18, 23 Note that the CPE is a capacitor when
  and is related to the constant phase angle
  .18, 23 At all potentials, deviation from ideal linear vertical plot of impedance spectra has been observed. Such a nonideal impedance plot, for solid electrodes, show curvature away from the
  axis in the Nyquist plot. Figure 6b shows the phase angle vs frequency where deviation from ideal capacitor increases as the potential decreases. Because no noticeable redox peak has been observed in the CV plot, chemisorption of electrolyte
  or
or  (with traces of Cl−) onto the TiN leading to pesudocapacitance occurs at a constant rate over the potential range of
  vs
vs  where transition between
  and
and  occurs. From the circuit model requiring introduction of the CPE, accurate double layer capacitance value cannot be measured due to capacitance dispersion effect. Such an anomalous capacitance dispersion is mainly caused by irregularity, roughness, polycrystalline cation/anion adsorption (especially
  ) and fractal geometry of the TiN nanocrystallites, The circuit model, however, shows that the capacitance is mainly from the cation/anion chemisorptions on the various crystallographic facets on the nanocrystalline TiN surface. Consequently, these chemisorbed ions gradually deposit an oxide layer on the TiN surface and because the anodic current is higher than the cathodic curve in the CV plots, this is indicative of the irreversibile oxidation process.
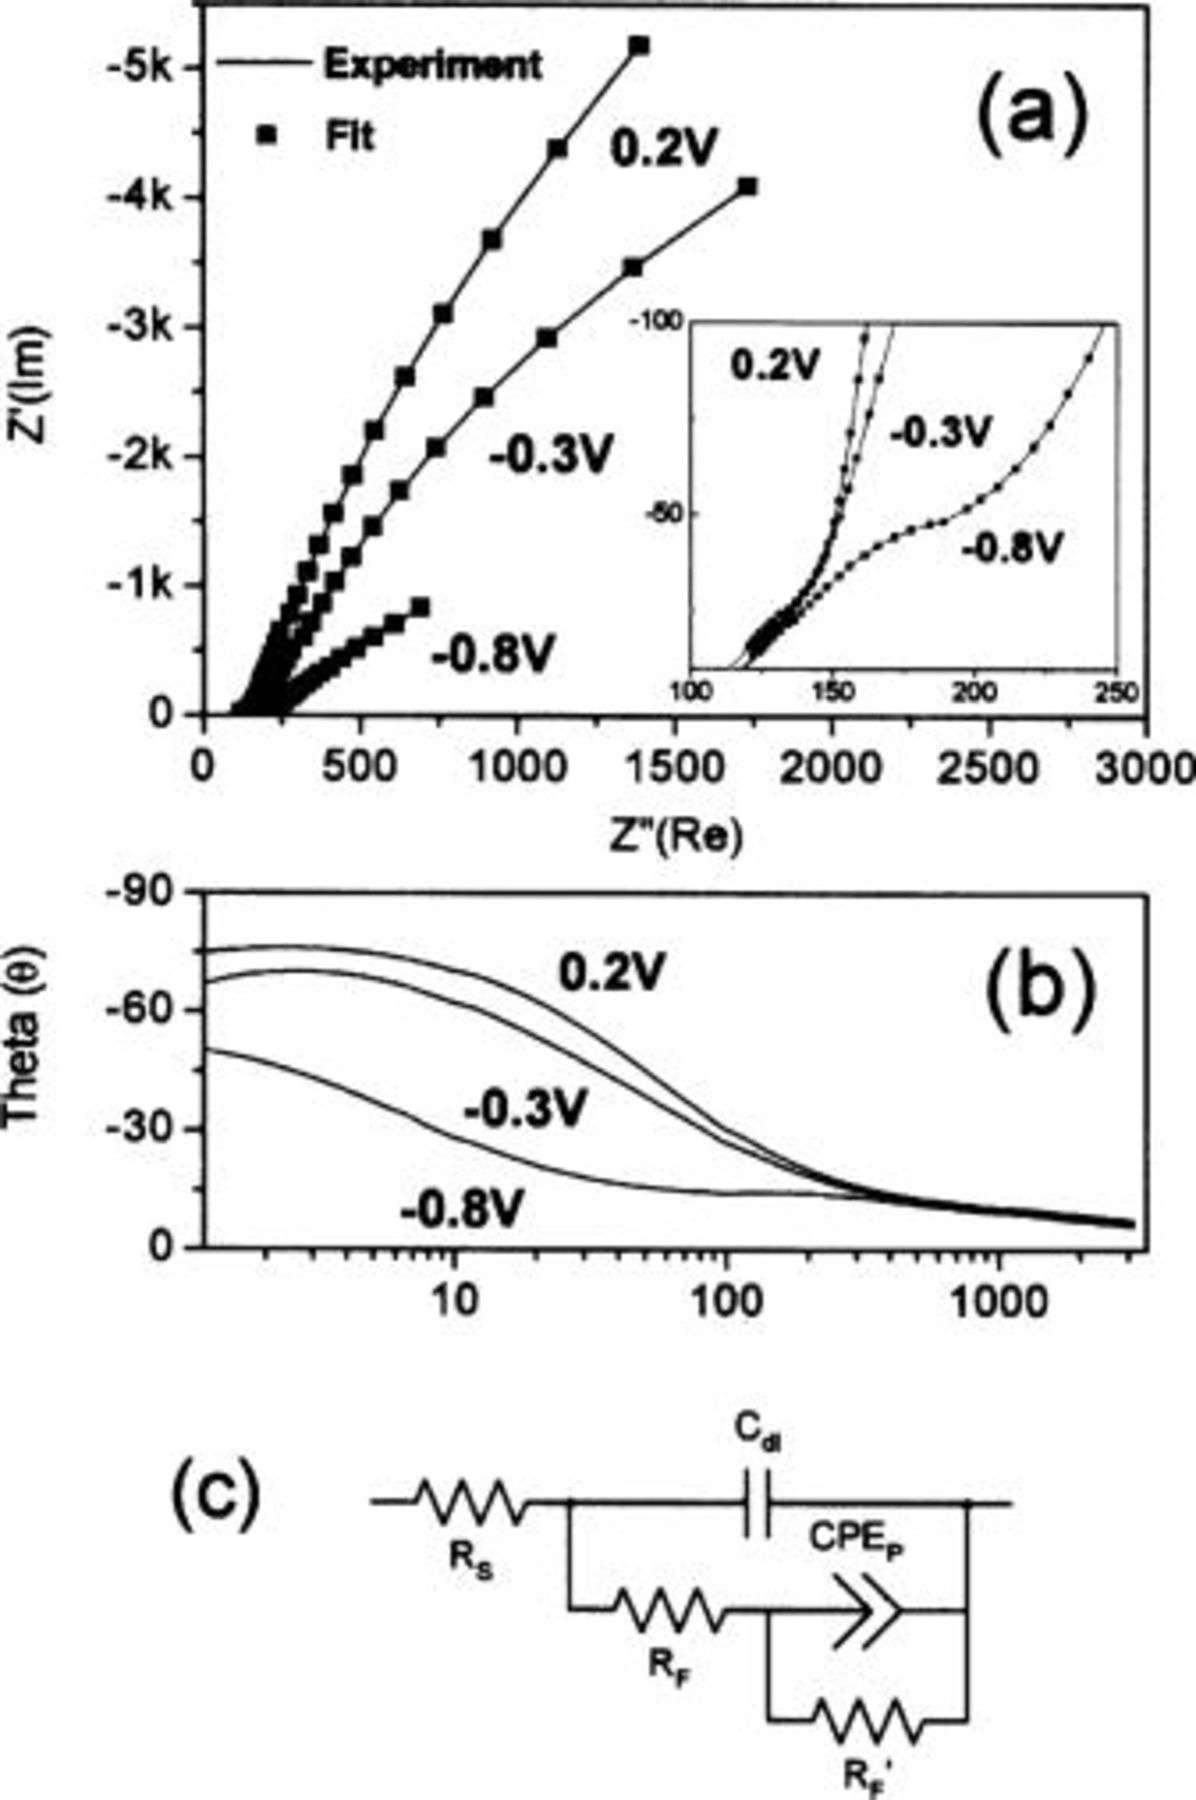
Figure 6. (a) Nyquist plot of the impedance spectra at different potentials, (b) phase vs frequency plot, and (c) equivalent circuit model used for fitting ( resistance,
  resistance,
  resistance,
  layer capacitance, and
  phase element of pesudocapacitance).
Table II lists the values of each circuit component obtained by fitting the above equivalent circuit model. The solution resistance  and faradaic resistance
  slightly increased at lower potentials indicating that reduction is more difficult as
  is the stable valence state. At
  , desorption equivalent resistance
  was lowest because most of the reduction occurs at lower potential. The φ values decreased from 0.89 to 0.77 as potential decreased from
  showing deviation from ideal capacitive characteristics.
Table II. Equivalent circuit model parameters used for fitting the experimental impendence spectra.
| Potential (V) |
 
|
 
|
 
|

| φ |
 
|
|---|---|---|---|---|---|---|
| 0.2 | 116.1 | 3.2581 | 49.97 | 2.669 | 0.89725 | 56066 |

| 122.2 | 5.1853 | 62.84 | 3.469 | 0.86736 | 21112 |

| 129 | 7.2765 | 87.23 | 21.361 | 0.77404 | 3792 |
The cycling behaviors of TiN nano-crystallites up to  at scan rate of
  are shown in Fig. 7a. The capacitance of the TiN synthesized at
  decreased by 72% after
  whereas the nitride synthesized at
  and above was stable up to
  . The slight increase in total capacitance with the cycle number for TiN synthesized at
  is probably due to an increase in the accessible surface area arising from the gradual penetration of the electrolyte into the pores with time. The change in the voltammetric behavior with the number of cycles for TiN synthesized at
  suggests that the potential scan under highly basic (pH 14)
  KOH electrolyte leads to the chemical instability of the nano-sized TiN crystallites resulting in some alterations of the surface composition. Even though TiN is known to possess good chemical resistance, the nano-sized nature of the TiN crystallites renders it unstable and prone to oxidation forming a titanate layer on the surface. The coulombic efficiency of TiN shown in Fig. 7b was approximately 86% and 98% for TiN obtained at 400° and
  , respectively. The stability of the TiN increased with heat-treatment temperature due to the larger crystallites size. However, it is most likely to decrease as the cycle number increases beyond
  . The first and 400th CVs of TiN synthesized at
  are shown in Fig. 8. The lower current from both anodic and cathodic curves after
  shows decrease in charge storage capabilities.
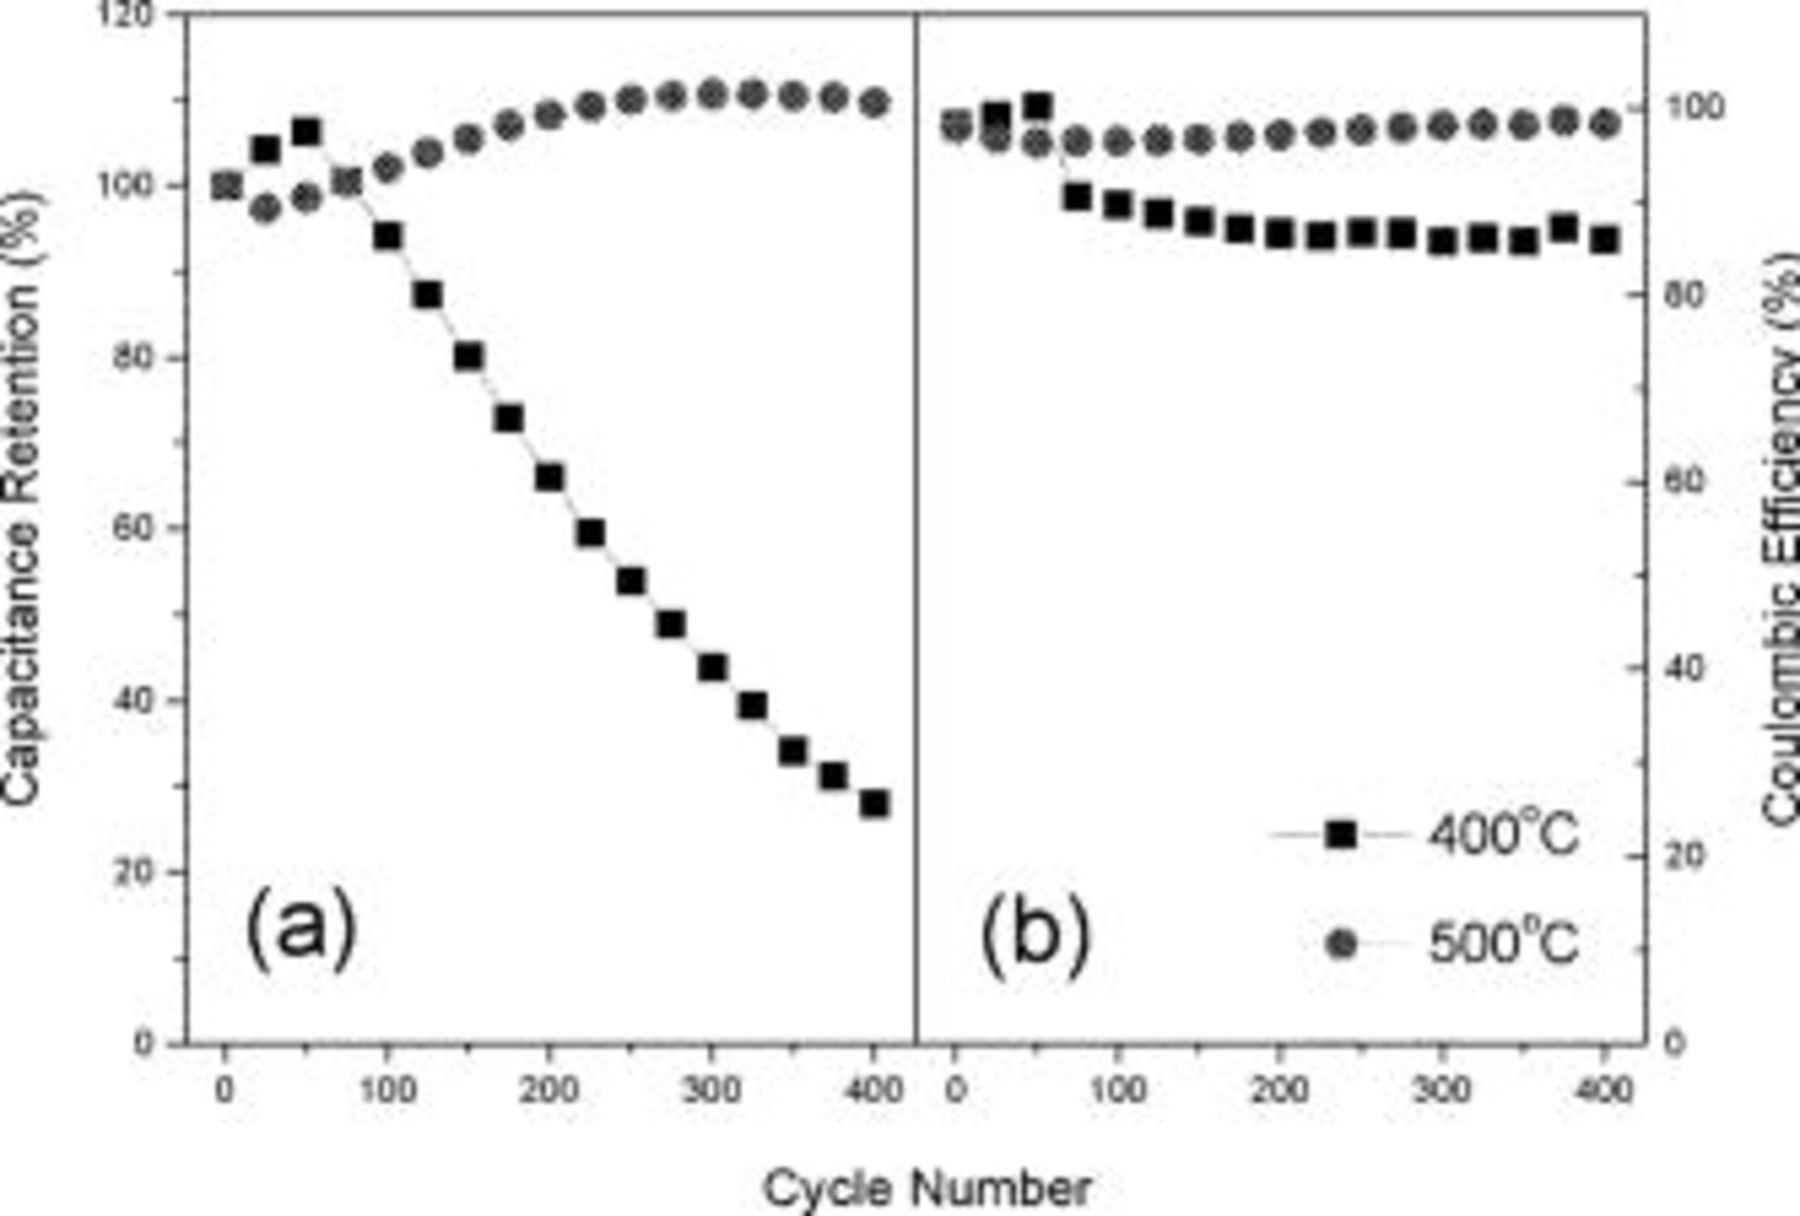
Figure 7. (a) Capacitance retention vs the cycle number and (b) columbic efficiency for TiN nano-crystallites synthesized at 400 and  scanned at
  up to
up to  .
.
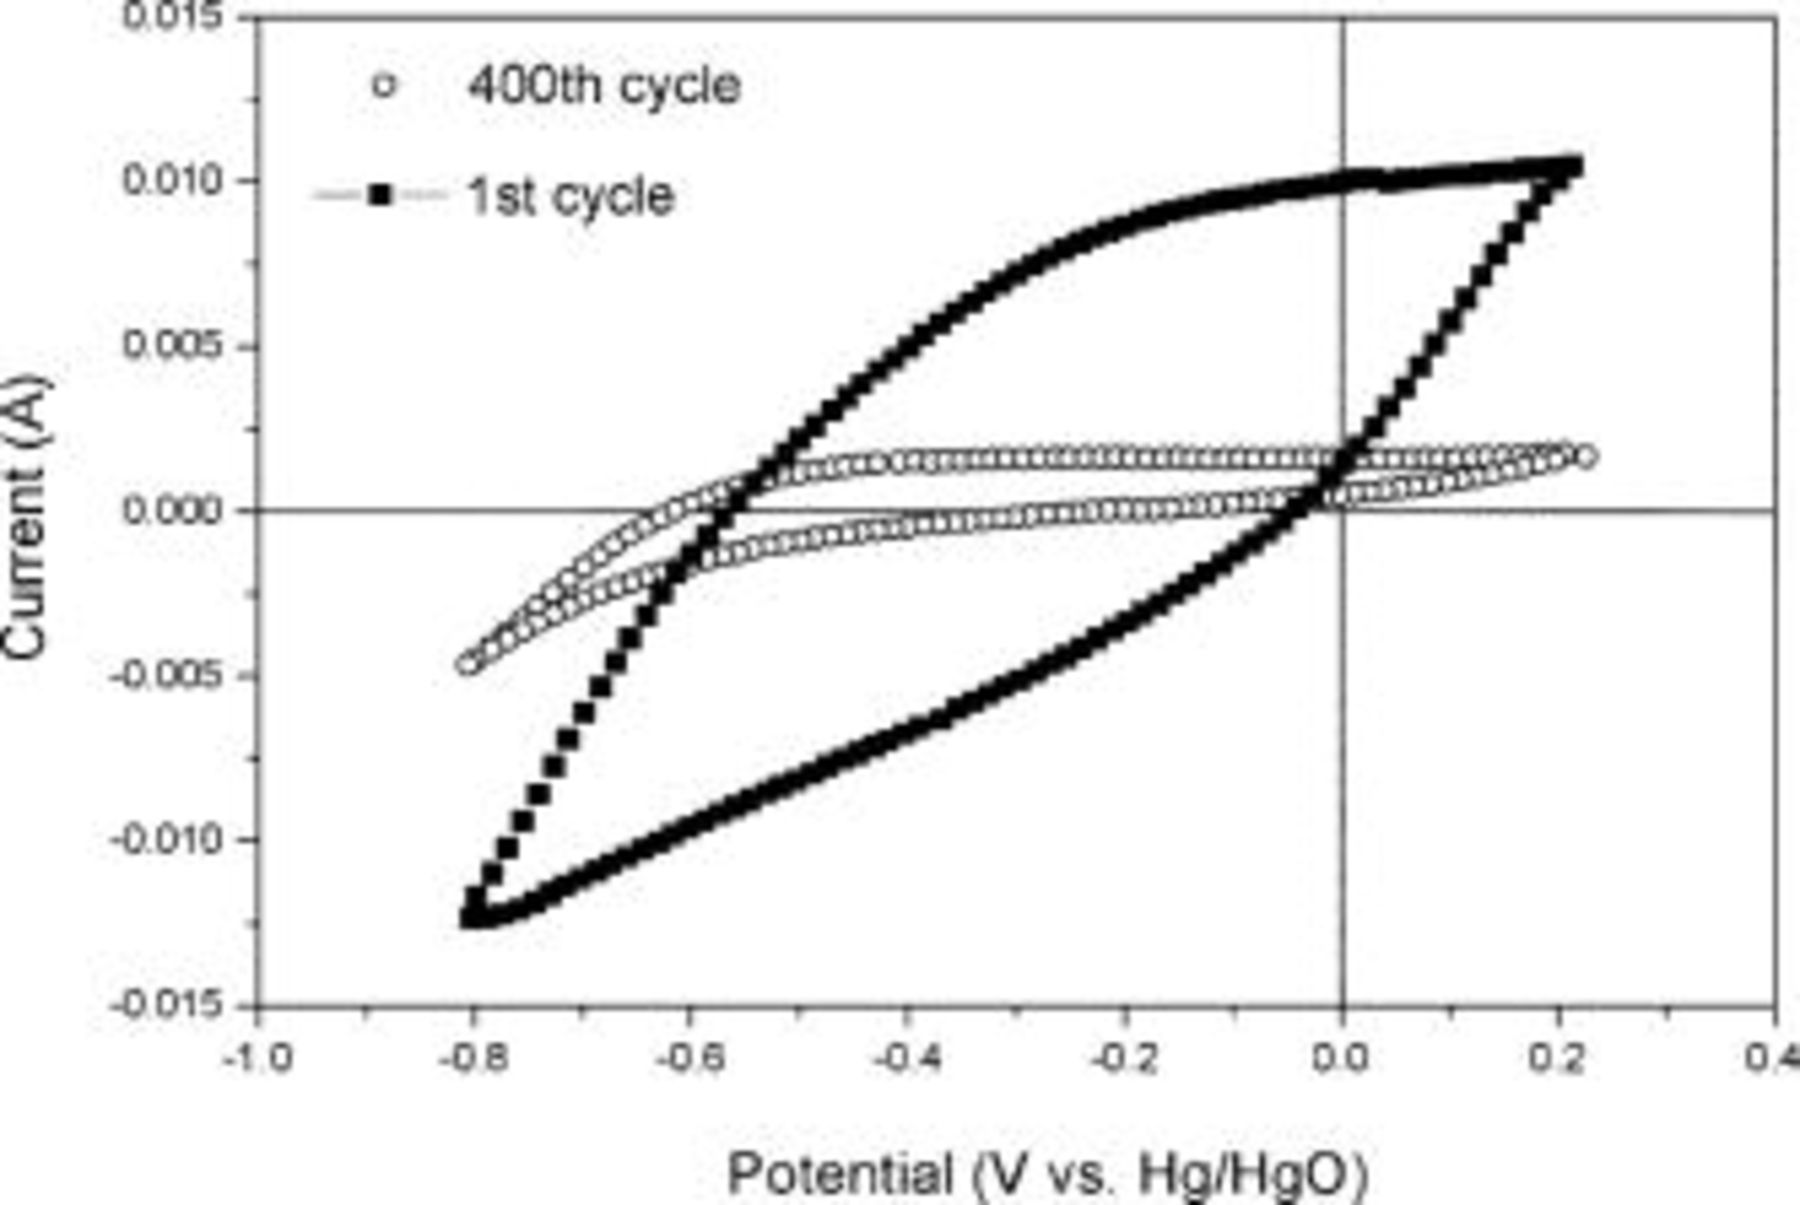
Figure 8. Comparison between first and 400th CV of TiN nano-crystallites synthesized at  scanned at
  .
.
The extent of the nitride surface oxidation appears to depend on the crystallite size and the thickness of the oxide layer, which clearly affect the capacitative performance of the TiN electrodes by decreasing the electronic conductivity as titanates are poor electronic conductors. All the oxidation mechanisms are irreversible because  is the stable ionic state in the oxide phase under pH of 14 in aqueous solution according to the Pourbaix diagram.24 This expected oxidation behavior of TiN was confirmed by FTIR analysis conducted on the TiN nanocrystallites synthesized at
  before and after electrochemical cycling for
  as shown in Fig. 9. As shown in Fig. 9, no apparent peak related to Ti-O, Ti-O-N or organic adduct has been observed for the TiN powder obtained at
  before cycling. However, the cycled TiN has strong broad Ti-O and Ti-O-Ti peaks at 498 and
  , respectively, indicating that the TiN surface has undergone oxidation although no significant OH related peaks have been observed.25 The broad peaks indicate the amorphous nature of the
  phase. In addition, the electronic conductivity of TiN obtained at
  after electrochemical cycling decreased to
  from the initial value of
  . This suggests that the oxidation of the TiN surface must have progressed via oxygen replacing some of the excess nitrogen or chlorine impurity. The surface oxidation of TiN in
  KOH electrolyte has been studied by Windisch et al.26 In their study, hydrated potassium titanate
  formed after soaking or electrochemical cycling in KOH solution, which was different from the case of Ti metal where
  forms on the surface. One of their proposed mechanisms other then direct oxidation observed for Ti metal for the case of TiN is26


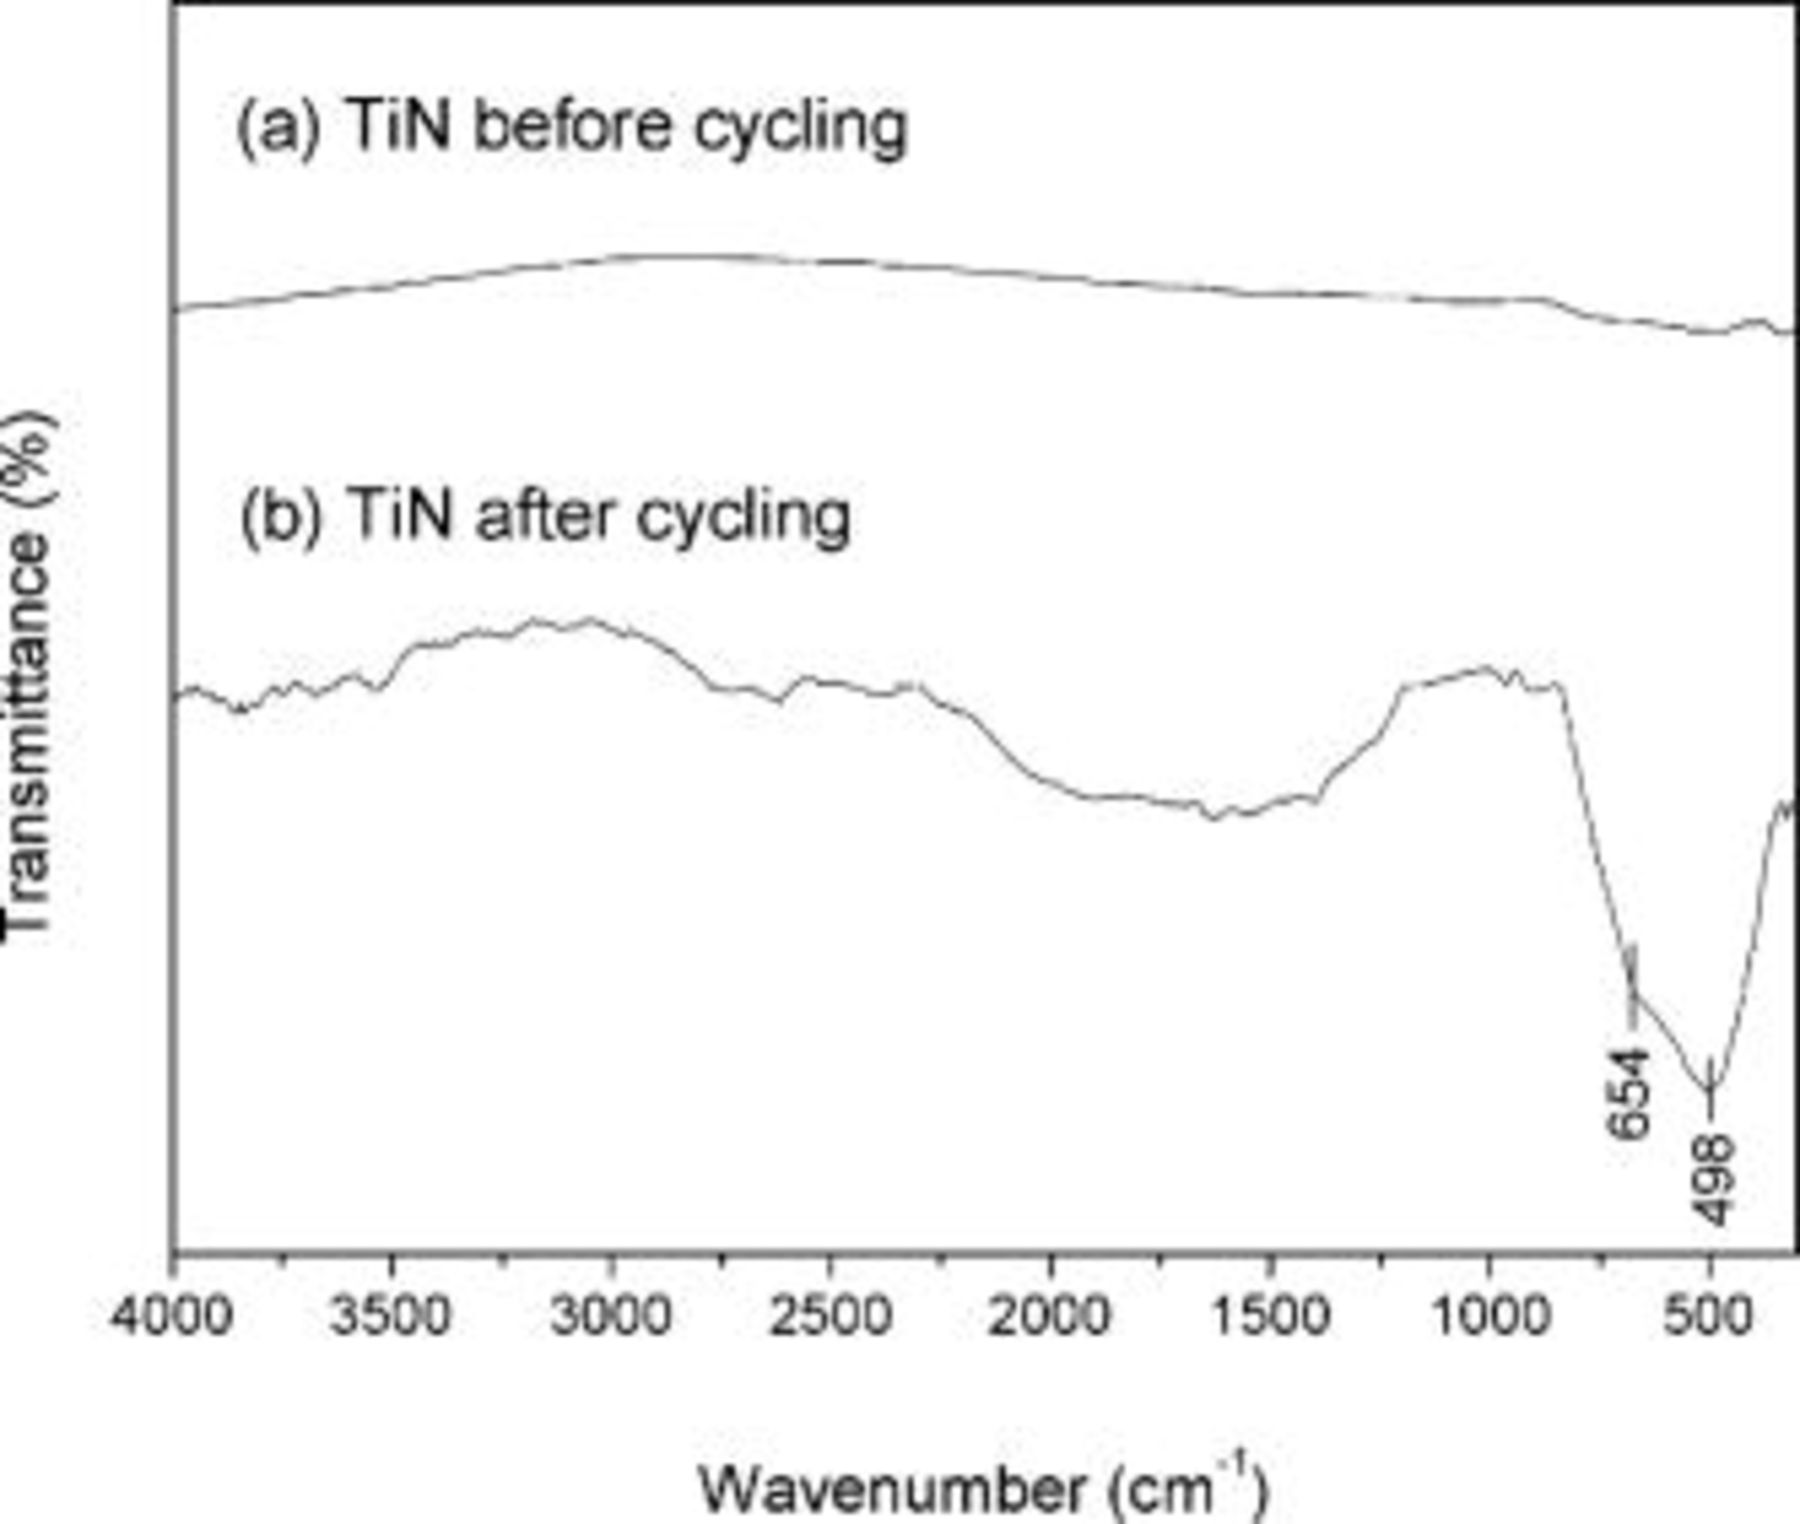
Figure 9. The FTIR spectra of TiN nano-crystallites synthesized at  (a) before and (b) after electrochemically cycled up to
  .
.
From these reactions, it can be inferred that the anodic curve is associated with gradual oxidation involving  ions whereas cathodic curve is coupled with chemisorption of
  ions.
ions.
Such a result is also comparable to the nanocrystalline VN synthesized under similar conditions where the specific capacitance significantly increases even with lower surface area created through redox activity provided by the partially oxidized vanadium oxide layer on the surface.11, 12 Despite these results, the use of a TiN-based electrode for supercapacitors need not be ruled out, particularly as the chemical stability of the nitride can be improved by combining with other transition metals such as vanadium to form a solid solution of ternary nitrides, which could change the potential window stability and increase the specific capacitance through the multivalent surface redox activity provided by the vanadium oxide. Furthermore, use of a nonaqueous electrolyte could enhance the stability even further.
Conclusion
Nanocrystalline TiN powders were prepared by a two-step ammonolysis of titanium chloride. After heat-treating the as-prepared powder obtained from the liquid-gas reaction, the titanium nitride was formed at a temperature as low as  under anhydrous
  atmosphere. The nitride synthesized at the lowest temperature
  exhibited the highest specific surface area
  and smallest crystallite size
  . The highest specific capacitance of
  was obtained for the TiN synthesized at
  scanned at
  . The capacitance decreased with an increase in the synthesis temperature and scan rates. The irreversible oxidation leading to low electronic conductivity and instability of the nitride at high pH (14) are attributed to the poor rate response and cyclability. The nitride obtained at higher temperature displays better cyclability although the specific capacitance is reduced due to the lower specific surface area.
Acknowledgment
This work was supported in part by the National Science Foundation (grant CTS-0000563).
Carnegie Mellon University assisted in meeting the publication costs of this article.