Abstract
Li(metal)–sulfur (Li–S) systems are among the rechargeable batteries of the highest possible energy density due to the high capacity of both electrodes. The surface chemistry developed on Li electrodes in electrolyte solutions for Li–S batteries was rigorously studied using Fourier transform infrared and X-ray photoelectron spectroscopies. A special methodology was developed for handling the highly reactive Li samples. It was possible to analyze the contribution of solvents such as 1-3 dioxolane, the electrolyte  , polysulfide
  , and
, and  additives to protective surface films that are formed on the Li electrodes. The role of
  as a critical component whose presence in solutions prevents a shuttle mechanism that limits the capacity of the sulfur electrodes is discussed and explained herein.
Export citation and abstract BibTeX RIS
Li–sulfur batteries have attracted the attention of the electrochemistry community for more than 3 decades ever since the onset of interest in research and development of rechargeable Li batteries.1, 2 Sulfur can undergo reversible reduction to  , which means a theoretical capacity of about
  , which is among the highest values possible for cathodes to rechargeable Li batteries. The lithiation of sulfur is a multistage process in which several intermediate
  species are formed around two main redox potentials: between 2.4 and
  (25% of capacity) and between 2.1 and
  (75% of capacity) vs
  .3 Due to the relatively low redox potential of sulfur cathodes (compared to most of the commonly used Li insertion cathodes based on lithiated transition-metal oxides), it is important to use Li metal anodes in Li–S cells to obtain the maximal voltage with these systems. The use of Li anode forces the use of electrolyte solutions based on ethereal solvents due to their acceptable low reactivity toward lithium metal.4 The use of ethereal solvents, whose anodic stability is limited (
 vs
vs  ),5 is indeed possible in Li–S systems, thanks to the relatively low redox potential of sulfur electrodes. Over the years, we can see continuous work on Li–S battery systems6–12 and on Li batteries in which the cathodes comprise sulfur-containing polymers (mostly with S–S groups).13–16 The use of Li metal as an anode limits the cycle life of any rechargeable Li (metal) battery system due to dendrite formation upon charging (Li deposition), which may cause short circuiting of the battery and loss of active mass due to the electrical disconnection of Li dendrites from the bulk. The best solvent for rechargeable Li (metal) batteries was 1-3 dioxolane (DOL).17 The surface chemistry of Li metal in DOL solutions is complicated. DOL is reduced to several ROLi species and oligomers with -OLi edge groups.18–20 The latter species add some flexibility to the protective, passivating surface films formed on Li in DOL solutions that probably enables their accommodation to the morphological changes in Li during the course of charge–discharge cycling (Li deposition/dissolution processes).
In the past, there were some efforts to commercialize rechargeable Li (metal) batteries, such as  (based indeed on DOL solutions).21, 22 However, rechargeable Li (metal) cells based on Li insertion cathodes could not compete with Li-ion battery technology, mostly due to limitation in cycle life and the need for long charging time, and thus were abandoned. The main factor that limited the performance of
  cells was the continuous reaction of lithium with the electrolyte solutions, which led to their detrimental depletion (no dendrite formation), especially upon fast charging conditions.23
Similar limitations are also expected for Li–S cells. However, their extremely high capacity definitely justifies the commercialization of rechargeable Li (metal)–sulfur batteries although their cycle life should be shorter compared to that of Li-ion batteries. A critical problem of Li–S cells is the shuttle mechanism that limits the full rechargeability of the sulfur cathodes: Full oxidation of polysulfide species such as  to sulfur upon charging is avoided due to cyclic processes in which these moieties are reduced by lithium to species such as
  . Hence, the charging process involves the oxidation of
  to
to  as the main and dominant reaction, which means a realization of no more than 50–75% of the full capacity.24 It was recently found that the use of
  as an additive to the electrolyte solutions in Li–S batteries prevents this detrimental shuttle mechanism.25
This work is aimed at understanding the surface chemistry of Li electrodes in various electrolyte solutions for Li–S batteries that contain the components DOL,  (LiTFSI) as the electrolyte,
  , and
, and  . A special methodology was developed for the preparation and study of the highly sensitive Li samples. Fourier transform infrared (FTIR) and X-ray photoelectron spectroscopy (XPS) were used as the spectroscopic tools for this work.
Experimental
Li battery grade DOL (Ferro, Tomiyama), 
 , and
, and  (Aldrich) were used as received. Li rods for the spectral studies,
  thick, were obtained from Chemetall Foote Corporation (Kings Mountain, NC, USA).
  was prepared by adding stoichiometric amounts of lithium (Chemetall Foote Corp.,
  thick lithium foil,
  ) and sulfur (Alfa Aesar, sublimed sulfur powder
  mesh, 99.5% assay) in dioxolane (Ferro,
  ) to produce
 in this solvent. The mixture was tightly capped and stirred vigorously for
  at
at  at which time all the Li and S reacted. Elemental analysis by inductively coupled plasma confirmed the stoichiometry and quantity of polysulfides. The usual concentrations of the various components in the DOL solutions used herein were
  LiTFSI,
 , and
, and 
 (mol/L). The water contamination level was measured by a Metrohm Inc. (Denmark) KF titrator.
Electrochemical measurements (chronopotentiometry, voltammetry, and electrical impedance spectroscopy) were carried out using multichannel computerized equipment from Maccor, Arbin, and Solartron (FRA model 1255 plus multichannel potentiostat/galvanostat system, model 1470). Impedance spectra of Li electrodes were measured within the  range, with a voltage amplitude of
  around
 . The behavior of sulfur electrodes in DOL solutions containing
  and in
  free solutions was measured extensively by Sion Power Inc. in Li–S cells prepared therein, as demonstrated previously.24, 25 The cathodes were prepared by coating a mixture of 73 parts of elemental sulfur (available from Aldrich Chemical Company, Milwaukee, WI), 16 parts of a conductive carbon pigment Printex XE-2 (a trademark for a carbon pigment available from Degussa Corporation, Akron, OH), 6 parts of a second conductive pigment, Ketjenblack (available from Akzo Nobel, The Netherlands), and 5 parts of polyethylene powder (grade T1000 available from Baker Hughes, Barnsdall, OK) dispersed in isopropanol onto a
  thick conductive carbon-coated aluminum foil substrate. After drying, the coated cathode active layer thickness was about
  . The anodes were lithium metal (
 Li,
Li,  thick foil from Chemetall Foote Corp., Kings Mountain, NC). The porous separator used was
  Setela (a trademark for a polyolefin separator available from Tonen Chemical Corporation, Tokyo, Japan and also available from Mobil Chemical Company, Films Division, Pittsford, NY). The above components were assembled in a layered structure of cathode/separator/anode, which was folded in half making a bicell, and placed in a foil pouch with liquid electrolyte (approximately
  ). The electrolyte solutions used were mixtures of 10 parts of lithium bis(trifluoromethane sulfonyl) imide, (lithium imide available from 3M Corporation, St. Paul, MN), 2 parts lithium nitrate (available from Aldrich Chemical Company, Milwaukee, WI), and 4 parts lithium hexasulfide (synthesized as described above) in DOL (available from Ferro Corporation, Independence, OH), with water content of less than
  . The bicells had an electrode area of about
  . The sulfur content in the cell was
  , equivalent to
  capacity
  . After sealing the cell in a foil pouch, it was stored for
  and then tested. Discharge–charge cycling of the cell was performed at
  , respectively (corresponding to current densities of 0.42 and
  ), with a discharge cutoff at a voltage of
  and a charge cutoff at
  .
.
Impedance measurements of Li metal foil (Chemetall Foote Corp.,  thick) electrodes were carried out using two electrode parallel-plate cells (Li working and counter electrodes), in which Li foils were pressed by stainless steel bars into polypropylene frameworks that included inlets for solutions. For FTIR measurements we used a Magna 860 spectrometer from Nicolet, placed in a glove box, under
  and
and  free atmosphere that was maintained using condensed air treated by a regular Balston Inc. (England) system. Surface spectra from Li electrodes were measured ex situ in the reflectance mode using an UpIR: Upward looking diffuse reflectance accessory from Pike Technologies. The oxidation state of the surface species of the Li metal electrodes was analyzed by XPS. Electron spectra were obtained with a Kratos Axis-HS spectrometer (England) (residual gas pressure of
  ) using monochromatized Al
  radiation
  and a hemispherical analyzer. High resolution spectra were recorded with an X-ray generator operating at
  and
and  and a pass energy of
  (
( steps were applied for its acquisition). The X-ray beam may change the chemical nature of the surface, especially in the present study, in which the substrates were highly reactive Li metal surfaces. Thereby, measurements of each sample were always repeated three times. For all the samples studied, no significant changes in the spectra were detected at the operating condition chosen. Hence, the data presented herein indeed reflect the surface species formed on lithium in the solutions studied in this work. During measurements, the vacuum in the analysis chamber was
  . Binding energies (BEs) were corrected with respect to the BE value of the C 1s peak at
  . The Shirley background, the mixed Gaussian/Lorentzian approach, was used for the fitting of the high resolution O 1s, N 1s, C 1s, S 2p, and Li 1s peaks by the Vision 2 software (Kratos). We developed a special methodology for the preparation of Li electrodes in solutions and their further handling without exposing them to atmospheric contaminants. We developed a special methodology for the preparation and handling the highly reactive and sensitive Li surfaces so the spectral information measured herein should be fully authentic and reliable. All preparations of the Li electrodes were carried out in a home-made glove box that could be fully evacuated, whose atmosphere was treated by
  ,
,  , and an organic species removal system from M. Braun Inc. (the same system as made for regular glove boxes of this company). Before each single step of Li sample preparation, the glove box was evacuated to
  and was refilled by ultrapure argon (Oxygen Center, Israel). More details about such an operation with evacuable glove boxes were provided elsewhere.26
Shiny and reflective disks ( wide and
  thick) were freshly prepared in solutions by the knife and the cell (filled with solution) presented in Fig. 1a. After the appropriate storage in solution, the sample was washed three times with pure DOL and dried. It was confirmed by FTIR spectroscopy that this treatment removed traces of soluble Li salts from the surface. The surface films formed on it in solution were analyzed by FTIR spectroscopy and XPS. For the FTIR measurements, the Li disks were hermetically closed in the cell presented in Fig. 1b, pressed toward its KBr window. This cell was introduced into the FTIR spectrometer glove box and placed facing downward on the reflectance accessory. For XPS measurements, we used the home-made transfer system presented in Fig. 1c, which contained a magnetic manipulator (attached to a sample holder), a gate valve, and a flange that fit both the entry port of the XPS spectrometer and a similar entry port built in the above special glove box. Hence, the Li samples were exposed fresh to solutions, then to highly pure argon atmosphere, and finally to the high vacuum of the XPS spectrometer
  . To obtain reliable and reproducible spectra for these ultrasensitive samples, the glove box needed to be evacuated and refilled with ultrapure argon before each step of sample preparation, and each single sample had to be handled separately.
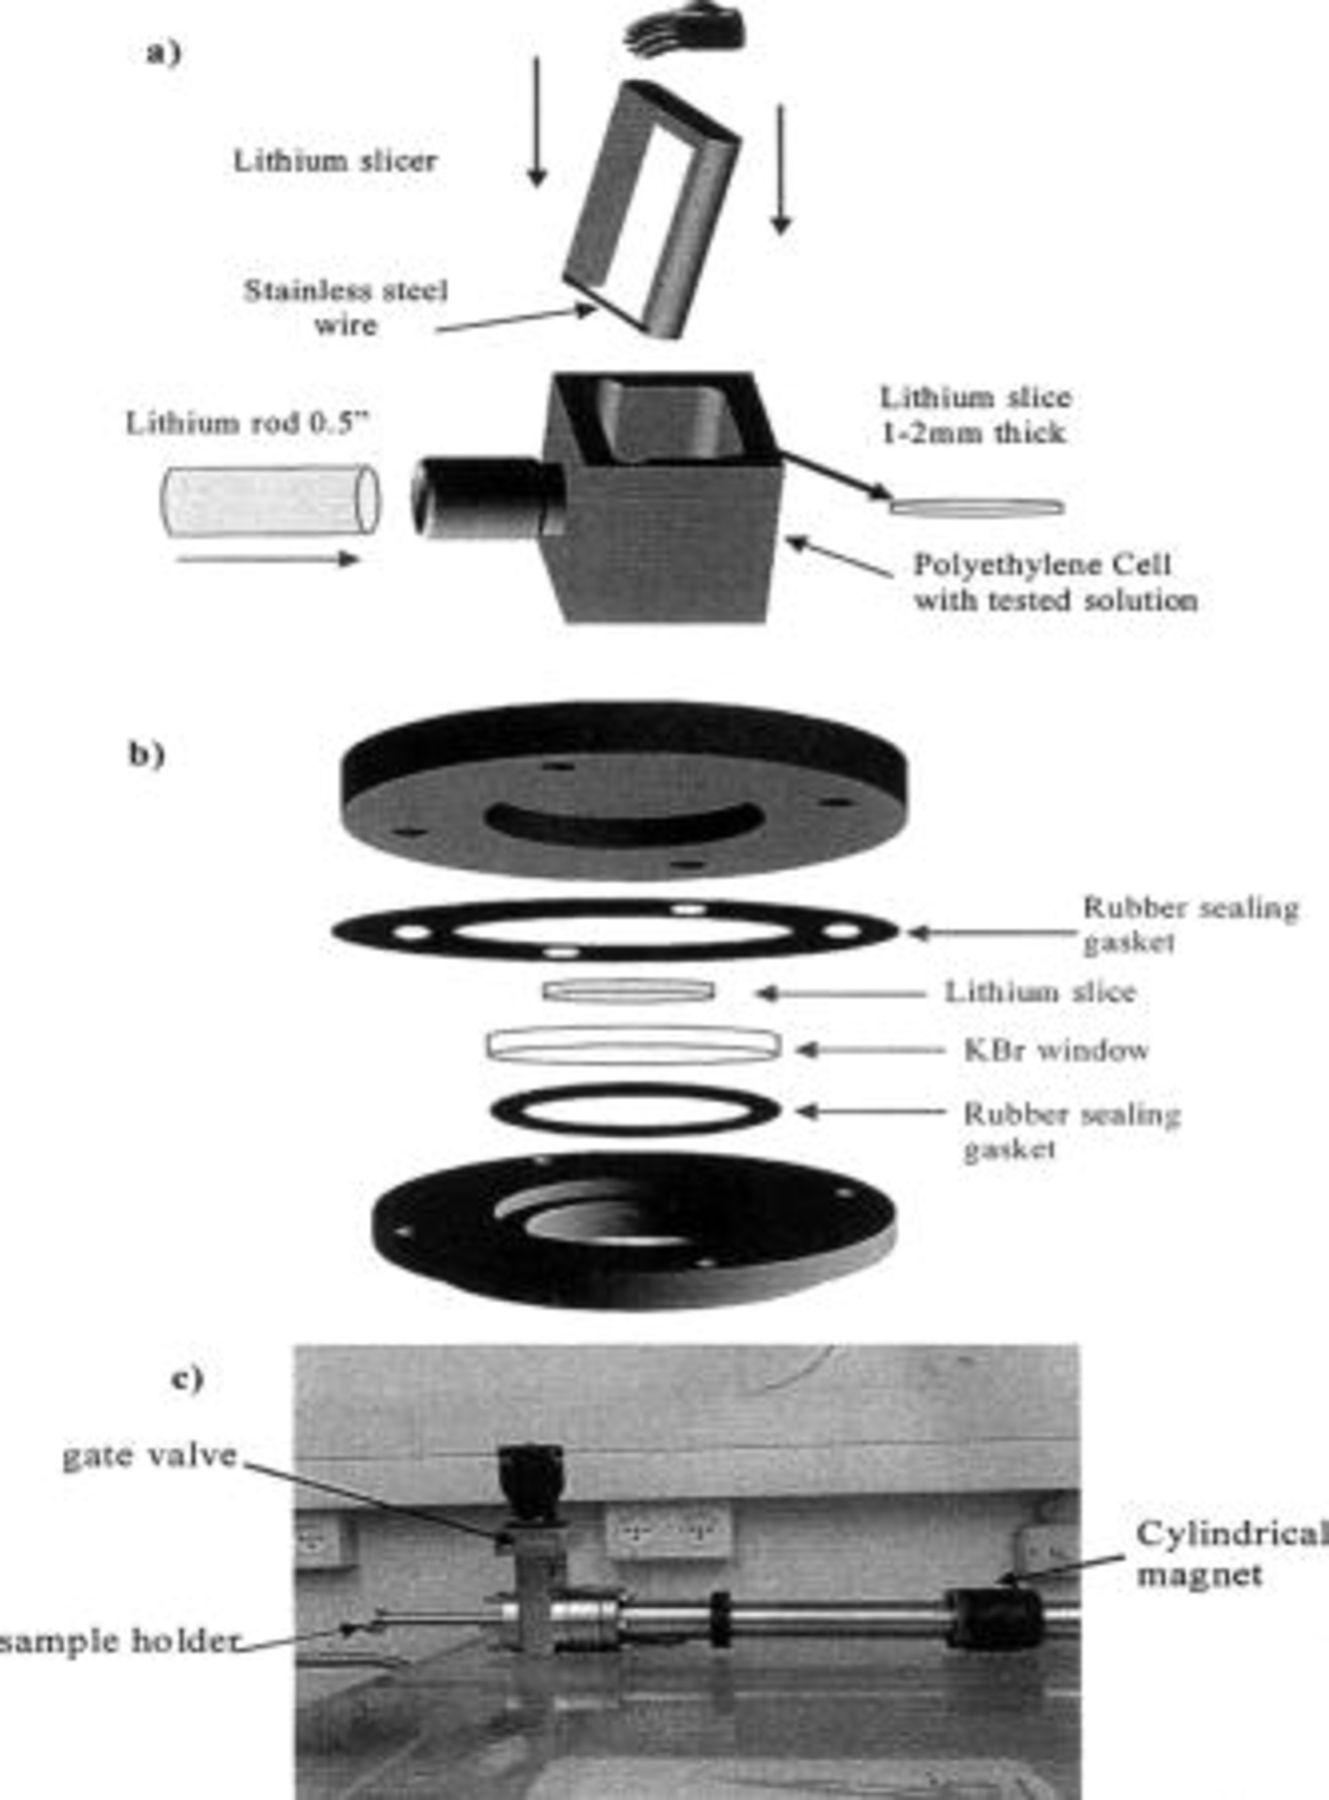
Figure 1. Presentation of special arrangements for Li sample preparation and their spectral studies. (a) The apparatus for Li sample preparation in solutions. (b) The cell for FTIR spectroscopy (measured using diffuse reflectance attachment (see Experimental section). (c) The transfer system that takes Li samples from the special glove box to the XPS spectrometer.
Results and Discussion
On the effect of  in solutions on the behavior of Li–S cells

A detailed description and discussion of the characteristics and performance of sulfur electrodes in the above-mentioned electrolyte solutions is beyond the scope of this paper. However, it is important to demonstrate herein the important effect of the presence of  in solutions, on the behavior of sulfur electrodes in these systems, because a main goal of the present study was to discover the effect of this additive on the surface chemistry of Li electrodes.
Figure 2 shows the typical, steady-state, potential profiles of two Li–sulfur cells (prepared by Sion Power Inc.) in galvanostatic cycling. The electrolyte solution in one of the cells comprised DOL and 
 while the solution in the other cell contained in addition to these components
 . Upon cycling, polysulfides are formed and introduced to the electrolyte solution. The profile of the sulfur electrode in the cell which contained
  clearly shows a high reversible capacity around
  and the two expected plateaus at 2.4–2.3 and
  (vs Li counter electrode) related roughly to the following processes


In fact Eq. 1, 2 is a very simplified description of the complicated electrochemical behavior of these electrodes (see Ref. 24 for a detailed discussion). Note, however, that when the solution in these Li–S cells contains  the cells can be fully charged to reach the high capacity of sulfur electrodes.
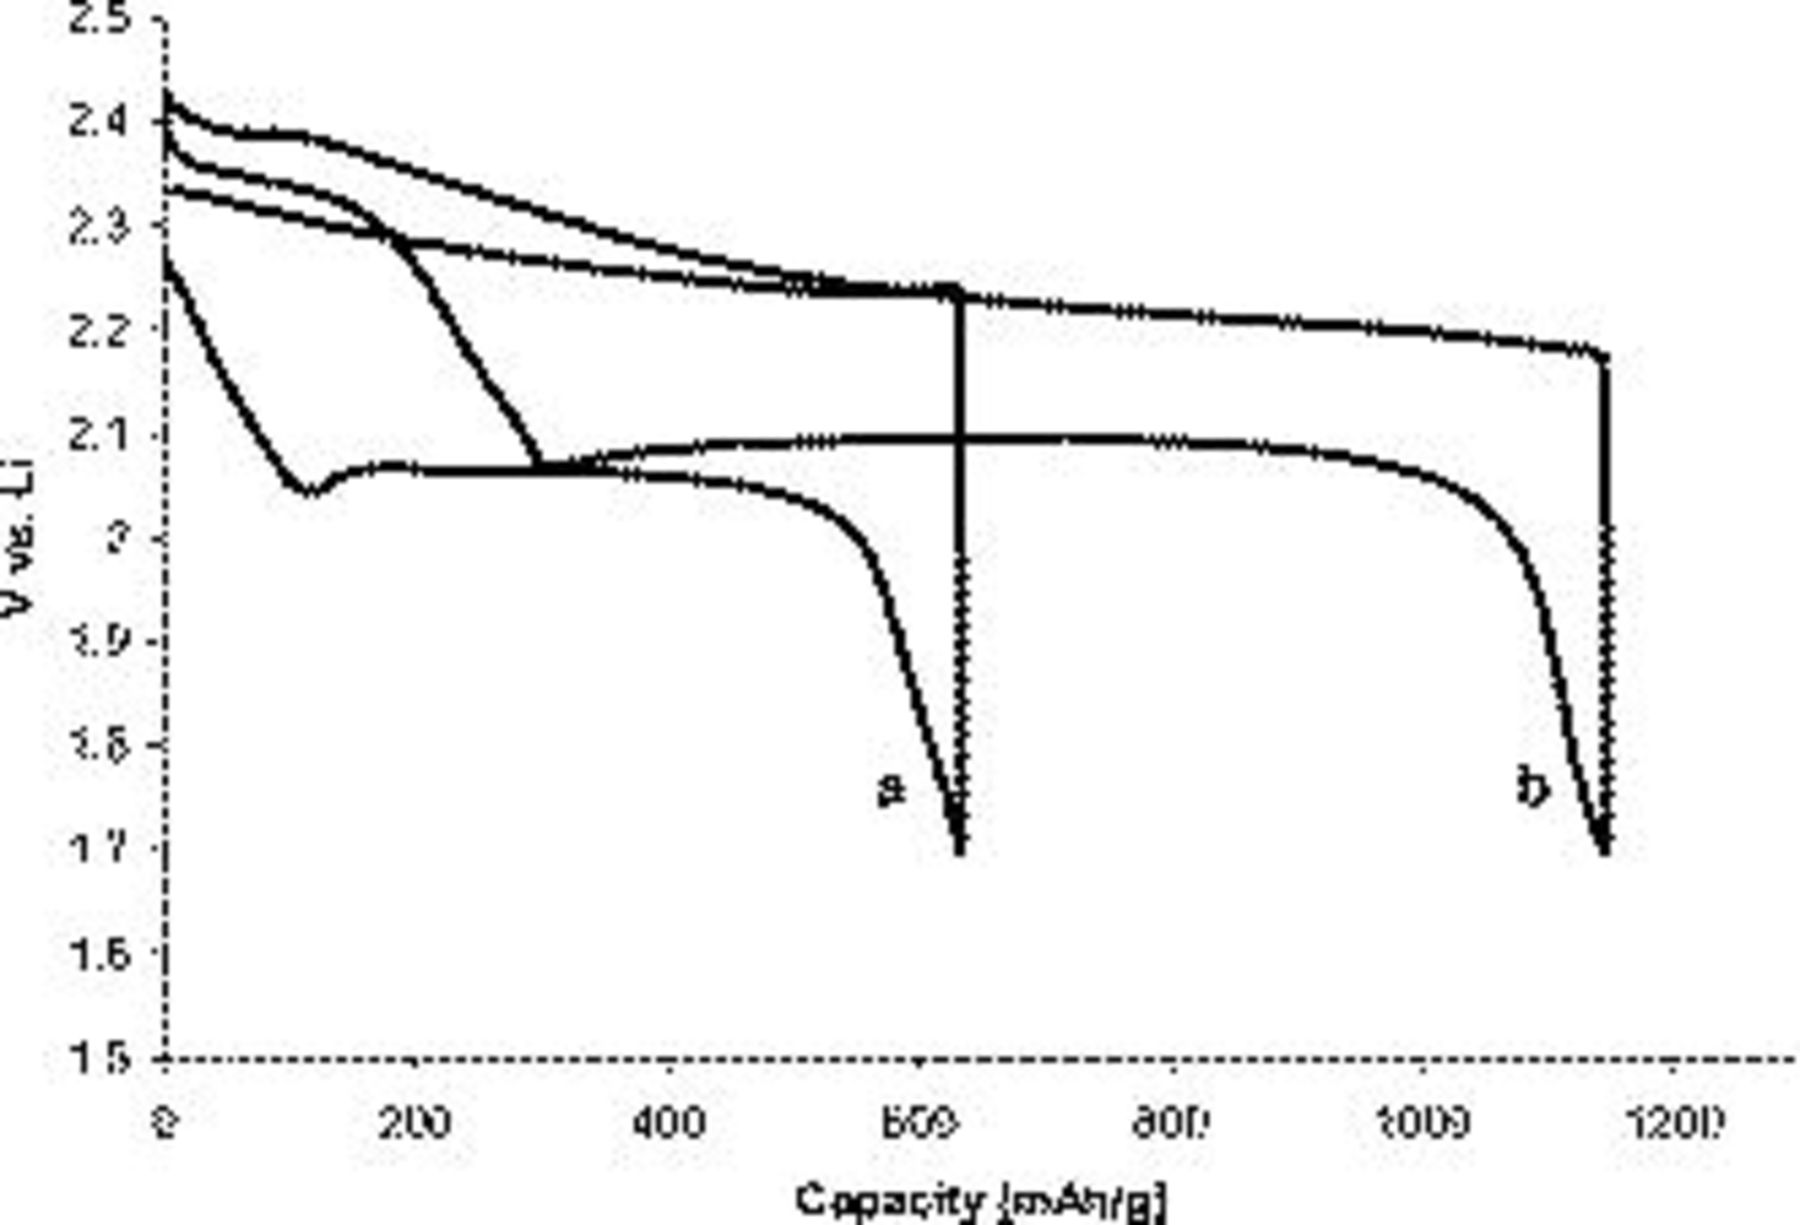
Figure 2. Typical voltage profiles of Li–S cells (pouch cells) comprising a Li metal anode, a sulfur cathode (composite electrodes containing the active material, carbon, and current collector), and a DOL-based solution at  : (a) DOL and
 and (b) DOL and

 . See details on preparations and cycling conditions in the Experimental section.
In the absence of  in solutions, the process around
  could not be reached upon charging, and the maximal capacity measured in the present study could not exceed
  due to the shuttle mechanism discussed in Ref. 24, 25. Voltammetric studies of the above electrolyte solutions with noble-metal electrodes do not show any pronounced redox activity at potentials above
  , in which sulfur electrodes are electrochemically active. Hence, the main impact of this additive belongs to the Li side.
Impedance spectroscopic studies
The effect of the presence of  in solutions on the Li surface chemistry was well demonstrated by impedance spectroscopic measurements of Li electrodes in these solutions. Figure 3 presents impedance spectra (Nyquist plots) of Li electrodes prepared and stored for
  in
in  LiTFSI,

 ,
, 

 , and
, and  LiTFSI/0.31
 solutions as indicated. The solution contained less than
  of trace water (measured by KF titration). The specific conductivities of these solutions at
  were measured separately (Pt electrodes) and were 1.3, 1.9, 2.04, and
  , respectively. The spectra in Fig. 3 comprise flat semicircles (note the difference in the scales of the
  and
and  axes) at the high medium frequencies as their main feature and a straight or slightly curved line at the low frequencies. The
  values in these spectra, measured at the highest frequencies (i.e., the extrapolated intercept of the high frequency semicircle with the
  axis), may reflect the solution impedance. Hence, the ratios between the high frequency
  values measured with different solutions should be similar to the reciprocal of the ratios between the specific conductivity values of the solutions. This is indeed the case for DOL/LiTFSI and
  solutions. However, when the solution contains both polysulfide (PS) and
  the picture is complicated because of the surface reactions of Li in these solutions (as discussed later), which may considerably change the concentration of conductive species in them. Initially (soon after preparation in solutions), the impedance of the Li electrodes in solutions is much smaller and it gradually increases upon storage, until reaching steady-state values after about
  of storage in these solutions (very similar to what is presented herein). Impedance spectra of Li electrodes were studied rigorously in the past.27, 28 The big, flat semicircle is attributed to multilayer surface films that are formed in solutions on the active metal due to its continuous reactions with solution species. These reactions stop when the surface films become thick enough, to avoid electron transfer through them, from the Li to the solution species. The multilayer structure of the surface films is due to an expected gradient in the oxidation states of the surface species: Species with the lowest oxidation state should be formed close to the Li side (e.g.,
  , LiH,
  ,
,  , and species with Li–C bonds), while surface species close to the solution side may possess higher oxidation states (e.g., species with Li alkoxy groups, carbonyl groups, and
  bonds). All ionic compounds of lithium (e.g., Li oxide, hydroxide, carbonate, halide, and organic Li salts) can conduct Li ions under an electrical field. Thereby, the surface films formed on lithium in most of the polar-aprotic solutions are in fact Li-ion conductors. They may protect Li electrodes from corrosion by blocking electron transfer but allow transport of Li ions by migration under electrical field, thus behaving as solid electrolyte interphase (SEI) between the active metal and the solution (the so-called SEI model29). The flat semicircles that characterize impedance spectra of Li electrodes in most of polar-aprotic solutions can be modeled by parallel
  circuits in series (the "Voigt-type" equivalent circuit analog, R-resistor and C-capacitor connected in parallel) and reflect in fact the resistance(s) for Li-ion migration via the multilayer surface films, coupled with the film capacitance, as previously discussed.27 The low frequency part of these spectra, which resemble "Warburg-type" elements, probably relates to the Li-ion diffusion processes at the porous surface film-solution side.27 The spectra in Fig. 3 reflect a very strong effect of the solution composition on the electrodes' impedance. It is spectacular in Fig. 3 that the presence of either
  or
or  in DOL/LiTFSI solutions remarkably decreases the impedance of the Li electrodes in solutions. However, the presence of
  in solutions containing
  leads to a higher Li electrode impedance, compared to what is measured in the
  -free (
 -containing) solutions. This can be naturally interpreted as a pronounced effect of additives such as
  and
and  on the Li surface chemistry, which leads to the formation of surface films with different transport properties (for Li ions). A quantitative study of these impedance spectra is beyond the scope of this work, especially in light of the fact that in many cases, impedance spectroscopy cannot provide unambiguous information when used as a main analytical tool for electrochemical systems. Hence, it was interesting to investigate the possible effects of the presence of
  and
and  in solutions on the surface chemistry of Li electrodes by spectroscopic means that may provide specific information (FTIR and XPS).
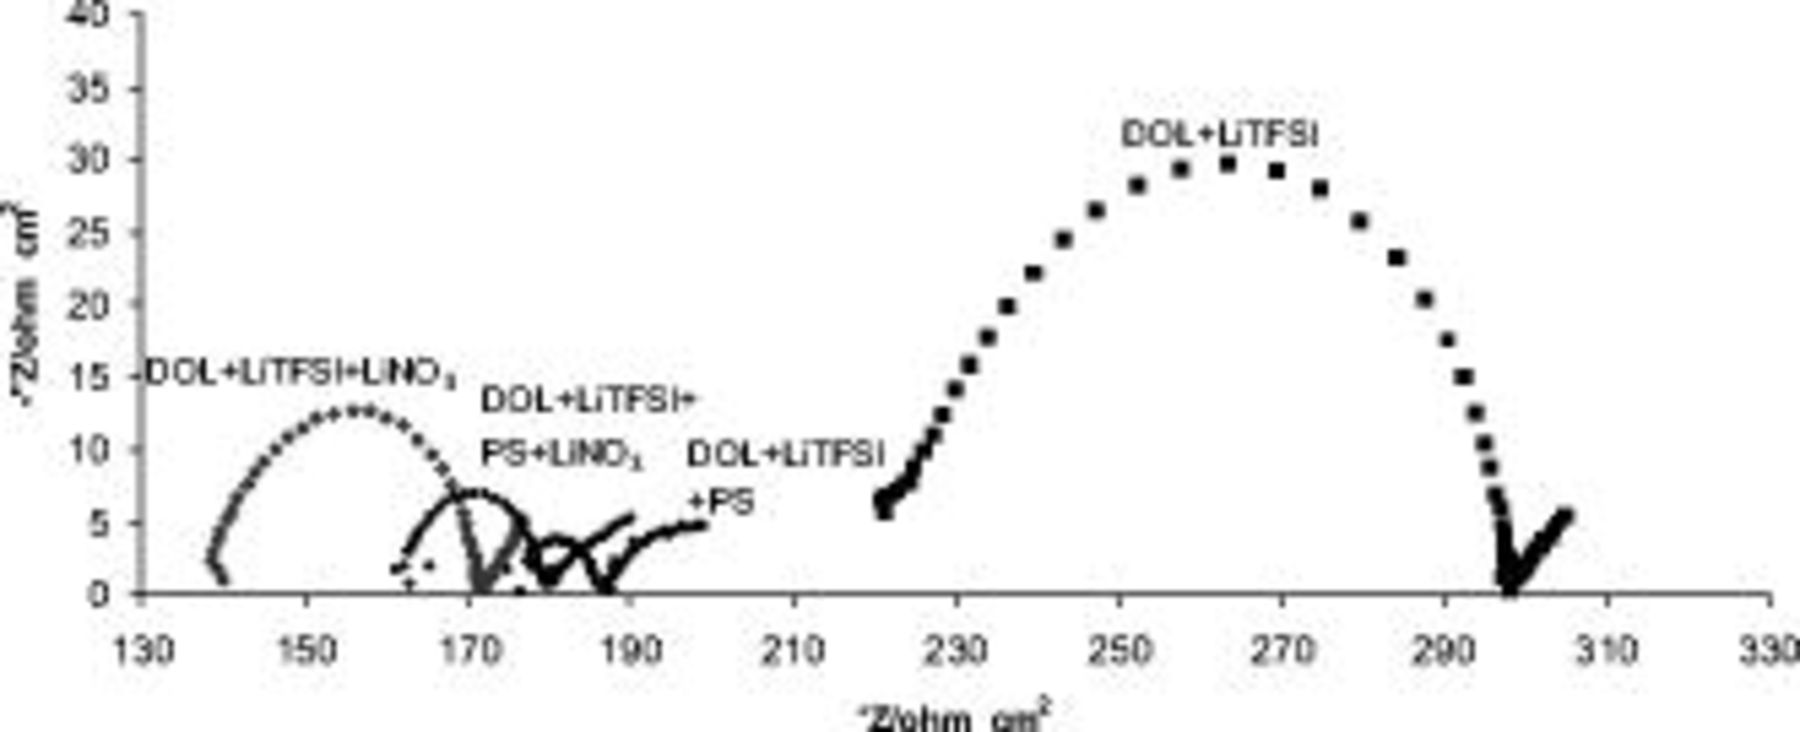
Figure 3. Impedance spectra of Li electrodes prepared fresh in  LiTFSI,

 ,
, 

 , and
, and  LiTFSI/0.31
 solutions as indicated, measured after
  of storage open circuit voltage presented as Nyquist plots.
FTIR measurements
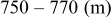
Li electrodes were prepared and stored in various solutions during different periods of time (from minutes to weeks). Several sets of experiments of sample preparation, storage, and spectral measurements were carried out, and several dozens FTIR spectra were collected. Fortunately, the results obtained converged nicely and hence, for the sake of brevity, we show herein only a few representative spectra. As a first stage, surface films formed on lithium in pure DOL and DOL/LiTFSI were studied. Figure 4 presents FTIR spectra measured from Li surfaces prepared in DOL and DOL/LiTFSI solutions and were kept in contact with them for  . Spectra measured from Li surfaces, after being stored for days to weeks in these solutions, provided very similar information. Hence, the main surface species in these systems are formed instantaneously as the fresh active metal reaches contact with these solution species. Peak assignments for the FTIR spectra obtained in these studies are summarized in Tables I, II and III and also marked near some of the main IR peaks. The peak assignments are based on a couple of main sources30, 31 and our previous work.18–23, 32 The
  peaks (
 ) in both spectra of Fig. 4 reflect the inevitable presence of trace water in solutions, and hence, some surface LiOH and ROH are probably formed. The spectrum related to Li–DOL reflects the formation of ROLi,
  , and poly-DOL oligomers with -OLi edge groups (which are the sticky fingers that attach these moieties to the Li surface). The other spectrum in Fig. 4, related to Li/DOL/LiTFSI, reflects the strong impact of TFSI anion reduction in the surface films formed on lithium (relevant peak assignments appear on the spectra and in Table II). These spectral studies are in line with our previous studies which also included in situ FTIR measurements.32 The main surface reactions of Li in these DOL solutions are described in Scheme 1. The spectra of Fig. 4 demonstrate that the surface chemistry of lithium in DOL/LiTFSI solutions is dominated by reduction in the anion species to form the various possible surface species described in Scheme 1.

Figure 4. FTIR spectra of Li surfaces (measured ex situ) prepared and stored for  in pure DOL and in a DOL/LiTFSI
  solution [(a) and (b), respectively]. Peak assignments are presented on their spectra.
Table I. Spectral bands and peak assignments of spectra obtained from Li electrodes prepared in DOL. Peak locations are in  units. Peak assignments are based on Ref. 18–23, 30, 31.
| Li surface prepared and stored in DOL for a few minutes | Li surface prepared and stored in DOL for hours/days | Peak assignments |
|---|---|---|

|

|

|

|

|

|

|
 Li formate Li formate | |

|
 Li formate Li formate | |
| 1500–1450 | Li carbonate | |
|

|
 
|

|

|
 various bending modes various bending modes |

|

|

|

|

|

|

| Li carbonate And various bending modes | |

| ||
| Li format (bending) | |

|

|
Table II. Major peaks related to LiTFSI reduction products appearing in spectra obtained from Li electrodes and noble metals at low potentials treated in  –DOL solutions. (Peak assignments are also presented. This table provides data on all the main IR peaks related to LiTFSI and the reduction products of TFSI anion in the presence of Li ions.)30–32
Reference compound [The neat salt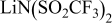 (TFSI)] (TFSI)] | Li metal electrode prepared in DOL/ LiTFSI solutions | Peak assignments |
|---|---|---|
| 1330 | 1350 |
 (sulfone amide) (sulfone amide) |
| 1245 | 1300–1320 |
 (sulfone) (sulfone) |
| 1231 | ||
| 1196 |

| |
| 1140 | 1189 |
 (sulfone) (sulfone) |
| 1139 | ||
| 1062 |

| |
| 1062 |

| |
| δ (bending modes) | ||
| 795 | 886 |
 , C–S, S–O, etc. , C–S, S–O, etc. |
| 745 | 786 | |
| 647 |

| |
| 604 | 650 | |
| 576–513 |

|
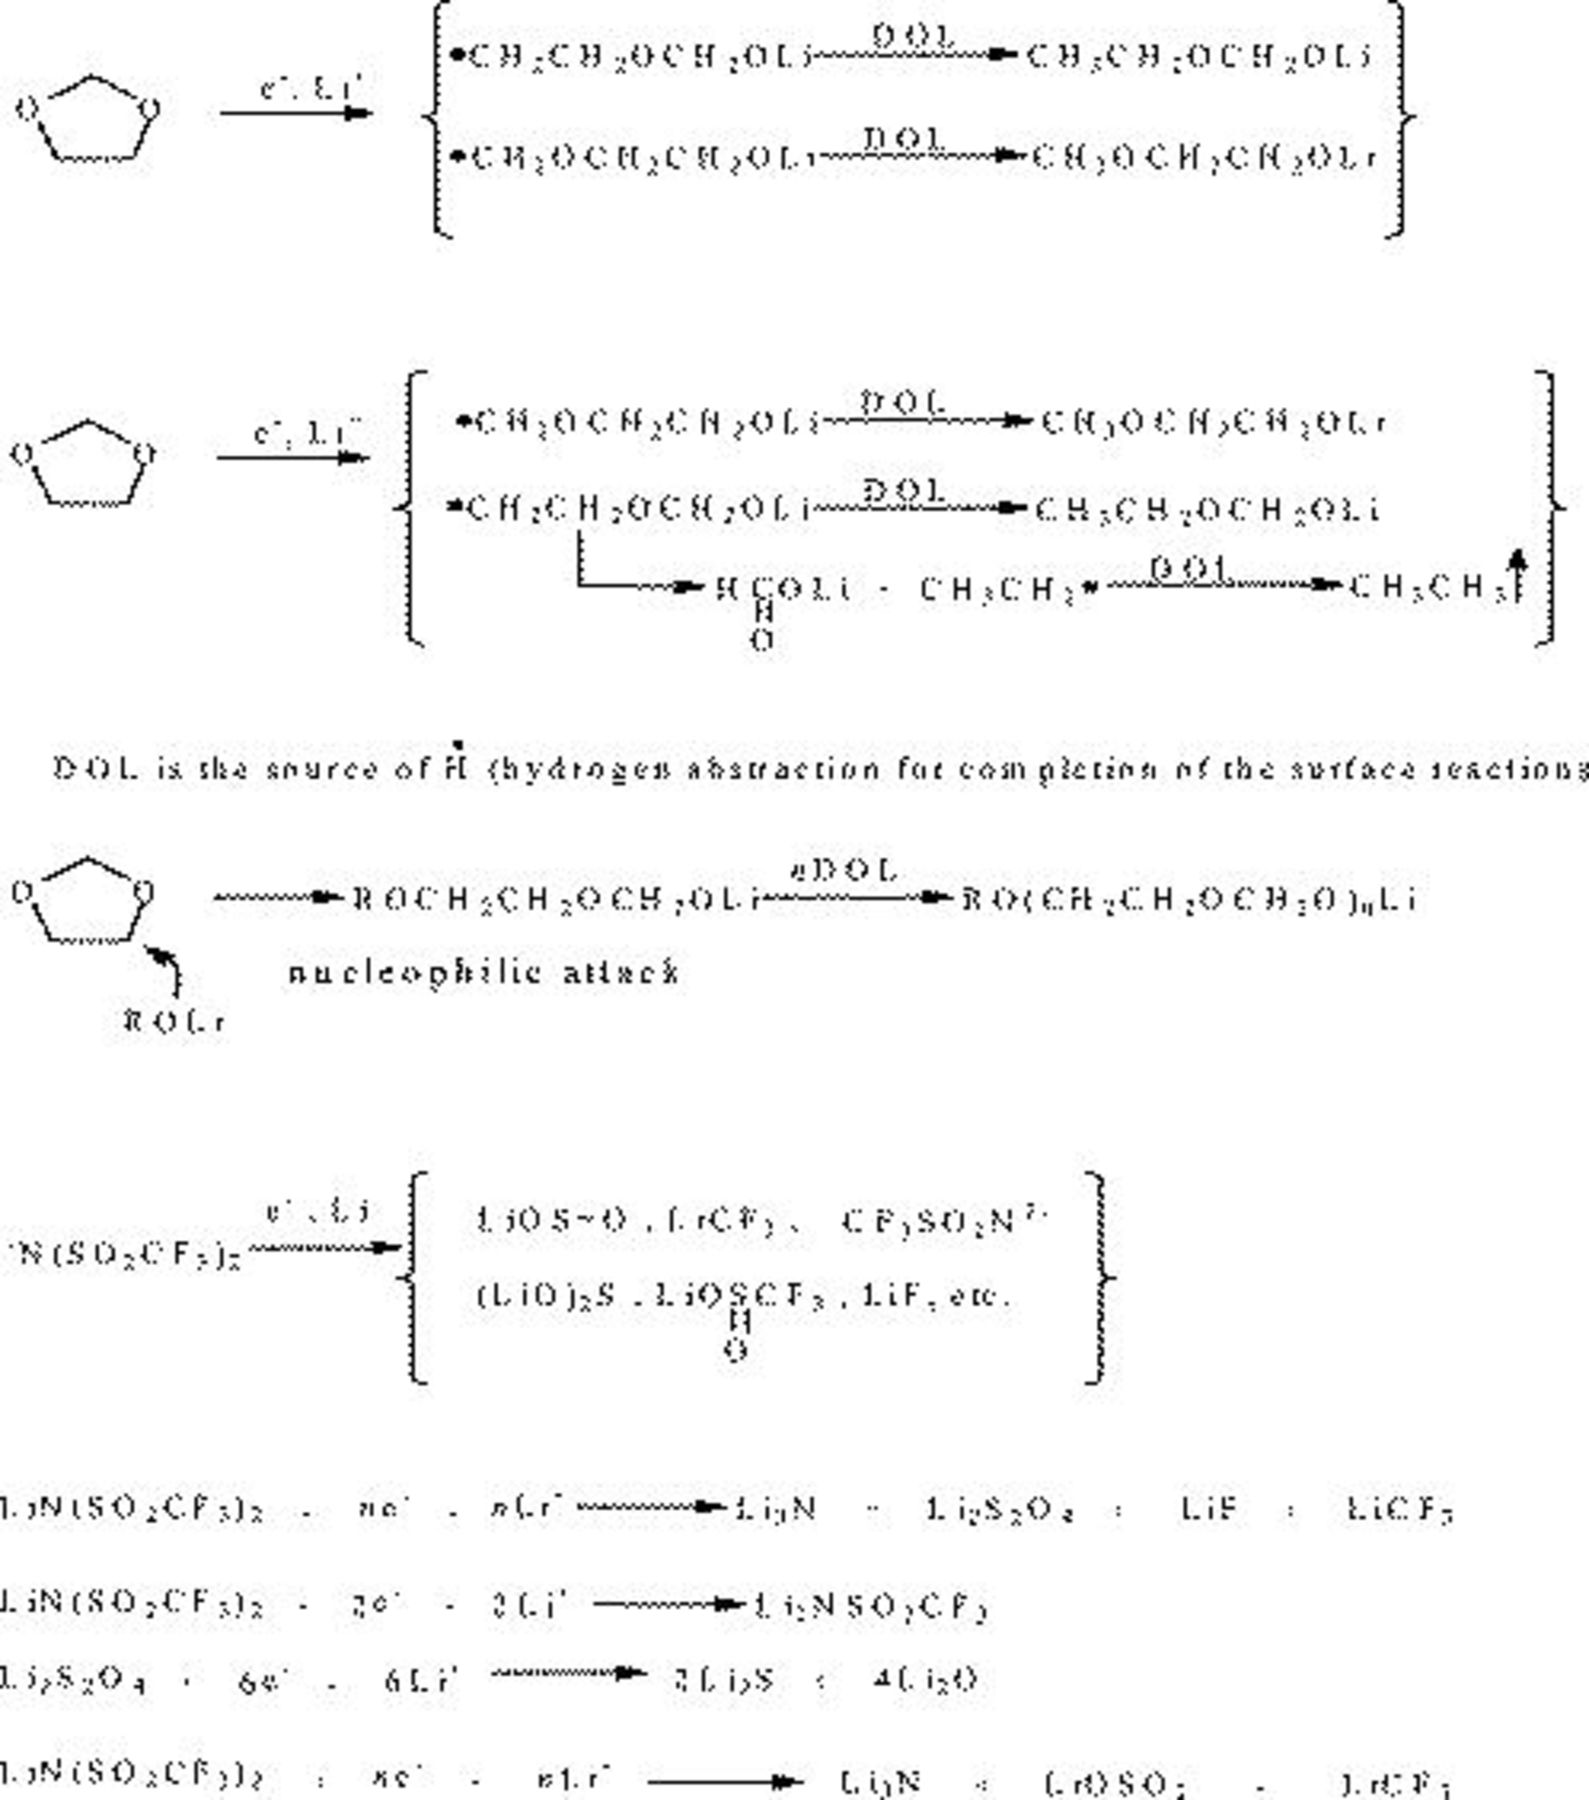
Figure 5. Lithium surface reactions in DOL-LiTFSI solutions.
Figure 6 shows FTIR spectra measured from Li surfaces prepared and stored for  in DOL, DOL/LiTFSI
  .
. 
 , and
, and 
 solutions, Fig. 5a, 5b, 5c and 5d, respectively (see peak assignments on the spectra in Table III). All the spectra in Fig. 6 are rich in overlapping IR peaks and bands, which makes the exact identification of all the surface species formed on each system impossible. The spectra reflect the obvious formation of ROLi and
  species due to DOL reduction; species containing C–F, S–O, and
  bonds due to
  reduction; possible surface
  and
and  due to
  reduction; and possible
  species due to
  reduction. In fact, the exact identification of all these surface species is not important for the present work. The importance of these surface studies lies in the clear trends that they reflect, as explained below.
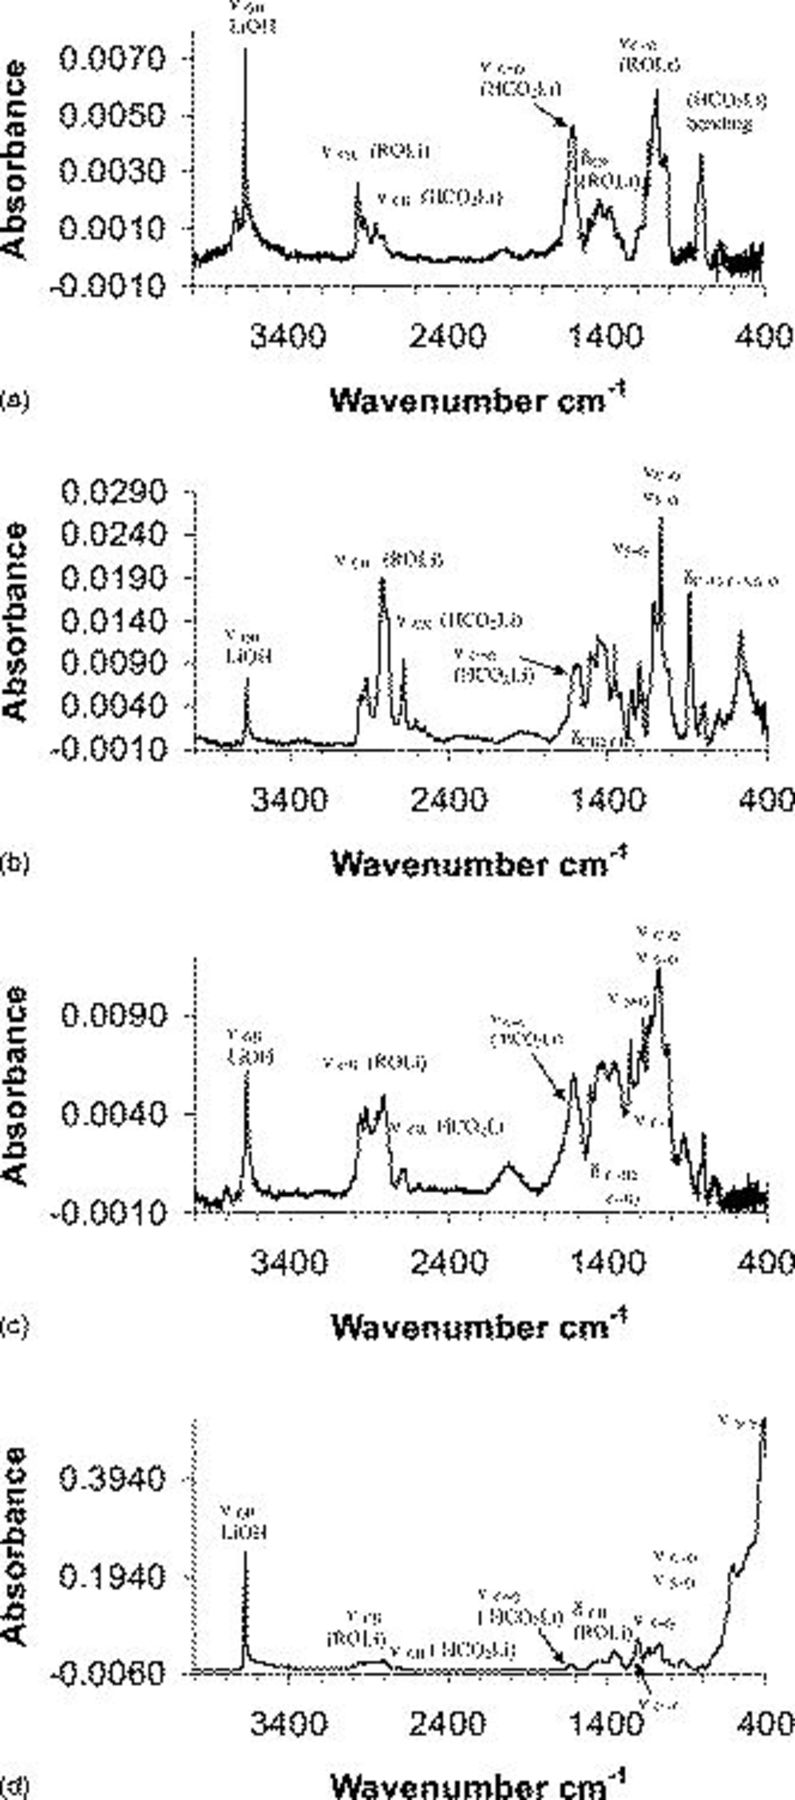
Figure 6. FTIR spectra of Li surfaces (measured ex situ) from Li surfaces prepared and stored for  in pure DOL,
  LiTFSI,
  , and
, and 
 solutions [(a)–(d), respectively]. Peak assignments appear on the spectra and in Tables I, II and III.
Table III. Major peaks and peak assignments of the FTIR spectra measured from Li electrodes prepared in different DOL solutions.18–23, 30–32
| LiTFSI (Salt spectrum for reference) | Li in 
| Li in 
| Li in 
| Peak assignments |
|---|---|---|---|---|
| 2800–3000 | 2800–3000 | 2800–3000 |

| |
| 1620 | 1620 | 1620 |
 Li formate Li formate | |
| 1440–1500 | 1440–1500 | 1440–1500 |
 Li carbonate and carboxilate Li carbonate and carboxilate | |
| 1300–1450 | 1300–1450 | 1300–1450 |
 , ,  , , 
| |
| 1330 |
 (sulfone amide) (sulfone amide) | |||
| 1350 | ||||
| 1245 | Around 1200 |

| ||
| 1196 | 1203 | 1230 | ||
| 1190 |

| |||
| 1140 | 1153 | 1170 | 1139 |
 (sulfone) (sulfone) |
| 1062 | 1000–1100 | 1000–1110 | 1060 |

|
| 950 | 943 |

| ||
 bending modes bending modes | ||||
| 795 | 800–900 | 800–900 | 800–900 |
 , C–S, S–O, C–O , C–S, S–O, C–O |
A comparison of the FTIR spectra of Li surfaces that were in short contact with the solutions (Fig. 4) and of Li surfaces after prolonged storage ( , Fig. 5a and 5b) shows the pronounced sharpening of the IR peaks in the spectra related to Li surfaces after long contact with solutions. For instance, the
 and the
 peaks unique to
  are pronounced in the spectrum related to Li/DOL/LiTFSI. The other
  peaks between 2800 and
  related to various ROLi species become better resolved when measured from the Li surface after prolonged storage. The richness of the sharp and resolved IR peaks in the fingerprint region,
  , reflects the fact that all the reactions in Scheme 1 and the resulting products (Li surface species) are relevant to these systems. Also various
  peaks in the spectra related to prolonged storage are much less pronounced, compared to those related to short contact (of Li samples in solutions), which reflects the further reduction in surface LiOH and ROH species (formed on Li due to the presence of trace water in solutions) to
  and ROLi due to prolonged enough contact with Li metal. The fact that the
  peaks are sharper in spectrum Fig. 5b (DOL/LiTFSI solution) is related to the presence of Li ions in solutions that should promote all the various reduction processes by electrophilic assistance.33 Hence, DOL reduction processes should be more pronounced in DOL/LiTFSI than in pure DOL. As seen in Fig. 5c the presence of
  in solutions has a pronounced effect on the Li surface chemistry, which is well reflected by comparing spectra Fig. 5b and 5c. The structure of the
  peaks changes and the IR absorption in the
  region is also intensified in spectra related to Li in
  -containing solutions, compared to Li in additive-free DOL/LiTFSI solutions.
  can be reduced by Li to various insoluble
  species and
  . The former species should add pronounced
  peaks to the relevant IR spectra in the region of
  (nitrates have their main N–O stretching bands between 1300 and
  ,31 the lower
  ratio in ionic N–O compounds, so the lower is the frequency of their N–O stretching vibration34).
 may have another important impact: It can oxidize
  species formed by
  reduction to
  , e.g.,
  to
to  , which can be further reduced to
  , etc. (see later discussion). The presence of
  in these solutions also pronouncedly affects the Li surface chemistry, as demonstrated in Fig. 5d. Pronounced IR bands below
  appear in spectra measured from Li surfaces after prolonged contact with
  solutions, which relate to the S–S and Li–S bonds of the insoluble Li sulfides. When comparing the relevant spectra (e.g., Fig. 5c and 5d), the presence of
  in solutions attenuates some of the surface reactivity related to
  and
and  reduction (correlates well with the relatively low impedance of Li electrodes in solutions containing
  ). However, in this work we did not develop tools for the quantitative analysis of the IR spectra thus obtained. What is presented above are samples of dozens of spectra measured, including Li stored in solutions at all possible combinations (e.g.,
  ,
,  ,
,  ,
,  , various concentrations, etc.). All of these spectral measurements converge to the surface chemistry described above (demonstrated by the spectral samples in Fig. 4 and 6) and presented in Scheme 1.
XPS measurements
Highly important, complementary information was provided by XPS measurements of Li surfaces prepared and stored in solutions. Peak assignments for these studies are based on Ref. 35–42.
Figure 7 shows  ,
,  ,
,  , and
, and  spectra of Li surfaces prepared and stored for
  in
in  and
and  solutions. This presentation includes the deconvolution of the broad peaks to specific peaks that reflect the various oxidation states of the elements and some relevant peak assignments. The response of
  related to both samples was close to the noise level, thereby nitrogen spectra are not presented herein. As clearly seen from the attached peak assignments, these measurements are in line with the FTIR spectra and related conclusions and the scope of Li surface reactions and surface species described in Scheme 1. The difference between the O, C, Li, and S spectra of the two samples is clear and pronounced. All the spectral responses related to the presence of
  in solution reflect an increase in the oxidation state of all the above elements. While the
  spectrum related to Li stored in a
  solution reflects the formation of
  , and probably
  on the Li surface (see deconvolution of the broad
  peak around
  to two sharper peaks at 160 and
  ),39, 40 the
  spectrum of Li prepared and stored in a
  solution is very rich in peaks (at least 5), which reflects a variety of oxidation states of the sulfur in the surface species formed on lithium. Clearly
  in solutions oxidizes sulfur up to sulfate (oxidation state of
  ). The fact that
  in solutions acts as an oxidizer is reflected not only by the sulfur spectra (where the effect is most pronounced). In fact, comparing the
  ,
,  , and
, and  spectra of Li surfaces prepared in these two solutions also shows that the average oxidation state of these elements is higher when Li was prepared in the
  -containing solution (compare the distributions of peaks of the highest BE related to these elements, Fig. 7).

Figure 7. XPS spectra of Li surfaces prepared and stored for  in
in  and
and  solutions, as indicated.
  ,
,  ,
,  , and
, and  peaks are presented, including peak deconvolution and assignments.
Figure 8 presents the XPS spectra of Li samples prepared and stored for  in
in  and in
  solutions. The spectra of
  ,
,  ,
,  ,
,  , and
, and  are compared. The spectra of Fig. 8 reflect a similar impact of the presence of
  in solutions, as discussed above. All the spectra of the above elements show a shift of the peaks to a higher BE when the relevant solution contained
  . There are also pronounced differences between the spectra of Fig. 7 and 8 (same substrates and solutions, different storage time) due to the prolonged storage time of Li samples in solutions. These changes are important and are listed below.
- (1)The Li sample stored for in a solution containing shows pronounced peaks, part of which is at relatively high BE . Hence, the spectrum in Fig. 8 ( solution) clearly reflects the formation of surface species (e.g., and ).35 Hence, the prolonged contact between Li and solution may allow a direct reaction between Li and .
- (2)The spectrum of Li prepared in for contains many more peaks compared to the spectrum in Fig. 7, related to a shorter contact.


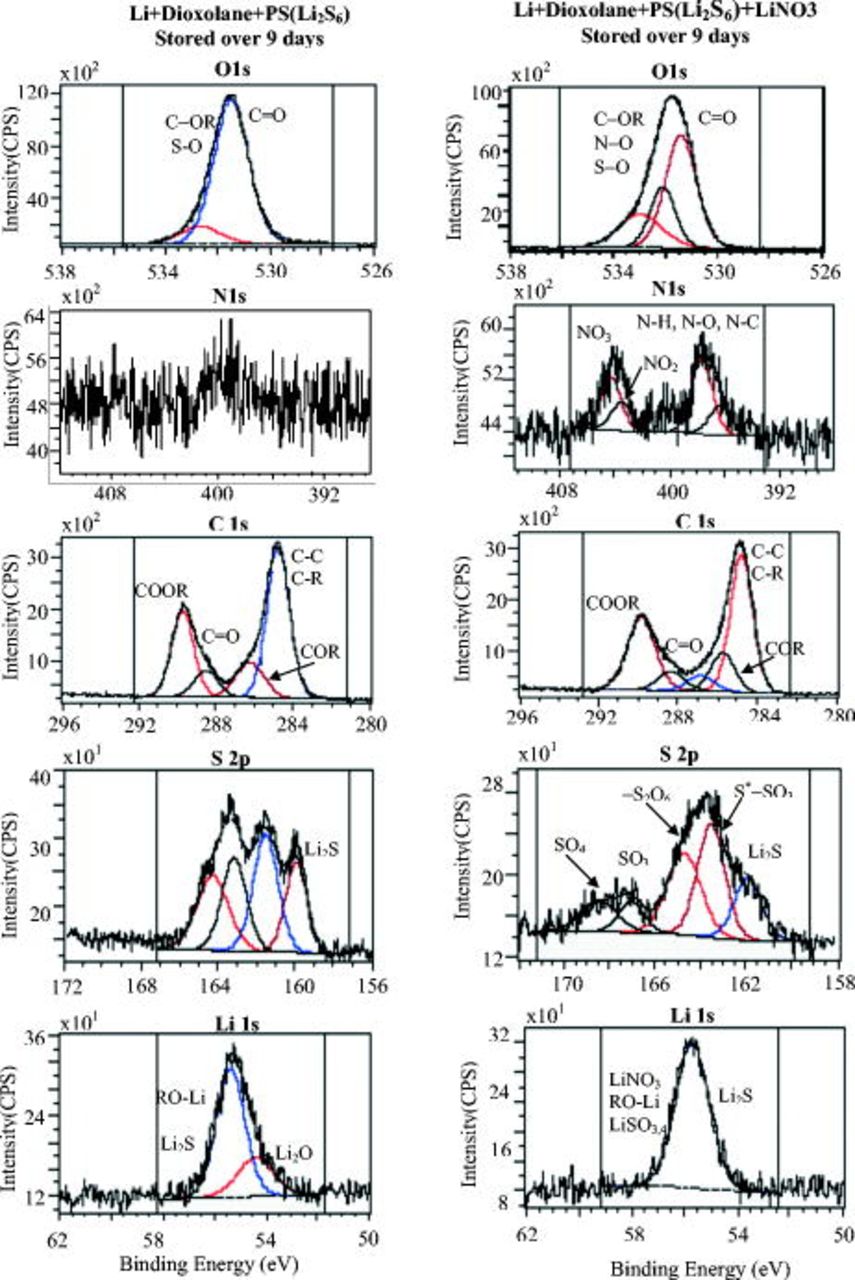
Figure 8.
 ,
,  ,
,  ,
,  , and
, and  XPS spectra of Li electrodes prepared and stored in
  and
and  solutions, as indicated. Some peak deconvolution and assignments are presented.
This means that prolonged storage may allow the precipitation of several insoluble species:  ,
,  , and
, and  . The presence of
  in solution species leads to the formation of sulfur species of higher oxidation states. The peaks below
  nearly disappear and a small peak presets around
  (may belong to
  and
and  ).35, 39, 40 However the
  spectrum in Fig. 8 (prolonged storage), related to the
  solution, reflects less oxidized states compared to the parallel spectrum in Fig. 7 (short storage time). Here the impact of the reactive Li surface is demonstrated. Sufficiently prolonged storage enables further reduction in all surface species formed initially. However, we cannot expect a completed reduction in the surface species by Li because even surface species with atoms of high oxidation states can be metastable in surface films on lithium, depending on the thickness of the surface layer (and their location in the film, i.e., the distance from the surface-Li atoms). Based on the above spectral studies, we can demonstrate schematically in Fig. 9 the main effects of the various solution components on the surface chemistry of lithium. The picture in Fig. 9 explains the role of
  in solutions in preventing the shuttle mechanisms upon charging sulfur electrodes in the cells, i.e., the continuous reduction in
 to
to 
 , which prevents the final oxidation of
  to
to  . The passivation of Li in
  solutions is not enough to avoid the continuous electron transfer from Li metal to polysulfides in solutions (through the surface films). Because several forms of polysulfides are soluble in solutions (e.g.,
  and
and  ), these electron-transfer processes do not passivate the Li electrodes. When
  is present, it is probably reduced on Li to insoluble
  species and oxidizes the sulfides (solution and surface species) to
  species that passivate the Li electrodes and thus prevent the continuous electron transfer from Li to polysulfides in solutions. The LiTFSI anion also produces
  species. However, in the absence of
  (and
(and  species in solutions oxidized by the nitrate species) their concentration in the surface films formed on lithium in these solutions may be too small to affect the appropriate passivation of lithium needed to avoid the electron transfer to polysulfides in solutions.
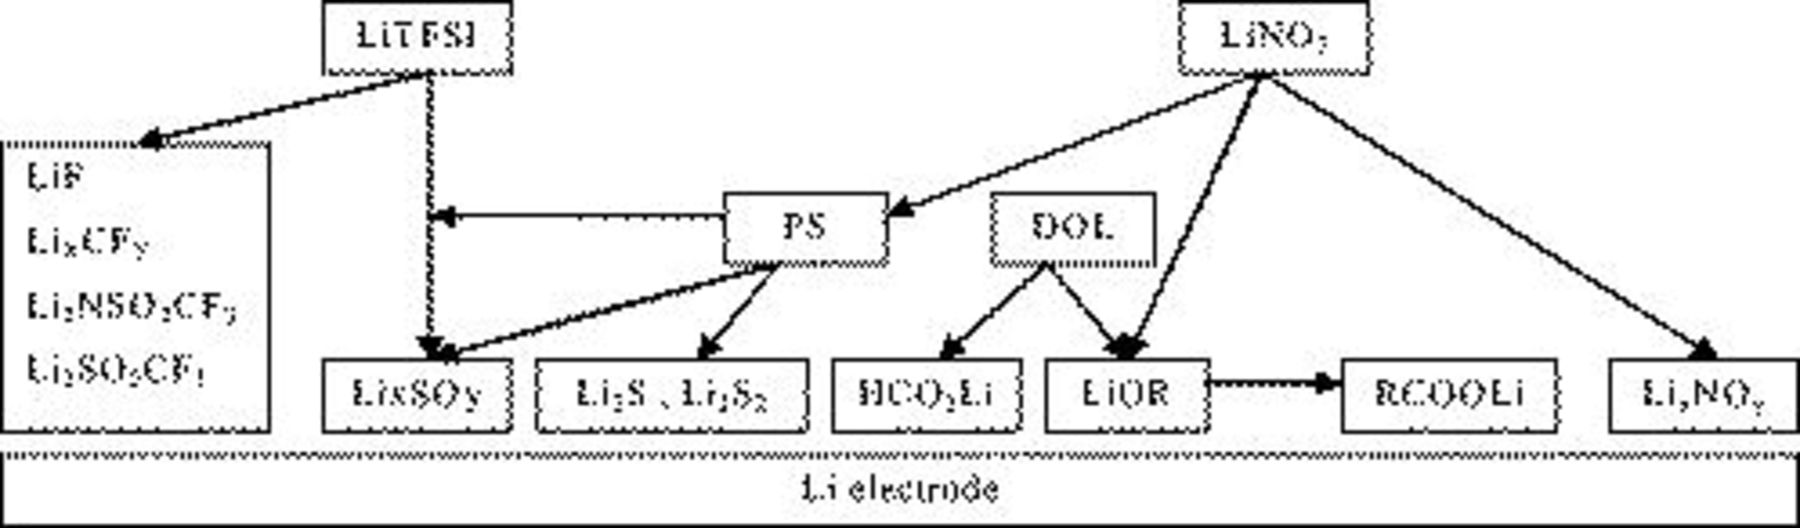
Figure 9. A schematic presentation of the contribution of the various components in  solutions to the surface chemistry of Li electrodes.
Conclusions
The study of the surface chemistry of highly reactive electrodes such as lithium is very problematic for the following reasons.
- (1)The surface chemistry of lithium in all polar aprotic solutions produces very thin surface films that passivated the active metal when reaching a certain thickness. The various surface species may contain similar functional groups and bonds. Hence, it may be difficult to achieve high resolution in the product analysis.
- (2)Both the Li metal and the surface films on it are highly reactive with atmospheric species. For instance, ROLi species readily react with to form . in the atmosphere solvates all the possible surface species formed on Li and thus diffuses to the active metal through the surface films and reacts with Li to form LiOH, , and LiH. Consequently, a special methodology had to be developed to study the surface chemistry of Li electrodes in the Li–S batteries' electrolyte solutions. Although in the past we studied very rigorously the surface chemistry of Li electrodes in a large variety of electrolyte solutions, it was necessary to go several steps further in the present study in terms of preparation of solutions, the use of a special glove box that can be evacuated and refilled with highly pure argon before each step, especially designed transfer systems, and the choice of accessories (especially for FTIR spectroscopy). The combined use of FTIR and XPS for studying the same samples is also highly important. The work presented herein is definitely state of the art in terms of the surface analysis of Li electrodes. From these studies all the possible reduction processes presented in Scheme 1 and the various functional groups appearing in the tables are indeed relevant to the surface films formed on Li in DOL/LiTFSI, , and solutions. These studies clearly showed a pronounced impact of the presence of in solution on the surface chemistry of Li electrodes: Its direct reduction to form surface species and the oxidation of sulfur species to form various surface moieties. This impact explains the positive effect of in preventing the shuttle mechanism that avoids full charging of sulfur electrodes in Li–S cells: The enhancement of Li passivation, which remarkably diminishes the possible reduction in polysulfide species in solutions by the reactive lithium electrodes.


Bar-Ilan University assisted in meeting the publication costs of this article.