
Abstract
A red-emitting phosphor,  -doped
  , was synthesized by the solid reaction–sintering process. The morphological features of the phosphor were investigated by scanning electron microscopy. The photoluminescence excitation and emission spectra, fluorescence decay curves, and the dependence of luminescence intensity on temperature were investigated. The phosphor can be excited by near-UV wavelength radiation to realize an intense red luminescence (613 nm) corresponding to the electric dipole transition
  of
of  ions. The crystallographic site occupations of the
  ions were investigated by the site-selective excitation spectra and the fluorescence decay in the
  region under a pulsed, tunable, narrow band dye laser. The potential application of this phosphor for light-emitting diodes was evaluated by the dependence of luminescence and the color coordinates on temperature.
Export citation and abstract BibTeX RIS
White light-emitting diodes (WLEDs) are considered to be a next generation light source because of their advantages, e.g., higher efficiency and no pollutant such as mercury.1 Consequently, the investigations of rare-earth (RE) ion-doped phosphors for W-LEDs gained much attention in recent years.2, 3
There are several approaches in developing WLEDs. One approach is the combination of a blue InGaN chip (450–460 nm) and a yellow phosphor such as yttrium aluminum garnet  .4 However, the problem is that the correlated color temperature
  is too high (6000–7000 K) to be applied as an indoor warm-lighting because of the lack of red light.5 Another method is the combination of red/green/blue tricolor phosphors and a near-UV InGaN chip (about 400 nm).6 The commonly used red phosphor for such an application is
  , which shows some drawbacks: a lower efficiency, shorter working lifetime, and instability due to a release of sulfide gas.7
Accordingly,  ion-doped phosphors have been extensively studied in the development of red phosphors for application in WLEDs.8–10 The fluorescence spectroscopy of
  can give information about the sites occupied by
  in the lattices because each
  center with different crystal field symmetry possesses a unique optical transition in the
  excitation spectrum. The energy levels of
  centers are very sensitive to the local environment of the corresponding cation.11
Recently, a  -doped
  with a whitlockite structure was synthesized by the solid reaction–sintering process. The phosphor was characterized by X-ray diffraction (XRD), scanning electron microscopy (SEM), and photoluminescence excitation and emission spectra. The site-selective excitation and emission spectra, together with fluorescence decay, were investigated. The crystallographic sites of
  in the
  host are discussed to elucidate their specialties of luminescence. The potential application of this phosphor for WLEDs is evaluated by the dependence of luminescence and the color coordinates on temperature.
Experimental
 -doped
  was synthesized using a conventional reaction–sintering process. The starting material was a stoichiometric mixture of reagent grade
  , ZnO,
  , and
, and  . First, the mixture was heated up to
  and kept at this temperature for 5 h. Second, the powders were thoroughly mixed in acetone and then heated at
  for 6 h in air. Finally, the obtained powder was thoroughly mixed again and heated at
  for 15 h in air. After that, the sample was slowly cooled down to
  in 10–15 h and then quenched to room temperature. The referred
  phosphor was also prepared by a solid-state reaction. The starting materials of
  ,
,  , S, and
  were ground and then fired at
  in a CO-reducing atmosphere. After annealing, the samples were washed with deionized water and then dried at
  .
.
XRD patterns were collected with a Rigaku D/Max-2000 diffractometer operating at 40 kV and 30 mA with the Bragg–Brentano geometry using  radiation
  . The photoluminescence excitation and emission spectra were recorded on a Perkin-Elmer LS-50B luminescence spectrometer on a Hitachi F-4500 fluorescence spectrophotometer. For the site-selective measurements, the excitation source was a dye laser (Spectron Laser System SL4000) pumped by the second harmonic (532 nm) of a pulsed Nd:YAG laser (Spectron Laser System SL802G). The samples were placed in a liquid helium flow cryostat for measurement at low temperature. The luminescence was dispersed by a 75 cm monochromator (Acton Research Corp. Pro-750) and was observed with a photomultiplier tube (Hamamatsu R928). To study thermal quenching between 300 and 500 K, the same spectrofluorimeter was equipped with a homemade heating cell under the excitation of a 365 nm UV lamp.
Results and Discussion
The crystal phase and morphology characterization
The XRD patterns of  -doped
  phosphors are nearly the same as JCPDs card no. 50-0339 (figure not shown here). No impurity lines are observed, and all the reflections can be well indexed to a whitlockite-type hexagonal structure of
  with the
  space group.12
Figure 1 shows the SEM morphology of  polycrystalline particles. Clearly, the compound consists of well-crystallized particles, which look like a group of small spherical polyhedrons. The size of the phosphor is about
  . This shows that the solid reactions of the mixtures took place completely with the well-developed crystals.
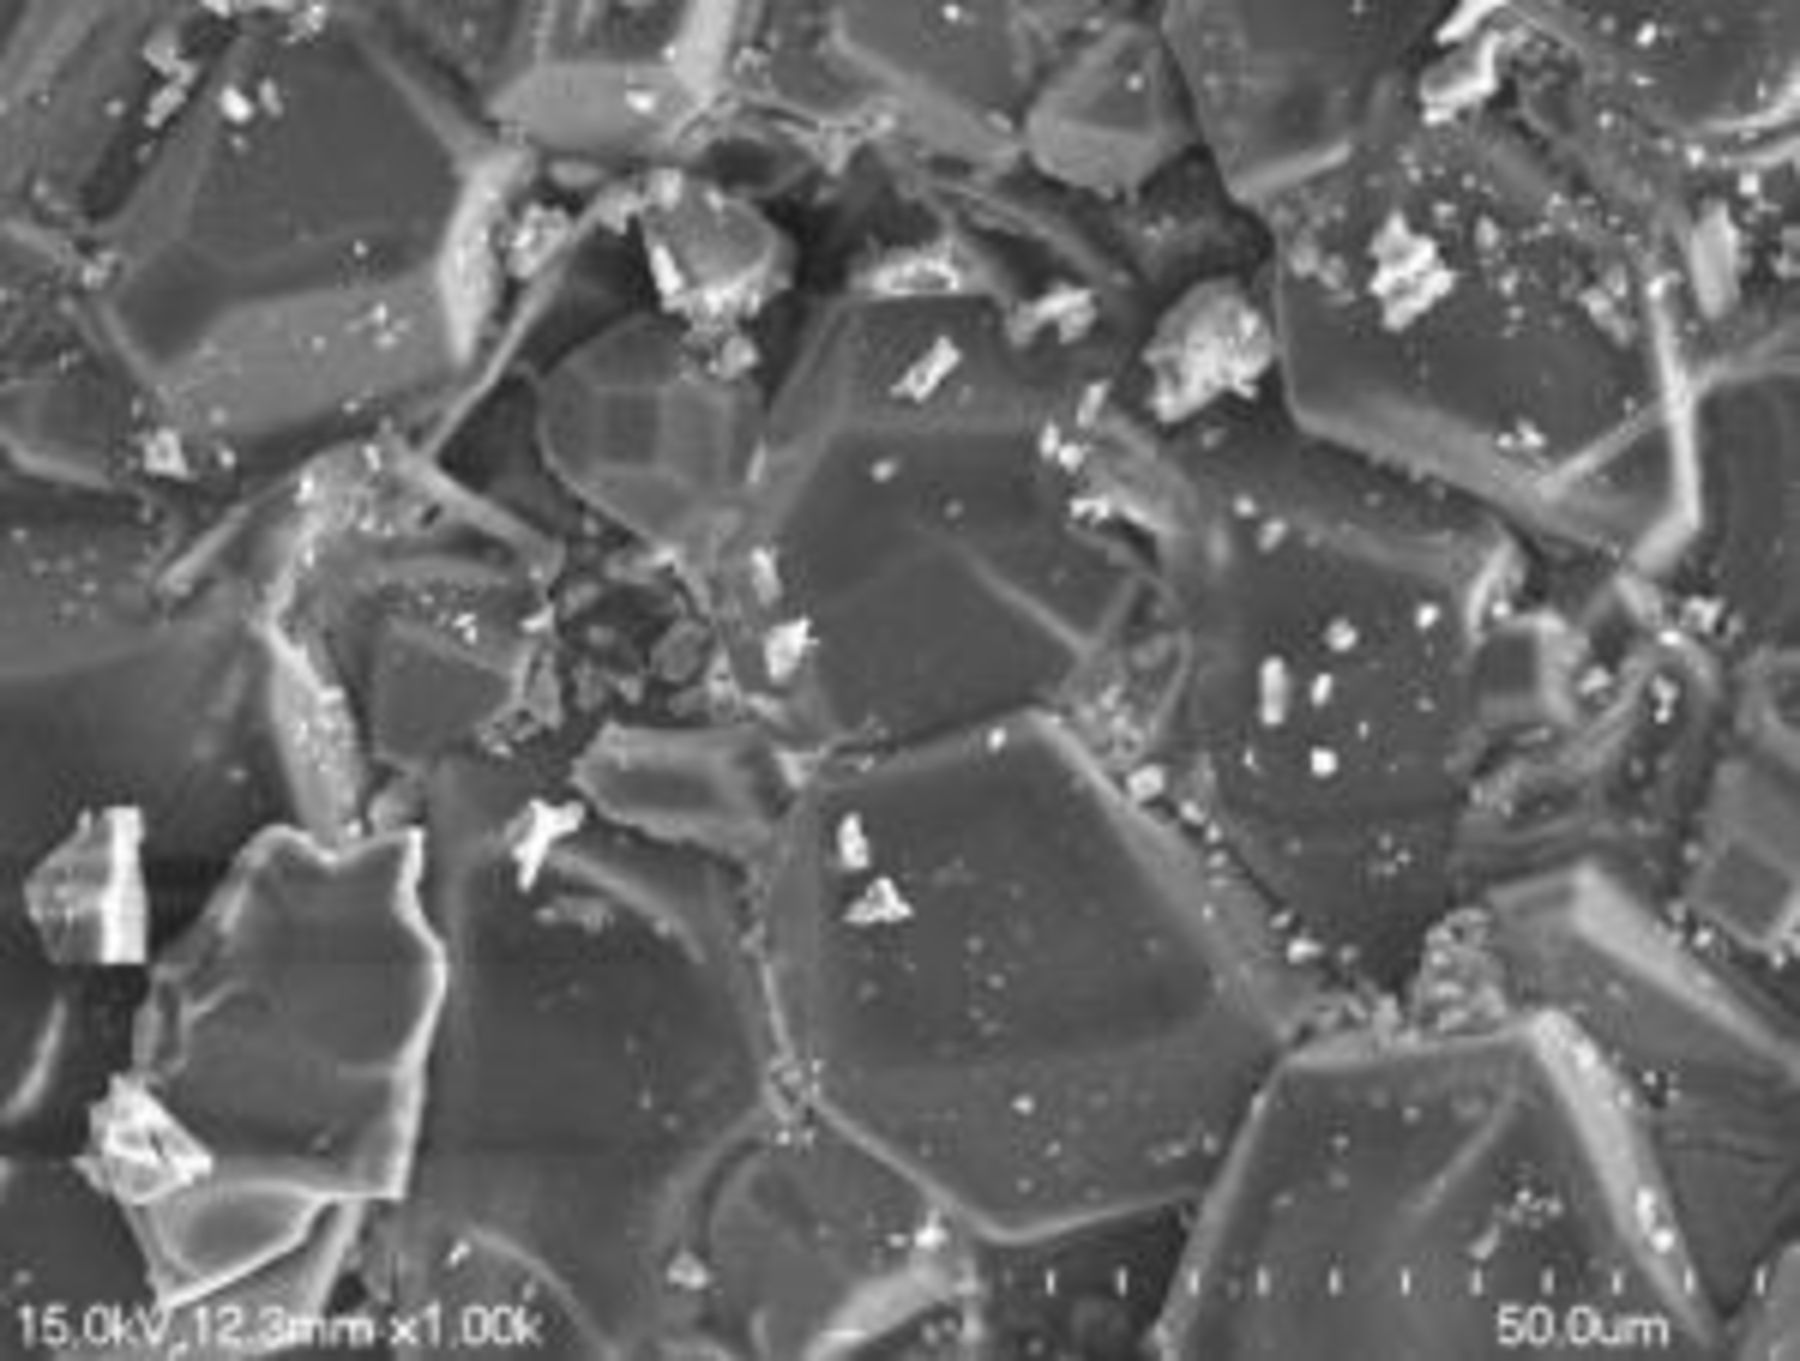
Figure 1. SEM morphology of  -doped
  phosphor.
Photoluminescence emission spectra
The dependence of the luminescence intensity on the doping concentrations of  was investigated. It showed a typical concentration-quenching effect in this phosphor. The emission intensity increased with an increase in doping concentrations and then decreased because of concentration quenching. This indicates that the optimal concentration was above 10.0 mol %.
Figure 2 presents the emission spectra of  (10.0 mol %) excited by a 254 nm commercial lamp. There are groups of sharp lines assigned to the transitions of
  (
( , 1, 2, 3, and 4) levels of
  . The emissions at about 580 and 590 nm are the transitions of
  and
and  , respectively. The emission intensities corresponding to the transitions of
  are weak. The dominant red emission of 613 nm is attributed to the electric dipole transition
  , indicating that
  is located at the site of a noninversion symmetry.13
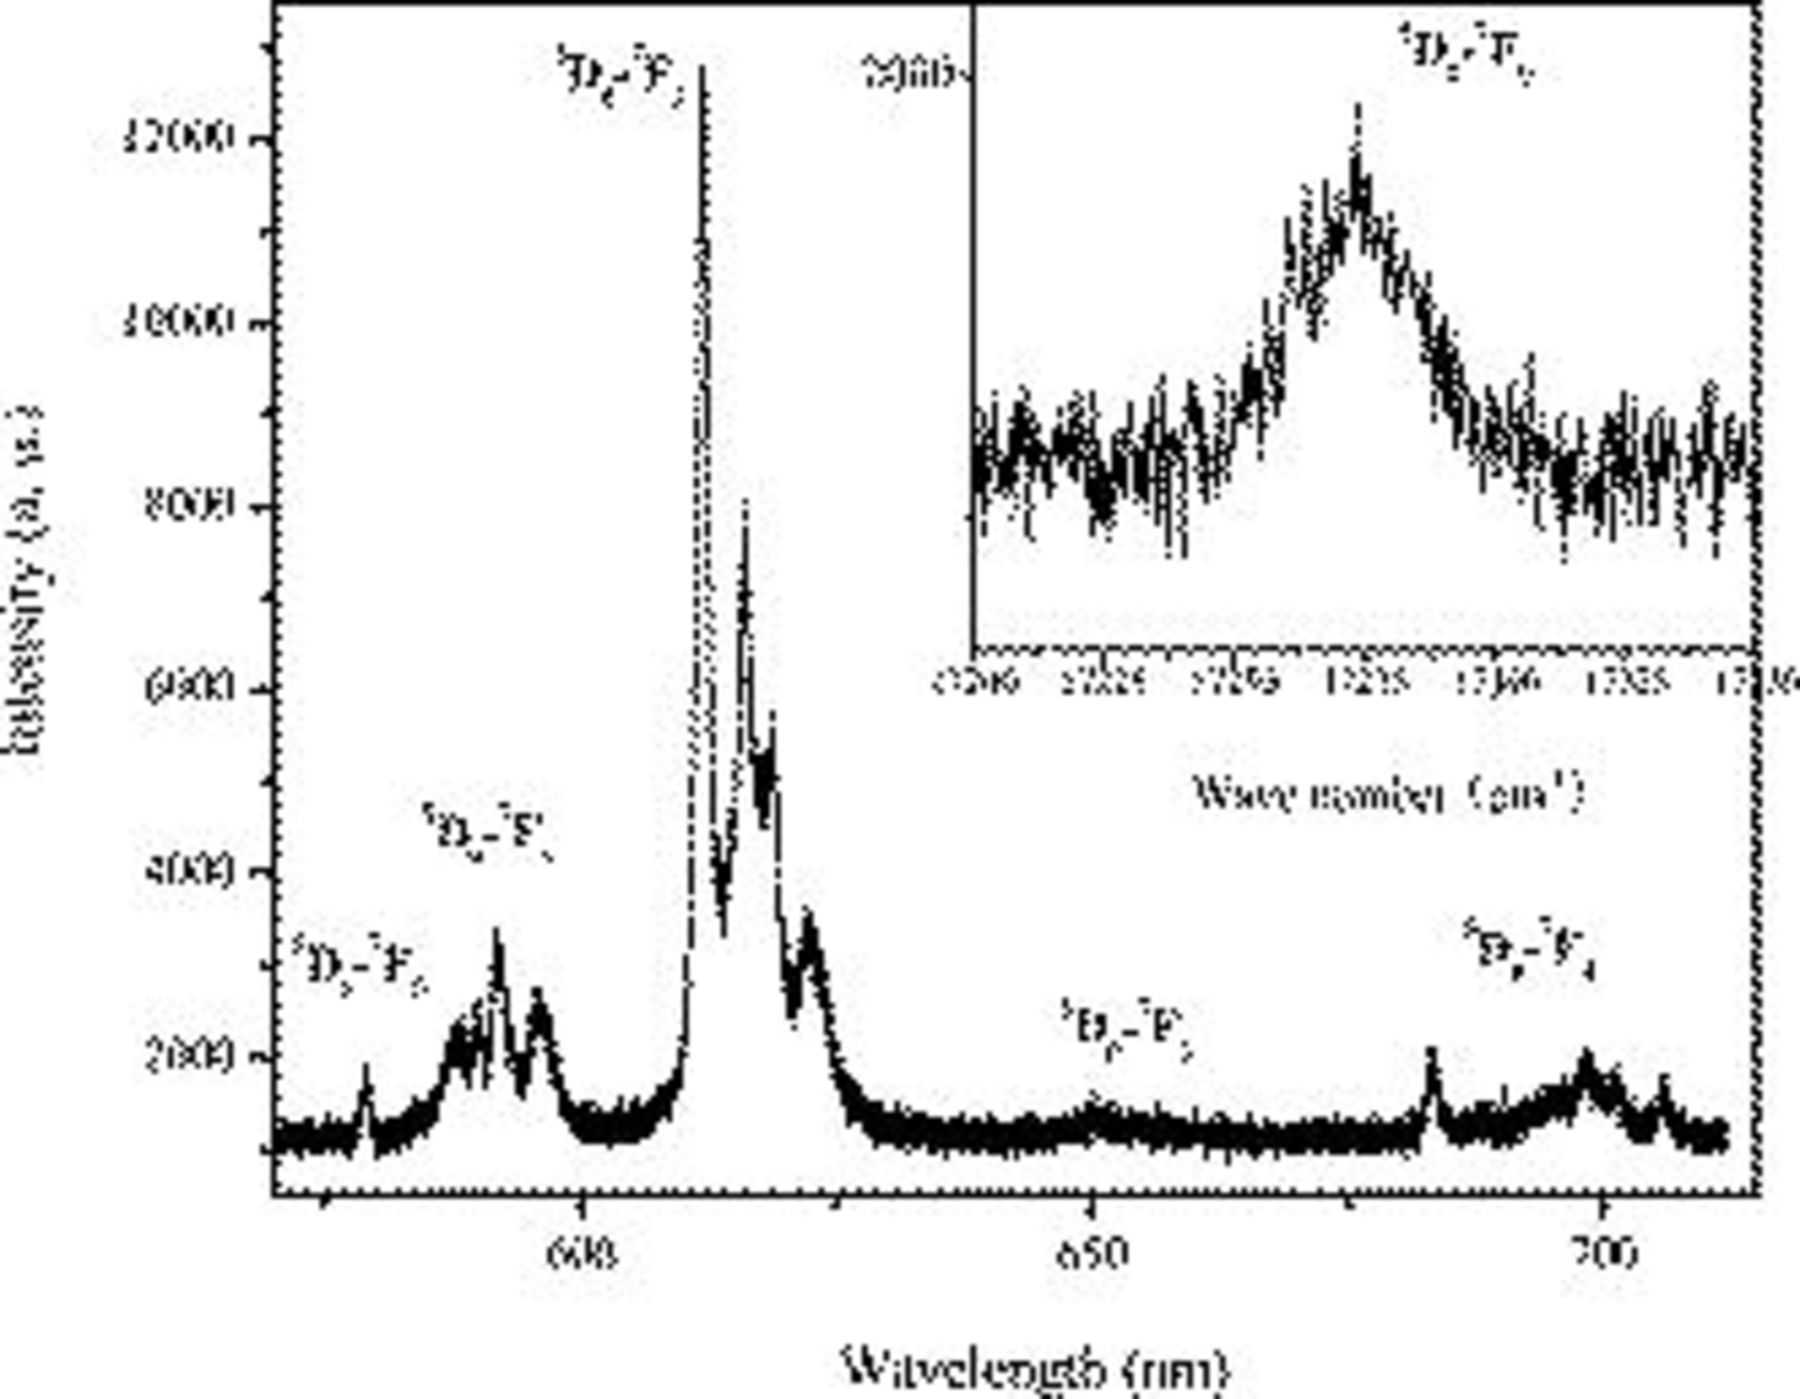
Figure 2. The luminescence spectra of  (10 mol %) under the excitation of 254 nm. The inset is the enlargement of
  transition region.
The spectral properties of  in
in  agree well with the crystal structure.
  is the
  whitlockite-like structure, which has no inversion center. In
  ,
,  replaces
  in view of their similar sizes and valence states. So,
  is located at a site without an inversion center. Consequently,
  red emission (613 nm) presents the most prominent intensity in the emission spectra (Fig. 2).
The selection rules and transition probabilities between states depend strongly on the crystal field. The forced electrical dipole transition  is very sensitive to the local environment, while the magnetic dipole transition
  is not affected much by the ligand field around
  . Therefore, the intensity ratio of
  is a measure of an RE ion site symmetry. A lower symmetry of the crystal field around
  results in a higher value of
  .11 The intensity ratio of
  (10.0 mol %) is
  . This value is quite large compared with that of other
  -doped phosphates, such as
 ,14
,14 
 , and
, and 
 .15 This suggests that
  ions have a heavily distorted environment of cation ions in this host. This larger ratio is favorable to improve the color purity of the red phosphor.
Photoluminescence spectra
Figure 3 shows the photoluminescence excitation and emission spectra of (a)  and (b)
  . Upon excitation with 395 nm UV irradiation, the emission spectra of
  display
  (
( , 1, 2, 3, and 4) emission lines of the
  ions. The excitation spectrum (Fig. 3a) obtained by monitoring the red luminescence corresponding to the
  transition can be divided into two regions: The weak broad band at 220–300 nm originates from the charge–transfer (CT) between
  ion and the neighboring oxygen ions, and the other sharp lines in the range of 300–550 nm correspond to the f–f transitions of
  ions.
ions.
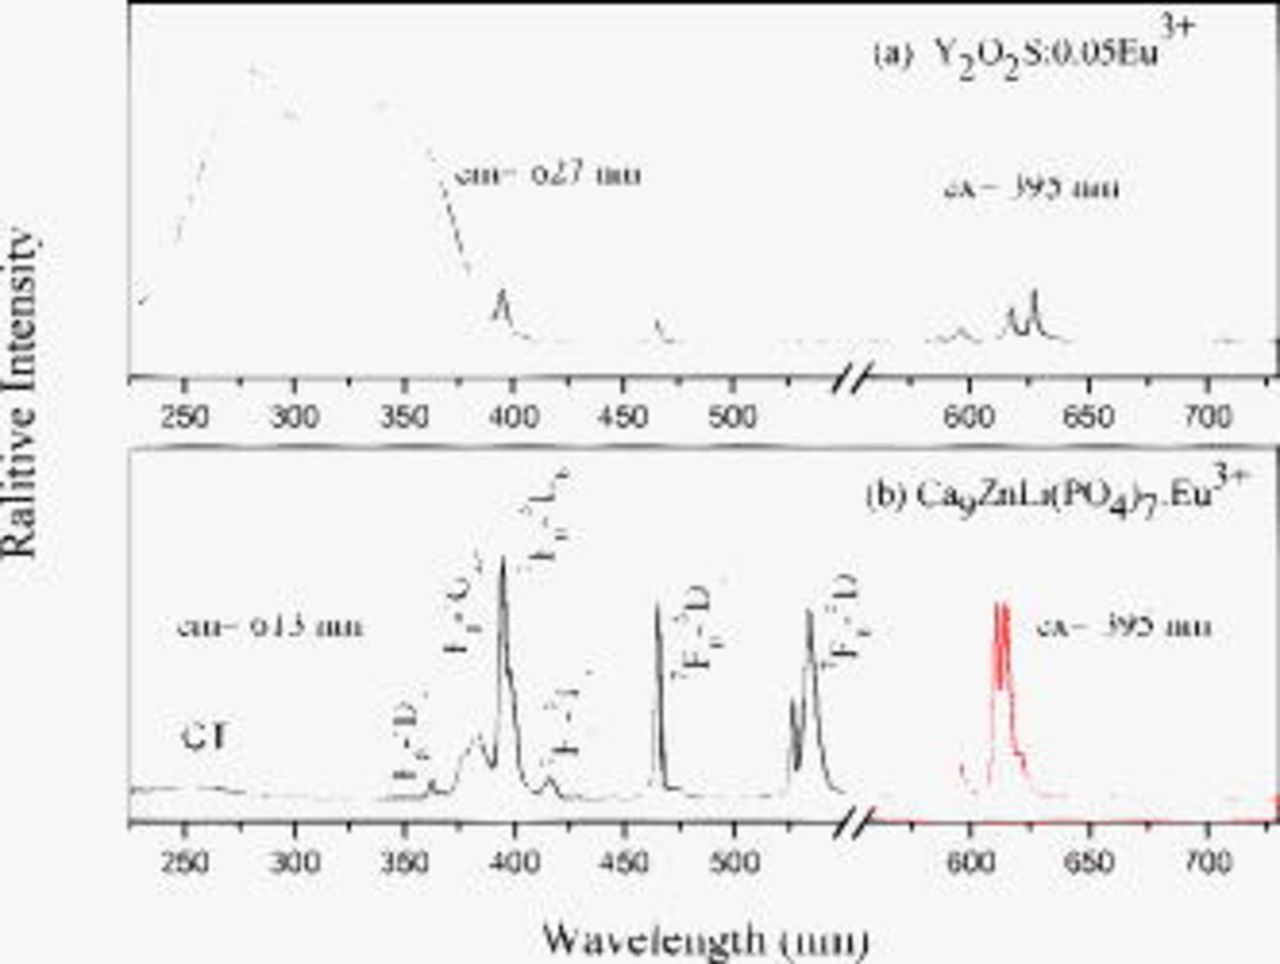
Figure 3. The photoluminescence excitation and emission spectra of (a)  (10 mol %) (
 ,
,  ) and (b)
  (
( ,
,  ).
).
In  -doped phosphors, the intensity of the CT band is much stronger than that of f–f transitions in the excitation spectrum. However, the intensities of the f–f transition of
  in the excitation spectrum of
  are higher than that of the CT band. This is due to the nature of the host's structure and sites of
  occupied.
Van der Voort and co-workers investigated the influence of an effective charge at the  ion on the quantum efficiency under CT excitation
  in the calcium and zirconium compounds.16–19 The results have been explained by a model that relates the sign of the effective charge to the shape and the position of the parabola in the configurational coordinate diagram.17 The
  ion is subject to a high rate of radiationless processes in its excited CT state if it is incorporated into calcium compounds. Van der Voort et al. also suggested that in some calcium compounds, the ions with intraionic transitions seem to show an efficient luminescence if they have a positive effective charge, whereas in ions with an interionic transition (CT between
  and
and  ), the luminescence only shows weakly. A positive effective charge gave rise to a large relaxation in the CT state and a low
  value.20 For a negative effective charge, the relaxation was predicted to be less, and
  was high.17, 21 In
  , the low intensity of CT bands of
  ions could follow this model. This could be ascribed to the effective charge of the
  ion at a
  site.
site.
Many kinds of  -doped phosphors have been synthesized, and their fluorescent spectra have been characterized to develop the red-emitting phosphor for WLEDs. A suitable red-emitting ultraviolet light-emitting diode (UV-LED) phosphor should exhibit an absorption of around 400 nm (LED excitation wavelength). Obviously, this excitation spectrum (Fig. 3a) indicates that
  can be efficiently excited by near-UV-LED chips.
In the excitation spectrum of  , the strong broad band before 350 nm corresponds to the Eu–O CT state and the
  CT transition in
  .22 Compared with
  , the intensity of the CT band is much more intense than that of f–f transitions in
  (Fig. 3a). Under an excitation wavelength of 395 nm, the main emission line of
  is 627 nm, which is ascribed to the
  transition of
  . The emission intensity of the phosphor
  is lower than that of
  under a 395 nm UV irradiation. Other well known red phosphors,
  and
and  , for example, also have similar photoluminescence properties to
  .23
.23
The site-selective excitation and emission
As seen in Fig. 2, the characteristic of  luminescence is that all the emission lines from the
  (
( , 1, 2, 3, and 4) transitions are broad emission bands, and there are large inhomogeneities. Usually, the typical linewidths of the
  excitation transition are quite narrow, often with full widths at half-maximum (fwhm) of less than
  .24 In the inset of Fig. 2, the lines of the
  transition are much broader with an fwhm of more than
  .
.
The  ground state and the
  excited state are nondegenerate, and they cannot be split by a crystal field surrounding the
  ions. Consequently, any broadening observed in optical transition between the
  and
and  levels reflects the bonding environments. The inhomogeneous broadening of the
  transition (inset of Fig. 2) has a similar structure to that in glass matrices. Motegi and Shionoya considered that this kind of line shape reflected the statistical distribution of the transition energy.25
To investigate the influence of the site distributions of  ions on the luminescence of
  , the excitation spectra corresponding to the
  transition were investigated by monitoring the total luminescence and using a dye laser of a high resolution at 10 K. As shown in Fig. 4, the excitation spectra in the
  transition show very broad and asymmetric spectra. This is similar to the luminescence in the inset of Fig. 2.
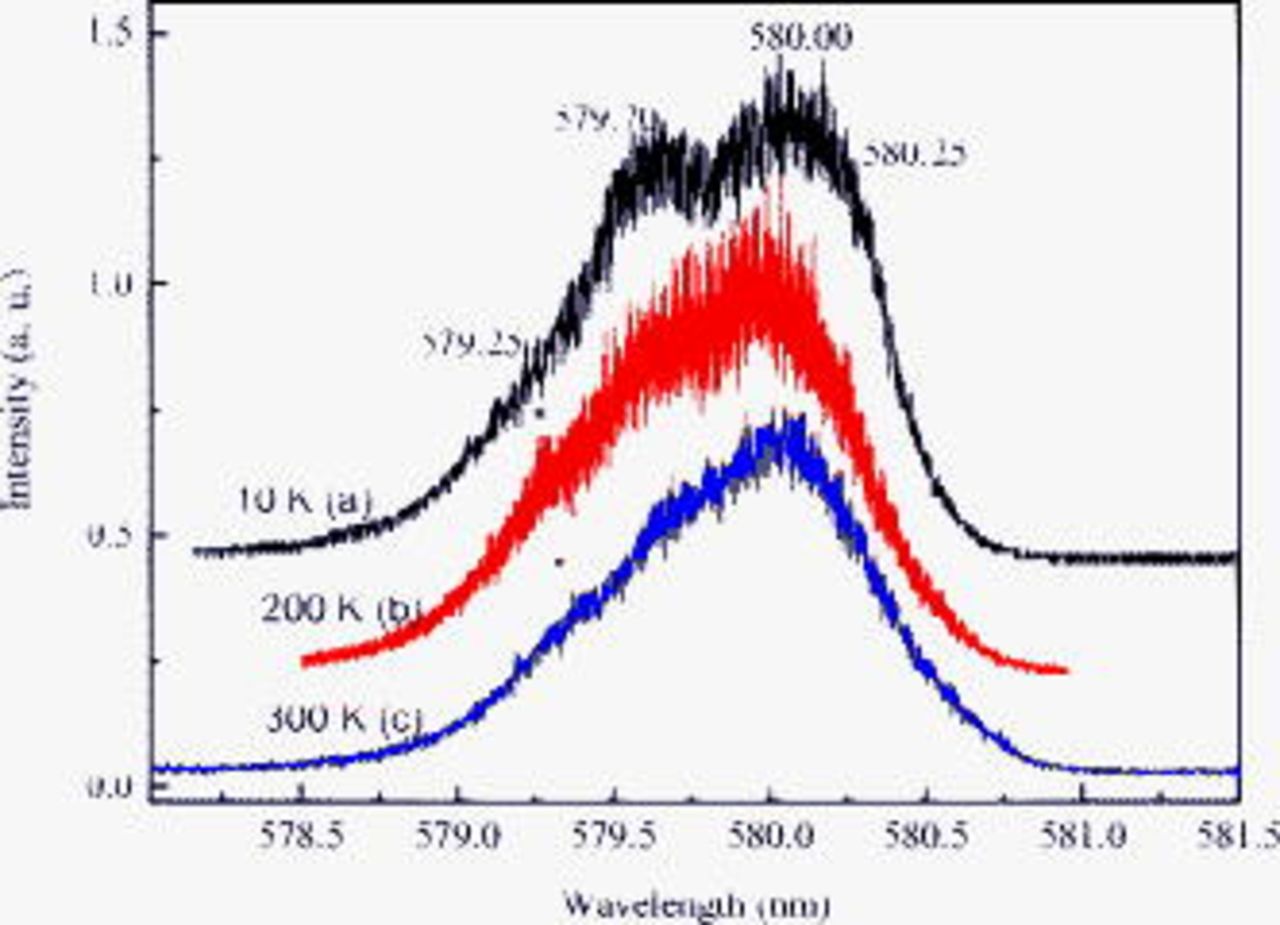
Figure 4. Excitation spectra of  transition of
  (10 mol %). The spectra were obtained by monitoring the total luminescence at (a) 10, (b) 200, and (c) 300 K.
To determine the disordered distribution, the fluorescence line-narrowing method used for the study of  -doped glasses was applied in this spectra.26 The fluorescence spectra of the
  transitions of
  in
in  were obtained at 10 K by using different resonant excitation wavelengths of 579.25, 579.70, 580.00, and 580.25 nm along the
  inhomogeneous absorption band, as listed in Fig. 4. Figure 5 shows the spectra corresponding to the transitions of
  .
.
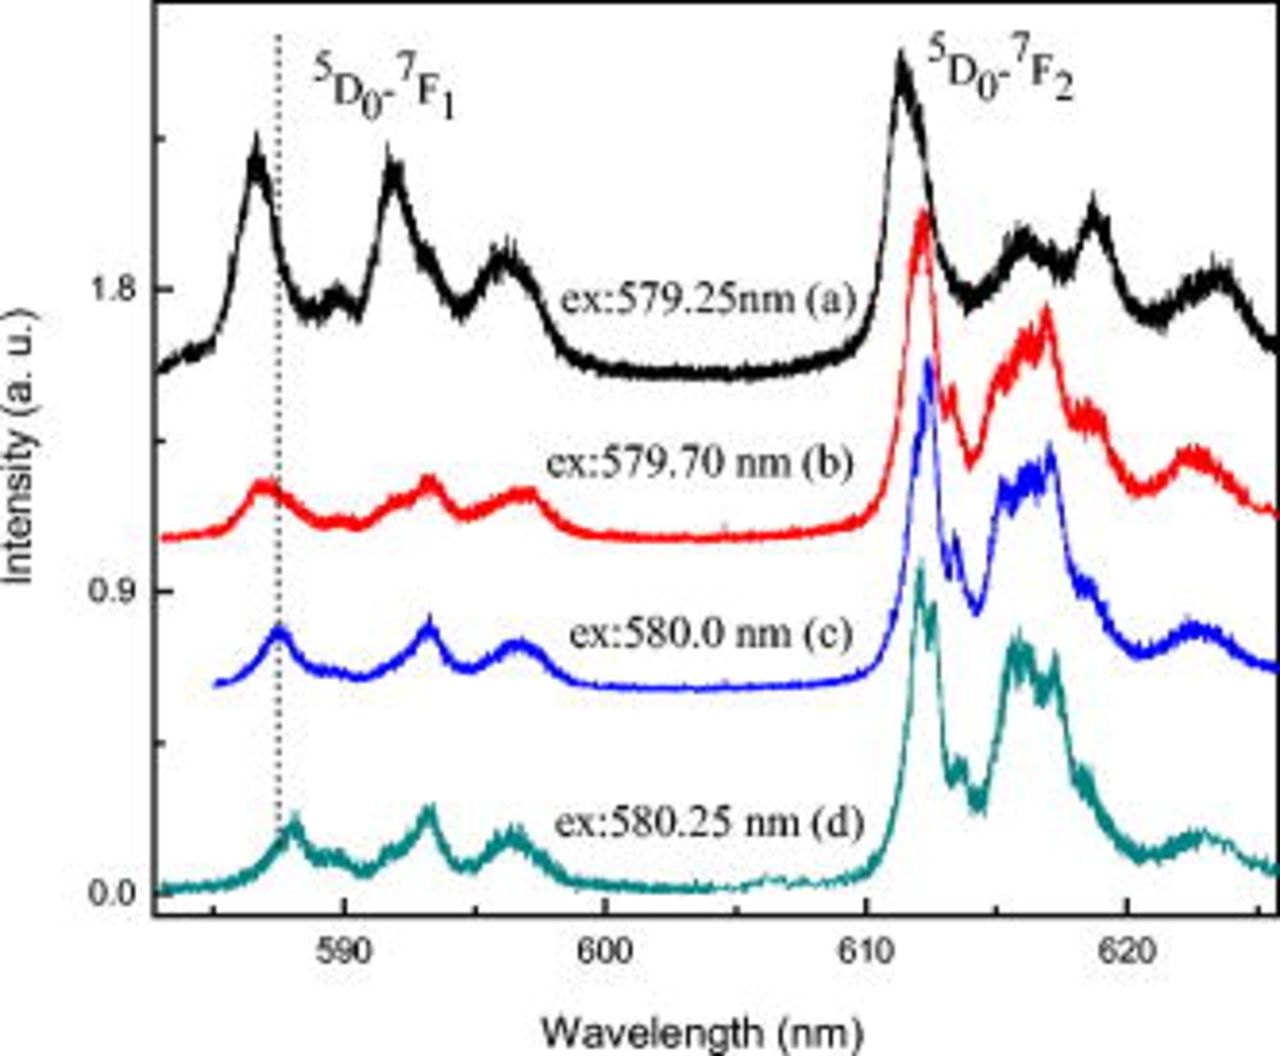
Figure 5. The emission spectra of  ions doped in
  under the excitations of (a) 579.25, (b) 579.70, (c) 580.00, and (d) 580.25 nm at 10 K.
The evolution of the Stark components  depending on the excitation energy is shown in Fig. 6. The Stark components of the
  multiplet differ in their evolution with excitation energy. The high energy (shortest wavelength) component is considerably sharper than the others, and its position is more sensitive to the excitation energy. As can be seen in Fig. 6, the CF splitting of the three observed
  energy levels narrows remarkably at a low excitation energy. This shows that the distribution of
  in
in  is very random and disordered.
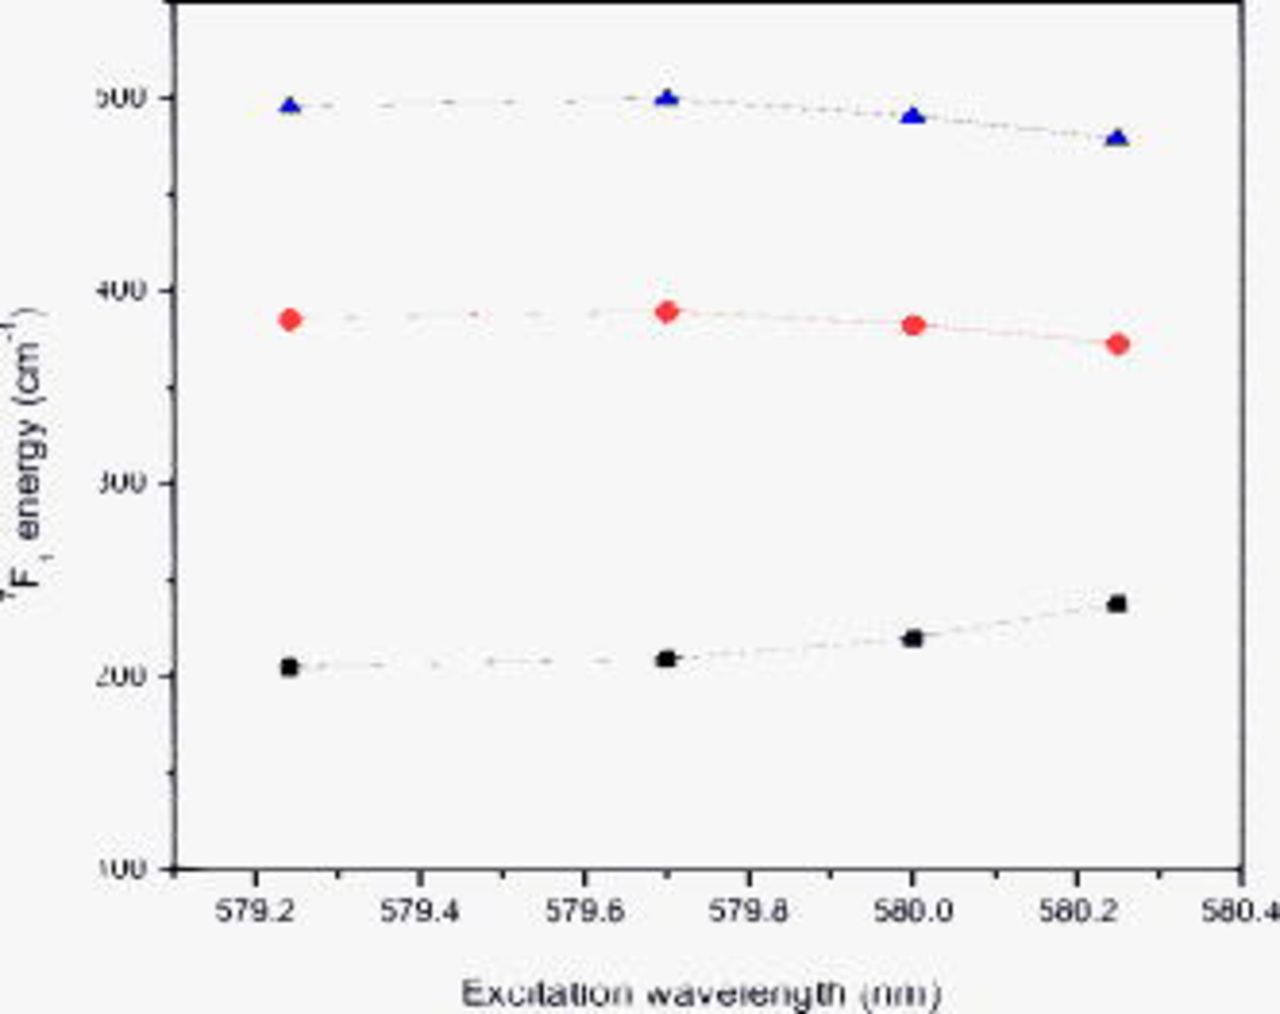
Figure 6. Energies of the Stark levels of the  multiplet as a function of excitation wavelength listed in Fig. 5.
 has the
  structure, where the Ca(1), Ca(2), and Ca(3) sites are eight-coordinated by oxygen atoms. The distorted octahedral Ca(5) site is fully occupied by
  ions. The Ca(4) site surrounded by nine O atoms is 50% occupied by
  ions. The Ca(6) site is vacant.27 The distribution of
  in the initial
  structure was divided into two groups. The compounds containing
  belong to the first group, and the compounds containing
  belong to the second one. In the first group (
 , Pr, Y, or Eu),
  and
and  cations statistically occupy three Ca(1), Ca(2), and Ca(3) positions.28 In the compounds of the second group,
  and calcium cations statistically occupy the Ca(1), Ca(2), and Ca(5) positions. The compound with
  is shared by both groups.29
In the isostructure components of  (
( , Gd, Y), it was suggested that the
  ions could be statistically doped in the Ca(1), Ca(2), Ca(3), and Ca(5) sites.30 Very recently, Liu et al. reported the luminescence of
  doped in the isostructure of
  . The
. The  ions occupied Ca(1), Ca(2), Ca(3), and Ca(5) sites in the lattices.2 According to the excitation in the
  transition region in Fig. 4 and the references discussed above, it is suggested that the
  ions could randomly occupy at least four
  sites of Ca(1), Ca(2), Ca(3), and Ca(5) in
  lattices.
In  -doped
  or the apatite structure, the substitution with a vacancy
  or an interstitial oxygen creation
  has been proposed.31, 32
Although  has the
  structure, the required charge compensation mechanisms for the occupation of
  ions could be more complicated due to three kinds of cations in the lattices. This can most probably be achieved by the possible mechanisms: First, the positive charge due to
  ions substituted for
  site may be combined with the cation vacancy to form the dipole complexes of [
 ]. Such a charge compensation mechanism is very common in other components, e.g.,
  -doped apatite structure material.33
Second, the  ions with the smallest radius could disorderly occupy the
  or
or  site. Consequentially, the charge compensation of
  could exist in the
  lattices. This means that the monovalent cation of
  can act as a charge compensator:
  . This can lead to the strongly enhanced luminescence of
  in the host. For example, in
  -doped
  , the co-doping of a monovalent cations such as
  ,
,  , and
, and  greatly enhanced the f–f transition (
 at around 393 nm and
  at around 467 nm) and led to the strong luminescence of
  ion under the excitation of the f–f absorption.34 In the isostructure
  , the excitation of CT bands (243 nm) is much stronger than the f–f transition of
  ions,35 whereas the situation in
  -doped
  is reversed (Fig. 3a).
Finally, the defects of cation vacation usually have a limitation. So, another charge compensation mechanism related to the interstitial oxygen  is possible:
  . This usually occurs for a high
  doping concentration because more cation vacancies could be produced to keep the charge balance in the lattices. Such kind of charge compensation mechanism has been suggested in other
  -doped apatites or calcium borates.21, 32
The fluorescence decay
The decay profiles were recorded at 10 K for the excitation at corresponding wavelengths of 579.25, 579.70, 580.00, and 580.25 nm (as listed in Fig. 4). All the fluorescence decays have similar exponential decay curves. The lifetime is about 1.62 ms.
Figure 7 shows the representative decay curves under an excitation of 580 nm at different temperatures. The curve can be fitted into a single exponential function as  ;
;  is the initial emission intensity for
  and τ is lifetime. The lifetimes at different temperatures are shown in the inset of Fig. 7.
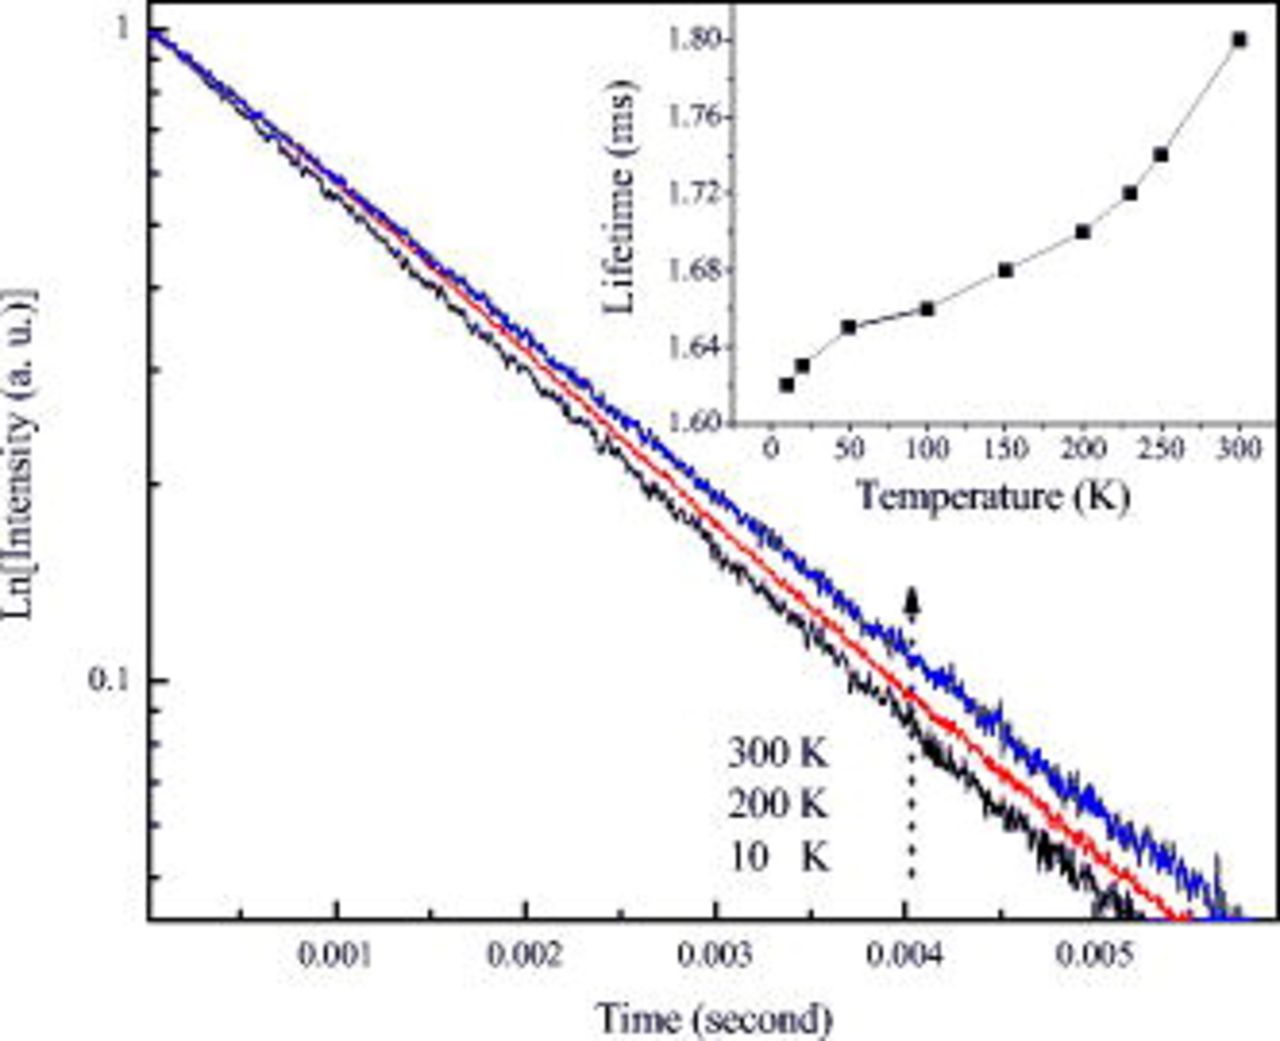
Figure 7. The  fluorescence decay curves under the excitation of 580 nm at 10, 200, and 300 K. The inset is the dependence of lifetimes on the temperatures.
Usually, the increasing of temperature induces the quenching of luminescence and the shortening of lifetime of  ions. However, as can be seen in Fig. 7, the lifetime of the
  ions doped in
  becomes longer as the temperature increases. This unusual luminescence property could be due to the broad distribution of
  ions in the lattices. Blasse explained the detailed energy transfer processes between identical centers (S).36 Usually, if the transfer between two ions S occurs with high rate, the transfer could occur in the first step and be followed by others. If the excitation into S is followed after a migration by emission from S only, the decay is described by
  , where
  is the emission intensity at time
  , and
, and  is the radiative rate. Under this suggestion, the donor–donor transfer near
  could be very rapid. In this case, the decay keeps the exponential, and the longer lifetime of
  with the increase in temperature may be due to the energy back transfer between the
  ions at random sites.36
Dependence of luminescence and chromatic coordinates on temperature
The temperature dependence of phosphors used in phosphor conversion WLEDs is important because it has great influence on the light output and color rendering index. The junction temperatures of typical LEDs can be higher than  . There is significant thermal quenching of phosphors and emission color shift at
  .37 Figure 8 shows the temperature-dependent luminescence spectra under an excitation of 365 nm. It can be seen that the
  phosphor has an excellent thermal stability on the temperature-quenching effect.
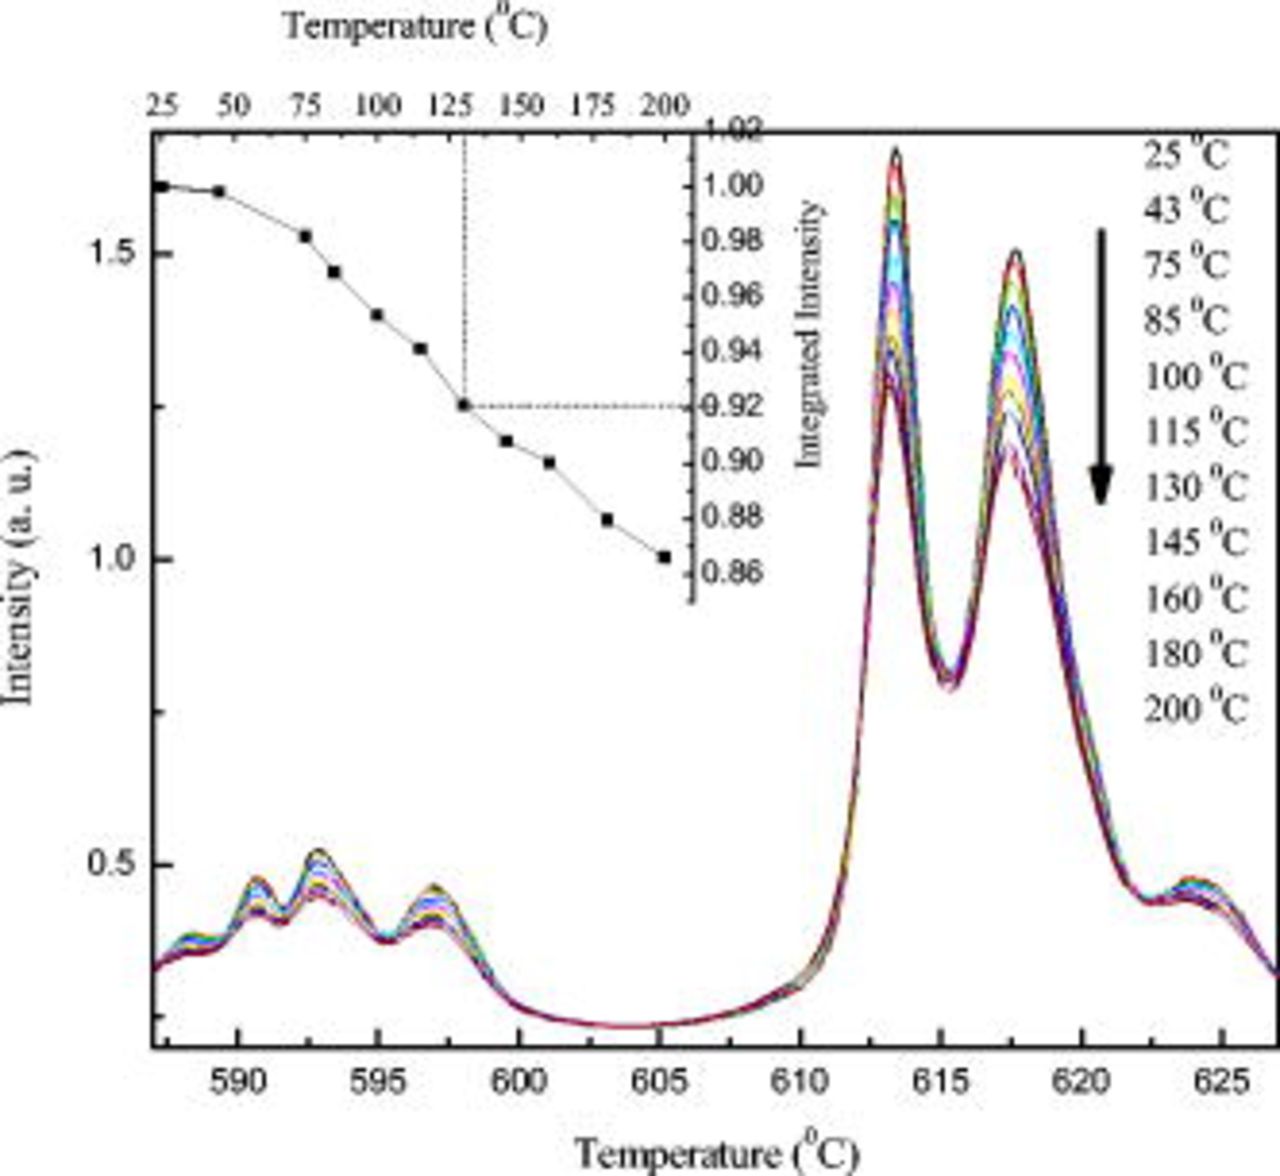
Figure 8. The emission spectra of  -doped
  under the excitation of 365 nm at different temperatures. The inset shows the integrated luminescence intensities normalized at
  .
.
The inset in Fig. 8 represents the temperature dependence of the integrated emission intensity normalized to  . With increasing temperature up to 100 and
  , the normalized emission intensities decreased to 95 and 86% of the initial value
  , respectively. This indicates that the luminescence of
  doped in
  has a good thermal stability.
The mechanisms of the thermal instability in  -doped samples are complicated. The temperature-quenching effect of
  luminescence becomes strong with the elevated temperature, which is generally caused by energy migration and transfer to nonradiative traps and
  within the host lattice.37
Figure 9 shows the CIE (1931) color chromaticity coordinates of  from 25 to
  . With increasing temperature, the color coordinates of the phosphor have no changes, as shown in the inset of Fig. 9. The CIE color values keep the value of about (
 ,
,  ), which are closer to the standard of National Television Standards Committee (
 ,
,  ) than that of a commercial red phosphor of
  (
( ,
,  ).38 It shows a stable color at various temperatures.
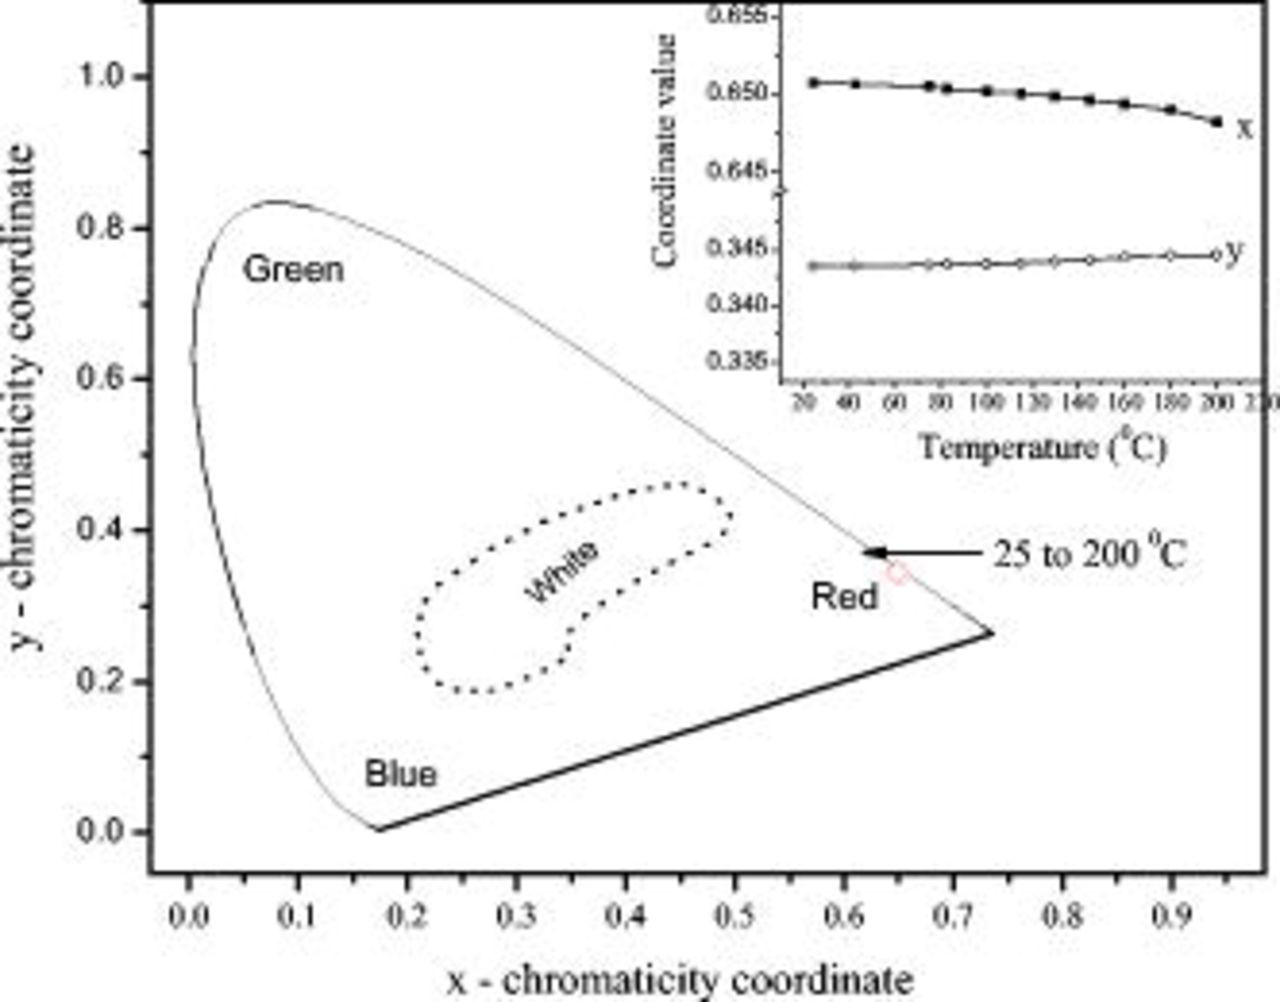
Figure 9. CIE (1931) color chromatic coordinates of  -doped
  phosphor calculated from the emission spectra at
  in Fig. 8. The inset shows the changes in the values of
  and
and  as a function of temperature.
Conclusions
The red-emitting phosphor  was synthesized by a conventional solid-state method. The
  compound crystallized well in garnetlike particle crystals. The excitation and emission spectra, decay curves, and the dependence of luminescence on temperature were studied. The excitation spectra indicate that this phosphor can be effectively excited by near-UV light, which matches the emission wavelength of near-UV-LED chips well. The phosphor shows intense red emission, which has a high quenching temperature and can keep a stable color purity with elevated temperature. The site-selective excitation and emission spectra of
  sites present a statistical and random occupation with similar crystallographic environments in the lattices. Under excitation into
  ,
,  shows unusual fluorescence decay properties; i.e., the lifetime becomes longer with the increase in temperature from 10 to 300 K. Because of its good excitation profile and stable luminescence properties at high temperature,
  could be a potential red-emitting phosphor for the near-UV chip-based WLEDs.
Acknowledgments
This work was financially supported by a Korea Science and Engineering Foundation (KOSEF) grant funded by the Korean government Ministry of Education, Science and Technology (MEST) (no. 2009-0078682).
Pukyong National University assisted in meeting the publication costs of this article.