
Abstract
The kinetics of the electrochemical insertion and extraction of lithium ion at silicon monoxide (SiO) were investigated by ac impedance spectroscopy. The resultant Nyquist plots showed two semicircles at high and middle frequency regions. These two semicircles were attributed to lithium-ion transport resistance in a surface film and alloying reaction resistance (charge-transfer resistance), respectively. We evaluated the activation energies of the charge-transfer reaction from the temperature dependences of the interfacial conductivities. When an ethylene-carbonate-based electrolyte was used, the activation energy of the charge transfer was  . This activation energy was much smaller than those at graphite electrode or positive electrode materials (around
  or more). Based on these results, the charge transfer at SiO is exceptionally fast compared to those at other insertion materials. Furthermore, the activation energies of the charge transfer at SiO remained unchanged in various electrolytes. These results suggest that the charge-transfer kinetics at SiO is not influenced by the desolvation of lithium ion from solvent molecules.
Export citation and abstract BibTeX RIS
Lithium-ion batteries have recently attracted much attention as a power source for electric vehicles (EVs) and plug-in hybrid EVs. These applications of lithium-ion batteries give severe requirements to electrode materials. One such requirement is a significant improvement in the energy density of electrode materials. Therefore, an alternative electrode material has been explored for a much higher energy density. Among the candidates for a new negative electrode are alloying materials such as Si and Sn.1, 2 These materials electrochemically react with lithium to form a lithium alloy that has an extremely high energy density compared to graphite. However, the alloying reaction shows a large volume change in the materials,3 which leads to capacity fade during charge–discharge cycles.4 To overcome the problem, silicon monoxide (SiO) has recently attracted much attention as a next generation negative electrode.5–13 SiO shows a small volume change because it contains a relatively small amount of Si element that is active for the alloying reaction. The discharge capacity of SiO electrodes was reported to be over  in several papers,9–12 which is much higher than that of a graphite electrode
  .
.
To commercialize the SiO electrode, we need to consider the rate performance in addition to the energy density. However, there are few reports on the kinetic aspect of alloying materials. Our group focused on the kinetics of charge (lithium ion)-transfer reactions at a graphite/electrolyte interface14, 15 and other interfaces.16–19 The activation energies of the charge-transfer reactions were around  or more, which were higher compared to those of lithium-ion transport in solid20–23 or liquid24–26 electrolytes. This is because the desolvation of lithium ion from solvents occurs during the charge transfer at the interfaces, and the energy for the desolvation is large. In SiO, however, the kinetics of the charge-transfer reaction might be quite different from those of graphite and other insertion materials.
In the present paper, the kinetics of the charge-transfer reaction at SiO was studied by ac impedance spectroscopy. At first, the assignment of semicircles in the resultant Nyquist plots was conducted, and then the activation energies of the charge-transfer reaction were investigated. One of the important points of this work is the effect of the desolvation process on the charge-transfer kinetics. Therefore, the activation energies of the charge-transfer reaction were measured in various solvents that have different solvation abilities.
Experimental
A SiO electrode was provided by Sumitomo Titanium Corporation. The SiO electrode was prepared by vapor deposition of SiO on a Cu foil. Electrolyte solutions were 
 dissolved in propylene carbonate (PC), dimethyl carbonate (DMC) and ethylene carbonate (EC) (EC:DMC) mixture (1:1 by volume), and
 dissolved in dimethyl sulfoxide (DMSO). All the electrolytes were purchased from Kishida Chemical Co., Ltd., and the water content of the electrolytes was less than 20 ppm.
Electrochemical measurements were carried out with a three-electrode cell.15 Lithium metal was used as both counter and reference electrodes. Unless otherwise noted, the potentials in this paper were referenced to  . We used a Solartron 1480 MultiStat (Solartron Analytical) and an SI 1255 frequency response analyzer (EG&G Princeton Applied Research) for electrochemical measurements. Cyclic voltammetry was conducted in a potential range of 0–3 V with a scan rate of
  . After cyclic voltammetry, ac impedance spectroscopy was carried out over a frequency region of 100 kHz to 10 mHz with an applied ac voltage of 5 mV. All the electrochemical measurements were conducted in an argon atmosphere.
The surface morphology of SiO was observed by scanning electron microscopy (SEM) using an S-3000H (Hitachi). SiO was charged in advance from an open-circuit potential to 0.2 V by a potential sweep method  and then held at 0.2 V for 24 h. After that, the SiO electrode was washed with DMC and dried in vacuum.
The solvation abilities of solvents toward lithium ion were studied with the density functional theory by using Gaussian 98.27 The reaction enthalpies of a lithium ion and a solvent molecule were calculated at 298.15 K. Molecular structures were fully optimized with B3LYP/6-31G(d) in advance. Single-point energies were calculated at the  (3dp, 3df) by using the optimized geometries.
Results and Discussion
Electrochemical reaction of SiO with lithium
Figure 1 shows cyclic voltammograms of SiO in an electrolyte consisting of 
 dissolved in EC:DMC (1:1 by volume). Cathodic and anodic peaks were observed in a potential range of 0–0.6 V. These peaks were attributed to the insertion and extraction of lithium ion at the SiO electrode. The anodic peak was small at the first cycle, and it gradually increased at the following cycles. These behaviors implied that the electrochemical reaction at SiO was complicated and that there were side reactions at the early cycles. To investigate the kinetics of the charge transfer at SiO, we need to know the mechanism of the electrochemical reaction at SiO.
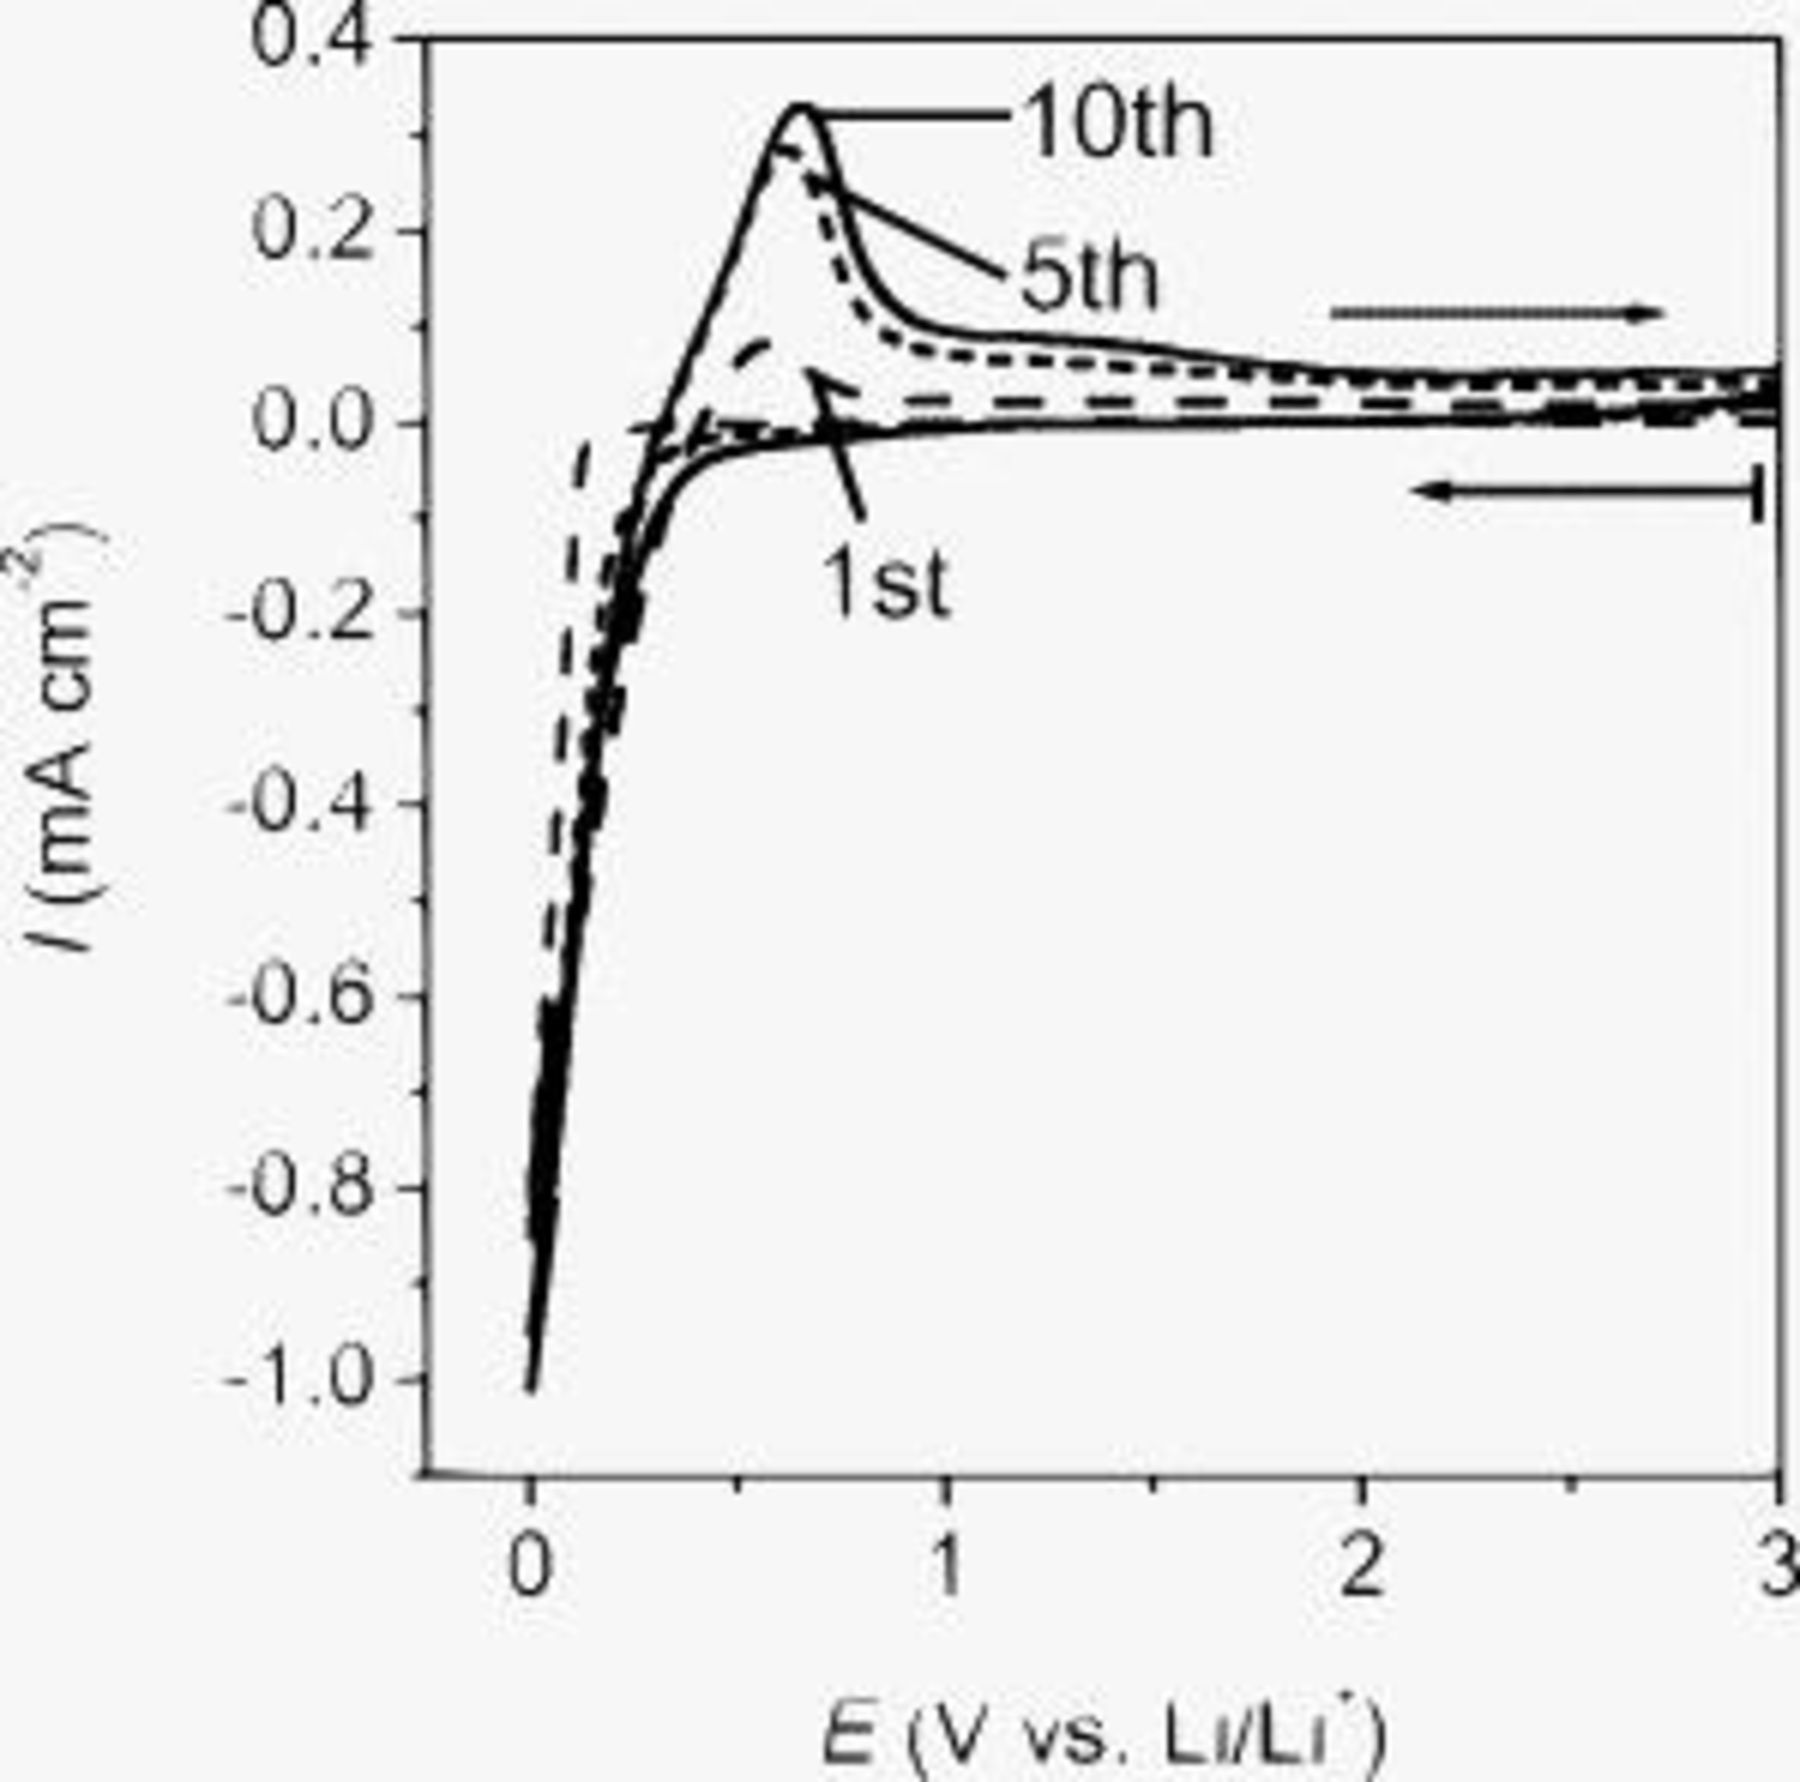
Figure 1. Cyclic voltammograms of SiO in 
 EC:DMC (1:1 by volume) at
  . The scan rate was set at
  .
.
SiO consists of two phases: amorphous Si domains and amorphous  domains (random mixture model).28, 29 Both of these two domains electrochemically react with lithium. One of the most plausible reaction mechanisms is as follows:
- (1)Amorphous Si domains:
 .
. - (2)Amorphous domains: .


Nagao et al. reported the formation of Li–Si alloys and  after the electrochemical insertion of lithium ion by neutron elastic scattering measurements.8 Miyachi et al. used X-ray photoelectron spectroscopy to elucidate that Li–Si alloys,
  , and lithium silicates were formed after the first charge.10, 11 Kim et al. verified the above reaction mechanism by a solid-state
  and
and  nuclear magnetic resonance technique, electrochemical dilatometry, and charge–discharge measurement.12 A reaction at amorphous Si domains is an alloying reaction that occurs reversibly to give the charge–discharge capacity. The cathodic and anodic peaks in a potential range of 0–0.6 V in the cyclic voltammogram were attributed to the alloying/dealloying reaction of amorphous Si domains. However, a reaction at amorphous
  domains is almost irreversible, which might be included in the cathodic peak at the early cycles of the cyclic voltammogram.
Surface morphology of SiO
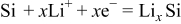
An SEM image of an as-prepared SiO electrode is shown in Fig. 2a and 2c. The surface of a SiO electrode was a particle- or needlelike structure with a size of  . To confirm that the morphology remained unchanged during ac impedance spectroscopy, we obtained SEM images of SiO that was held at 0.2 V for 24 h (Fig. 2b and 2d). There was no crack on the SiO electrode after being held at 0.2 V, and the surface morphology was almost the same as that of an as-prepared SiO electrode. As shown in Fig. 2d, there existed some precipitates on the SiO electrode after being held at 0.2 V. They were formed from the decomposition of electrolytes and were a kind of solid electrolyte interphase (SEI).
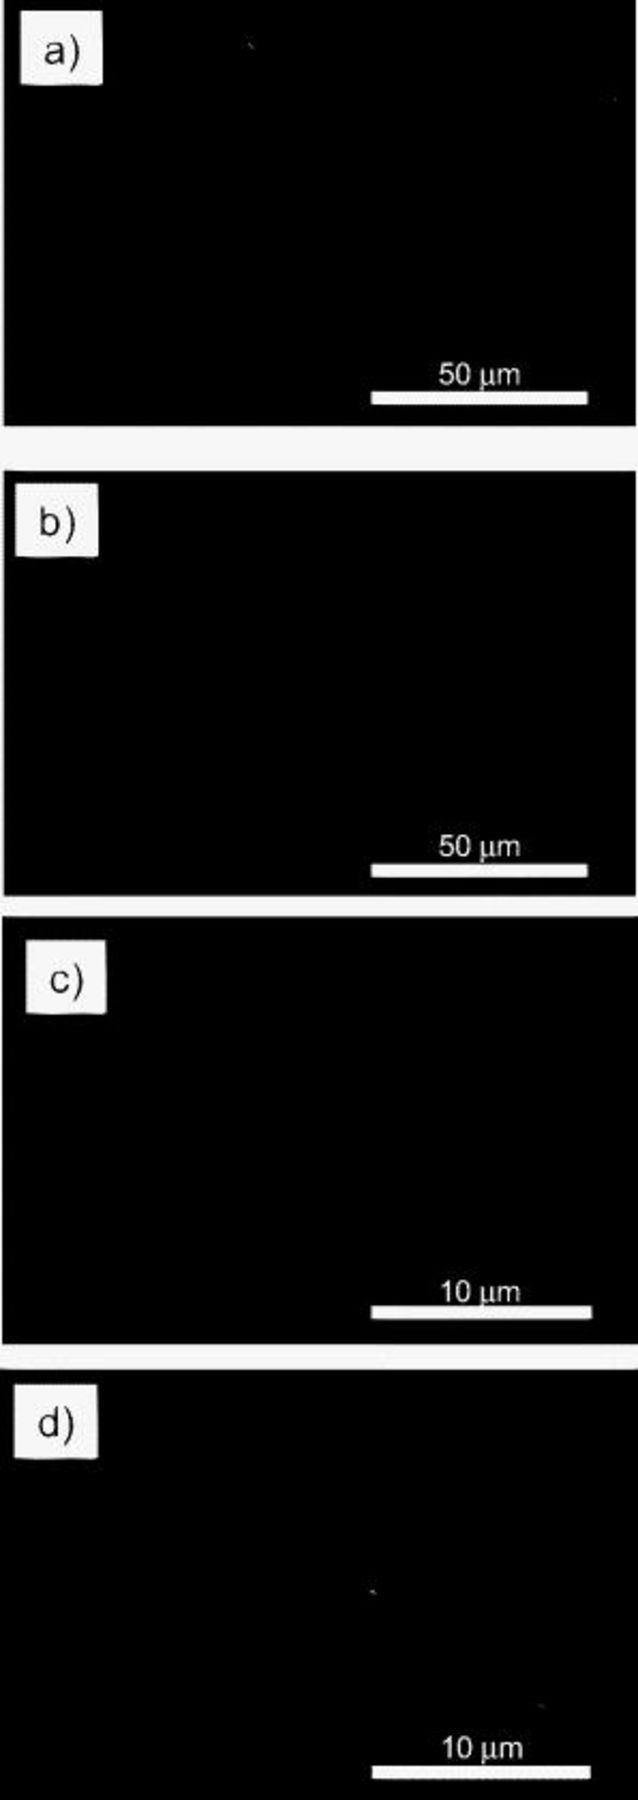
Figure 2. SEM images of SiO [(a) and (c)] as-prepared and [(b) and (d)] after being held at 0.2 V for 24 h.
AC impedance measurement of a system consisting of Cu/SiO/electrolyte/Li
Figures 3 and 4 show Nyquist plots of a SiO electrode in an electrolyte consisting of 
 dissolved in EC:DMC (1:1 by volume) at 303 K. The measurement was conducted after 10 cycles of cyclic voltammetry to make sure that the irreversible reactions (i.e., the reaction at amorphous
  domains and the decomposition of electrolytes) were terminated. Therefore, the kinetics of the alloying/dealloying reaction of the amorphous Si domains could be investigated by ac impedance spectroscopy. In the Nyquist plot at 1.7 V, one semicircle appeared at a characteristic frequency of 1 kHz. When the electrode potential was lowered to below 1.0 V, another semicircle was observed at a characteristic frequency of 1–0.1 Hz. Two semicircles and Warburg impedance were clearly observed in the Nyquist plot at 0.3 V. Because a three-electrode cell was used, the resistance from the counter electrode (lithium metal) could be neglected. Hence, this system should give the following components of resistance: (i) lithium-ion transport in an electrolyte
  , (ii) lithium-ion transport in an SEI film
  , (iii) alloying reaction resistance at amorphous Si domains (charge-transfer resistance
  ), (iv) lithium diffusion in an electrode, and (v) electron transport in an electrode and at an electrode/current collector interface
  . Among these components of resistance, the electron transport (v) and lithium-ion transport in the electrolyte solution (i) usually give no semicircle in the present frequency range due to their high characteristic frequencies. These components of resistance appeared as a
  intercept in the Nyquist plot. The lithium diffusion in an electrode (iv) gave the Warburg impedance
  , which was observed as a straight line with an angle of 45° from the
  axis. The remaining two processes [(ii) and (iii)] give their own semicircles at each characteristic frequency. The semicircle with a characteristic frequency of 1 kHz was observed at 1.7 V, at which the charge-transfer reaction could not occur. Therefore, we assigned this semicircle to the lithium-ion transport in the SEI film (ii). The other semicircle with a characteristic frequency of 1–0.1 Hz appeared only below 1.0 V. Hence, this semicircle was attributed to the charge-transfer resistance at amorphous Si domains (iii).
We configured an equivalent circuit (Fig. 3c) to evaluate the charge-transfer resistance and the ion-transport resistance in the SEI. A resistance, two resistance–capacitance parallel circuits, and a Warburg impedance were connected in series.  and
and  denote a capacitance element in an SEI and a double-layer capacitance, respectively. Depending on the shape of the semicircle, a constant phase element was properly used as an alternative for
  . The best fit of the parameters in the equivalent circuit to experimental Nyquist plots gave the values of the charge-transfer resistance and the ion-transport resistance in the SEI.

Figure 3. (a) Nyquist plots of SiO in 
 /EC:DMC (1:1 by volume) at various potentials after 10 cycles. (b) Enlarged figure of the Nyquist plots at a high frequency region. (c) Equivalent circuit used for fitting the Nyquist plots.
The Nyquist plots showed a drastic change in a potential range of 0.30–0.20 V (Fig. 4). Figure 5 shows the potential dependence of the charge-transfer resistance  , the ion-transport resistance in the SEI
  , and the sum of the electron-transport resistance
  and the lithium-ion transport resistance in the electrolyte
  . The
. The  value significantly decreased in a potential range of 0.27–0.24 V and then disappeared below 0.24 V. This variation in
  was attributed to the change in the activity of lithium in the Li–Si alloy. The
  and
and  values also varied with decreasing potentials in a range of 0.26–0.22 V, and these changes were reversible. The change in
  was derived from the increasing electronic conductivity of amorphous Si domains due to the alloying with lithium. The reversible change in
  was caused by the volume changes of SiO. This hypothesis is supported by the report of Kim et al.12 They observed a significant expansion of the SiO electrode below 0.25 V. In our study, the
  value also changed significantly below 0.26 V, as shown in Fig. 4 and 5. Therefore, the volume change in SiO was a major cause of the change in
  , although the detailed mechanism was not clear in this work. An important result here is that
  was smaller than
  below 0.24 V. These results imply that the charge-transfer reaction at a SiO electrode is relatively fast.
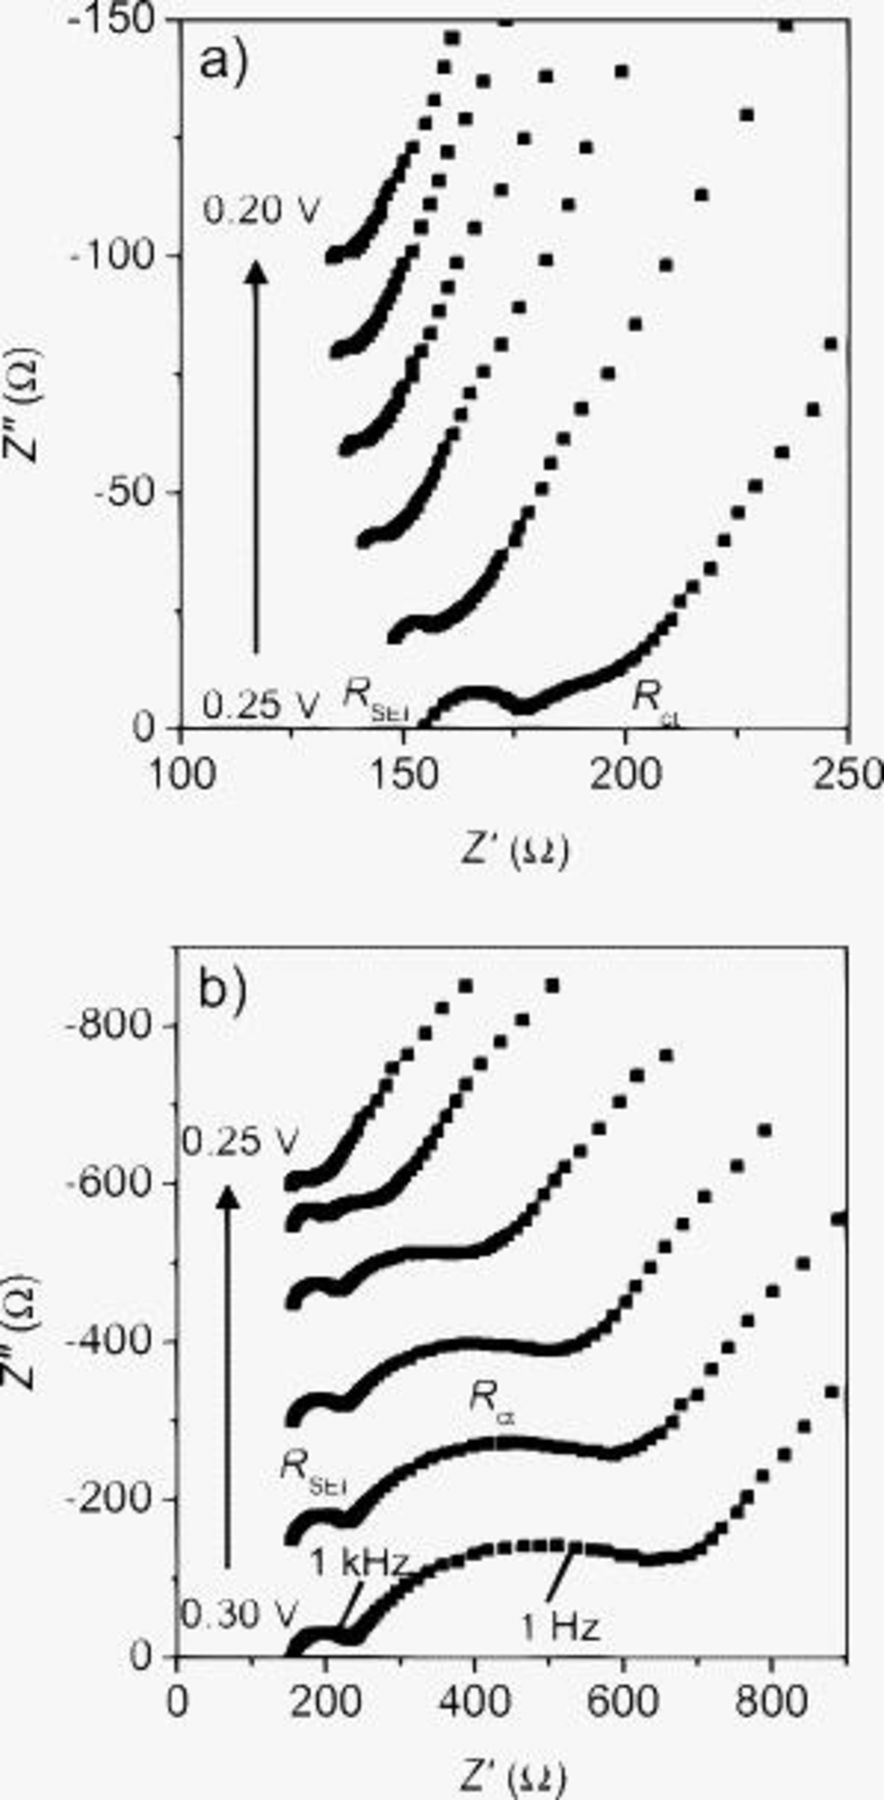
Figure 4. Nyquist plots of SiO in 
 /EC:DMC (1:1 by volume) after 10 cycles. The potential was changed to 10 mV in the ranges of (a) 0.20–0.25 and (b) 0.25–0.30 V.
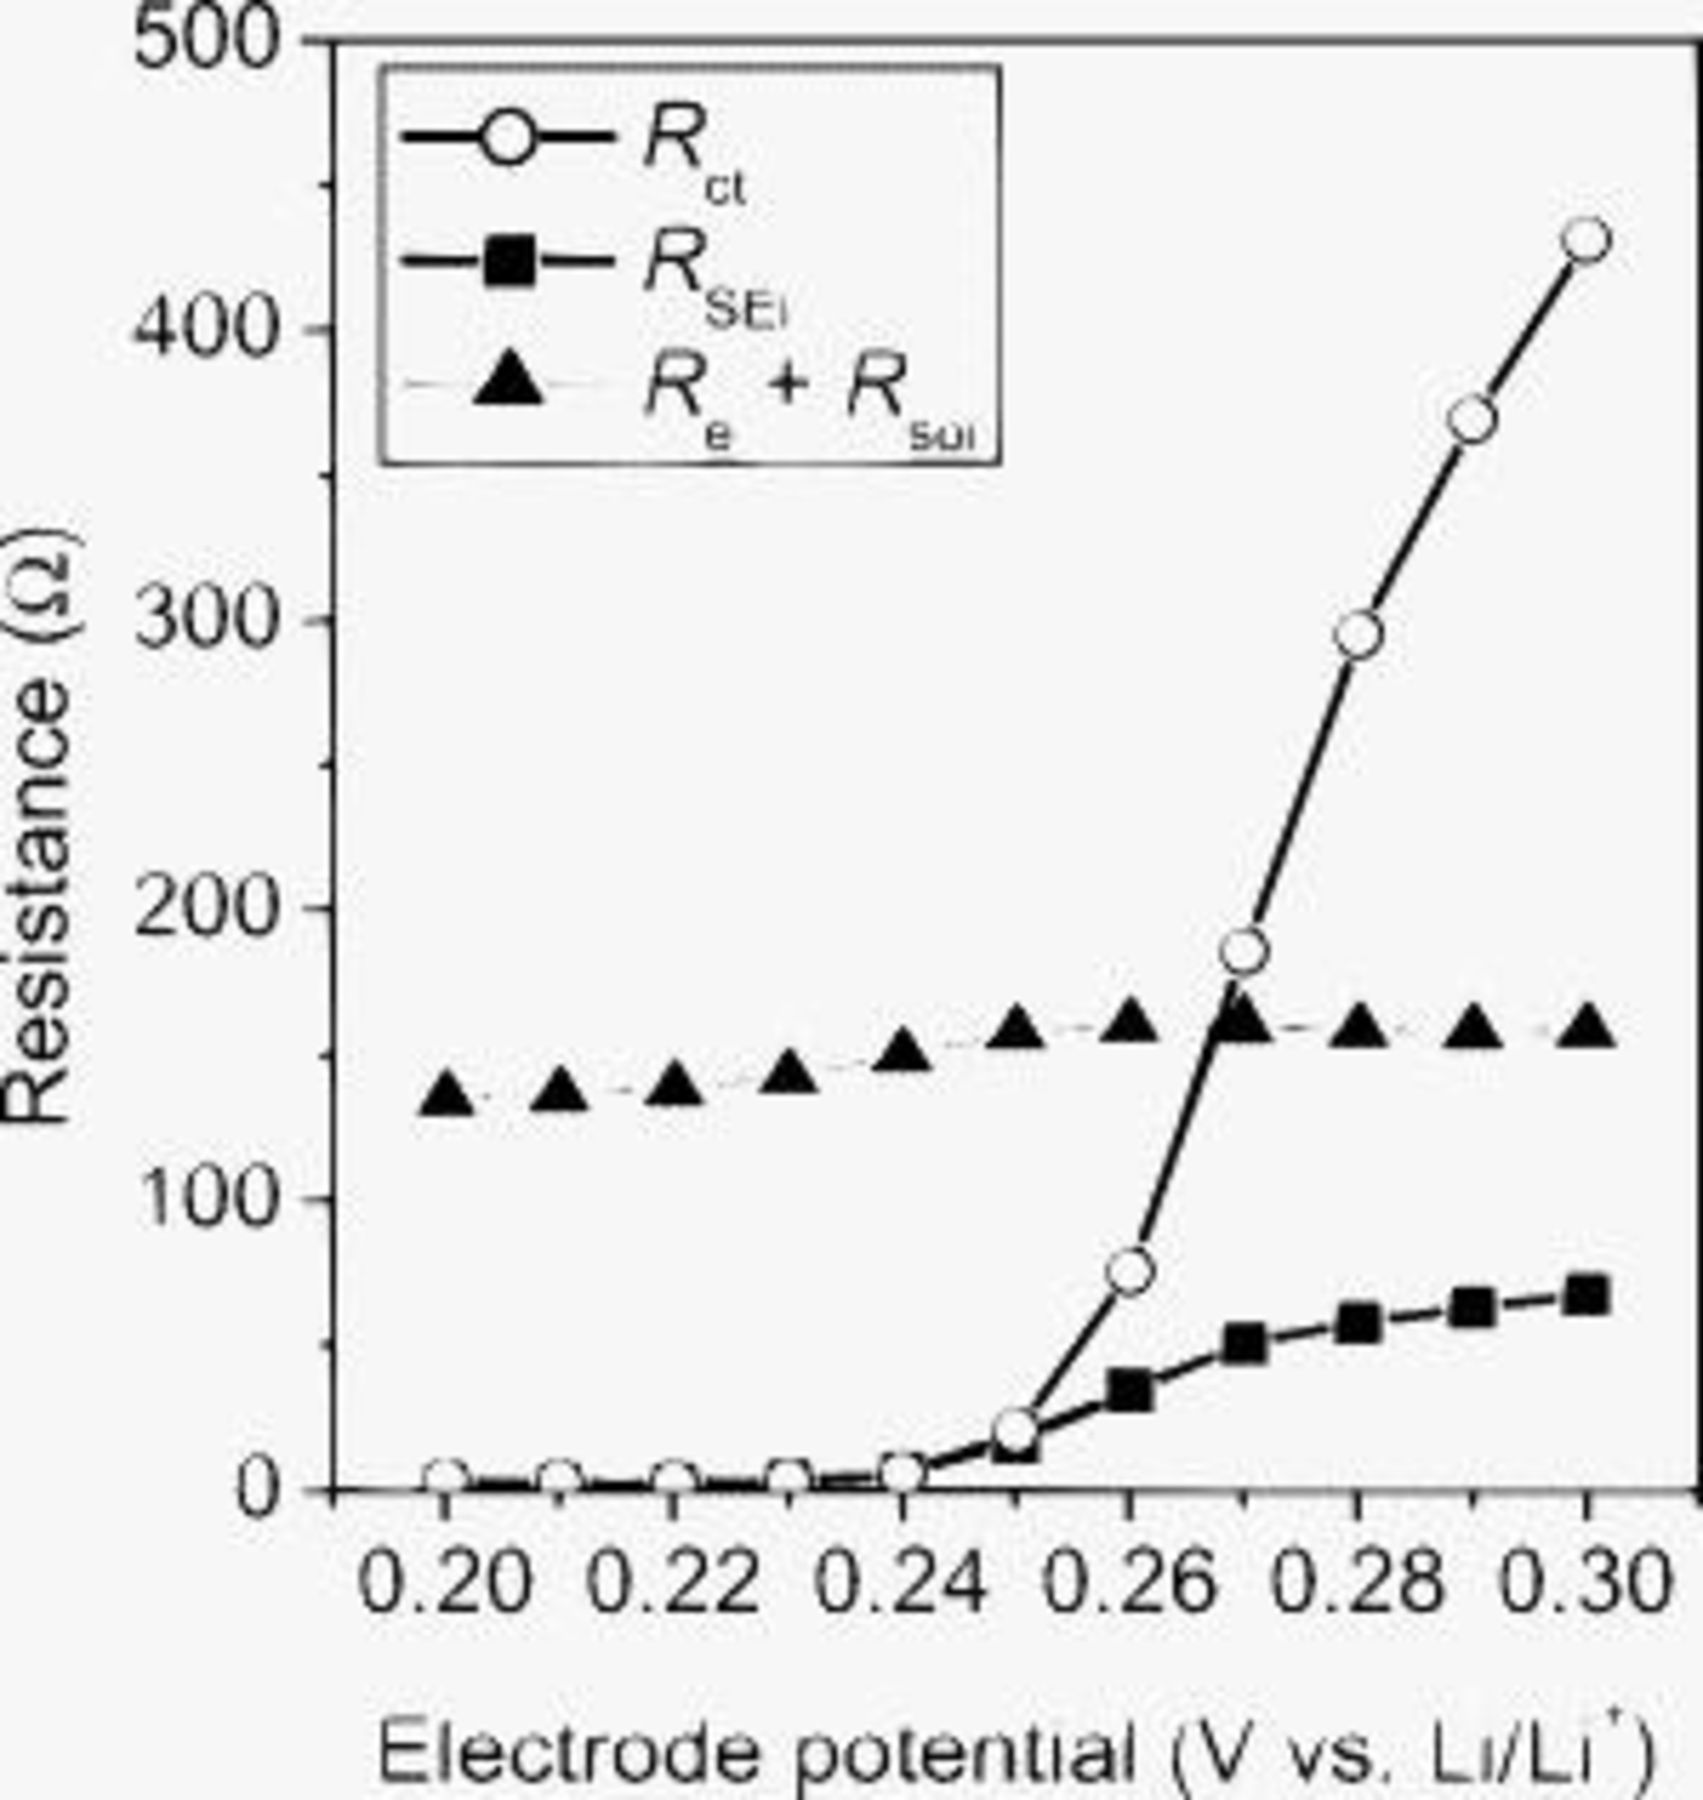
Figure 5. Potential dependence of the charge-transfer resistance  , the ion-transport resistance in the SEI
  , and the sum of the electron-transport resistance
  and the lithium-ion transport resistance in the electrolyte
  .
.
Activation energies of charge transfer at SiO
The interfacial conductivity  obeys the Arrhenius equation

where the symbols  ,
,  ,
,  , and
, and  denote frequency factor, activation energy, gas constant, and absolute temperature, respectively. Hence, the charge-transfer resistance depends on two factors, the activation energy and the frequency factor. We used the activation energy to discuss the kinetics of the charge-transfer reaction at SiO. A study on activation energies is useful for a clear discussion because the activation energy values indicate the essential kinetics of the reaction without the influences of effective surface area, activity of reactants, and temperature.
Figure 6 shows the Arrhenius plots of the interfacial conductivities  at SiO at 0.4 V in various electrolytes. The activation energies of the charge-transfer reaction were evaluated from the slopes of the Arrhenius plots according to the Arrhenius equation (Eq. 1). The activation energies were around
  in the four electrolytes. These values are small compared to those at other electrodes. When a graphite electrode was used, the activation energy of the charge-transfer process was reported to be
  in EC-based electrolytes.14, 15 In positive electrode materials such as
  and
and  , the activation energies were evaluated to be around
  in PC-based electrolytes.16, 17 Therefore, the small activation energies at SiO suggest that the charge-transfer reaction at SiO is much faster than those at other insertion electrodes.
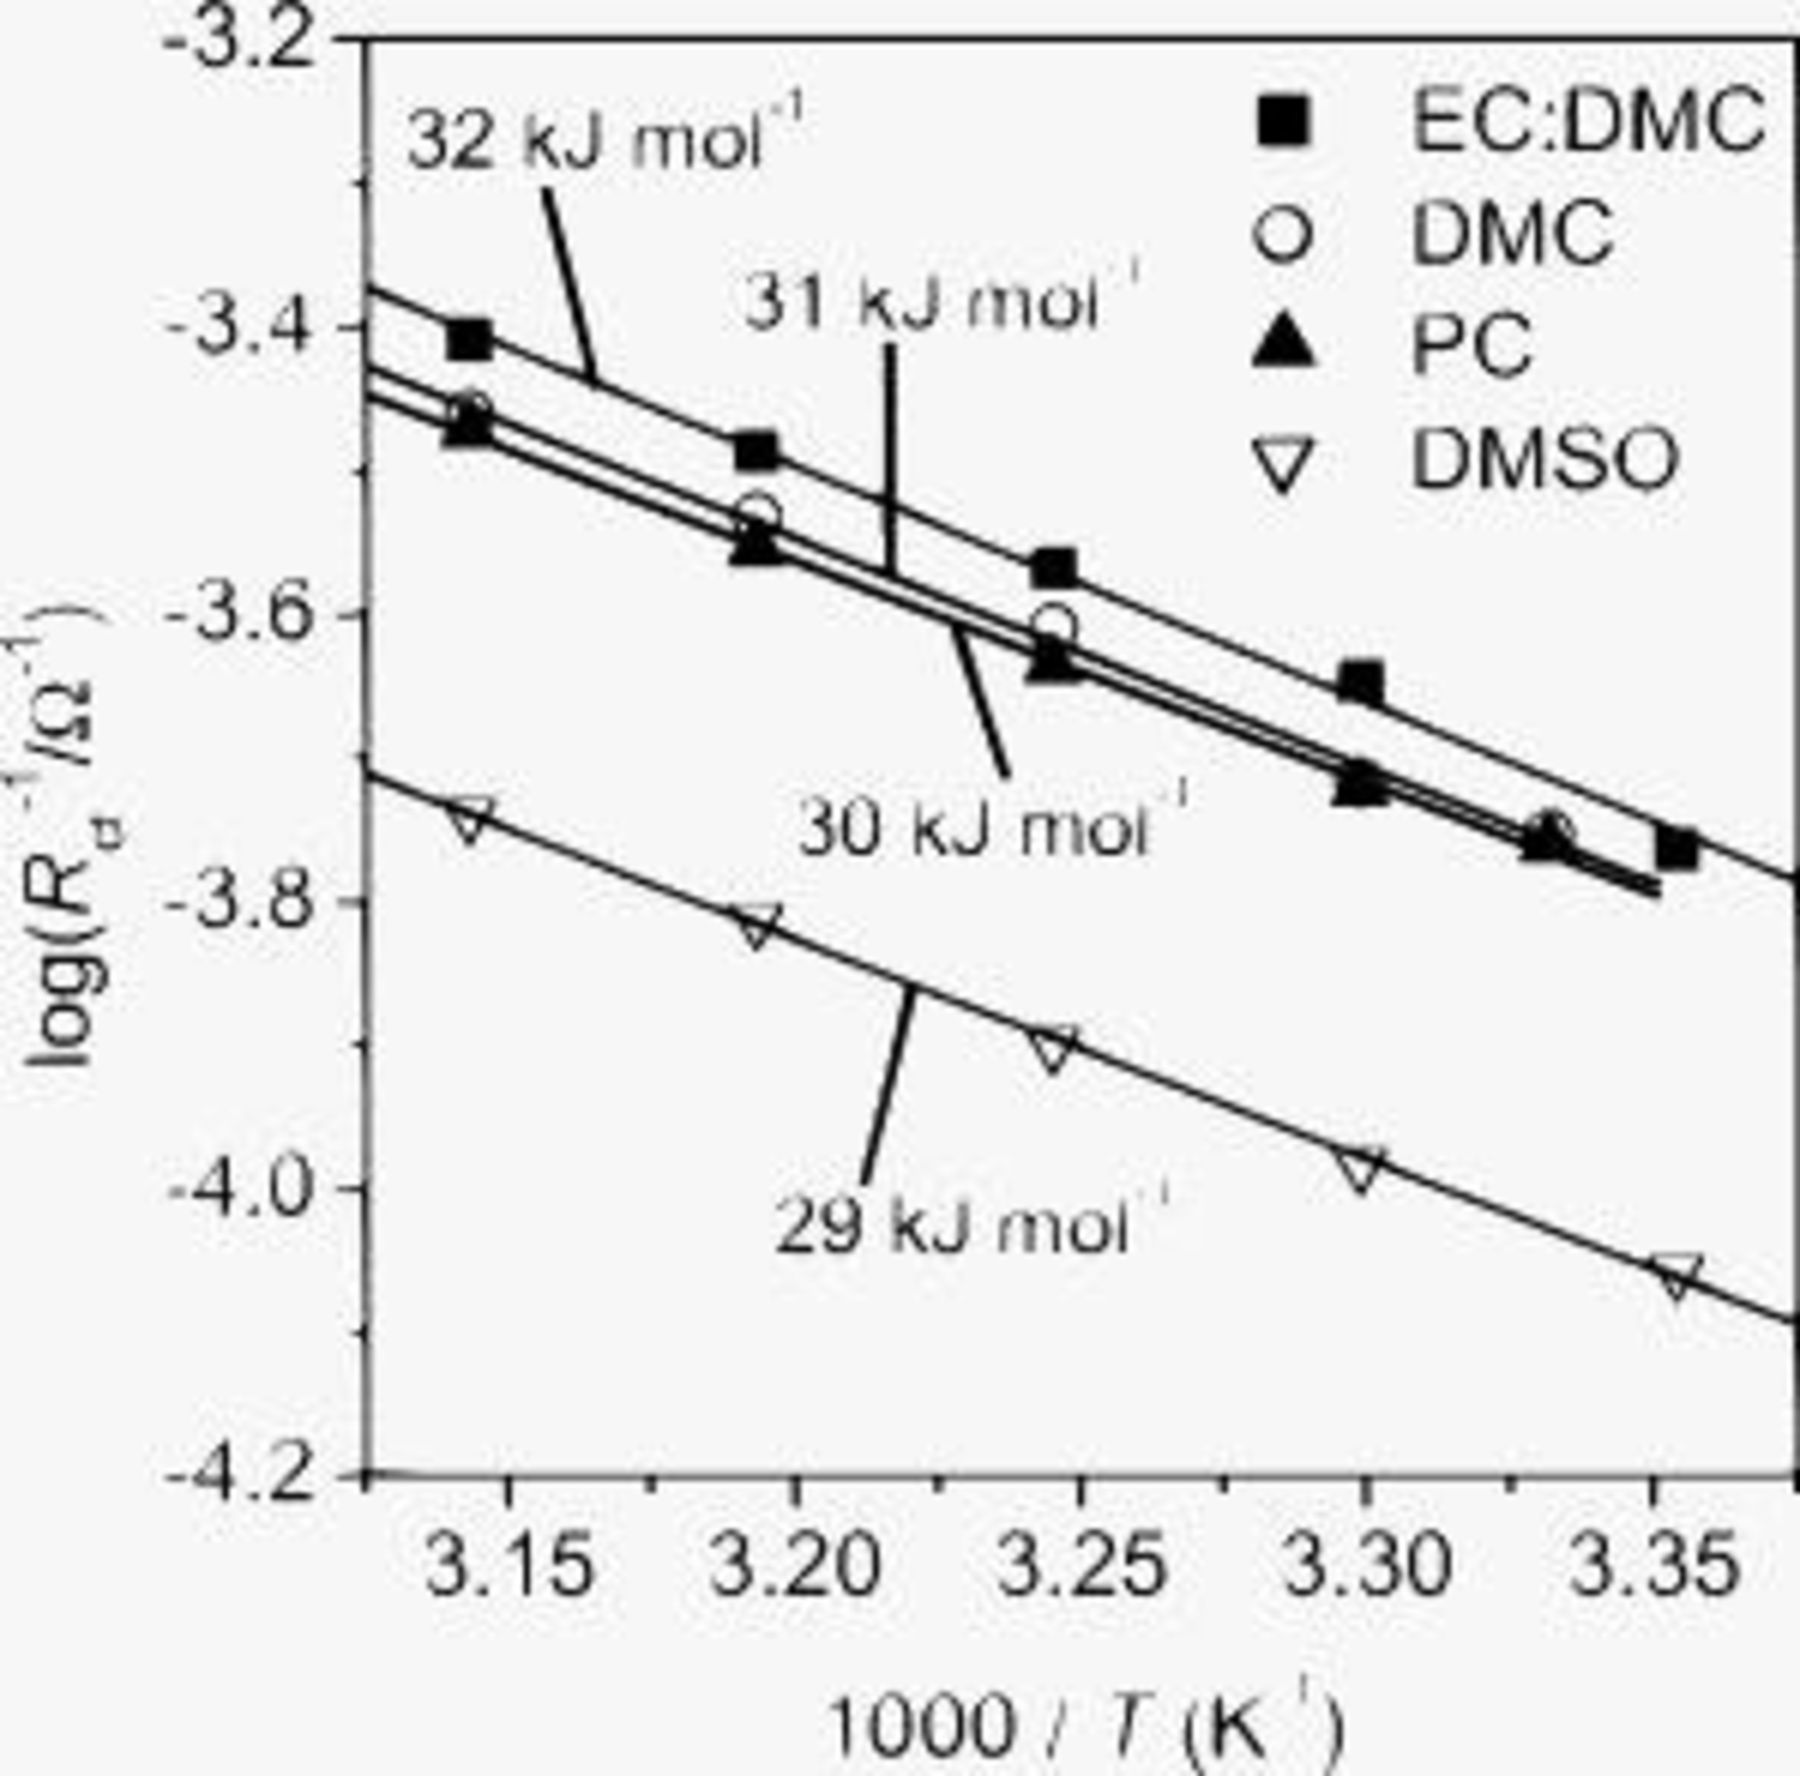
Figure 6. Temperature dependences of interfacial conductivities  at SiO in various electrolytes. The interfacial conductivities were obtained from the Nyquist plots at 0.4 V in the temperature range of
  .
.
One of the important points of the present paper is the effect of the desolvation of lithium ion during the insertion of lithium ion into the SiO electrode. Our group studied the kinetics of charge (lithium ion) transfer at various interfaces and reported that the desolvation of lithium ion was the rate-determining step of charge-transfer reactions, resulting in large activation energies (around  or more).14, 15, 18, 19 In the SiO electrode, however, the extremely small activation energies (around
  ) of the charge-transfer reaction suggest that the desolvation of lithium ion does not influence the charge transfer at SiO.
A comparison of activation energies in various electrolytes supports this hypothesis about the effect of the desolvation of lithium ion. Table I shows activation energies of charge (lithium ion) transfer at interfaces consisting of various solid and liquid phases. The activation energies greatly varied at a graphite/liquid electrolyte interface15 and ideal interfaces17, 18 consisting of a solid electrolyte [ (LLT) or Li–Al–Ti-phosphate-based glass] and a liquid electrolyte. The activation energies of charge transfer at these interfaces depended on the enthalpy changes of the reaction
  calculated with the density functional theory by Gaussian 98.27 Because the enthalpy changes indicate the solvation abilities of solvents, the correlation between the activation energies and the enthalpy changes suggests that the activation energies reflect the energy for desolvation of lithium ion from the solvent. In the SiO electrode, however, the activation energies of charge transfer remained unchanged at around
  in the four electrolytes. Based on these results, the kinetics of the charge transfer at SiO is not influenced by the compositions of electrolytes and that the desolvation of lithium ion is not the rate-determining step of the charge transfer at SiO.
Table I. Activation energies of charge (lithium ion) transfer at the interfaces consisting of various solid and liquid phases.
| Solvent | Enthalpy change   |
 
| ||
|---|---|---|---|---|
| Solid electrolyte18, 19 | Graphite14, 15 | SiO | ||
| DMSO | −235.5 | 70 | Cointercalation | 29 |
| PC | −217.1 | 57 | Exfoliation | 30 |
| EC:DMC (1:1) | −210.3 (EC) | 51 | 58 | 32 |
| DMC | −190.3 | 32 | 40 | 31 |
| Fluoroethylene carbonate | −185.5 | 32 | — | — |
aReaction enthalpy of the reaction  . bSolid
  glass electrolyte (OHARA glass). cSolid
  .
.
The results in the present study indicate that the kinetics of the electrochemical reaction at SiO is quite different from those at other insertion electrodes. As discussed above, the electrochemical reaction at SiO is the alloying/dealloying reaction at the amorphous Si domains. We consider that the absence of the effect of the desolvation is inherent in the alloying/dealloying reaction. Although the detailed mechanism is not yet clear, the small activation energies at SiO suggest that the SiO electrode has a kinetic advantage over other insertion electrodes such as graphite.
Conclusions
The activation energies of charge (lithium ion) transfer at the SiO electrode were small compared to those at other insertion electrodes such as graphite. Therefore, the SiO electrode has an advantage in the kinetic aspect over other electrodes. Furthermore, the activation energies of charge transfer at SiO remained unchanged in various electrolytes. These results suggest that the charge-transfer kinetics at SiO is not influenced by the desolvation of lithium ion, which is the rate-determining step of charge transfer at other electrodes.
Acknowledgments
The authors are grateful to Sumitomo Titanium Corporation (Japan) for providing the SiO electrode. This research was supported in part by the Global COE Program "International Center for Integrated Research and Advanced Education in Materials Science" (no. B-09) of the Ministry of Education, Culture, Sports, Science and Technology (MEXT) of Japan, administrated by the Japan Society for the Promotion of Science.
Kyoto University assisted in meeting the publication costs of this article.