
Abstract
Nanoplate  is synthesized by a polyol route starting from only two reactants, namely,
  and LiOH. The crystalline compound forms by refluxing a tetraethylene glycol solution consisting of
  and LiOH at
  without further heating of the reaction product. The nanoplates have average dimensions of 30 nm width and 160 nm length, as measured from transmission electron microscopy micrographs. The surface area of the
  sample is
  . Also, the sample is porous with a broadly distributed pore around 50 nm. The electrodes fabricated out of the nanoplate of
  exhibit a high electrochemical activity. Discharge capacity values measured are 160 and
  at 0.15C and 3.45C, respectively. A stable capacity of about
  is measured at 0.2C over a 50 charge–discharge cycle.
Export citation and abstract BibTeX RIS
Rechargeable Li-ion batteries are state-of-the-art power sources for portable electronic devices such as wireless phones, laptop computers, and camcorders due to their high energy density, high operating voltage, and long cycle life.1 Most of the present lithium batteries employ transition-metal oxides such as  and
and  or mixed metal oxides as the active cathode materials. However, they are relatively expensive and suffer from poor chemical/electrochemical stability.2, 3 In 1997, Padhi et al.4 examined phosphate-based electrode materials, namely, the olivine compounds
  (where
  , Mn, Co, and Ni), for use as cathode materials for Li-ion batteries. Among them,
  is of interest as it offers a high theoretical discharge capacity
  , a low toxicity, and a high thermal stability, and it is also cheap due to the natural abundance of iron.4–8 However, the electronic conductivity of
  is rather low
  .9 There have been considerable efforts in recent years to increase electronic conductivity by cationic doping, molecular wiring, decreasing the particle size, coating with electronically conducting agents, etc., and also to enhance the electrochemical performance of
  .9–21 Nanostructured materials provide short diffusion lengths for both
  -ion diffusion and electron transport in comparison with micrometer particles and therefore can enhance the charge–discharge rates.22 Several procedures for the synthesis of nanostructured
  are reported, which include the hydrothermal process,23 sol–gel,18 polyol process,24–27 microemulsion,28 vapor deposition,29 co-precipi- tation,30 solvothermal methods,31 and so on. In particular, a polyol mediated synthesis turns out to be quite advantageous in the preparation of nanostructured materials.32 The polyol method is used for the preparation of elemental metals and alloys. Besides metals, this method of synthesis is suitable for the preparation of manifold of binary and ternary oxides as well as phosphates, sulphides, and so on.32 In general, a polyol acts not only as a solvent for the reactants but also as a reducing agent. Furthermore, it efficiently forms complexes with the surface of the particles. Consequently, the particle growth is limited and agglomeration is prohibited. Due to the medium temperature during synthesis, normally well crystallized materials are formed. The reaction scheme involves the dissolution of the solid reactants, then the reduction of dissolved species by polyol, and the nucleation of the product sample followed by growth.33
The polyol route was recently employed by Kim et al.24 and by Kim and Kim25, 26 for the synthesis of  . In this synthesis, three reactants, namely, Fe(II) acetate,
  , and LiOH, were used in polyol media. Recently, Prosini et al.34 synthesized amorphous
  by chemical lithiation of
  by LiI in acetonitrile for 24 h. The so formed amorphous
  was heated at
  for 1 h in reduced atmosphere. Preparation procedures reported are complex, which generally involve three reactants as sources for Li, Fe, and P, respectively. Furthermore, conversion of amorphous
  into a crystalline compound requires an additional step of heating at high temperatures for several hours. The preparation of
  involving simple and easy procedures is desirable, using as less number of reactants as possible. Furthermore, if the crystalline sample is obtained directly from the reaction without involving a heating step, the synthetic procedure is far more attractive. By additional heating of the compound, the particle size increases. To the best of the authors' knowledge, there are no reports in preparation of nanoscale crystalline
  employing only two reactants, namely,
  and LiOH, in a polyol medium without an additional heating procedure.
In the present study, the nanoplate of  was prepared using only two reactants, namely,
  and
and  in tetraethylene glycol (TEG) as the polyol medium at
  . The crystalline, porous product directly obtained from the reaction medium exhibits high charge–discharge cyclability as well as high rate capability.
Experimental
Analytical grade chemicals, namely, lithium hydroxide (SD, Fine Chemicals), iron phosphate (Aldrich), TEG (Kemphasol), 0.38 mm thick lithium foil (Aldrich), poly(vinylidene fluoride) (PVDF, Aldrich), acetylene black (AB, Alfa Aesar), 1-methyl-2-pyrrolidinone (NMP, Aldrich), ethylene carbonate (EC, Aldrich), dimethyl carbonate (DMC, Aldrich), and  (Aldrich), were used as received. Iron phosphate
  and lithium hydroxide
  were dissolved in TEG in a stoichiometric molar ratio (1:1). The solution was then heated at
  for 12 h in a round bottom flask attached to a reflux condenser. In about 3 h, the product
  started forming. As the surface of the growing particle was complexed by TEG, the growth was limited. Apparently, TEG acts as a soft template in directing the growth of the nanoparticle to a nanoplate through the formation of a hydrogen bond. Saravanan et al.35 reported the formation of the nanoplate of
  by the hydrothermal method through the trapping of cations in the reaction mixture by a hydrogen bonding network, which controls the growth of
  . The precipitate was filtered, washed with acetone several times, and dried in a vacuum oven at
  overnight to get the final product of
  .
.
For electrochemical characterization, electrodes were prepared on aluminum foil (0.2 mm thick) as a current collector. A circular Al foil with an area of  was polished with successive grades of emery, cleaned with detergent, etched in dilute
  , washed with doubly distilled water, rinsed with acetone, dried, and weighed.
  (80 wt %), AB (15 wt %), and PVDF (5 wt %) were ground in a motor; a few drops of NMP were added to form a syrup. It was coated onto the pretreated Al foil (area:
  ) and dried at
  for a few minutes. Coating and drying steps were repeated to get the required loading level (4–6 mg) of the active material. The electrodes were finally dried at
  under vacuum for 12 h, and then they were pressed at a pressure of 25 kN by a hydraulic press. Electrochemical cells were assembled in home-made Swagelok-type poly(tetrafluoroethylene) cell holders using Li foil for both the counter electrode and the reference electrode. A glass mat soaked in an electrolyte was used as the separator. The electrolyte was 1 M
  in a mixed (1:1) solvent of EC and DMC. The solvents were repeatedly treated with molecular sieves (4 Å) before preparing the electrolyte. Cells were assembled in an MBraun argon-atmosphere glove box (model UNILAB).
Powder X-ray diffraction (XRD), scanning electron microscopy (SEM), transmission electron microscopy (TEM), X-ray photoelectron spectroscopy (XPS), and  adsorption/desorption isotherms were recorded using a Bruker AXS D8 diffractometer using
 as the source, a scanning electron microscope (model Sirion, FEI Co.), a high resolution transmission electron microscope (model Tecnai T20), a SPECS photoelectron spectrometer (Phoibos 100 MCD energy analyzer) with monochromatic
  radiation (1253.6 eV), and a Micromeritics surface area analyzer (model ASAP 2020), respectively. Cyclic voltammograms (CVs) and charge–discharge cycling of the cells were recorded using Bio-Logic SA multichannel potentiostat/galvanostat (model VMP3) and a Bitrode battery cycle-life tester, respectively. The impedance spectra were recorded potentiostatically at an open-circuit potential of 2.5 V in the discharge state, with an ac excitation signal of 5 mV (peak to peak) over a frequency range from 100 kHz to 0.01 Hz using a Solartron potentiostat/galvanostat (model 1287) in combination with a Solartron frequency response analyzer (model 1255B). Impedance data were subjected to the nonlinear least-squares (NLLS) fitting procedure. Reproducibility of electrochemical data was ensured by repeating the experiments with at least another electrode of the same sample. Only representative results are presented. The ambient temperature experiments were carried out at
  in an air-conditioned room.
Results and Discussion
The XRD patterns of  used for the synthesis and the product formed are shown in Fig. 1.
  is in an amorphous state. After dissolving in TEG and refluxing in the presence of LiOH at
  , the product obtained is crystalline. The diffraction pattern of the product agrees well with JCPDS file no. 40-1499 for a pure orthorhombic phase of
  . The sample was not heated after the synthesis to get the crystalline product unlike the studies reported18, 23, 28–30, 32 wherein heating of precursors at temperatures greater than
  in the absence of air is essential.
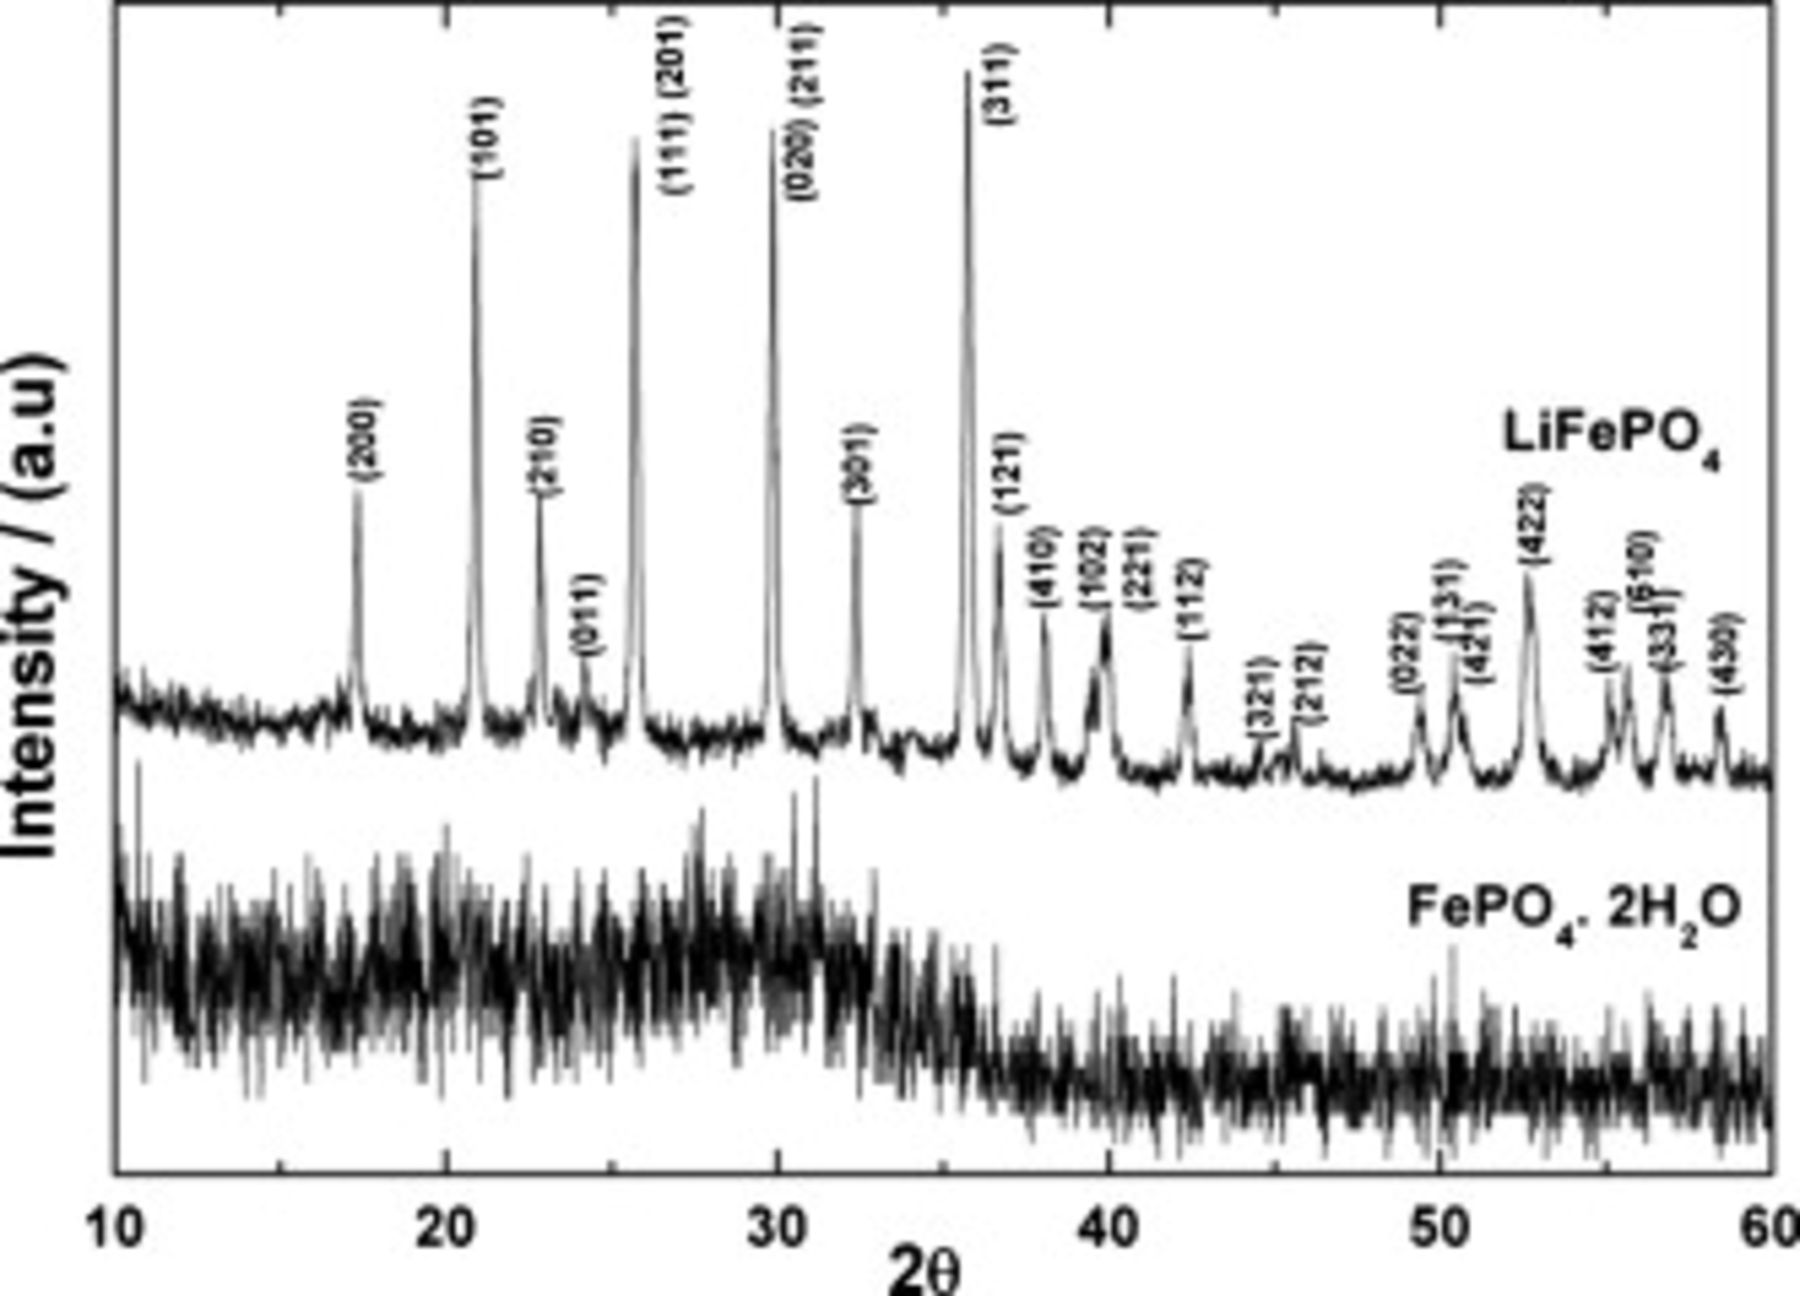
Figure 1. Powder XRD patterns of (i)  and (ii)
  obtained by polyol route.
The SEM micrograph of  is shown in Fig. 2. The sample consists of platelike particles in nanoscale dimensions. The average plate size with a 30 nm width and a 160 nm length is measured from the TEM micrograph, as shown in Fig. 3A and 3B. The
  adsorption/desorption isotherm of
  recorded at 77 K is shown in Fig. 4. The Brunauer–Emmett–Teller surface area value measured from the adsorption isotherm in the
  range between 0.01 and 0.28 is
  . Porosity characteristics36 are reflected in the Barrett–Joyner–Halenda curves shown in the inset of Fig. 4. There is a broad distribution of porosity around a pore diameter of 50 nm.
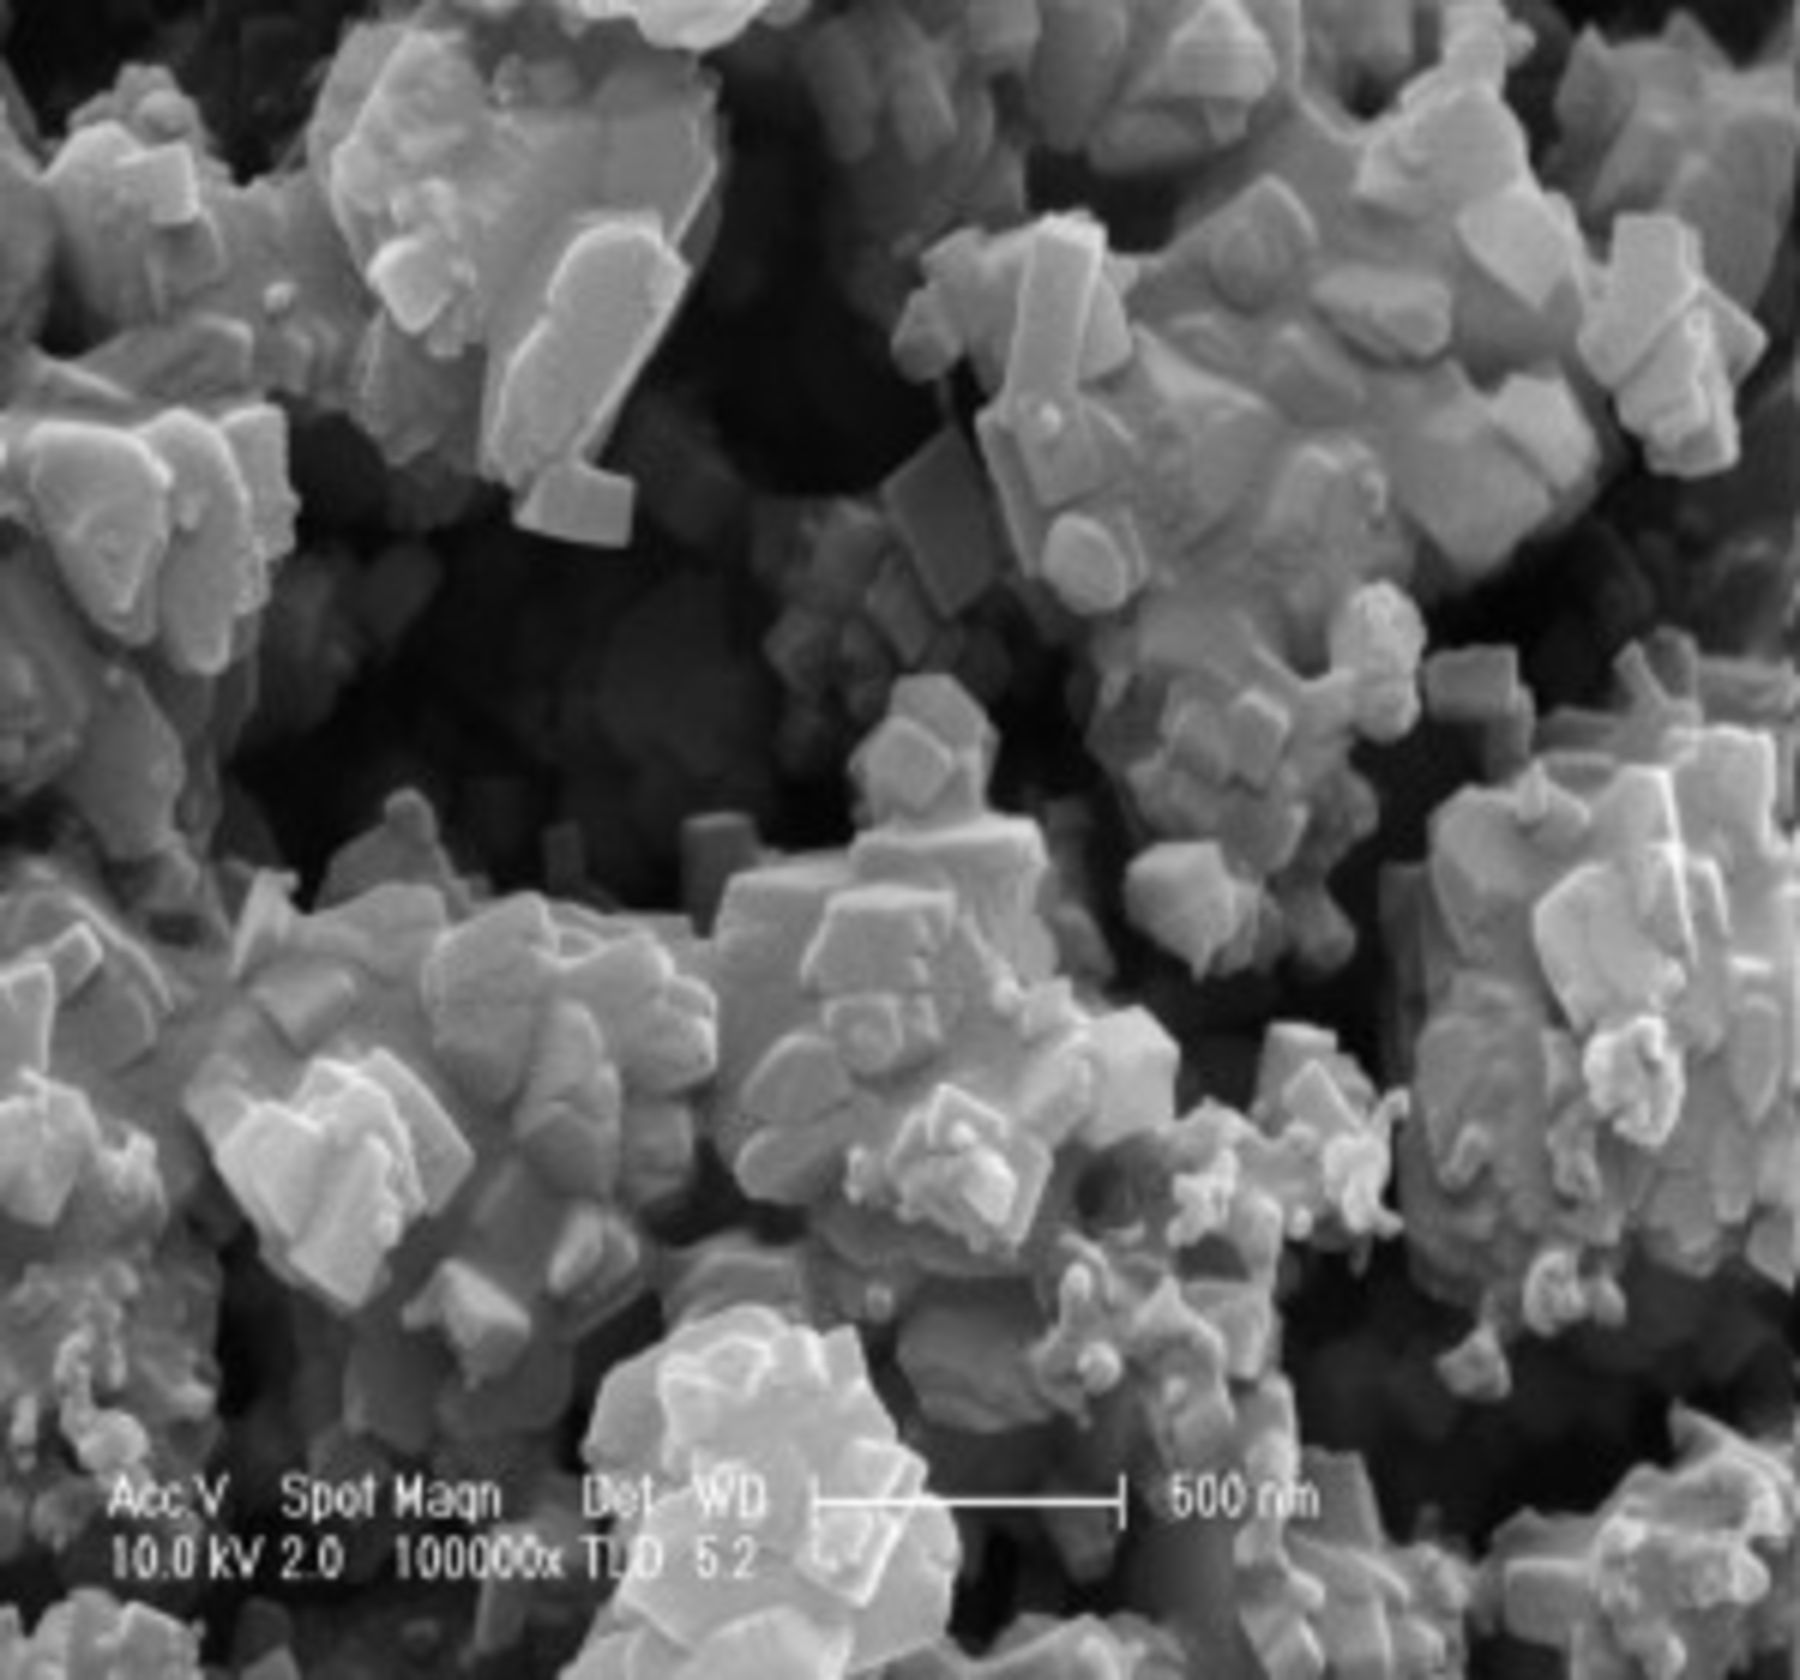
Figure 2. SEM image of  prepared by polyol route.
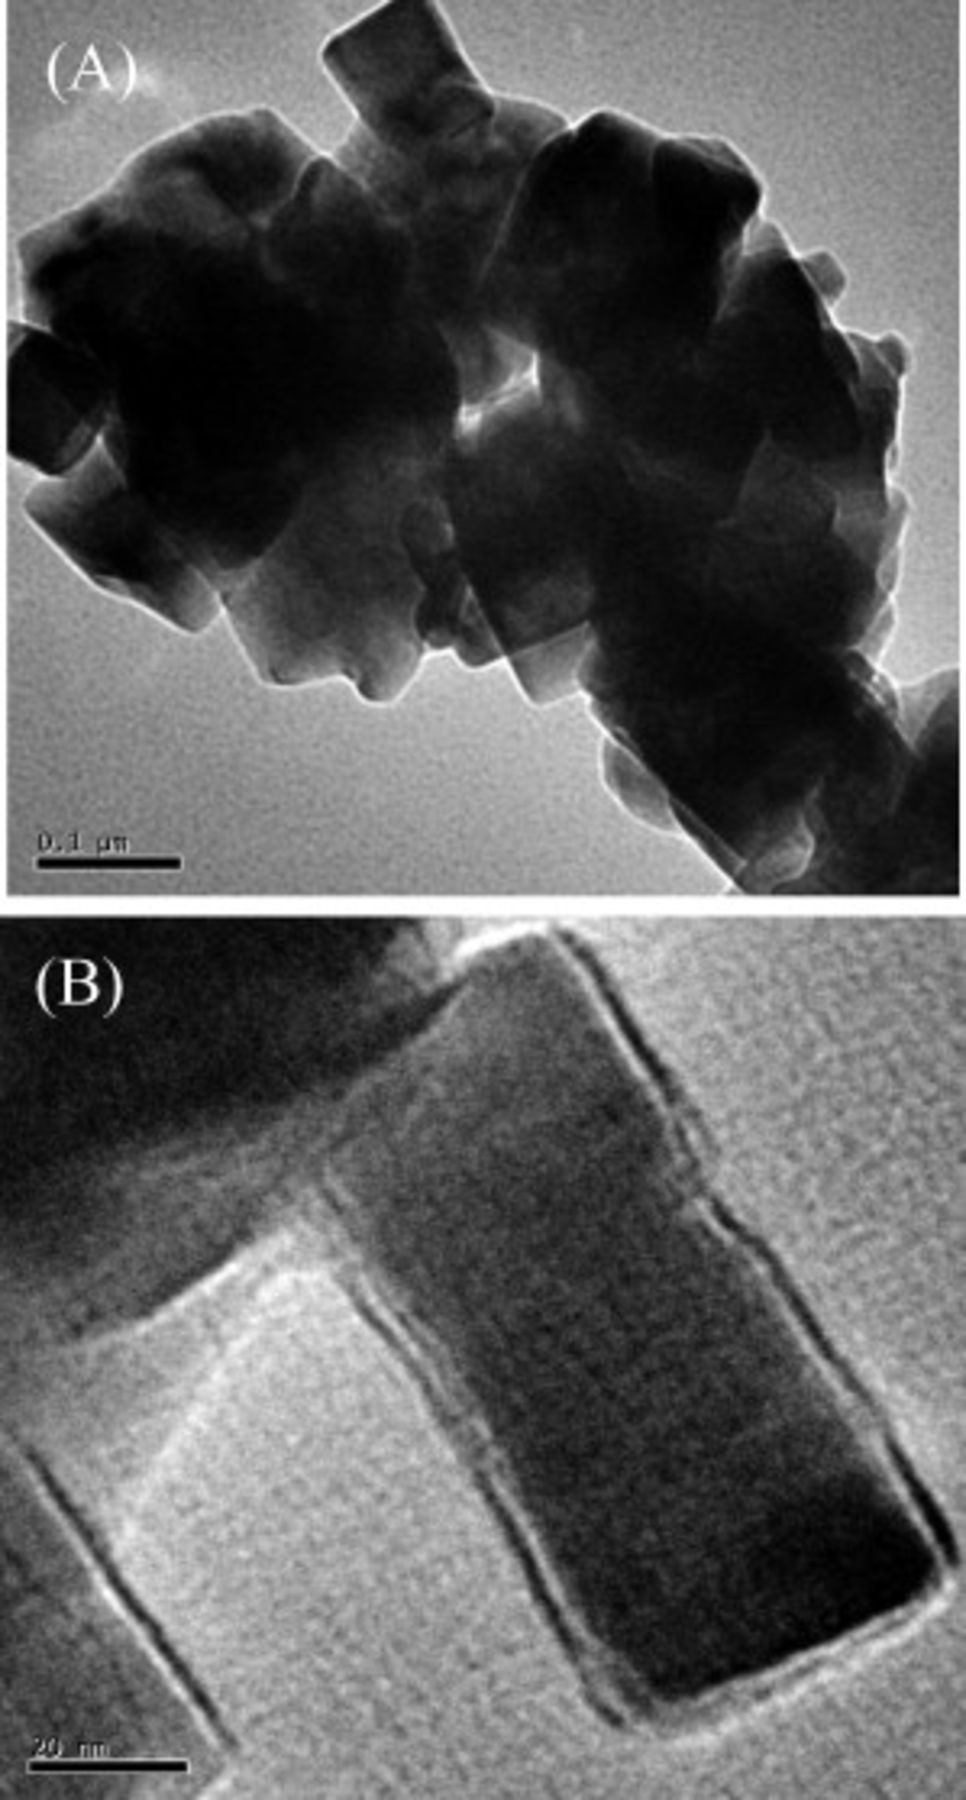
Figure 3. (A) The TEM image of  sample prepared by polyol route and (B) a magnified image of nanoplate
  .
.
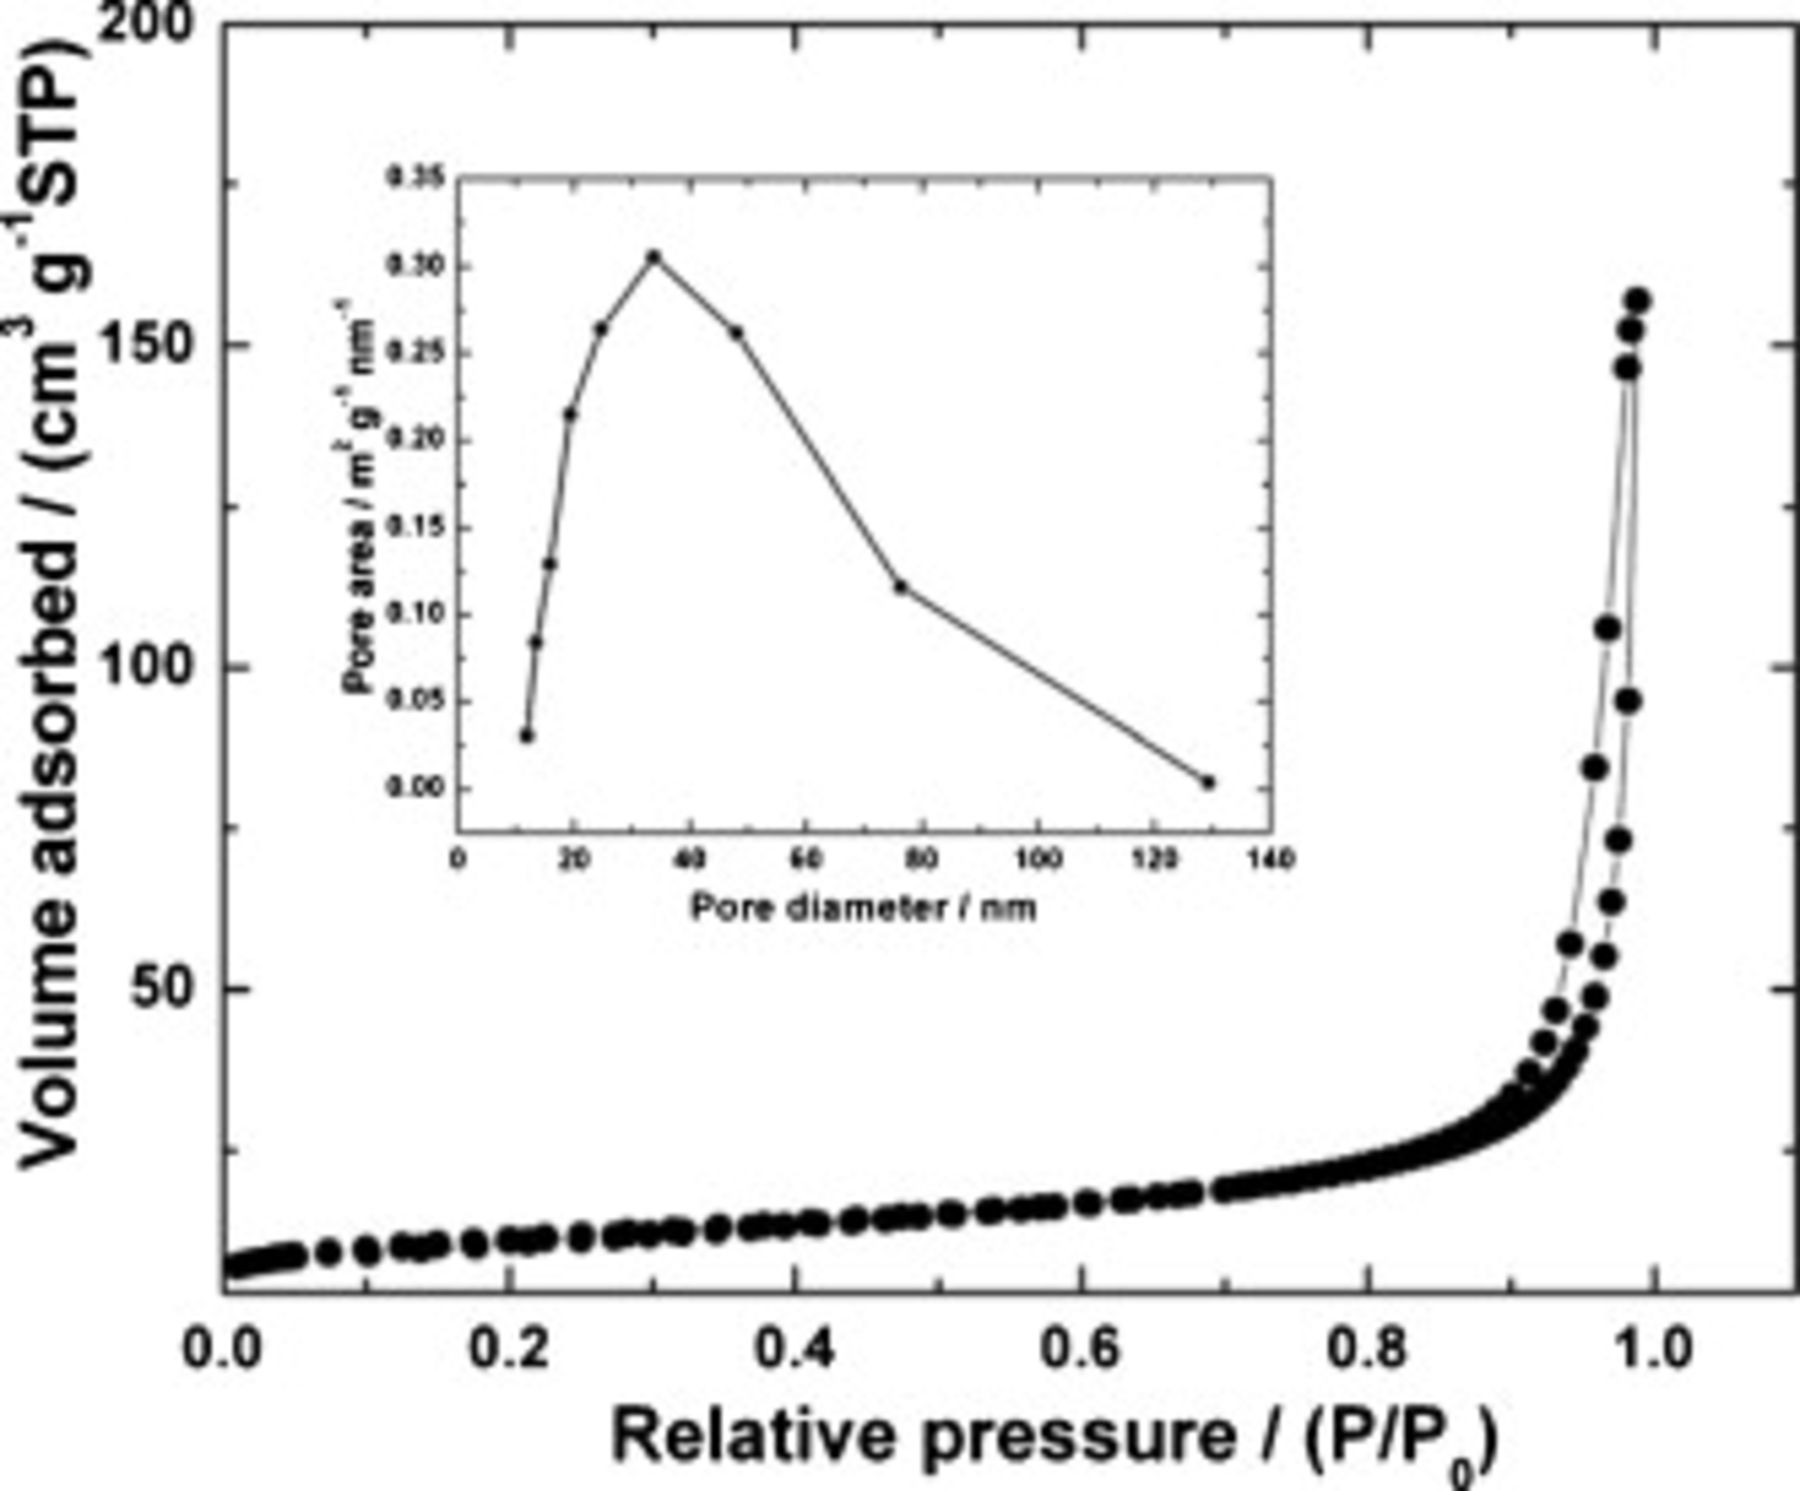
Figure 4. Nitrogen adsorption–desorption isotherm and pore size distribution (inset) of  at 77 K.
The core level XPS spectra for Li 1s, Fe 2p, P 2p, and O 1s for  are shown in Fig. 5. In the Li 1s spectrum (Fig. 5A), the symmetrical peak at a binding energy of 55.85 eV agrees with the reported value for
  33 and layered cathode materials. The
  peak in Fig. 5B with a binding energy of 710.6 eV corresponds to
  in
in  . However, due to multiple splitting of the energy levels, an Fe ion gives rise to satellite peaks at around 727.2 eV. The P 2p and O 1s peaks with binding energies of 134.0 and 531.26 eV correspond to the tetrahedral
  group and oxygen predominantly bonded to the Fe ion in the lattice. The binding energy values obtained here are consistent with the literature report.35
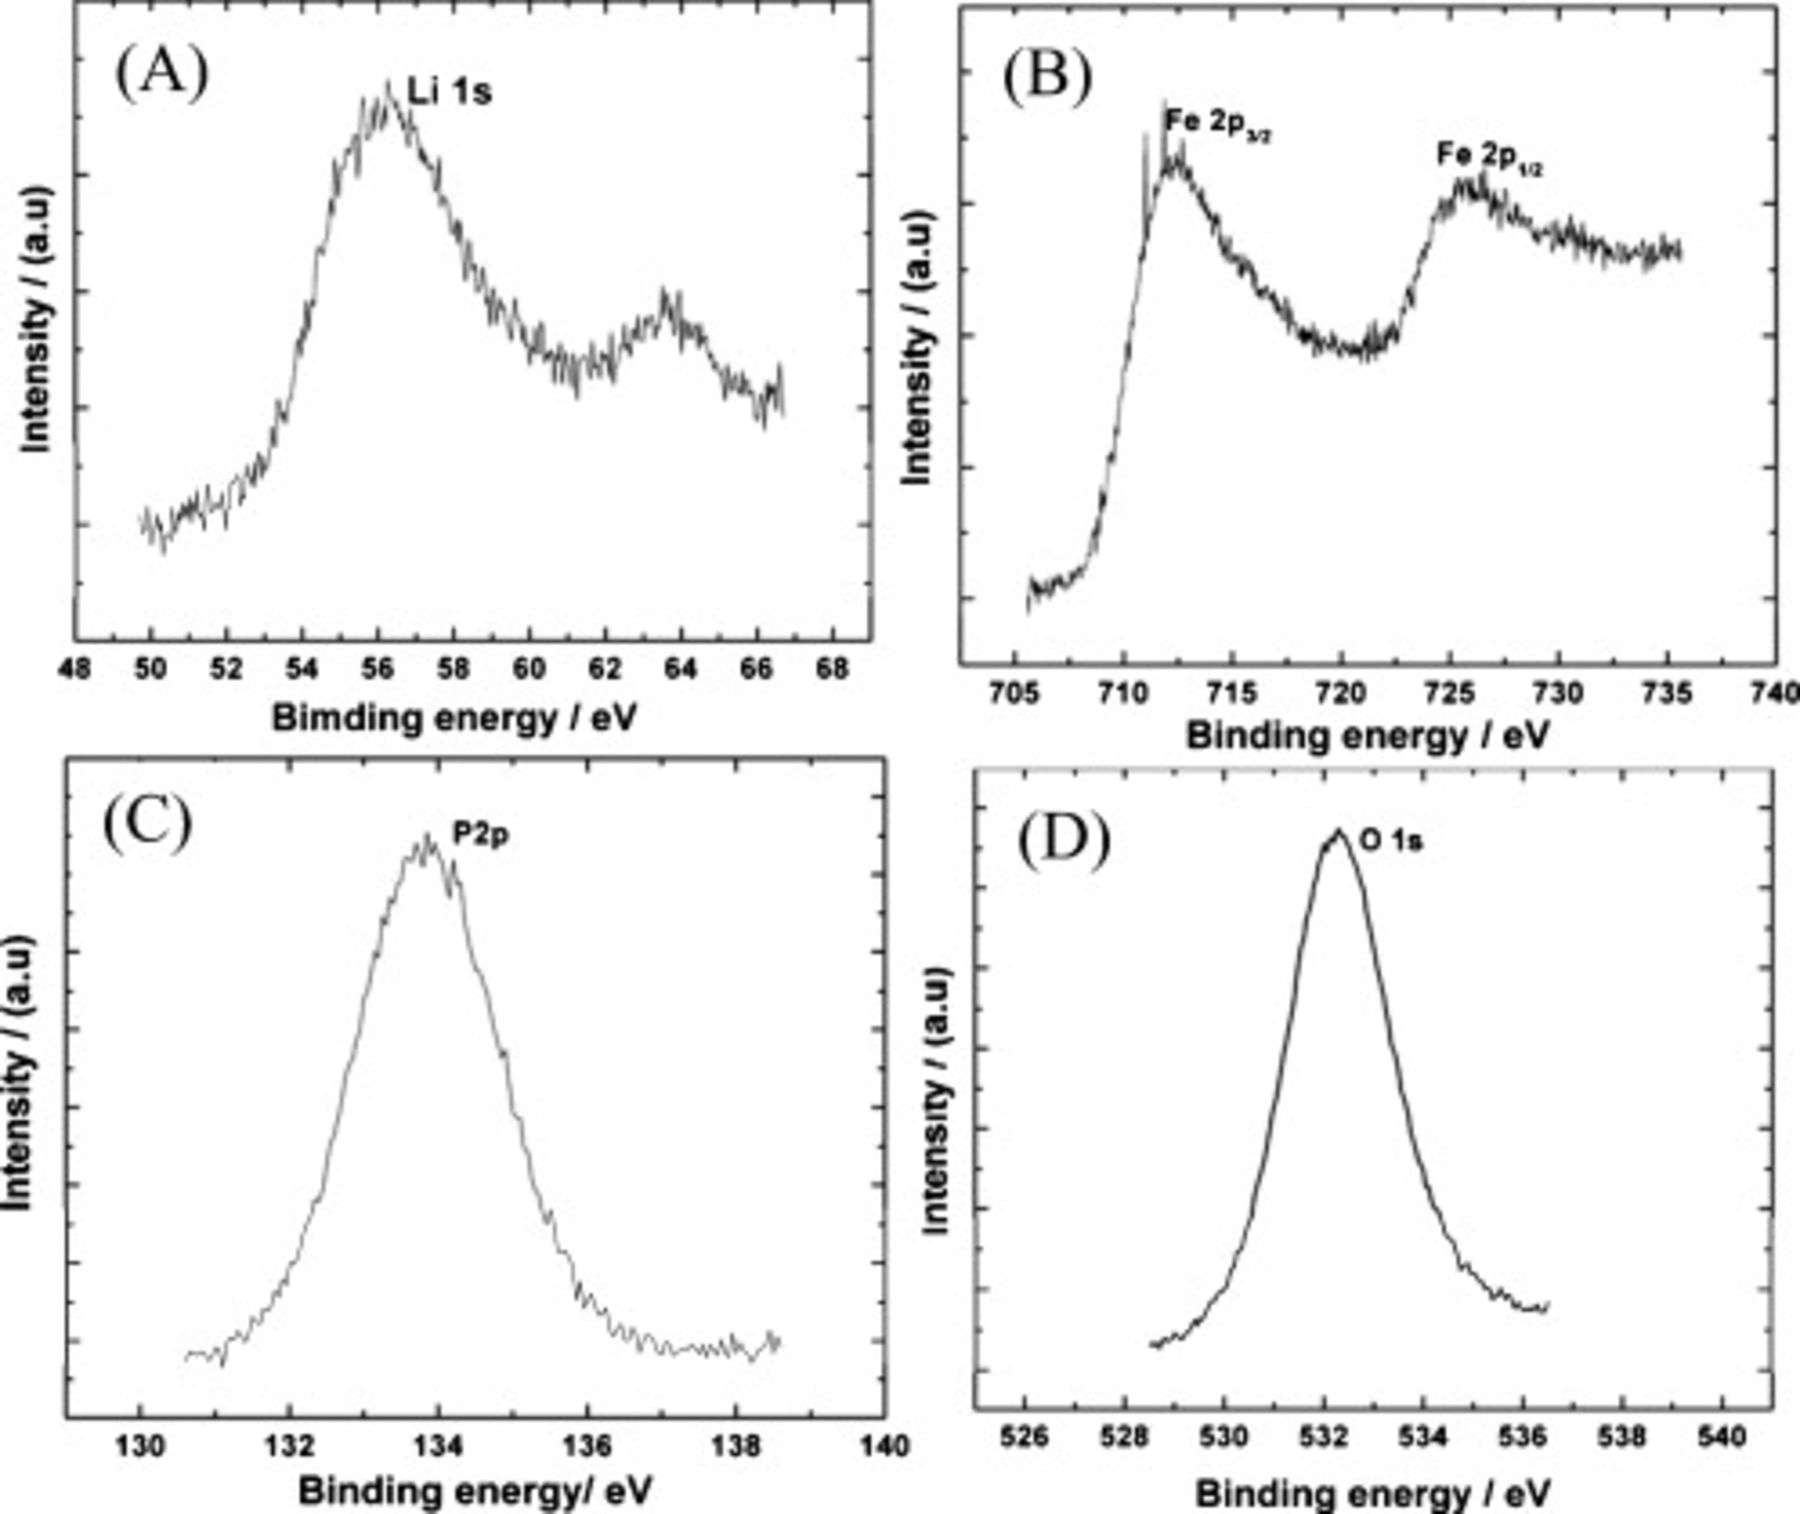
Figure 5. XPS spectra of (A) Li 1s, (B) Fe 2p, (C) P 2p, and (D) O 1s of  prepared by polyol route.
Figure 6 shows the CVs of the  sample prepared by the polyol method at different scan rates ranging from 0.05 to
  in the potential range from 2.5 to 4.2 V. A pair of anodic and cathodic peaks, which correspond to the two-phase deintercalation/intercalation of
  ions involving an
  redox couple, are observed. The peak potential separation
  between the oxidation and the reduction is 45 mV at a scan rate of
  , which is less than 58 mV, expected for a reversible reaction. A plot of peak current density with the square root of the scan rate is shown in Fig. 6B. The linear dependence of current with the square root of the scan rate suggests that the reversible reaction is diffusion controlled. Thus, the porous nanoplate
  exhibits electrochemical activity.
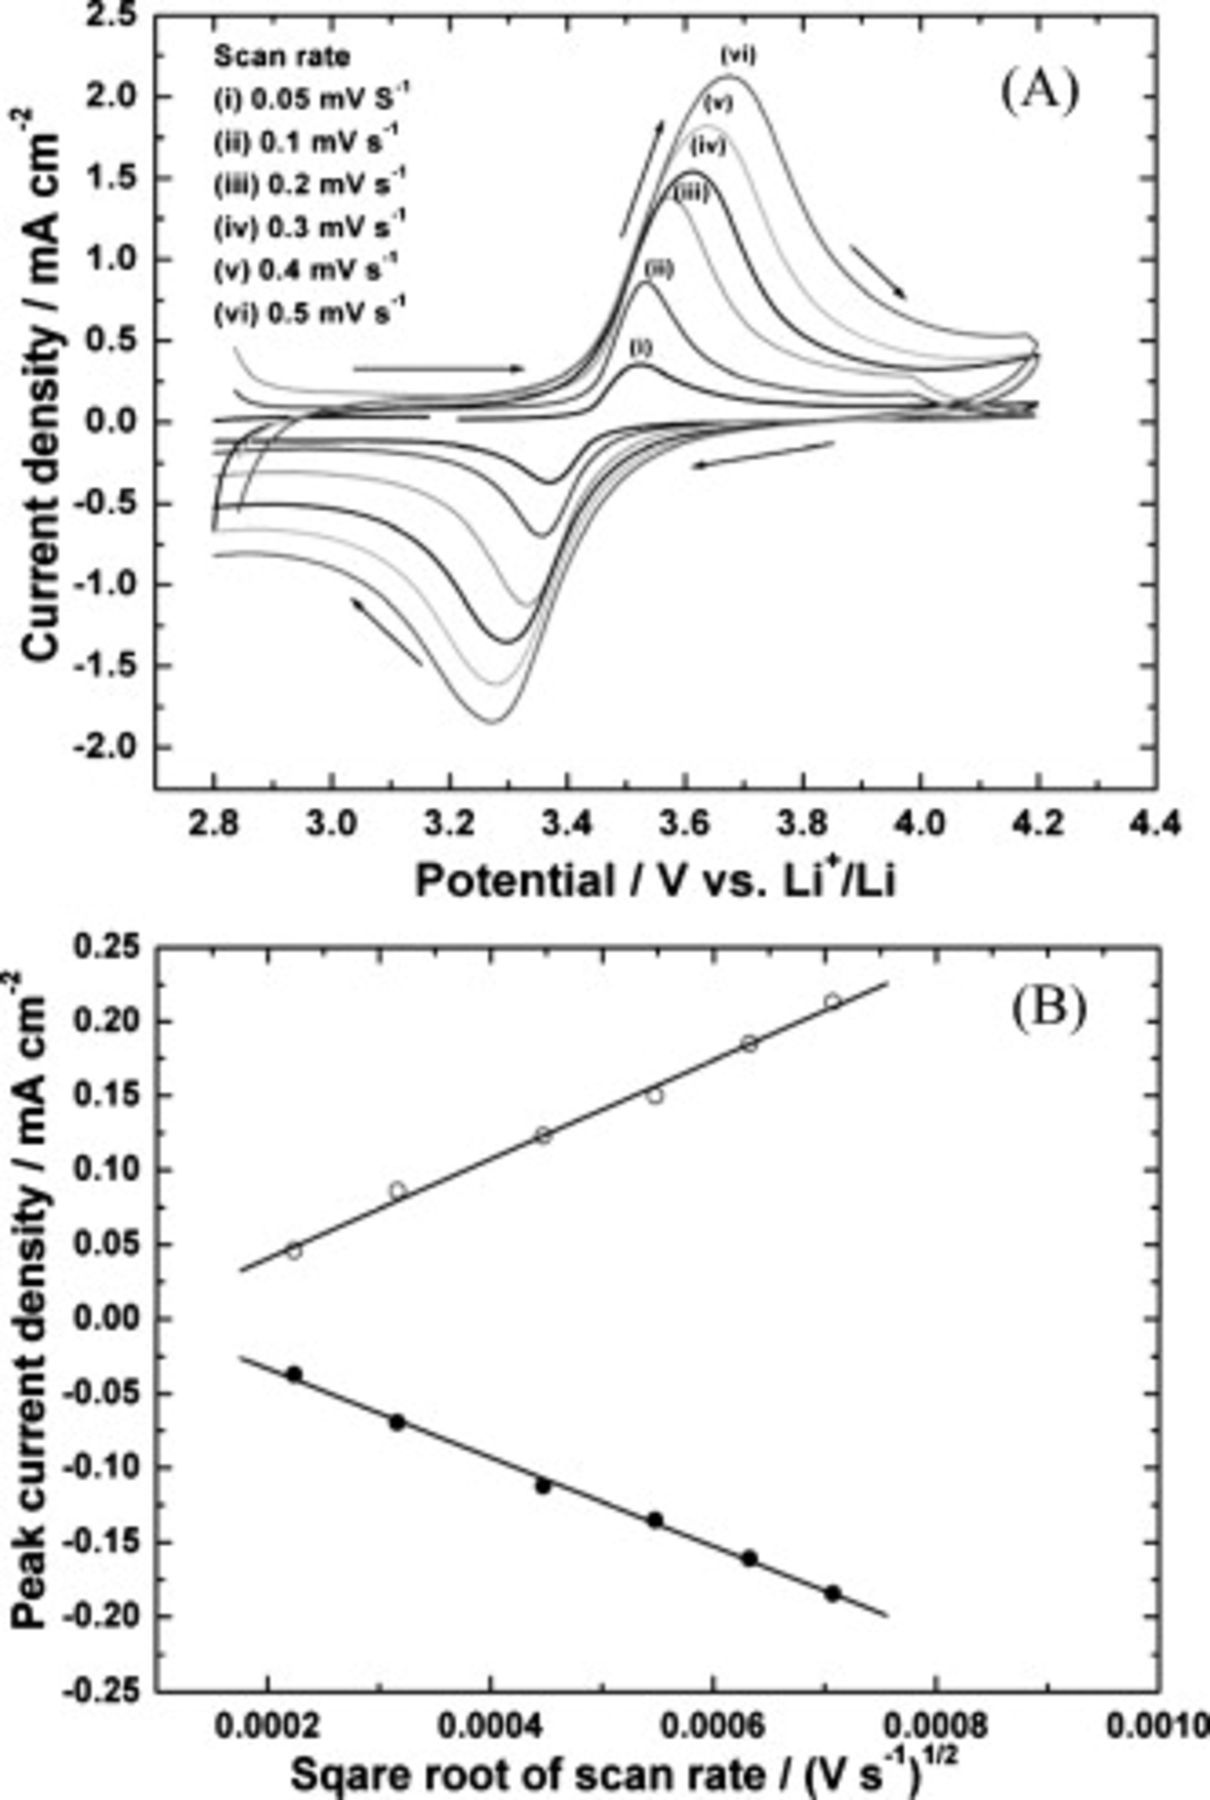
Figure 6. (A) CVs of  electrode at different scan rates: (i) 0.05, (ii) 0.1, (iii) 0.2, (iv) 0.3, (v) 0.4, and (vi)
  . (B) Plot of peak current vs square root of scan rate.
Typical charge–discharge curves of  in the potential range between 2.0 and 4.2 V are shown in Fig. 7. A discharge capacity of
  is obtained at the 0.15C rate with a coulombic efficiency close to unity. The discharge of the sample appears to take place in two distinguishable stages: a flat plateau at around 3.4 V and a sloping region up to the end of the discharge. As is well known,36–40 the plateau represents a two-phase reaction;
  and
and  phases coexist during the
  -ion insertion. However, the sloping part is considered as a capacitive behavior of the surface storage or the interfacial surface storage of lithium.37 The lithium-ion intercalation reaction is responsible for the discharge capacity of
  . But as the size of the particle is reduced to the nanoscale, the pseudocapacitive effect, i.e., faradaic charge storage at the surface of the material, has to be considered for the total discharge capacity of the material.38 Recently, Luo et al.36 showed the pseudocapacitive effect in high surface area mesoporous
  . In another study, Yang et al.39 reported that hierarchically constructed nanoplates of
  exhibit a pseudocapacitive behavior. The presence of the pseudocapacitive effect has been observed in nanostructured
  .40 In the present study with nanoplates of high surface area, porous
  , the slopy part of the discharge curve is considered due to pseudocapacitive behavior.
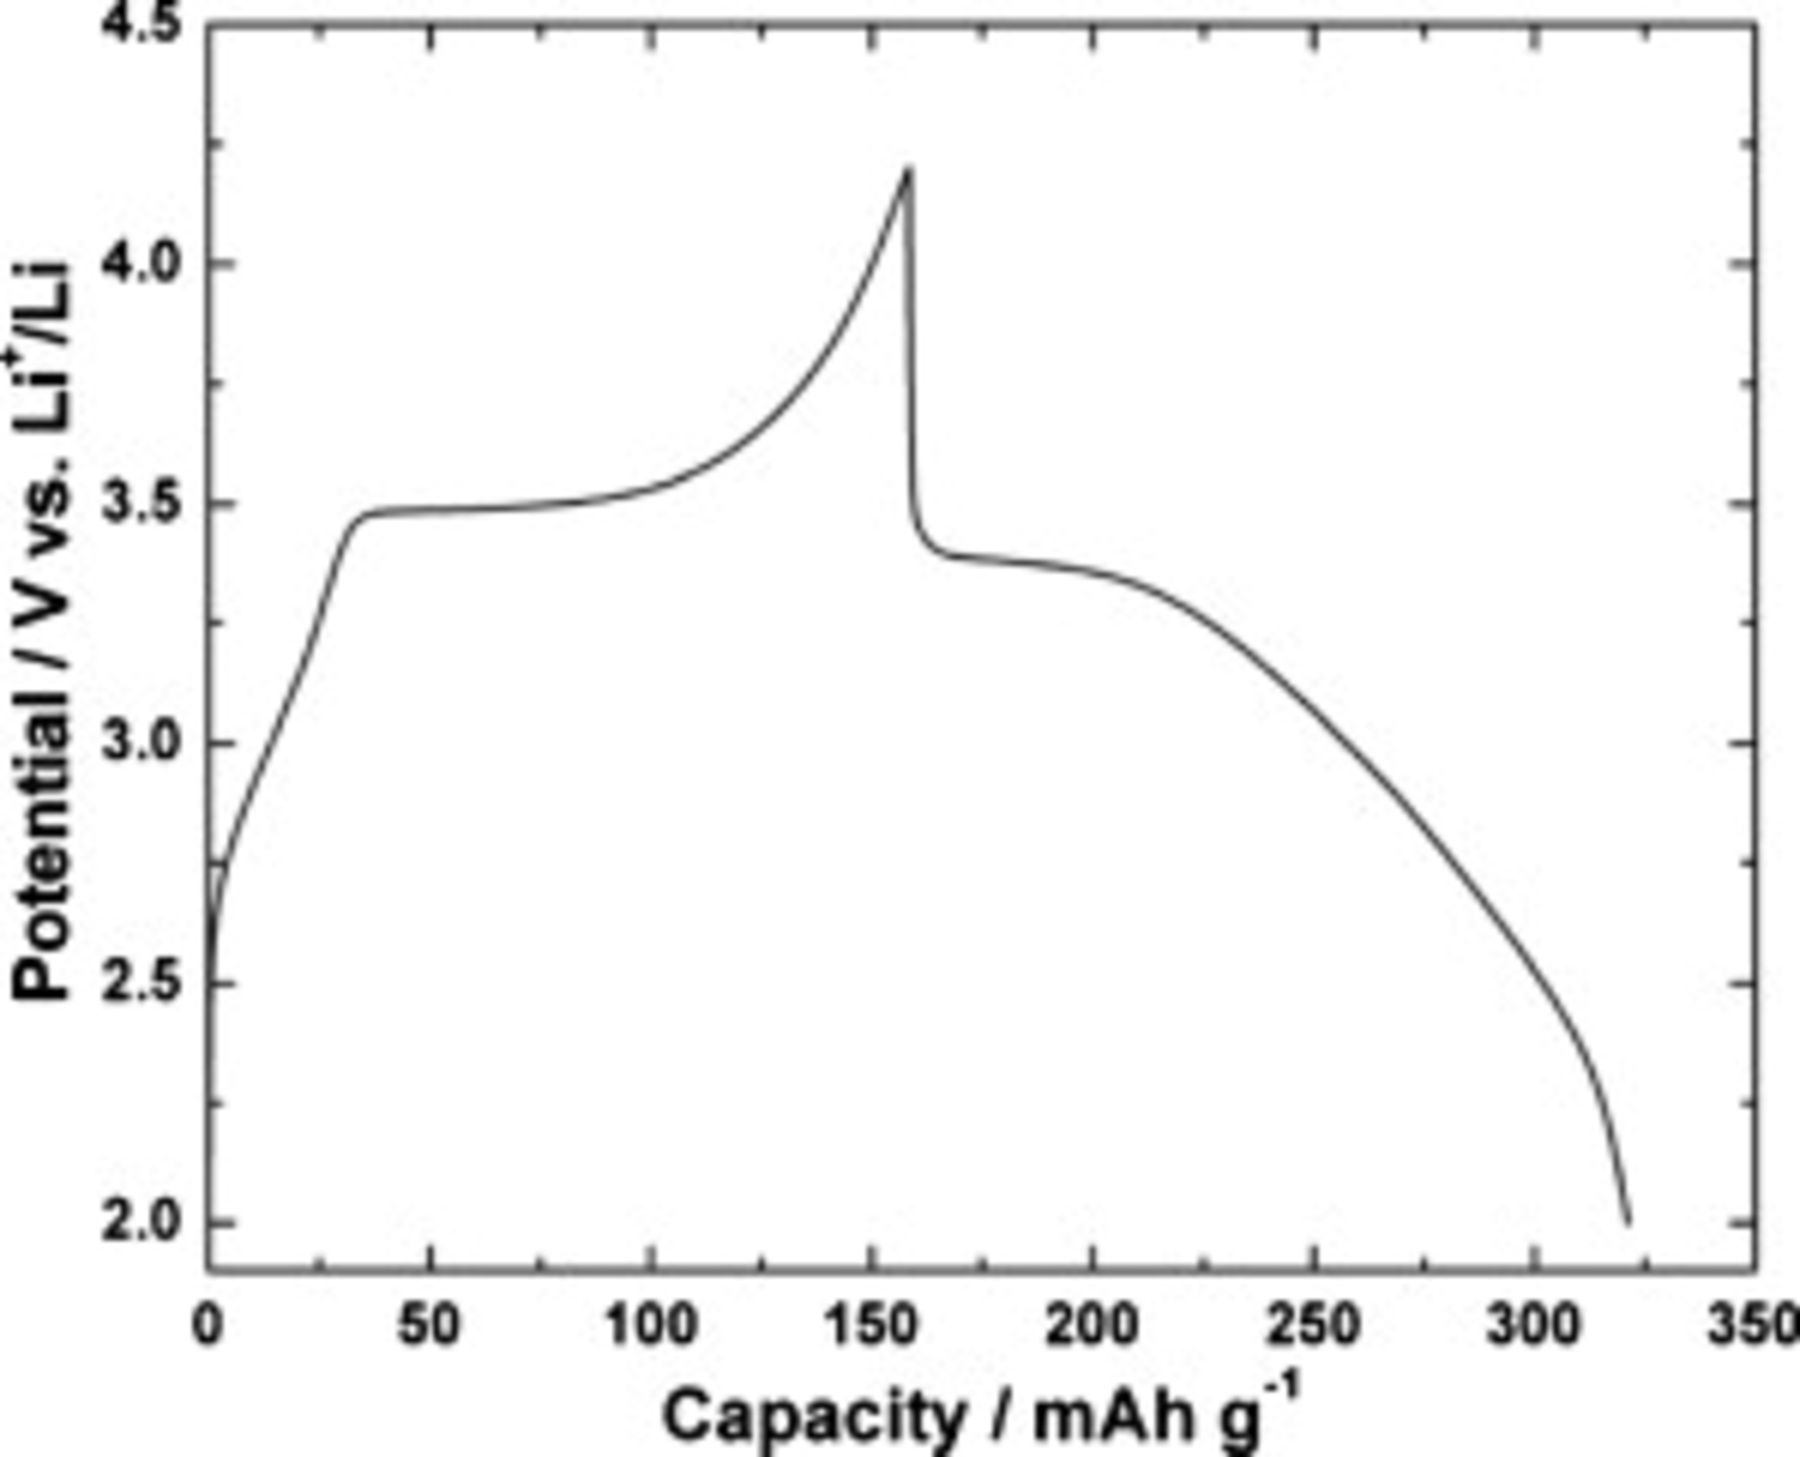
Figure 7. Typical charge–discharge profiles of  electrode at 0.15C rate.
To evaluate the rate capability, the  electrode was subjected to charge–discharge cycling with different currents corresponding to 0.15–3.4C rates. Figure 8 shows the discharge capacities of the
  electrode at different rates. The electrode provides stable discharge capacity values at all rates, and the values are 166, 156, 149, 143, 133, and
  at rates of 0.15, 0.21, 0.27, 0.51, 1.25, and 3.45C, respectively. At the end of the experiment, the electrode regains a stable discharge capacity of
  at 0.15C rates. Recently, Dohetry et al.41 reported a discharge capacity of
  at a 0.1C rate, and it decreases to
  at a 5C rate for carbon monolithic
  . In another study, nanorods of
  synthesized by a microwave hydrothermal route42 with carbon nanotubes provided a discharge capacity of
  at 0.1C rates, and
  was obtained at a 2C rate. Muraliganth et al.43 reported a discharge capacity of
  at a 0.1C rate for a carbon composite material
  , and it is reduced to
  at a 5C rate. A discharge capacity of
  was obtained for a
  composite electrode.44 This material provides a discharge capacity of
  at a 30C rate. The high rate performance is attributed to the carbon coating on the surface. In another study, the carbon composite
  delivered discharge capacity values of 153 and
  at 1 and 5C rates, respectively. The compound synthesized from
  precursors45 shows poor performance; a discharge capacity of
  was obtained at 0.05C rates, and it reduced to
  at 0.1C. However, high rate performances of pure
  are rarely reported. The data from the present study show that the porous nanoplate
  sample delivers a high discharge capacity with stable capacity retention.
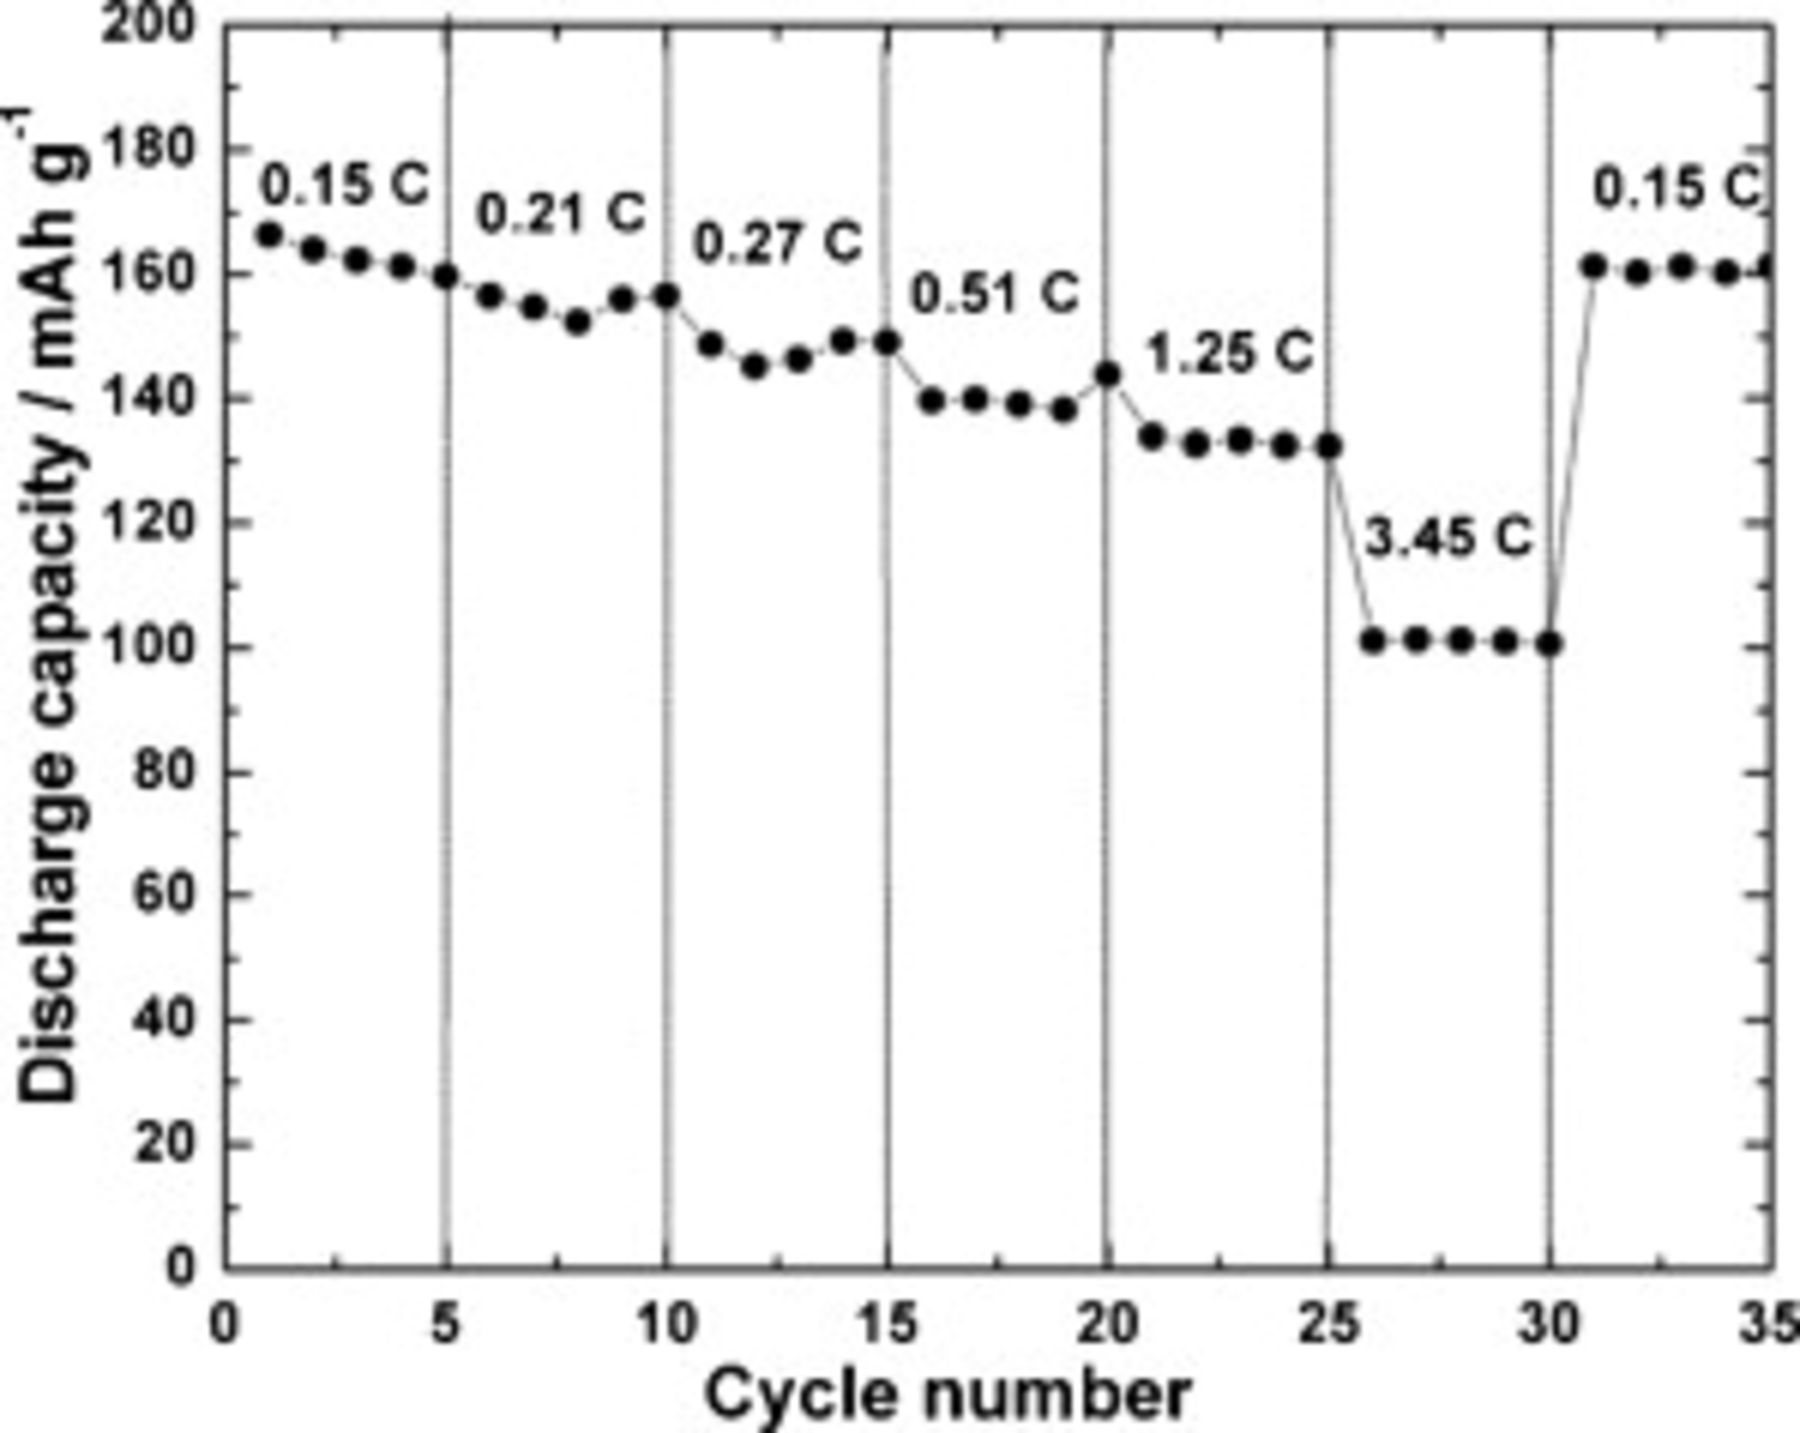
Figure 8. Rate capability of  electrode.
A  electrode was subjected to a cycle-life test at 0.2C rates between 2.0 and 4.2 V. The discharge capacity data measured for 50 continuous charge–discharge cycles are presented in Fig. 9. The discharge capacity is stable at
  over 50 cycles. In the literature, a discharge capacity of
  at a 0.1C rate and thereafter a decrease to
  at the end of the 30th cycle were reported for carbon-coated
  .46 Yang et al.39 reported a discharge capacity of
  in the potential range between 2.0 and 4.5 V at a C/30 rate for a dumbbell-like
  microstructure. A stable discharge capacity of
  at a 0.1C rate in the potential range of 2.0–4.2 V was reported for the sample prepared by the hydrothermal method.47 Wang et al.48 reported an initial discharge capacity of
  for the nanoplate of
  in the potential range of 2.0–4.2 V at a 0.1C rate. However, the discharge capacity obtained after 40 cycles was
  . The discharge capacity of
  after the 50th cycle 0.5C rate was reported for nanosized particles of
  prepared by the solid-state method and microwave heating.49 The electrochemical data in the present study demonstrate a better cycling stability of the nanoplate
  sample prepared by the polyol method.
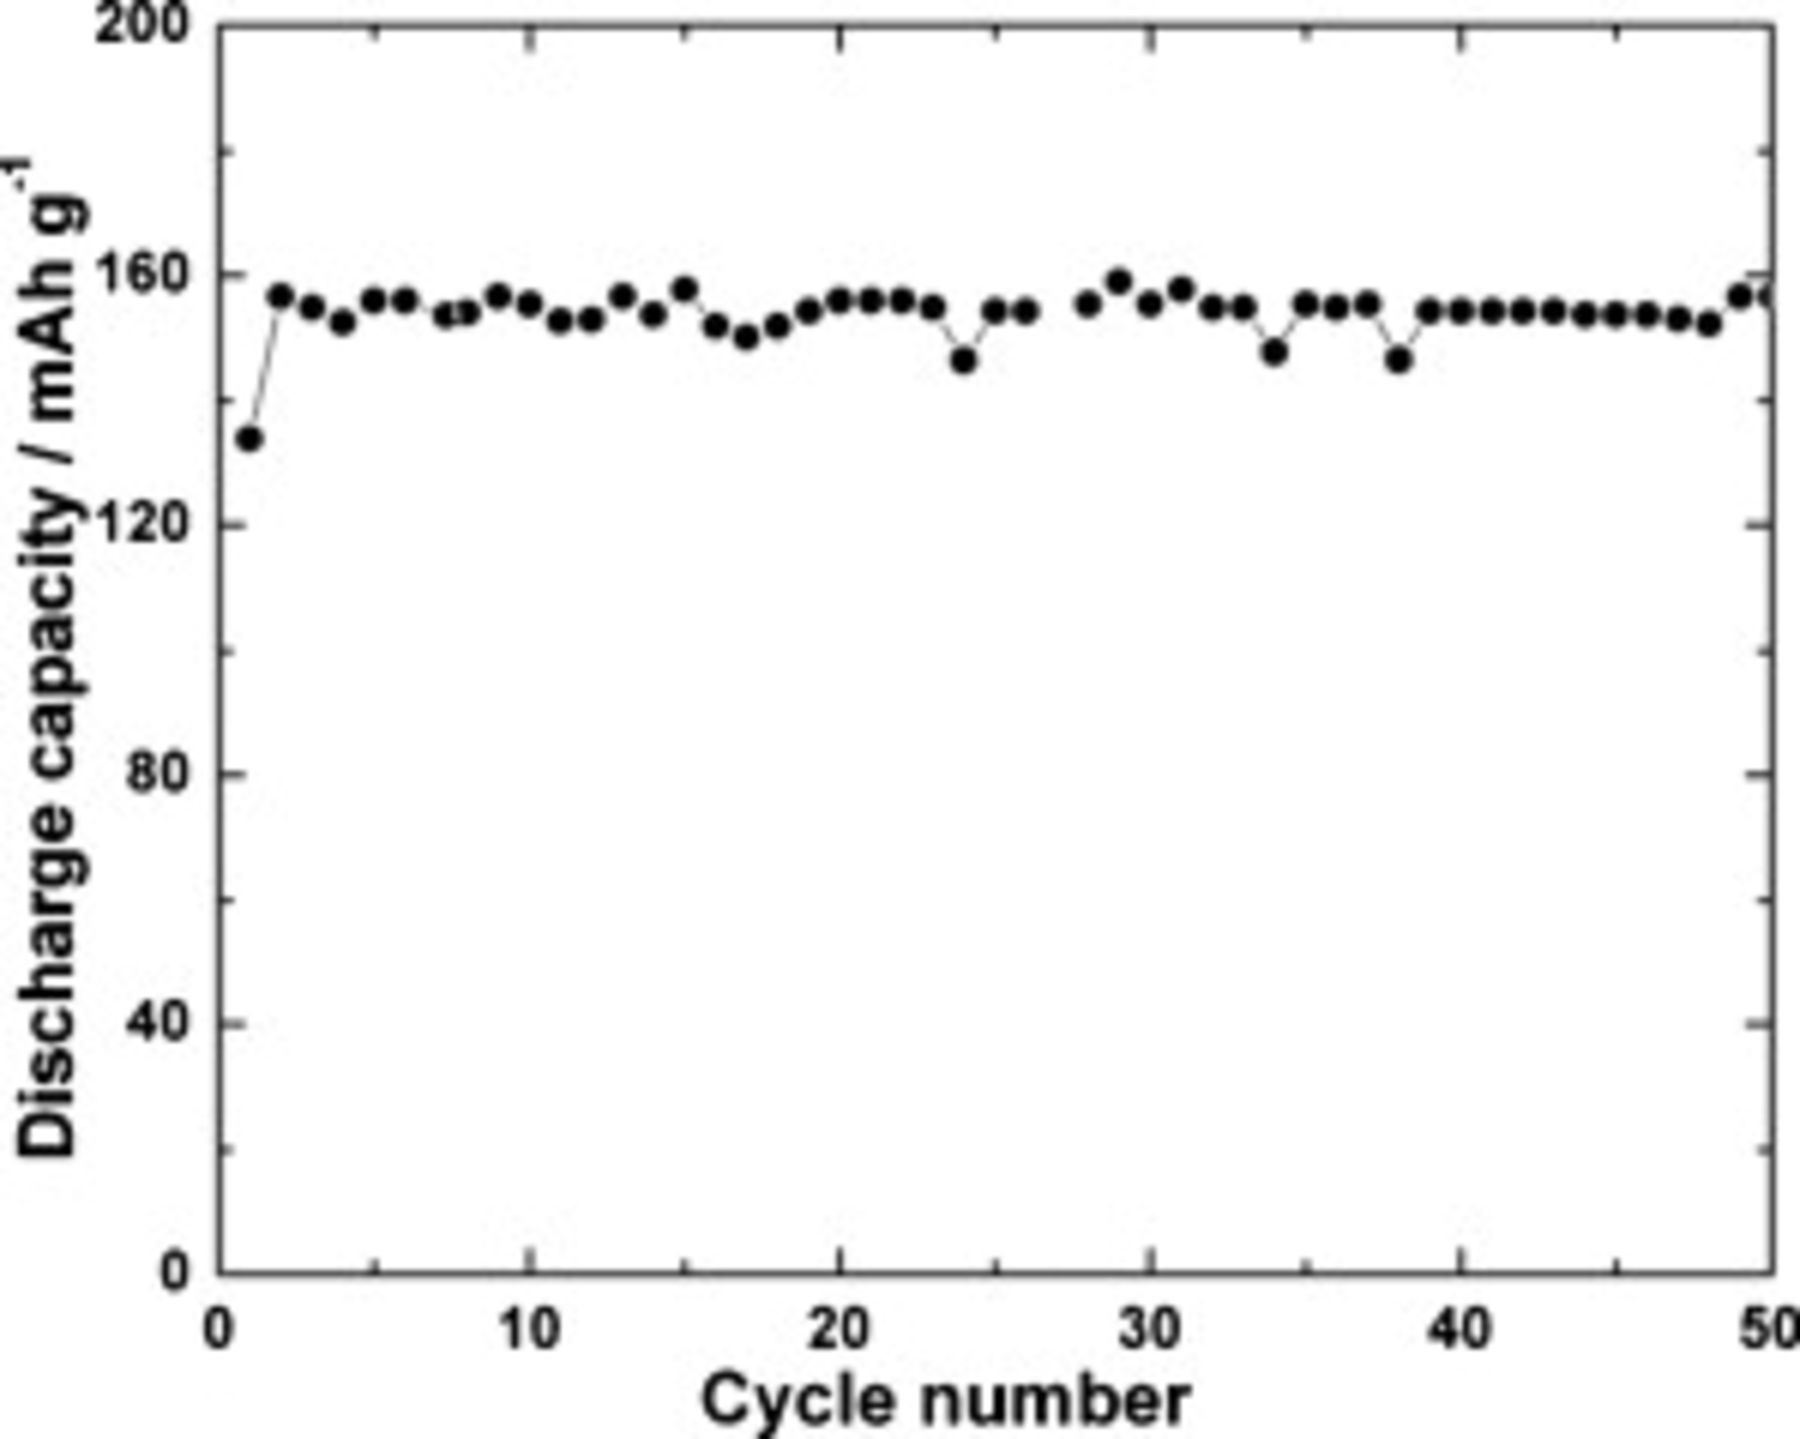
Figure 9. Cycle-life study of  electrode at 0.2C rate.
The Nyquist impedance spectra recorded during the cycle-life study after completing 10, 30, 40, and 50 cycles of discharge are shown in Fig. 10. The ac impedance spectra were recorded after galvanostatic charge–discharge at 0.2C. The Nyquist plot consists of a high frequency intercept and a broad semicircle. The broad semicircle is due to the overlap of two semicircles. The impedance parameters were evaluated by fitting the data to an equivalent circuit using the NLLS fitting program.50 The suitable equivalent circuit, which was found to fit the impedance data, is shown as the inset of Fig. 10. The two semicircles are due to two pairs of parallel resistance and capacitance.51 Because the semicircles are depressed with their centers below the real axis, capacitors are replaced by the constant phase element (CPE)  .52 Similar to the data of the
  electrode obtained in the present study, the impedance of
  was shown to consist of two semicircles.53 It was concluded that the formation of a surface layer on
  was responsible for the high frequency semicircle and the kinetics of intercalation/deintercalation of Li in the electrode for the low frequency semicircle. Accordingly,
  is the resistance of the surface film on the oxide electrode and
  is the CPE corresponding to the surface film capacitance. The impedance parameters
  and
and  are the resistance and CPE, respectively, corresponding to the electrochemical
  redox process and the double-layer capacitance. The impedance parameters were obtained by fitting the data (inset of Fig. 10) to the equivalent circuit. The resistance
  corresponds to the redox process, and it is equivalent to the charge-transfer resistance
  . The charge-transfer resistance of the sample after the 10th cycle is
  . However, there is a little increase in the impedance after 50 cycles, i.e.,
  . These data further support the capacity retention of the electrode with cycling.
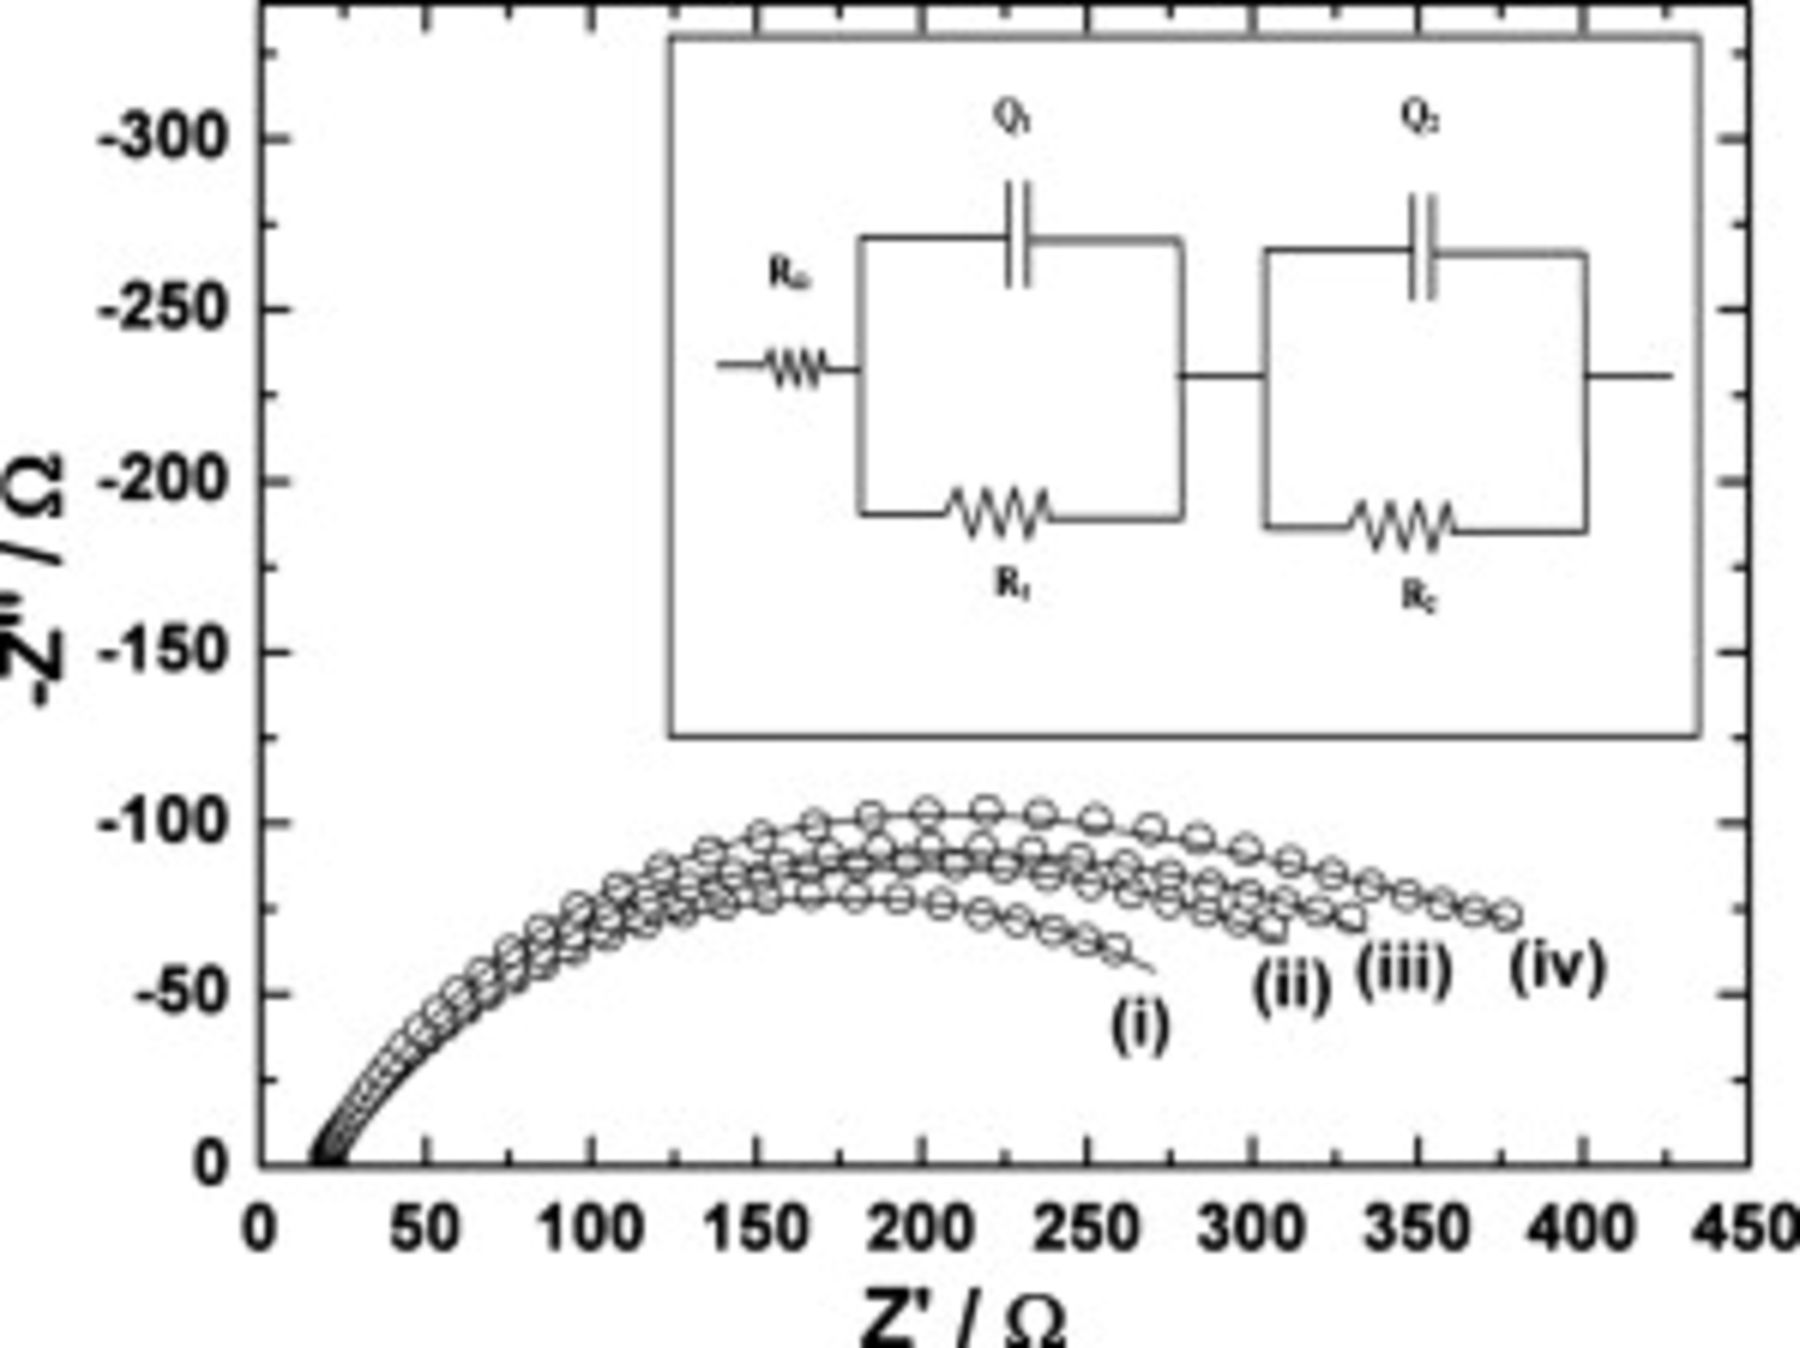
Figure 10. Nyquist plots of  electrodes after (i) 10, (ii) 30, (iii) 40, and (iv) 50 cycles at room temperature. Experimental data are shown as open circles, and theoretical data obtained from fitting are shown as curves. Inset: Equivalent circuit used for NLLS fitting of the experimental impedance data [
 resistance:
  -film resistance,
  of surface film,
  -transfer resistance
  , and
, and  of double layer).
Conclusions
 is synthesized by the polyol route starting from only two reactants, namely,
  and LiOH. The crystalline compounds form by refluxing a solution TEG consisting of
  and LiOH at
  , without any need for further heating of the reaction product. The product is formed in the form of nanoplates having a 30 nm width and a 160 nm length and possesses porosity with a broadly distributed pore size at 50 nm. The electrodes fabricated out of nano
  exhibit an electrochemical activity with a high discharge capacity of
  at a 0.15C rate and a stable capacity retention up to 50 continuous cycles.