
Abstract
The Li/oxygen battery may achieve a high practical specific energy as its theoretical specific energy is  Li assuming
  is the product. To help understand the physics of the Li/oxygen battery we present the first physics-based model that incorporates the major thermodynamic, transport, and kinetic processes. We obtain a good match between porous-electrode experiments and simulations by using an empirical fit to the resistance of the discharge products (which include carbonates and oxides when using carbonate solvents) as a function of thickness that is obtained from flat-electrode experiments. The experiments and model indicate that the discharge products are electronically resistive, limiting their thickness to tens of nanometers and their volume fraction in one of our discharged porous electrodes to a few percent. Flat-electrode experiments, where pore clogging is impossible, show passivation similar to porous-electrode experiments and allow us to conclude that electrical passivation is the dominant capacity-limiting mechanism in our cells. Although in carbonate solvents
  is not the dominant discharge product, we argue that the implications of this model, (i.e., electrical passivation by the discharge products limits the capacity) also apply if
  is the discharge product, as it is an intrinsic electronic insulator.
Export citation and abstract BibTeX RIS
The nonaqueous lithium/oxygen rechargeable battery is of interest because of its potential to have a very high specific energy. The theoretical specific energy based on the weight of Li metal alone is about  if the discharge product is
  (and the equilibrium potential is therefore
  ).1 The theoretical specific energy based on the weight of
  is
is  . For comparison, the theoretical specific energy of the common
  Li-ion cell is about
  (a better comparison is the
  battery, which has a theoretical specific energy of about
  ). While thus far no practical and reversible Li/oxygen cell has been demonstrated with a higher specific energy than a Li-ion cell, the potential to achieve a practical specific energy above
  motivates fundamental research work.
While the first paper on the nonaqueous Li/oxygen battery was published in 1996,2 in the past few years there has been much more interest in this battery.3–9 Most of the work has focused on the positive electrode, where different types of electrode materials and catalysts have been explored.6, 8, 10, 11 There has also been some work aimed at identifying the reaction pathway in studies using cyclic voltammetry and a rotating disk electrode with various solvents.12–15 Other recent studies try to identify the discharge reaction products, especially because it now appears that the reactions in carbonate solvents are more complicated than originally envisioned.14 Several papers address the structure of the positive electrode material and how the pore size and shape affect the discharge capacity.16, 17 Others look at "hybrid" positive electrodes that make use of a conventional intercalation material and the carbon typically used in a Li/oxygen positive electrode,18 as well as hybrid electrolytes, involving the use of both an organic electrolyte (favorable for forming a stable solid-electrolyte interphase (SEI) on Li metal) and an aqueous electrolyte (favorable for forming soluble discharge products) in a single cell.19
Physics-based mathematical modeling has been applied extensively to model Li-ion and Ni/MH cells but has not yet been applied to the Li/oxygen battery.20–24 Modeling work on the Li/oxygen battery thus far only includes calculations of the specific energy for aqueous-electrolyte cells and estimations of electrolyte-phase transport limitations.5, 25, 26 In this work we present the first physics-based continuum-scale model of the Li/oxygen battery that takes into account the major thermodynamic, transport, and kinetic processes occurring in the system. Because research on the Li/oxygen battery is still in an early stage, the present model is only a starting point on which improvements will be made as additional physical processes are identified and measured. Ab initio modeling also plays an important role in the development of Li/oxygen cells by providing physically realistic parameters to use in the macroscopic model and strengthening physical understanding. For example, in this paper we present results from first-principles calculations that provide an estimate of the bandgap of potential discharge products, an intrinsic electronic property. Principal challenges for making the Li/oxygen battery into an attractive secondary battery include establishing truly reversible electrochemical reactions, increasing the round-trip energy efficiency and power capability of the cell, establishing a cell design with a high practical specific energy, and designing a stable battery system open to the external environment that makes use of Li, catalysts, and ambient air.9 To address these challenges, many scientific questions about the Li/oxygen battery must be answered, which modeling work (including continuum and ab initio) can help frame and answer.
The Li/oxygen battery should be seen in the context of the various reaction mechanisms found in current battery systems, which include intercalation (e.g., MH/NiOOH,  , and other Li-ion couples), plating or stripping (e.g., Li and Zn metal), alloying (e.g., Li–Si alloys), and solution-precipitation (e.g.,
  ,
,  , and some
  cells).27 The nonaqueous electrolyte Li/oxygen battery does not fit into any of these previously established categories. Unlike classic solution-precipitation mechanisms the desired discharge product
  appears to be almost completely insoluble in nonaqueous electrolytes, and unlike conventional plating mechanisms the discharge product is an insulator, which dramatically limits its thickness before passivation occurs. Given the difference of the Li/oxygen mechanism from previously established mechanisms novel design strategies will likely be required.
In this work we focus exclusively on the first discharge of cells using carbon positive electrodes (without added catalysts) and propylene carbonate-based electrolyte, considering both porous-electrode (based on Super P carbon) and flat-electrode (based on glassy carbon) cell designs. We present the methods used to build and test flat- and porous-electrode cells, the continuum model framework and equations, the ab initio methods, results and discussion, and future modeling topics. We argue that the key limitation in our nonaqueous Li/oxygen cells is the electronic resistivity of the discharge products that form on the surface of the positive electrode, which limits their thickness to tens of nanometers. While some pore clogging may occur as the discharge products forms, passivation is the main issue, as the results of our flat-electrode experiments show similar results to the porous-electrode cells and there are no pores in the flat-electrode case. Passivation of the electrode surface has been identified previously by other authors working on the Li/oxygen battery in the context of cyclic voltammetry and rotating disk electrode experiments.13, 15
Reactions in the Li/Oxygen Battery
One particularly important research question for nonaqueous Li/oxygen batteries is the chemical composition of the discharge and charge product(s). At the lithium metal negative electrode the reaction is well established
with an equilibrium potential value,  , of
, of  (taken as the reference in this work). At the positive electrode recent experiments show that in carbonate solvents [e.g., the propylene carbonate (PC) used in our study]
  , lithium alkyl carbonates, and lithium alkoxides are discharge products9, 14, 28 rather than
  as originally suggested.3 Thus, decomposition of the carbonate solvent occurs. Some elementary steps in the reaction sequences that lead to these products may be irreversible and nonelectrochemical, so that the overall kinetic picture is very complex. We write a generic positive-electrode reaction that should not be taken literally but merely indicates that
  ,
,  , solvent, and electrons are reactants, and carbonates (and perhaps other species) are products

where  indicates the total number of electrons involved in the reaction. Using such a generic reaction results in a kinetic expression not based on a detailed kinetic mechanism. We assume that
  and
and  of products result (we also assume the molar volumes of the products are the same); these numbers result in a film thickness at the end of a flat-electrode discharge consistent with surface analysis. We stress that these numbers are chosen to be broadly consistent with experimental results but have not been measured directly.
Experimental Methods
We constructed cells with a Li metal negative electrode and either a flat or a porous positive electrode. The flat-electrode cells avoid the complexity of transport issues inherent in the porous electrodes and thereby isolate the charge-transfer (kinetic) resistance and the electronic resistivity of the discharge products. Figure 1 provides a schematic of the flat- and porous-electrode cells. Commercial LiTFSI (Aldrich) and battery grade electrolyte solvent PC were purchased from Novolyte Corporation and used as supplied. All electrochemical cell assembly was carried out in an argon-filled MBraun Unilab glove box and electrochemical tests were carried out using a potentiostat from Bio-Logic USA.
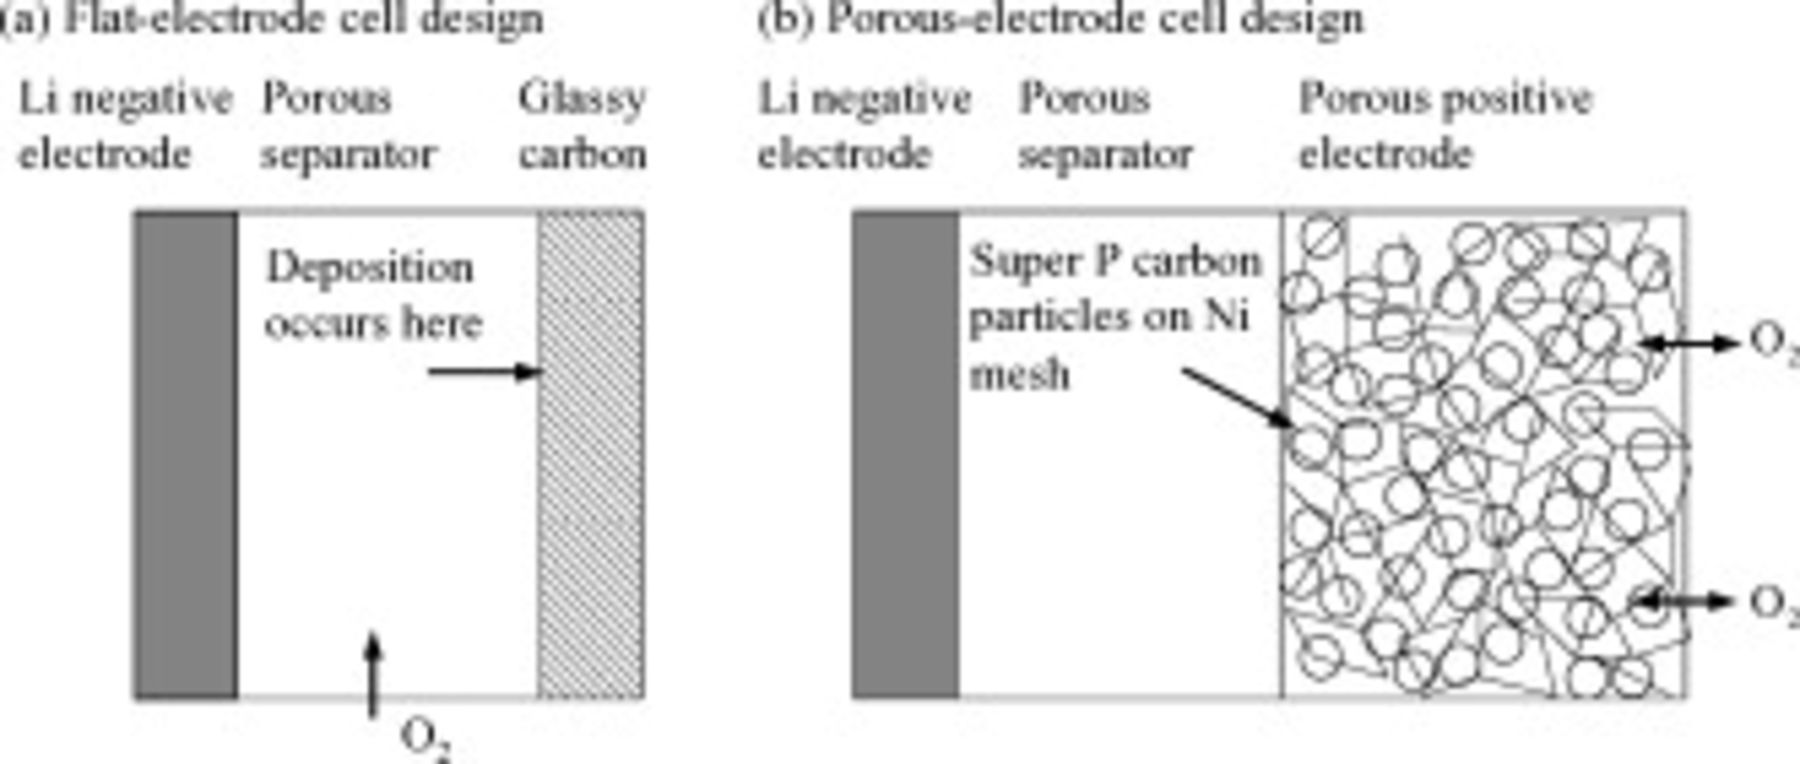
Figure 1. Schematics of the two types of Li/oxygen cells we studied, showing the Li metal negative electrode, glass fiber separator, and positive electrode. The schematics are not to scale. (a) shows a schematic of the flat-electrode cell, which contains a glassy carbon positive electrode, while (b) shows a schematic of a porous-electrode cell, with a positive electrode containing Ni mesh, Super P carbon particles, and PVDF binder. In both cases the electrolyte is  -saturated LiTFSI in PC.
Flat-electrode cells
Tokai glassy carbon electrodes (Tokai Carbon Co., Ltd., Tokyo, Japan) with an area of about  were cut to form a circular disk of
  diameter. Each electrode was polished with hand pressure for approximately
  in a slurry of alumina and double-distilled water using a circular motion. The electrode was then sonicated in deionized water for
  to remove any loose particles. The electrode was further treated with acetone to remove any organic contaminants and then sonicated again in deionized water and dried in vacuum. The glassy-carbon positive electrode was added, along with a piece of Li metal (FMC Corporation) and a
  thick binder-free borosilicate glass-fiber separator (Pall Corporation), to a Hohsen HS-3E cell (Hohsen Corporation). The Hohsen cell was further modified to allow the inlet and outlet of
  gas at a pressure of
  . Oxygen-saturated
  LiTFSI in PC was the electrolyte. The flat-electrode cells were discharged from open circuit to a lower cutoff potential of
  at three different current densities. The initial (before discharge) experimentally observed open-circuit potential following
  of relaxation varied from cell to cell but was typically about
  . Two cells were tested at each current density to ensure repeatable results. Based on the solubility of oxygen in an electrolyte of
  LiTFSI in PC, there was sufficient oxygen dissolved in the electrolyte for a film of discharge products about
  thick given the assumptions about the stoichiometry of Reaction 2 listed above and using
  solubility data from Read et al.5 This thickness is larger than that grown in our lowest current-density experiments as measured by surface analysis. We also checked for
  mass-transfer limits by shutting off the current partway through discharge and allowing the cell to relax for
  before resuming the current. During experiments at both 0.75 and
  the cell potential returned to its trajectory prior to relaxation. At
  the cell potential returned to the prior trajectory almost immediately while at
  it took slightly longer. From these tests we concluded that oxygen mass-transfer limitations are not significant at either current density.
Porous-electrode cells
Porous positive electrodes were prepared by submerging nickel foam (Inco,  thickness,
  pore size,
  ) in a
  poly(vinylidene) fluoride (PVDF)
  Super P carbon black/
 N-methyl pyrrolidone (NMP) slurry. The coated Ni foam was dried at
  for
for  under nitrogen prior to cell preparation. A Swagelok-type cell similar to that used by Beattie et al.29 was prepared using Li metal as the negative electrode, a
  glass fiber separator, and the positive electrode described above. The projected area of the electrodes was
  . The electrolyte was the same as the flat-electrode cells, oxygen-saturated
  LiTFSI in PC.
  was added to the assembled cell and assumed to completely fill the void volume of the separator (as a result of the separator's high wettability for PC) and partially fill the positive electrode void volume. Using the volume fractions of the separator and positive electrode, the
  of electrolyte resulted in an electrolyte/oxygen boundary that was about
  from the separator. Pure oxygen at
  pressure was applied to the back end of the cathode and discharge was carried out at three current densities from open circuit to a lower cutoff potential of
  . Three cells were tested at each current density to ensure repeatable results.
Description of the Continuum-Scale Cell Model
The present Li/oxygen model is based on previously developed macrohomogeneous models of Li-ion cells. In particular, the electrolyte material balance, modified liquid-phase Ohm's law, solid-phase Ohm's law, and current balance are carried over from previous lithium-ion models. We summarize those equations in Table I and refer the reader to previous developments for more detail.20, 21, 23 Our model for the lithium/oxygen cell differs from lithium-ion models because it uses a different kinetic expression for the positive-electrode reaction, includes oxygen transport in the electrolyte and the growth of discharge products on the surface of the positive-electrode particles, and excludes a material balance on the concentration of Li within an intercalation particle. We include a list of terminology in the List of Symbols.
Table I. Equations used in our model of the Li/oxygen battery drawn from previously developed lithium-ion battery models.
| Equation description | Equation |
|---|---|
| Electrolyte material balance |
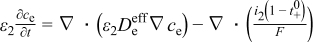
|
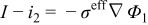
| Liquid-phase Ohm's law |
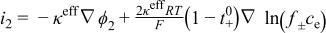
|
| Solid-phase Ohm's law |
|
| Charge conservation |

|
| Kinetic expression for the Li metal reaction |

|
Addressing first the kinetic expression for the positive-electrode reaction, because a detailed mechanism is not available we base the kinetic expression on the generic Reaction 2, which captures the fact that  ,
,  , and PC are reactants in an
  -electron process

We use the Tafel form in Eq. 3 rather than the Butler-Volmer form because the large kinetic overpotential during discharge puts the reaction in the Tafel regime (and we only look at discharge), and because of the uncertain nature of "equilibrium" reactions at the positive electrode in the presence of carbonate solvents. In addition, we treat the reaction orders empirically, as Reaction 2 certainly involves many elementary steps and it is unclear which is rate limiting. As stated above we assume that  , and because the solvent concentration is essentially constant we group its value into a single rate constant,
  , which results in
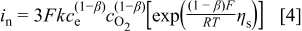
We stress again that this kinetic expression is meant to capture only qualitatively the dependence of the current density on the electrolyte and oxygen concentrations. We assume a value for β of 0.5.
With regard to the  transport in the electrolyte, we note that the solubility of pure oxygen in candidate nonaqueous electrolytes is low (typically between 0.001 and
  , depending on the particular salt and solvent). In the current model we assume that all oxygen transport occurs in the form of oxygen dissolved in the electrolyte. The model can be extended easily to include both gas- and liquid-phase transport, as in previous modeling work on the Ni/MH system.23 The diffusion of oxygen is given by
The diffusion coefficients and conductivities in our model are corrected for the volume fraction of the porous medium and the tortuosity. For example, the effective oxygen diffusion coefficient is given by
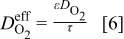
where  is the value in pure electrolyte. In the absence of experimental input, we use the tortuosity for a bed of packed spheres of uniform size,
  , such that
  . At the surface of the Li metal, a no-flux boundary condition is imposed (we assume the SEI prevents any reaction of
  with the Li metal) and at the positive electrode/current collector boundary we use a Dirichlet boundary condition, setting the
  concentration to its equilibrium value.
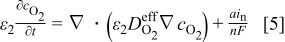
Third, we include a volume fraction balance for the discharge products. As discussed above, in carbonate solvents it appears that insoluble  , lithium alkyl carbonates, and lithium alkoxides are the principal products. Because the product distribution is unknown for our system, we use the properties of
  for all of the discharge products formed
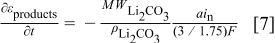
The factor of  in the denominator of Eq. 7 comes from our assumption that for every three electrons consumed
  of discharge products result, a value chosen to give results consistent with surface analysis of flat-electrode discharge films.
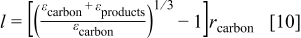
Fourth, the growth of the resistive discharge products requires an additional equation. At this point the growth mechanism remains unclear. Scanning electron microscope (SEM) images of the flat electrodes show the growth of a more or less uniform flat film tens of nanometers thick, as shown in Fig. 2. However, many questions remain: Are grain boundaries formed, and if so, are they important for the process of film growth (e.g., by electronic conduction through surface states, or percolation of electronically conductive pathways)? What is the role of defects and dopants on the process of electronic conduction? Is there a resistance to electronic conduction through the interface between the carbon substrate and the discharge products (i.e., a contact resistance)? Because detailed experiments that report the chemical and physical properties of the discharge products are not yet available, we assume that the film grows uniformly across the active electrode surface, i.e., that electrochemical growth occurs on the surface of the previous deposit. For the planar electrodes, this implies a uniform growth in thickness, while for the porous electrodes this implies that the discharge products form a spherical shell on the surface of spherical carbon particles, as illustrated in Fig. 3. The potential drop between the electrolyte just outside the surface of the discharge products and a point just inside the carbon particle includes the charge-transfer resistance across the discharge products/electrolyte interface and the potential drop due to the electronic resistance of the discharge products. Both terms can be grouped into the surface overpotential in the Tafel equation (Eq. 4) above

We use the empirical open-circuit voltage prior to starting discharge  as the ''equilibrium'' potential, but note that in a Tafel expression the rate constant and equilibrium potential are not independent values. We use the well-defined area of the flat-electrode cells to find the dependence of the film resistance on its thickness. The empirical form

was found to work, where  is the film thickness (in meters),
  is the film resistivity (in
  ), and
  and
and  are constants. For the flat electrodes the film thickness is calculated from the charge passed and the properties of
  assuming
  and
and  of discharge products are formed. For the porous electrodes the film thickness is calculated from the volume fraction of the discharge products given by Eq. 7
As the discharge proceeds the interfacial surface area will eventually decrease as particle joining occurs, but we use a constant area based on that of the carbon particles alone because the passivation happens quickly enough that the change in interfacial area is small. The rapid passivation also allows the spherical curvature of the discharge products to be neglected. If such an assumption is not made the value of  can be corrected to account for curvature.
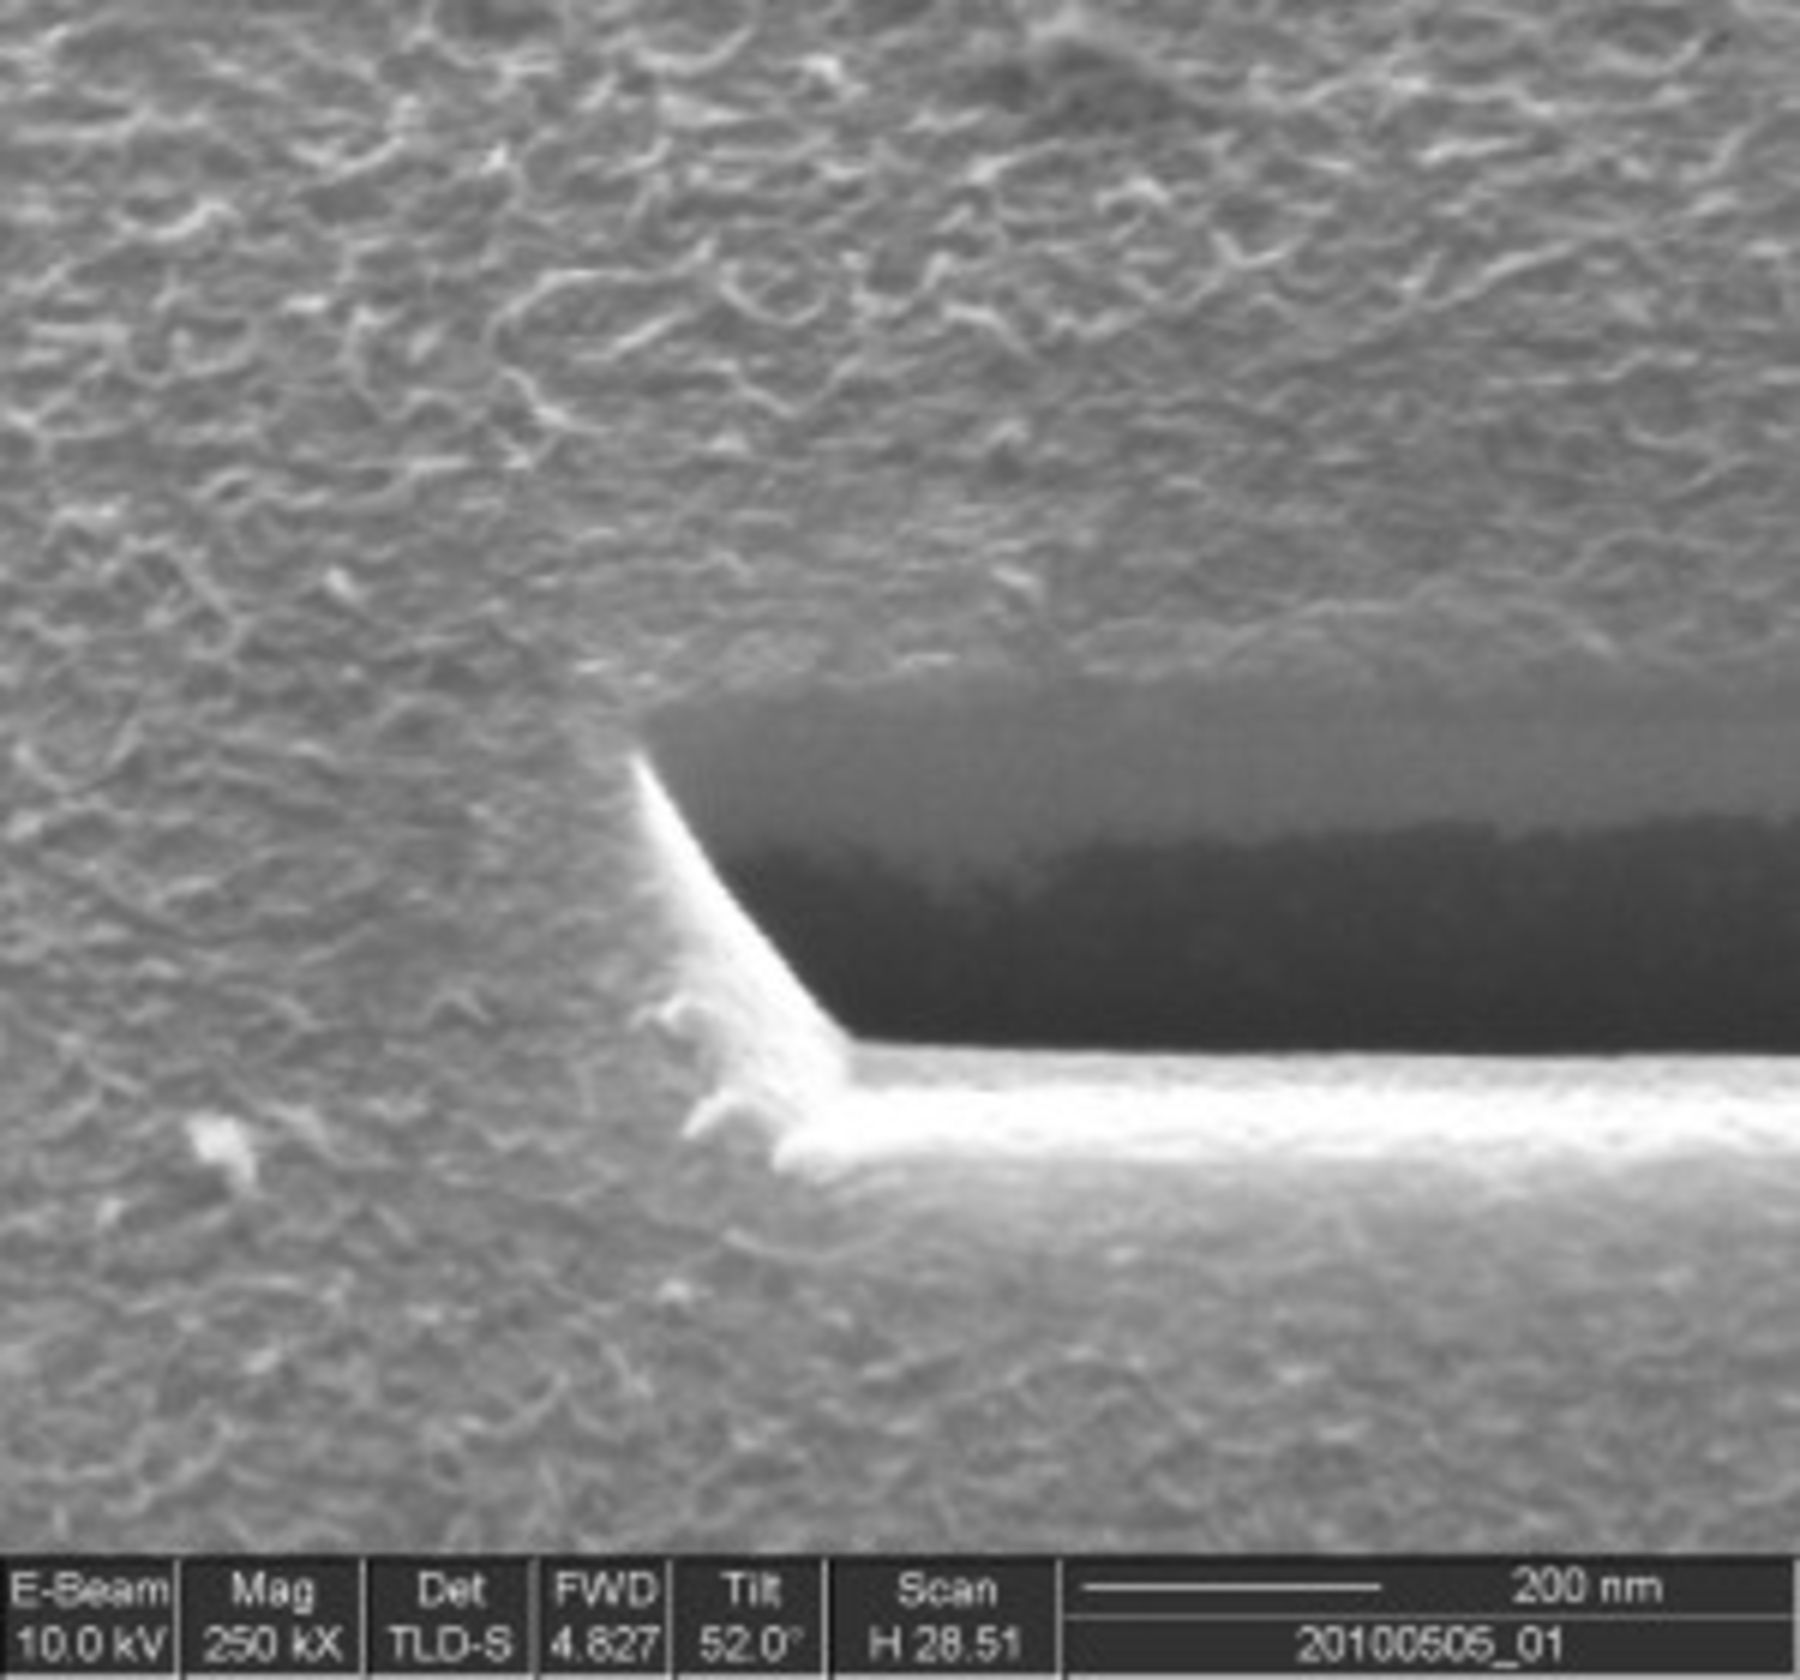
Figure 2. SEM image of the discharge film produced by the end of a  discharge on a flat glassy-carbon electrode. A focused-ion beam has been used to cut the discharge film and underlying glassy-carbon electrode at an angle of 52°. The dark region is the glassy carbon and the lighter region above it is the discharge film. Brightness variations on the surface of the discharge film furthest from the glassy carbon may be grain boundaries. The image shows a film thickness of
  for this particular case.
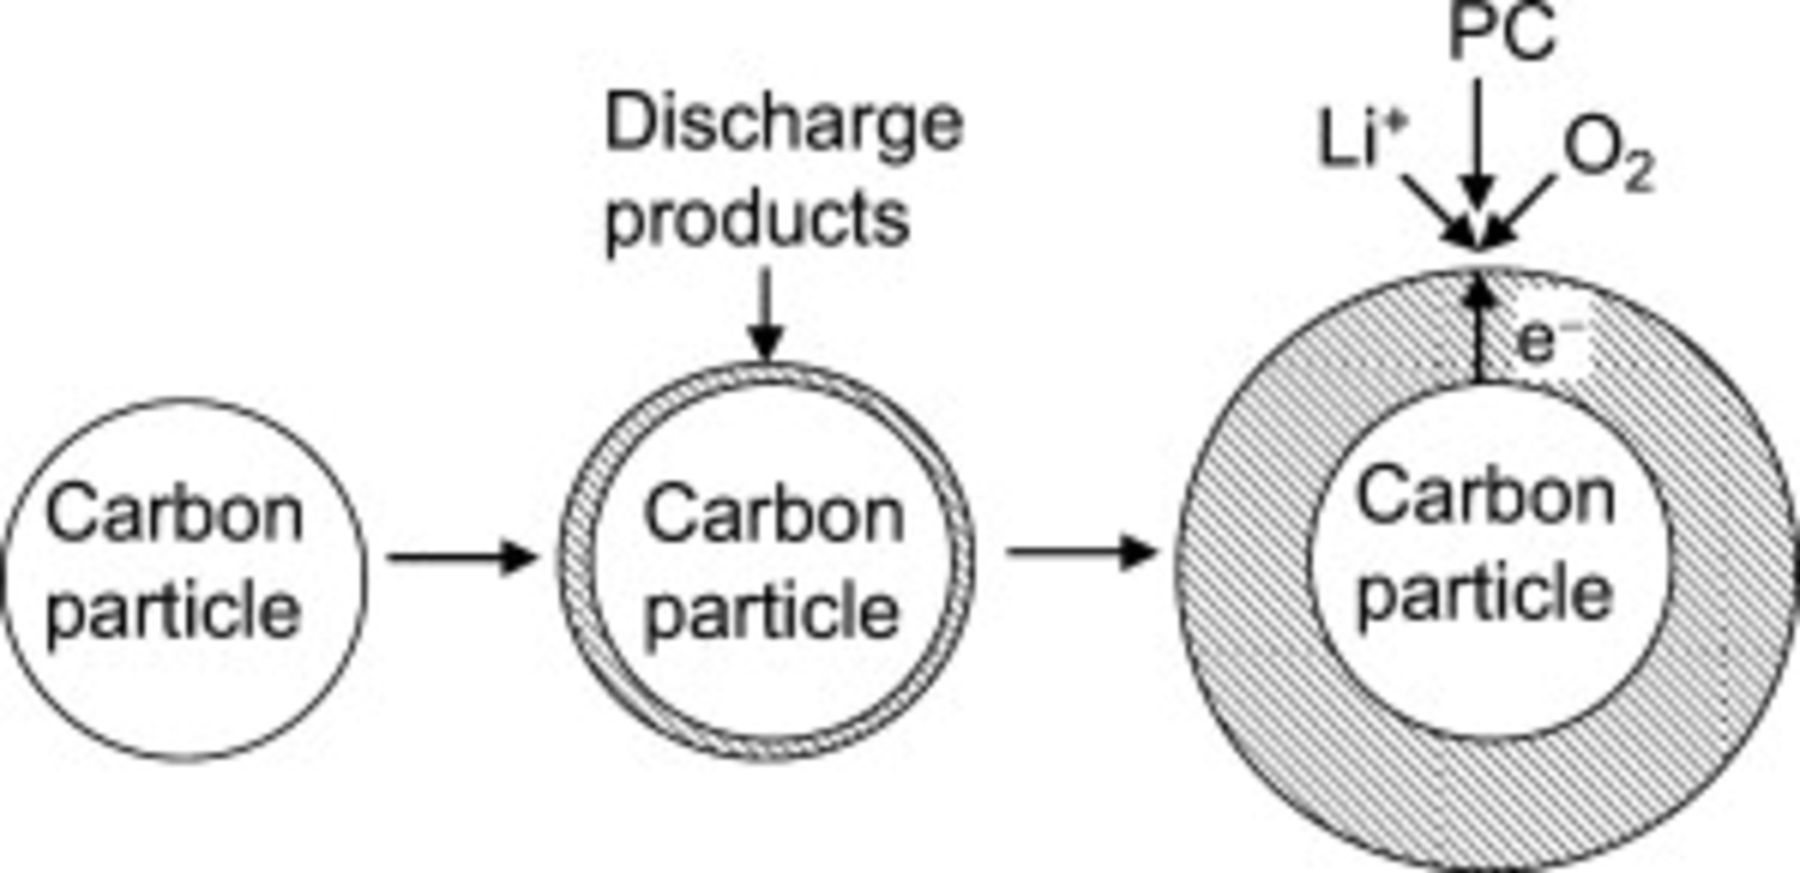
Figure 3. Schematic of the growth of the discharge products on the surface of a spherical carbon particle in the positive porous electrode. The diagram is not to scale (in our model the thickness of the discharge products is a small fraction of the radius of the carbon particles).
Description of the Ab Initio Modeling Methods
The electronic structure properties (e.g., bandgaps) of the potential discharge products were computed at the density functional level of theory30 (DFT) as implemented in the VASP package.31 In this study, all computations were performed using the Perdew-Burke-Ernzerhof exchange-correlation functional with a plane- wave basis set ( cutoff) and projector augmented wave pseudopotentials.32, 33 Brillouin-zone integration was computed with a (6,6,6), (6,6,2), and (6,6,2)
  -point mesh for the primitive unit cell of
  ,
,  , and
, and  , respectively. To provide a more accurate estimate of the electronic bandgaps in these crystalline materials, we used Hedin's GW approximation to the electron self-energy.34
All electronic structure calculations were carried out on DFT-optimized structures of  ,
,  , and
, and  . Experimentally,
  is found to crystallize in a cubic antifluorite structure with
  (α phase, space group
  ),35
),35  crystallizes in a hexagonal structure with lattice parameters
  and
and  (
(
 space group),36 and
  crystallizes in a monoclinic structure with lattice parameters
  ,
,  ,
,  , and
, and  (
( space group).37
Determination of the Thermodynamic, Kinetic, and Transport Properties Used in the Model of the Porous-Electrode Cell
Many properties are required to construct a physics-based model of the Li/oxygen battery. In this section we explain how the properties are obtained and stress that we avoid the use of fitting parameters. Rather, all properties come from direct measurements or are physically realistic values. The properties are summarized in Table II and in the following discussion are divided into cell design, thermodynamic, transport, and kinetic properties.
Table II. Properties used in the modeling of the Li/oxygen porous-electrode cell.
| Properties | Value | Units |
|---|---|---|
| Thickness | ||
| Separator | 250 |

|
| Positive electrode | 1170 |

|
| Separator volume fractions | ||
| Electrolyte | 0.9 | |
| Glass separator material | 0.1 | |
| Positive electrode volume fractions | ||
| Electrolyte | 0.878 | |
| Super P carbon | 0.02 | |
| Binder | 0.012 | |
| Ni mesh | 0.09 | |
| Positive electrode matrix conductivity | 10 | S/m |
Kinetic rate constant, 
| ||
| Negative electrode |

|
|
| Positive electrode |

| m/s |
| Additional properties | Value | Units |
Density of 
| 2.11 |

|
| Initial salt concentration | 1.0 | M |
| Equilibrium oxygen concentration |

| M |
| Oxygen diffusion coefficient |

|

|
| Effective specific area of Super P carbon | 4.9 |

|
| Operating temperature | 298.15 | K |
 , constant in Eq. 9 , constant in Eq. 9
|

|

|
 , constant in Eq. 9 , constant in Eq. 9
|

| m |
The thickness of each region in the cell and the volume fractions of the various materials are set by cell construction. We reiterate our assumption that the separator and positive electrode are completely flooded so that there is no gas phase and a sharp boundary forms between the regions of the Ni mesh with and without electrolyte. We neglect the particle size distribution of the Super P carbon. We also assume that all the Super P carbon particles are well connected to the Ni mesh (i.e., contact resistances are zero).
An important thermodynamic property is the equilibrium potential of the cell. As discussed above, the reaction picture is complicated by irreversible steps such that the very notion of an electrochemical "equilibrium" in the system is questionable. Given the complexity of the reaction situation, we use the empirical open-circuit potential of the  cells we built just prior to the beginning of discharge as a stand-in for the equilibrium potential; the value is
  . The other thermodynamic property is the solubility of
  in the electrolyte. We use a value similar to one measured by Read et al.5 for
 in PC. Measurements of
  solubility for LiTFSI in PC have only been reported for air and not pure
  .38
.38
The kinetics of the Li metal reaction are difficult to define because of the complexity of the SEI layer that forms at its surface. We use a kinetic rate constant,  , which we assume includes the resistance of the SEI film.24 At the low current densities used in our porous-electrode experiments (
 ; the current densities in the flat-electrode experiments are much lower), the overpotential of the Li metal charge transfer is very small
  . We adjust the rate constant defined in Eq. 4 so that the initial overpotential on discharge closely matches the measured potential.
The electrolyte conductivity at  is taken from Xu et al. ,38 while its dependence on electrolyte concentration is given a typical form.39 The electrolyte diffusion coefficient and transference number are also given representative values.40 Given the low concentrations of
  in the electrolyte, we do not expect it to have a significant effect on the electrolyte transport properties. In any case, the low current densities of our experiments did not result in significant electrolyte concentration gradients in any of our simulations so the results are largely insensitive to the electrolyte transport properties. The diffusion coefficient of oxygen is an important transport property. We use a value that is comparable to that obtained by using Stokes's law as well as those measured by Laoire et al. in similar solvents.13 The electronic conductivity of the positive-electrode matrix is assumed to be sufficiently high that it operates at a single potential, because the Ni mesh provides a low resistance pathway between the current collector and all regions of the positive electrode.
The effective area of the Super P carbon is an important property because it determines the total area available for the deposition of the discharge products. While Super P carbon powder has an area of  the area available for reaction falls when it is mixed with a binder and dispersed in a battery electrode. It is difficult to measure accurately the area available for reaction, and we therefore adjust its value to match the capacity (in mAh/g Super P carbon) stored by the positive electrode at the lowest discharge current. The resulting value of
  is physically realistic. Setting the area available for reaction is equivalent to setting the effective radius of the agglomerated Super P carbon/PVDF particles. An area of
  corresponds to an effective particle radius of
  , much larger than the radius of individual Super P carbon particles
  and the thickness of the discharge products that forms (a maximum value of about
  ).
).
Results and Discussion
Figure 4 shows results of the flat-electrode experiments. First-discharge data from the two cells built for each current density are shown, as well as the approximate measured open-circuit potential prior to the start of discharge. If the discharge products formed a film that provided only an ohmic resistance to the passage of electrons, in the absence of mass-transfer limits a model with only the kinetic resistance and the electronic resistance of the discharge products should fit all the curves in Fig. 4. However, such a model with only two physical processes did not fit all the data; the model overpredicts the capacity obtained at 1.50 and  if it is fit to the
  data. One possibility for the failure of a simple two-physical-process model to account quantitatively for the higher current density results is that
  mass-transfer limitations (see the previous discussion) become important at the higher current densities. However, a more likely reason is that the complex chemistry producing the films involves both electrochemical and nonelectrochemical steps so that time as well as the amount of charged passed are both important. Until further work clarifies the rate dependence of the flat-electrode cells, we use the flat-electrode data at
  to fit the electronic resistance of the discharge products as a function of thickness. The empirical fit is shown as the solid line in Fig. 4, and the second axis on the bottom of the figure shows the thickness of the film (using the properties of
  ). The film thickness, tens of nanometers, is much too large for electron tunneling to provide electronic conduction through the film of discharge products. The physical basis of the exponential dependence of the film resistivity on film thickness remains unclear.
Figure 4. Discharge curves of flat-electrode cells at three current densities. The cell area is  . The solid line shows an empirical fit of the film resistance as a function of the thickness of the discharge products (calculated according to Reaction 2 with
  and
and  of discharge products resulting, and the density and molecular weight of
  ).
).
In Table III we collect the experimentally and theoretically determined bandgaps for  ,
,  , and
, and  . As the table shows these materials are insulators (the bandgap of an insulator is, roughly,
  or higher). The computed bandgaps suggest that, in principle, the electronic resistivity of
  is orders of magnitude smaller than that of
  or
or  . As discussed previously, the presence of vacancies, dopants, and amorphous structures may result in a lower electronic resistivity.7, 41 A detailed description of the electronic transport through defective layers of
  , which may give a more realistic picture of electronic conduction in practical
  structures than bandgap calculations on ideal crystals, has been proposed.7 In any case, creating a reversible couple with any of these materials as a discharge product will be difficult given the insulating characteristics of the crystalline phases.
Table III. Bandgaps for three possible discharge products of the Li/oxygen battery. Values estimated using the GW approximation are more accurate than those using DFT.42
| Discharge product | Experimental bandgap (eV) | Bandgap from DFT (eV) | Bandgap from GW (eV) |
|---|---|---|---|

| 7.99 | 4.97 | 7.44 |

| — | 1.99 | 5.12 |

| — | 5.06 | 8.83 |
aRef. 43.
Figure 5 shows results for the porous-electrode experiments and simulations. For the Super P carbon used in the porous electrode cells at the lowest current density about  Super P carbon (about
  ) is obtained. Using the properties of
  this amount of discharge products corresponds to about 2.4% of the volume of the positive electrode, well below a "theoretical" value of about 78% (a value that leaves 10% of the volume of the positive electrode as electrolyte that is available for
  and
and  transport). The simulations and experiments show a qualitative match, indicating the ability of physics-based modeling to capture the relevant physics of the Li/oxygen battery. The key aspect of the match is obtaining the resistance function from the flat-electrode data and using it in the porous-electrode model, with the assumption that the growth process is similar on both types of carbon. In Fig. 5 we also indicate the physical processes limiting cell performance. We attribute the difference between the initial open-circuit potential and the closed-circuit potential just after current is applied to the kinetic resistance associated with the discharge reactions. As discharge proceeds, an exponential increase in resistance is observed, just as is seen in the flat-electrode data shown in Fig. 4. At both low and high rates the high electronic resistivity of the discharge products contributes to this resistance rise. While pore clogging may occur and lead to an increase in the cell resistance, the flat-electrode experiments in which no pores are present show a very similar increase in cell resistance during discharge. Also, as only 2.4% of the volume of the positive electrode is filled with discharge products, only a limited number of pores could be clogged with such a small amount of material.
Figure 5. Discharge curves of porous-electrode cells at three current densities. The cell area is  .
.
Finally, we note that the capacity achieved at  is less than at
  . Figure 6 shows the internal oxygen concentration profiles at those current densities and reveals that at
  oxygen transport limitations prevent some of the depth of the positive electrode from being available for reaction. Figure 6 also shows the growth of the discharge products through the electrode depth. At
  the deposition is uniform and more occurs than at
  . At
. At  deposition occurs preferentially at the positive electrode/current collector interface. This modeling result is in accord with some experimental results showing more discharge products near the positive electrode/current collector boundary than the separator/positive electrode boundary.4, 44 For oxygen transport exclusively through the liquid electrolyte phase, a thinner porous positive electrode than that used in these tests will be required for high current densities.
Figure 6. Profiles of the oxygen concentration within the cell sandwich at select times for a current density of (a) 0.08 and (c)  , and the volume fraction of the discharge products for a current density of (b) 0.08 and (d)
  . Values from six times are shown:
  , 50, 200, 500, and
  , and the last time point.
Model-only results clarify the performance limitations
A vali dated model can be used to clarify the most significant performance limitations in a system by removing the influence of individual physical processes. Here, we focus on two limiting physical processes already discussed: diffusion of oxygen through the electrolyte and the electronic resistance of the discharge products. Figure 7 shows simulation-only results at 0.08 and  to distinguish the importance of each of these effects. To remove oxygen transport limitations the diffusion coefficient of oxygen was set to infinity (the solubility was kept the same), and to remove the passivation effect the electronic resistivity of the discharge products was set to zero. Figure 7a shows that at
  , removing oxygen transport limitations has little effect on the discharge potential or capacity obtained. However, removing the passivation caused by the high electronic resistivity of the discharge products has a dramatic effect on the potential and capacity obtained. By the end of the discharge without passivation the volume fraction of discharge products in the positive electrode grew to a much larger value (about 70%) than the 2.4% obtained without passivation. Figure 7b shows the effects of removing oxygen transport limitations and passivation at the higher current density of
  . Removing oxygen transport limits results in nearly a doubling of the capacity, but even if oxygen transport limitations remain, removing the passivation caused by the discharge products has a bigger effect; at the end of discharge the volume fraction of the discharge products in the positive electrode is about 25%. These simulations show the crucial role that passivation has on the discharge capacity and establishes passivation as the key physical process to be overcome if a nonaqueous Li/oxygen battery with a high practical specific energy is to be realized.
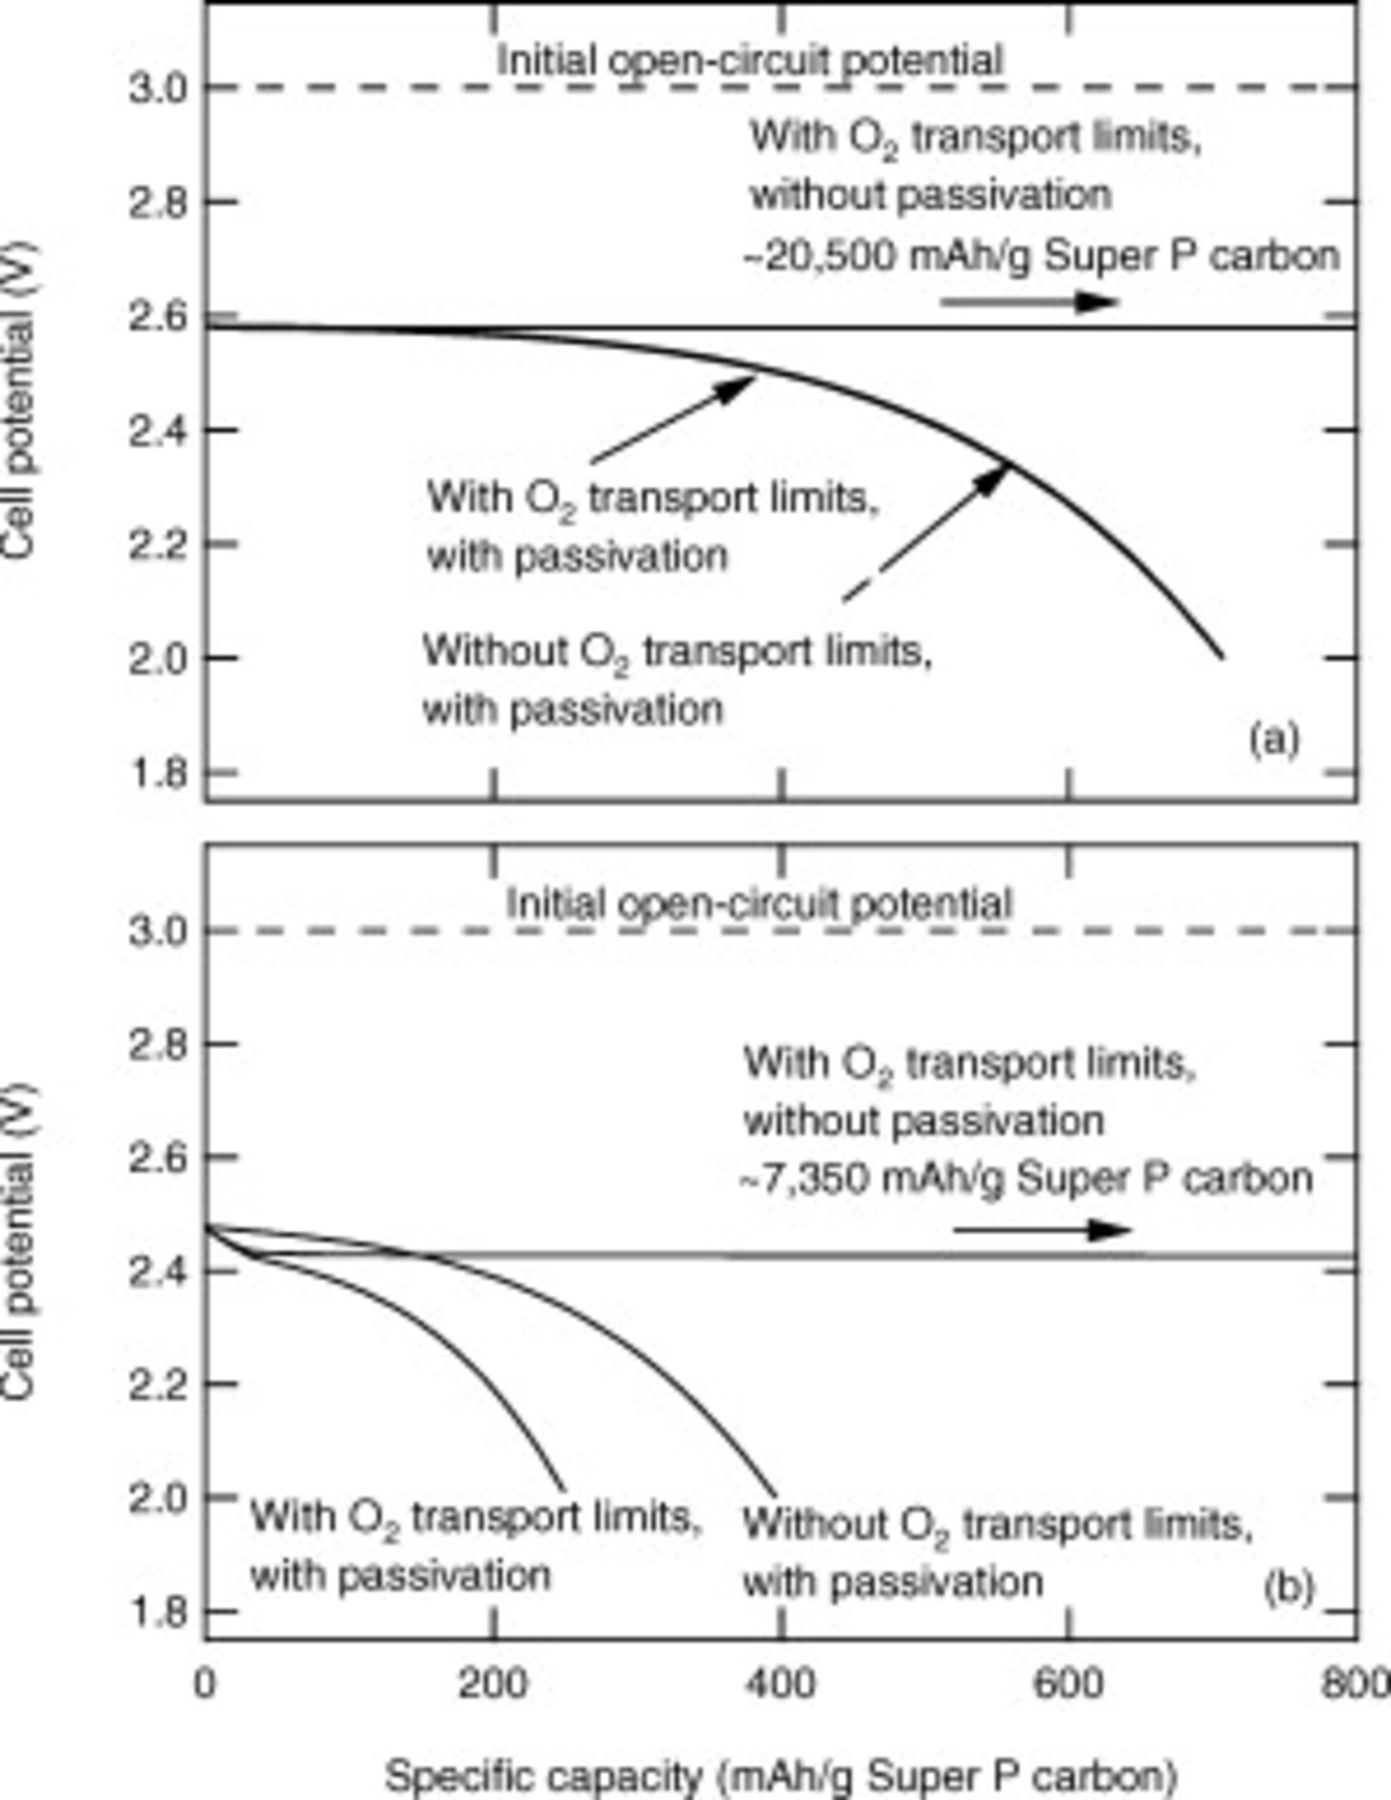
Figure 7. Simulation-only results demonstrating the relative impacts of eliminating oxygen transport limitations and eliminating the electronic resistance of the discharge products. (a) shows results at a current density of  ; the two simulations with passivation superpose. (b) shows results at a current density of
  .
.
To treat rigorously the growth of the discharge products that form in the simulations without passivation our model should be modified to treat particle joining (in order to use the correct interfacial area for deposition) and significant volume changes. Therefore, the results in Fig. 7 should be seen as qualitative. However, when the discharge product has no resistance, the geometry and length of the current pathways between the electrolyte/discharge product interface and the carbon particles do not matter, and the potential drops off due to  transport limitations. In particular, as the
  concentration is highest near the positive-electrode current collector, deposition occurs preferentially in that region until the electrolyte phase is fully displaced and
  transport is blocked.
Future Cell-Level Modeling Topics
To help frame future cell-level modeling challenges for the nonaqueous Li/oxygen battery and reiterate the importance of the formation of an electronically resistive discharge product, in Fig. 8 we show how a high specific energy cell may appear. The design is for a positive electrode of thickness  , assumes a discharge product of
  , and assumes the volume fraction of electrolyte is 90% in the charged state and 10% in the discharged state. The separator thickness is
  . The Li metal thickness is chosen so the electrodes have the same capacity. The discharge of this cell results in the displacement of 89% of the electrolyte originally in the positive electrode and all the Li metal being transferred to the positive electrode where it is stored in the
  product. If the discharge product is an insulator, the positive electrode will need to be nanostructured so that the length scale for conduction is very small. Otherwise, a method must be found to create an electronically conductive product. As Fig. 8 shows, the
  cell is an interesting case in which the mass increases (due to taking in
  from the external environment) and the volume decreases (due to the very low density of Li). A model of this cell sandwich will need to treat the movement of the Li metal/separator interface, dramatic volume changes in nearly every region of the cell, electrolyte convection out of the positive electrode and possibly to an external electrolyte reservoir, and particle joining resulting in changes to the interfacial area for reaction. Designing a reversible electrochemical system with such dramatic volume changes will require novel design approaches that modeling work can help guide.
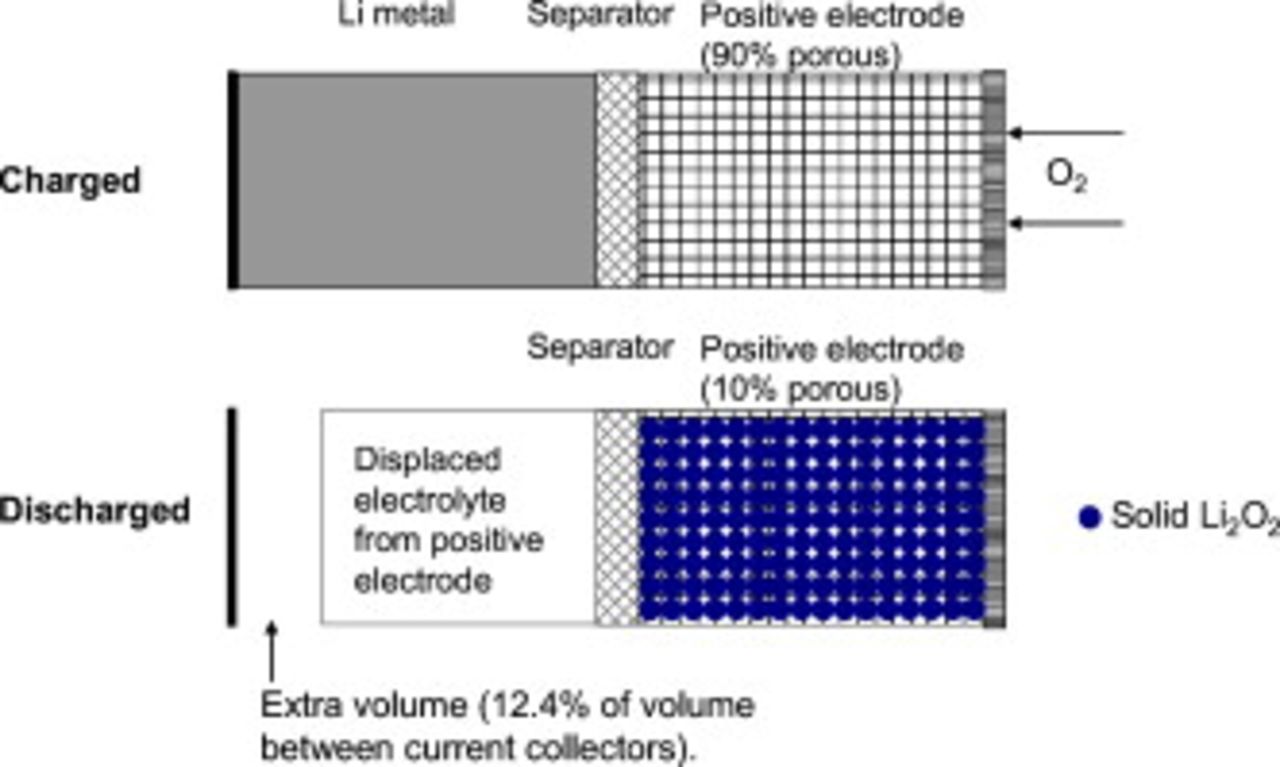
Figure 8. Schematic of a high-specific-energy Li/oxygen cell, clarifying the importance of having an electronically conductive discharge product and the significance of the volume changes that occur during the discharge process.
The present model was built using the properties of  . A research goal is to find an electrolyte that is stable to the discharge intermediates such that
  , the desired product, will result. How will this change the results of the present study? Most importantly, as shown in Table III, bulk crystalline
  is also an insulator. This implies that it, like
  , should form a very thin layer of discharge product before passivation occurs unless vacancies and surface conductivity dramatically reduce the resistivity of the structures that form. Therefore, we expect the principal results to remain the same, although small differences associated with the different density and molecular weight of
  and
and  will result. Finally, once reversible electrochemical reactions are established, the kinetic expression can be modified to incorporate the elementary steps, and modeling work on discharge, charge, and the origins of the overpotentials can proceed.
Conclusions
We have constructed the first physics-based model of the Li/oxygen battery that takes into account the major thermodynamic, transport, and kinetic processes in the system, and applied it to simulate first-discharge experiments on porous-electrode cells. By making use of flat-electrode experiments to obtain the resistance of the discharge products as a function of their thickness, we obtain a good match between porous-electrode experiments and simulations at three current densities.
Oxygen transport through the electrolyte can limit the capacity obtained from the cell, although at the lowest current density used in our experiments and simulations  oxygen transport limitations are minimal. For cells operated at the higher current densities
  required by a high specific power system, cell designs that minimize oxygen transport limitations will be required.
While oxygen transport limitations are clearly important at high current densities the high electronic resistivity of the discharge products is the main limitation to achieving a high practical specific energy in our Li/oxygen cells. The complex discharge reaction pathway that occurs in carbonate solvents appears to include electrochemical, chemical, and irreversible steps, and to produce carbonates as the dominant discharge products. It is the deposition of these species on the electrode surface that the experiments measure. Due to the electronically resistive nature of the discharge products passivation occurs at a thickness of tens of nanometers. Although the clogging of pores by the discharge products have been discussed by many authors as a limit on the capacity of the Li/oxygen cell, in our porous-electrode cells the discharge products filled no more than 2–3% of the electrode volume, too little for pore blockage alone to limit the discharge capacity. Rather, our flat-electrode discharge results, in which no pores are present, show a very similar shape to the porous-electrode results, and indicate that passivation by the electronically resistive discharge products, rather than pore clogging, is the major limitation to the capacity obtained.
The model developed here depends only minimally on the details of the chemical composition of the discharge products, as all proposed products have a high electronic resistivity. That is, both carbonates and  are highly resistive, and the main conclusions of our modeling work are equally applicable when electrolytes allow formation of
  as the final discharge product.
Our model should be seen as a first step toward understanding the physics of the Li/oxygen battery, and will be improved as additional experimental evidence becomes available. Ultimately, we expect physics-based modeling to hasten the understanding and design of a battery with the potential to have a very high practical specific energy.
Acknowledgments
The authors gratefully acknowledge Kumar Virwani of IBM Research, Almaden, for the SEM image presented in Fig. 2, and Daehyun Wee of the Bosch Research and Technology Center for assistance with the bandgap calculations of potential discharge products.
Robert Bosch Research and Technology Center assisted in meeting the publication costs of this article.
List of Symbols
| a | specific area,  of interfacial of interfacial  of electrode volume of electrode volume |
| c | concentration, 
|

| diffusion coefficient, 
|

| activity coefficient of the electrolyte salt |

| Faraday's constant, 
|

| kinetic rate constant |

| thickness of the discharge product, m |

| current density imposed on the cell,  superficial superficial |

| current density,  superficial superficial |

| current density normal to the interface,  interfacial interfacial |
| r | radius, m |
| R | gas constant, 
|

| electronic resistance of the discharge product, 
|

| temperature, K |

| transference number of 
|

| equilibrium potential, V |
Greek
| β | transfer coefficient |
| ε | volume fraction |

| surface overpotential, 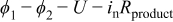
|
| κ | ionic conductivity, S/m |
| ρ | density, 
|
| σ | electronic conductivity, S/m |
| ϕ | potential, V |
Subscripts or Superscripts
| 1 | solid phase |
| 2 | liquid phase |

| electrolyte |