
Abstract
This study investigated the ionic species and electrochemical reduction of silicate ions at a solid graphite electrode in molten NaCl–CaCl2 eutectic melts with various concentrations of O2− ion at 1023 K. Silicate ion species in the melts with various O2−/SiO2 ratios ( were determined by Raman spectroscopy. The dominant species was SiO32− for
  = 1.0, and SiO44− for
  = 1.5 and 2.0. From cyclic voltammetry, XRD, and SEM analyses, electrochemical reduction was indicated for SiO32− and SiO44− at more negative than 1.0 V and 0.80 V vs Na+/Na, respectively. Formation of CaSi2 was confirmed at 0.50 V in all molten salts with
  = 1.0, 1.5, and 2.0. The potential ranges for pure Si deposition are almost the same in molten salts with
  = 1.0 and 1.5.
Export citation and abstract BibTeX RIS

This is an open access article distributed under the terms of the Creative Commons Attribution Non-Commercial No Derivatives 4.0 License (CC BY-NC-ND, http://creativecommons.org/licenses/by-nc-nd/4.0/), which permits non-commercial reuse, distribution, and reproduction in any medium, provided the original work is not changed in any way and is properly cited. For permission for commercial reuse, please email: permissions@ioppublishing.org.
Photovoltaic (PV) power generation is considered a source of clean and inexhaustible energy, which could be a substitute for conventional fossil-fuel power generation. According to the World Energy Outlook 2018 by the International Energy Agency (IEA), the share of PV power in the worldwide energy supply is expected to increase from 1.7% in 2017 1,2 to 10% by 2040 if the cost of PV cell production is reduced. The global production of PV cells reached 102.4 GW in 2018, approximately 350 times the value in 2000. 3 Since crystalline Si solar cells account for 96.9% of the worldwide production in 2018, 4 they are expected to remain mainstream in the PV industry for the time being. Thus, the global demand for high-purity crystalline Si, which is known as solar-grade Si (SOG-Si), will continue to increase in the future.
Currently, approximately 90% of SOG-Si is produced using the Siemens process. 5–8 Although the purity of Si produced in the Siemens process is sufficiently high, low productivity and high energy consumption hinder cost reduction. To develop a next-generation production process for SOG-Si, experimental studies on the purification of metallurgical-grade Si 9–13 and metallothermic reduction of silicon halides by metal reductants 14–17 have been conducted.
Over the past two decades, we have been studying the electrochemical reduction of solid SiO2 to Si in molten CaCl2 as a new production process for SOG-Si. 18–31 In molten CaCl2, the electrochemical reduction of insulating SiO2 proceeds by using a SiO2 contacting electrode, which provides a three-phase interface of conductor/SiO2/CaCl2.

To achieve efficient recovery of reduced Si, we proposed an electrochemical reduction process of SiO2 using a liquid Zn cathode in molten CaCl2. 32–34 The overall process consists of three major steps: electrolysis, precipitation, and refining. In the electrolysis step, the solid SiO2 is reduced to form a Si–Zn liquid alloy. Then, solid Si is precipitated by lowering the temperature of the liquid Si–Zn alloy during the precipitation step. The recovered Si is subjected to a refining step that comprises vacuum refining to remove residual Zn and directional solidification to manufacture SOG-Si ingots.
In our previous study, we found that the direct electrochemical reduction of solid SiO2 mainly occurred at the three-phase interface of Zn/SiO2/CaCl2. In addition to this, the liquid Ca–Zn alloy, which forms at potentials more negative than 0.60 V (vs Ca2+/Ca), contributed to the indirect reduction of SiO2 below the Zn/CaCl2 interface, that is, in the liquid Zn cathode. In such cases, however, the current efficiency was low because only a part of the Ca–Zn alloy contributed to the reduction of SiO2. 34
To improve the productivity of the process, we focused on the electrochemical reduction of dissolved SiO2, that is, silicate ions (such as SiO4 4−, SiO3 2−, and Si2O5 2−). When O2− ion is added to the molten salt, the dissolution of SiO2 can be expressed as follows:

The electrodeposition of crystalline Si films from silicate ions at a solid substrate in molten CaCl2 has been reported by Bard and co-workers. 35–37 However, the ionic species of silicates has not yet been investigated.
In this study, we used eutectic NaCl–CaCl2, which has a lower melting point (777 K) than that of pure CaCl2 (1045 K). The ionic species of silicates in molten eutectic NaCl–CaCl2 with various concentrations of CaO was investigated by Raman spectroscopy. Since the concentration of CaO used in this study is lower than its solubility (7.6 mol%), 38 it is considered to be completely dissociated into Ca2+ and O2−. Then, the electrochemical reduction of silicate ions was investigated at a solid graphite substrate as a preliminary study for a liquid Zn cathode.
Experimental
All of the experiments were conducted in a dry Ar atmosphere at 1023 K. The experimental procedures for (a) Raman spectroscopy and (b) electrochemical reduction of silicate ions are described as follows.
Raman spectroscopy of silicate ions
Salt preparation was conducted in a dry Ar-filled glove box (less than 1 ppm O2 and 1 ppm H2O). NaCl and CaCl2 powders (FUJIFILM Wako Pure Chemical Corp., reagent grade) were mixed in a eutectic composition (NaCl:CaCl2 = 47.9:52.1 mol%). Pre-determined amounts of CaO (FUJIFILM Wako Pure Chemical Corp., 98.0%), SiO2 (Sigma-Aldrich, 10–20 nm, 99.5%), and CaSiO3 (Sigma-Aldrich, 200 mesh, 99%) powders were added to the eutectic mixture. CaO was dried at 1273 K for 2 h. SiO2 and CaSiO3 were added as received. The added amounts were 0, 0.5, and 1.0 mol% for CaO, 0 and 1.0 mol% for SiO2, and 0 and 1.0 mol% for CaSiO3. The mixture was loaded into a graphite crucible (Toyo Tanso Co., Ltd, IG-110 grade, o.d. 55 mm × i.d. 49 mm × height 150 mm) and dried under vacuum at 453 K for 2 d and then at 723 K for 1 d. After the temperature was increased to 1023 K and maintained for 1 d to sufficiently dissolve the additives, the salt was quickly sampled using a borosilicate glass tube (Pyrex®, o.d. 6 mm × i.d. 4 mm).
Figure 1 shows a schematic drawing of the experimental apparatus used for Raman spectroscopy. The sampled salt was then loaded into a Pt pan (Rigaku Corp., o.d. 5 mm × height 2.5 mm) and placed in an airtight high-temperature stage (Japan High Tech Co., Ltd, 10042). After the mixture was heated to 1023 K, the ionic species of silicates was investigated using a micro-Raman spectrometer (Tokyo Instruments, Nanofinder 30) using a laser source with an excitation wavelength of 532 nm. Origin 2020 software was used to deconvolve the spectra using the Viogtian function.
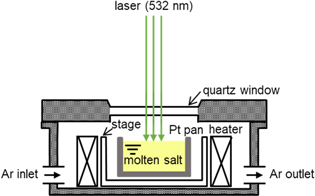
Figure 1. Schematic of experimental apparatus for Raman spectroscopy of molten salt.
Download figure:
Standard image High-resolution imageElectrochemical reduction of silicate ions
NaCl and CaCl2 powders were mixed in the eutectic composition and loaded into a graphite crucible (Toyo Tanso Co., Ltd, IG-110 grade, o.d. 100 mm × i.d. 95 mm × height 120 mm). The crucible was placed at the bottom of a graphite vessel in an airtight Kanthal container. The eutectic mixture was dried under vacuum at 453 K for 2 d and at 723 K for 1 d. After the temperature was raised to 1023 K, pre-determined amounts of CaO (0, 0.5 or 1.0 mol%) and CaSiO3 (1.0 mol%) powders were added to the eutectic mixture.
Figure 2 shows a schematic drawing of the experimental apparatus for the electrochemical reduction of silicate ions. All electrochemical measurements were conducted by a three-electrode method using an electrochemical measurement system (Hokuto Denko Corp., HZ-7000) in a glove box. As the working electrodes, a flag-shaped graphite plate (Toyo Tanso Co., Ltd, 3 mm × 3 mm × thickness 0.5 mm) was used for cyclic voltammetry and a graphite plate (Toyo Tanso Co., Ltd, 10 mm × 10 mm × thickness 0.5 mm) was used for electrolysis. The counter electrodes were glass-like carbon (Tokai Carbon Co., Ltd, diameter: 3.0 mm) for cyclic voltammetry and a graphite square bar (Toyo Tanso Co., Ltd, 5 mm × 5 mm) for electrolysis. A Si square bar (Furuuchi Chemical Corp., 5 mm × 5 mm, 10 N purity) was used as the quasi-reference electrode. The potential of the reference electrode was calibrated with respect to a dynamic Na+/Na potential, determined by cyclic voltammetry on a Mo wire (Nilaco Corp., diameter 1.0 mm) electrode.
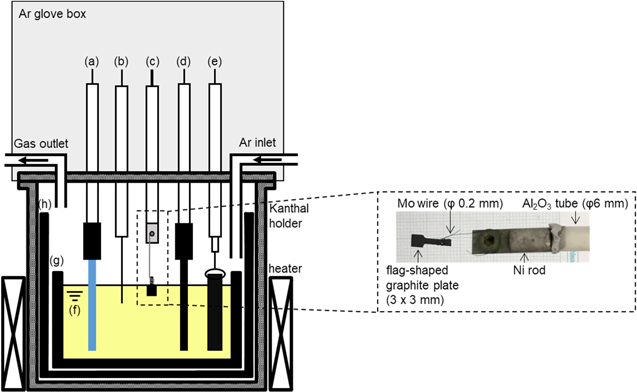
Figure 2. Schematic of the electrolysis cell. (a) Si quasi-reference electrode, (b) Na+/Na dynamic reference electrode on a Mo wire, (c) flag-like graphite working electrode, (d) glass-like carbon counter electrode, (e) graphite counter electrode, (f) molten NaCl–CaCl2 containing CaO and CaSiO3, (g) graphite crucible, and (h) graphite holder.
Download figure:
Standard image High-resolution imageThe obtained samples were washed in an 1 M HCl solution prepared from FUJIFILM Wako Pure Chemical Corp., reagent grade, 36 wt.% at 333 K for 15 min to remove the salt adhered to the deposits. The surfaces of the samples were observed using an optical microscope (Thanko Inc., DILITE30) and scanning electron microscope (SEM, Thermo Fisher Scientific Inc., Phenom Pro Generation 5). The deposits were also characterized by X-ray diffraction (XRD, Rigaku, Ultima IV, Cu-Kα, λ = 1.5418 Å, 40 kV, 40 mA).
Result and Discussion
Ionic species of silicates
Figure 3 shows original and deconvolved Raman spectra for molten eutectic NaCl–CaCl2 containing different amounts of CaO and SiO2 at 1023 K. The original spectra were shown with background subtracted. Within the wavenumber range of 700–1100 cm−1, no bands were observed for the melts without SiO2. For the melts containing 0.5 mol% CaO and 1.0 mol% SiO2 ( = 0.5), and that with addition of 1.0 mol% CaO and 1.0 mol% SiO2 (
 = 1.0), a strong band was detected near 970 cm−1 and several weak bands at about 820, 920, and 1050 cm−1. The spectra were deconvolved using the Viogtian function. According to previous studies,
39–41
the symmetric stretch vibrations of SiO4
4−, Si2O7
6−, SiO3
2− and Si2O5
2− are reported at 850–880, 900–920, 950–980, and 1050–1100 cm−1, respectively. Therefore, bands at 920, 972 and 1053 cm−1 are assigned to Si2O7
6−, SiO3
2− and Si2O5
2−. The band at 825 cm−1 in our data could be attributed to SiO4
4− vibration. However, the wavenumber is slightly lower than the reported value, 850–880 cm−1, for SiO4
4−. Wang et al. reported that the Raman spectra for CaO–SiO2–CaCl2 slags gradually shift to lower wavenumber with increasing chlorine content, and that chlorine atoms can also be substituted with oxygen atoms.
42
Thus, oxygen atoms of SiO4
4− ion might be partially substituted with chlorine atoms according to the following reaction.
= 1.0), a strong band was detected near 970 cm−1 and several weak bands at about 820, 920, and 1050 cm−1. The spectra were deconvolved using the Viogtian function. According to previous studies,
39–41
the symmetric stretch vibrations of SiO4
4−, Si2O7
6−, SiO3
2− and Si2O5
2− are reported at 850–880, 900–920, 950–980, and 1050–1100 cm−1, respectively. Therefore, bands at 920, 972 and 1053 cm−1 are assigned to Si2O7
6−, SiO3
2− and Si2O5
2−. The band at 825 cm−1 in our data could be attributed to SiO4
4− vibration. However, the wavenumber is slightly lower than the reported value, 850–880 cm−1, for SiO4
4−. Wang et al. reported that the Raman spectra for CaO–SiO2–CaCl2 slags gradually shift to lower wavenumber with increasing chlorine content, and that chlorine atoms can also be substituted with oxygen atoms.
42
Thus, oxygen atoms of SiO4
4− ion might be partially substituted with chlorine atoms according to the following reaction.

Similar fitting results were obtained for the melt with  = 1.0; there is a strong band at 968 cm−1 for SiO3
2−, and three weak bands at 822, 920, and 1050 cm−1 attributed to SiO4
4−, Si2O7
6−, and Si2O5
2−, respectively. As the dominant silicate ion was SiO3
2− in the melts with
= 1.0; there is a strong band at 968 cm−1 for SiO3
2−, and three weak bands at 822, 920, and 1050 cm−1 attributed to SiO4
4−, Si2O7
6−, and Si2O5
2−, respectively. As the dominant silicate ion was SiO3
2− in the melts with  ≤ 1.0, the dissolution limit of SiO2 is likely to be determined by the O2−content. In addition, the weak bands of SiO4
4−, Si2O7
6−, and Si2O5
2− were observed because of the equilibrium reactions of SiO3
2− and Si2O7
6−.
≤ 1.0, the dissolution limit of SiO2 is likely to be determined by the O2−content. In addition, the weak bands of SiO4
4−, Si2O7
6−, and Si2O5
2− were observed because of the equilibrium reactions of SiO3
2− and Si2O7
6−.


As mentioned above, the ionic species of SiO2 in melts with  ≤ 1.0 was mainly attributed to SiO3
2−. To further investigate the stable silicate ions in the melts with various
≤ 1.0 was mainly attributed to SiO3
2−. To further investigate the stable silicate ions in the melts with various  values (≥ 1.0), CaSiO3 was used as the SiO2 source. This is because the dissolution rate of CaSiO3 is significantly higher than that of SiO2, which enables the quick preparation of the melts with target compositions. By adding CaO as the O2− source, melts with
  = 1.0, 1.5, and 2.0 were prepared and analyzed by Raman spectroscopy. Figure 4 shows the original and deconvolved Raman spectra of the melts. Figure 4(a) was deconvolved to 3 bands at 920 cm−1 for Si2O7
6−, 972 cm−1 for SiO3
2−, and 1050 cm−1 for Si2O5
2−. For the deconvolution of Fig. 4(b), the band near 830 cm−1 was added and the spectra were deconvolved to 4 bands. Although the band for Si2O7
6− is weak, the coefficient of determination, R2, for 4 bands is 0.9909, which is higher than that for 3 bands without Si2O7
6− band (R2 = 0.9842). Therefore, Figs. 4b and 4c were deconvolved to 4 bands. The deconvolution results of the Raman spectra are presented in Table I. As the result, for the melt with
= 1.0, 1.5, and 2.0 were prepared and analyzed by Raman spectroscopy. Figure 4 shows the original and deconvolved Raman spectra of the melts. Figure 4(a) was deconvolved to 3 bands at 920 cm−1 for Si2O7
6−, 972 cm−1 for SiO3
2−, and 1050 cm−1 for Si2O5
2−. For the deconvolution of Fig. 4(b), the band near 830 cm−1 was added and the spectra were deconvolved to 4 bands. Although the band for Si2O7
6− is weak, the coefficient of determination, R2, for 4 bands is 0.9909, which is higher than that for 3 bands without Si2O7
6− band (R2 = 0.9842). Therefore, Figs. 4b and 4c were deconvolved to 4 bands. The deconvolution results of the Raman spectra are presented in Table I. As the result, for the melt with  = 1.0, the dominant silicate ion is SiO3
2−, which is consistent with the melt with the same
= 1.0, the dominant silicate ion is SiO3
2−, which is consistent with the melt with the same  prepared from CaO and SiO2. When
  increased to 1.5, the dominant silicate species was SiO4
4−, secondary dominant SiO3
2−, and minor Si2O7
6− and Si2O5
2−. Although the ratio of O2−/SiO2 = 1.5 corresponds to Si2O7
6− ion, the equilibrium reaction of Si2O7
6− (reaction 5) would occur because of its poor stability in the melt. With respect to the melt with
increased to 1.5, the dominant silicate species was SiO4
4−, secondary dominant SiO3
2−, and minor Si2O7
6− and Si2O5
2−. Although the ratio of O2−/SiO2 = 1.5 corresponds to Si2O7
6− ion, the equilibrium reaction of Si2O7
6− (reaction 5) would occur because of its poor stability in the melt. With respect to the melt with  = 2.0, SiO4
4− is the dominant silicate ion which is consistent with the composition calculated from the O2−/SiO2 ratio.
= 2.0, SiO4
4− is the dominant silicate ion which is consistent with the composition calculated from the O2−/SiO2 ratio.
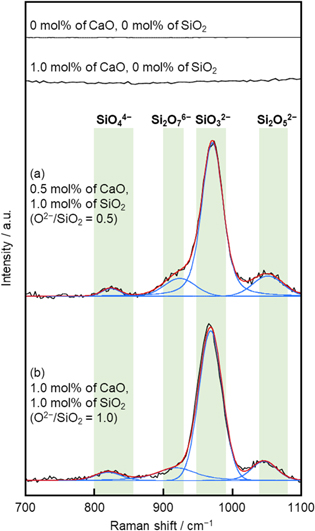
Figure 3. Original and deconvolved Raman spectra for molten eutectic NaCl–CaCl2 containing different amounts of CaO and SiO2 at 1023 K.
Download figure:
Standard image High-resolution image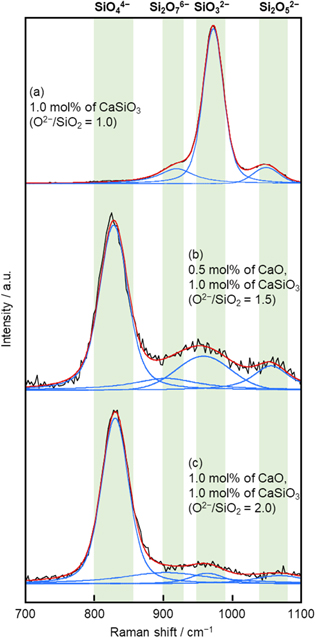
Figure 4. Original and deconvolved Raman spectra for molten NaCl–CaCl2 containing different amounts of CaO and CaSiO3.
Download figure:
Standard image High-resolution imageTable I. Raman spectroscopy data for samples that obtained in molten NaCl–CaCl2 containing different amounts of CaO and CaSiO3.
| Melt composition | Wavenumber / cm−1 (Band intensity fraction† / %) | |||
|---|---|---|---|---|
| SiO4 4− | Si2O7 6− | SiO3 2− | Si2O5 2− | |
| 1.0 mol% of CaSiO3 | — | 920w | 974 s | 1050vw |
| (O2−/SiO2 = 1.0) | (15.6) | (75.9) | (8.6) | |
| 0.5 mol% of CaO, | 829 s | 905w | 960w | 1058w |
| 1.0 mol% of CaSiO3 | (57.0) | (11.9) | (18.7) | (12.5) |
| (O2−/SiO2 = 1.5) | ||||
| 1.0 mol% of CaO, | 831 s | 905w | 965vw | 1070vw |
| 1.0 mol% of CaSiO3 | (67.9) | (18.7) | (5.8) | (7.6) |
| (O2−/SiO2 = 2.0) | ||||
Abbreviations: vw, very weak; w, weak; s, strong. †)Calculated from fitted band area.
Electrochemical reduction of silicate ions
Figure 5 shows the cyclic voltammograms of a graphite electrode in molten NaCl–CaCl2 containing different amounts of CaO and CaSiO3. The black curves show the voltammograms before the addition of CaSiO3 and CaO (blank). The small cathodic current observed around 0.5 V (vs Na+/Na) is likely due to the intercalation of Ca2+ into graphite. After the addition of 1.0 mol% CaSiO3 ( = 1.0), as shown in Fig. 5a, cathodic currents increased from 1.0 V, suggesting the electrochemical reduction of dominant SiO3
2− that observed in the Raman data (Fig. 4a). A larger cathodic current peak at around 0.50 V is considered as the formation of Na–Si and/or Ca–Si alloys. Figure 5b shows the voltammogram measured after the addition of 0.50 mol% CaO and 1.0 mol% CaSiO3 (
= 1.0), as shown in Fig. 5a, cathodic currents increased from 1.0 V, suggesting the electrochemical reduction of dominant SiO3
2− that observed in the Raman data (Fig. 4a). A larger cathodic current peak at around 0.50 V is considered as the formation of Na–Si and/or Ca–Si alloys. Figure 5b shows the voltammogram measured after the addition of 0.50 mol% CaO and 1.0 mol% CaSiO3 ( = 1.5). A small cathodic peak observed at 0.95 V is likely due to the electrochemical reduction of secondary dominant SiO3
2− that observed in the Raman data (Fig. 4b). Cathodic currents increased rapidly from 0.80 V, which seems to be due to the electrochemical reduction of dominant SiO4
4−. The larger currents compared to Fig. 5a suggest that diffusion coefficient of SiO4
4− is larger than that of SiO3
2−. Since SiO4
4− ions are known to have weaker interaction each other compared with SiO3
2− ions,
39
it is reasonable that the effective size of SiO4
4− is smaller than that of SiO3
2−. A cathodic current peak at around 0.50 V is regarded as the formation of Na–Si and/or Ca–Si alloys, which is similar to that observed in Fig. 5a. A voltammogram of the melt containing 1.0 mol% CaO and 1.0 mol% CaSiO3 (
= 1.5). A small cathodic peak observed at 0.95 V is likely due to the electrochemical reduction of secondary dominant SiO3
2− that observed in the Raman data (Fig. 4b). Cathodic currents increased rapidly from 0.80 V, which seems to be due to the electrochemical reduction of dominant SiO4
4−. The larger currents compared to Fig. 5a suggest that diffusion coefficient of SiO4
4− is larger than that of SiO3
2−. Since SiO4
4− ions are known to have weaker interaction each other compared with SiO3
2− ions,
39
it is reasonable that the effective size of SiO4
4− is smaller than that of SiO3
2−. A cathodic current peak at around 0.50 V is regarded as the formation of Na–Si and/or Ca–Si alloys, which is similar to that observed in Fig. 5a. A voltammogram of the melt containing 1.0 mol% CaO and 1.0 mol% CaSiO3 ( = 2.0) is shown in Fig. 5c. A rapid increase of cathodic current from 0.75 V is likely attributed to the electrochemical reduction of dominant SiO4
4−. The current peak at around 0.50 V is ascribed to the same reaction of Na–Si and/or Ca–Si alloys formation, similar to the other two melts in Figs. 5a and 5b.
= 2.0) is shown in Fig. 5c. A rapid increase of cathodic current from 0.75 V is likely attributed to the electrochemical reduction of dominant SiO4
4−. The current peak at around 0.50 V is ascribed to the same reaction of Na–Si and/or Ca–Si alloys formation, similar to the other two melts in Figs. 5a and 5b.
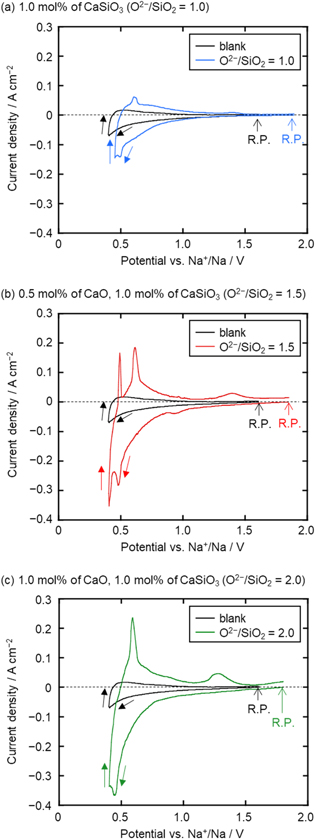
Figure 5. Cyclic voltammograms at a graphite electrode in molten NaCl–CaCl2 before and after the addition of (a) 1.0 mol% of CaSiO3, (b) 0.5 mol% of CaO and 1.0 mol% of CaSiO3, and (c) 1.0 mol% of CaO and 1.0 mol% of CaSiO3 at 1023 K. Scan rate: 50 mV s−1. R. P.: Rest potential.
Download figure:
Standard image High-resolution imageBased on the voltammetry results, potentiostatic electrolysis was conducted at 0.50, 0.70, and 0.90 V with a constant charge density of −14 C cm−2 in molten NaCl–CaCl2 containing (i) 1.0 mol% CaSiO3 ( = 1.0), (ii) 0.5 mol% CaO and 1.0 mol% CaSiO3 (
 = 1.5), and (iii) 1.0 mol% CaO and 1.0 mol% CaSiO3 (
 = 2.0). Optical images of the original graphite substrate and electrolyzed samples are shown in Fig. 6. Deposits in brown or dark brown color were observed at all samples except the sample obtained at 0.90 V in molten salt (iii). No significant deposits were observed at that sample.
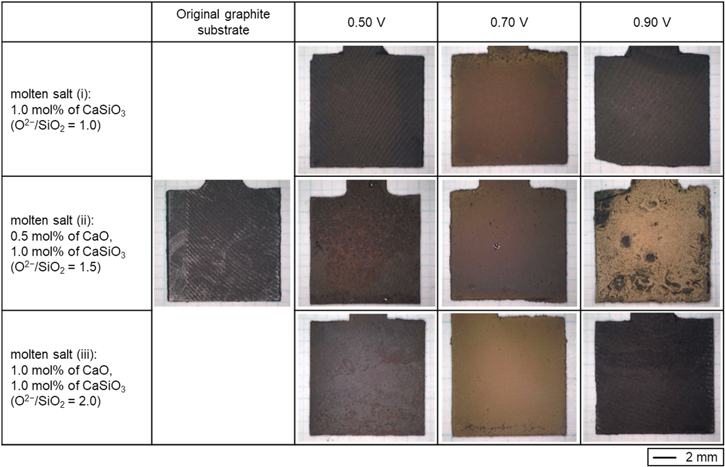
Figure 6. Optical images of a graphite substrate and the samples obtained by electrolysis (0.50 V, 0.70 V, and 0.90 V) at graphite plates in molten NaCl–CaCl2 containing different amounts of CaO and CaSiO3 (left vertical colum) at 1023 K. Charge density: −14 C cm−2.
Download figure:
Standard image High-resolution imageFigure 7 shows XRD patterns of an original graphite substrate and the electrolyzed samples. In Fig. 7a, the existence of Si was confirmed in the samples obtained at 0.70 V and 0.90 V in molten salt (i). Thus, the increase in cathodic current from 1.0 V in Fig. 5a is confirmed to be the electrochemical reduction of SiO3 2− to solid Si.

The XRD pattern at 0.50 V indicated the existence of CaSi2, which was identified by the strongest peak at 32.0 degree (relative intensity 100), and the second-strongest one at 46.8 degree (relative intensity 42). Since CaSi2 was identified at 0.50 V, the cathodic current peak at 0.50 V corresponds to the formation of CaSi2.


In molten salt (ii), only Si deposits were confirmed for samples obtained at 0.70 and 0.90 V. As approximately 20% of SiO3 2− was confirmed by Raman spectroscopy, as shown in Table I, the small cathodic peak at 0.95 V is considered to be the electrochemical reduction of SiO3 2− to solid Si (reaction 6). The cathodic current increase from 0.80 V is attributed to the electrochemical reduction of SiO4 4−.

In order to confirm the results shown above, thermodynamic data associated with the electrochemical reduction of SiO3 2− and SiO4 4− were calculated. Generally, the difference in reduction potential of SiO3 2− and SiO4 4− can be calculated from the Gibbs energies for the decomposition reactions, ΔGd(l, in melt).


Here, CaSiO3(l, in melt) and Ca2SiO4(l, in melt) are CaSiO3 and Ca2SiO4 dissolved into molten salt. However, these Gibbs energies can not be calculated from the reported data. On the other hand, the Gibbs energies for the decomposition reactions for solid CaSiO3 and Ca2SiO4, ΔGd(s), can be calculated from literature. 43,44


Here, we assumed that the difference of the Gibbs energy, ΔGd(l, in melt) − ΔGd(s), is almost same for CaSiO3 and Ca2SiO4, so that ΔGd(s) could be used to estimate the difference in reduction potential of SiO3 2− and SiO4 4−. The calculated data are shown in Table III. Since the standard Gibbs energy for CaSiO3(s) is smaller than that for Ca2SiO4(s), the electrochemical reduction of SiO3 2− would start from a more positive potential than SiO4 4−. From the Nernst equation for 4-electron reaction, the difference in the reduction potential of CaSiO3(s) and Ca2SiO4(s) was calculated to be 0.16 V, which is approximately consistent with the results of the voltammetry. As the mixture of Si and CaSi2 was detected at 0.50 V, the cathodic current peak at 0.50 V is attributed to the formation of CaSi2 expressed in reactions 7 and 8.
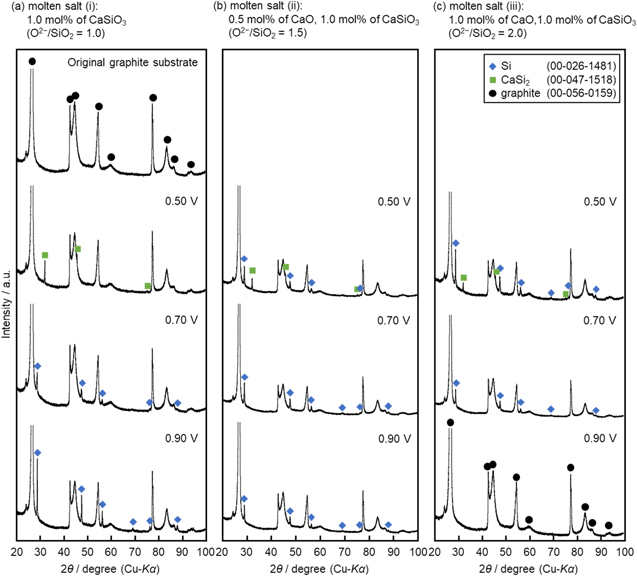
Figure 7. XRD patterns of a graphite substrate and the samples obtained by electrolysis at graphite plates in molten NaCl–CaCl2 containing different amounts of CaO and CaSiO3 at 1023 K. Charge density: −14 C cm−2.
Download figure:
Standard image High-resolution imageTable II. XRD results for samples in molten NaCl–CaCl2 containing different amounts of CaO and CaSiO3.
| Melt composition | Identified phase of electrolyzed samples | ||
|---|---|---|---|
| 0.50 V | 0.70 V | 0.90 V | |
| 1.0 mol% of CaSiO3 | CaSi2 | Si | Si |
| (O2−/SiO2 = 1.0) | |||
| 0.5 mol% of CaO, | Si | Si | Si |
| 1.0 mol% of CaSiO3 | CaSi2 | ||
| (O2−/SiO2 = 1.5) | |||
| 1.0 mol% of CaO, | Si | Si | no deposit |
| 1.0 mol% of CaSiO3 | CaSi2 | ||
| (O2−/SiO2 = 2.0) | |||
Table III. Standard Gibbs energies for decomposition reactions of CaSiO3(s) and Ca2SiO4(s) to Si(s), CaO(l), and O2(g) at 1023 K.
| Reaction | Standard Gibbs energy, ΔG° / kJ mol−1 |
|---|---|
| CaSiO3(s) → Si(s) + CaO(l) + O2(g) | 869.4 |
| Ca2SiO4(s) → Si(s) + 2 CaO(l) + O2(g) | 970.0 |
For samples obtained in molten salt (iii), the existence of pure Si was confirmed at only 0.70 V and the mixture of Si and CaSi2 at 0.50 V. As only graphite was detected at 0.90 V, the increase in cathodic current from 0.75 V would correspond to the electrochemical reduction of dominant SiO4 4− to solid Si (reaction 9), and the current peak at around 0.5 V is the formation of CaSi2 (reaction 7, 8). The identified phases are summarized in Table II.
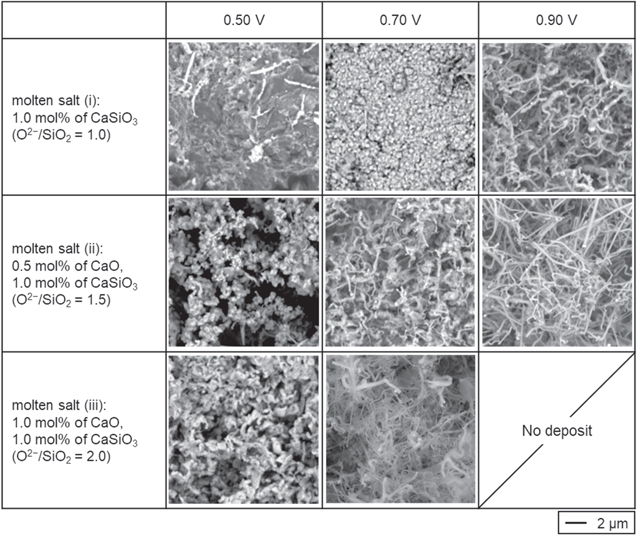
Figure 8 shows the surface SEM images of the deposits. In molten salt (i), wire-like Si, particle Si and dense CaSi2 were obtained at 0.90, 0.70 V and 0.50 V, respectively. In molten salt (ii), wire-like Si with different shapes were deposited at 0.70 and 0.90 V, and particle Si was formed at 0.50 V. For samples obtained in molten salt (iii), wire-like Si was observed at 0.70 V and particle Si at 0.50 V. The change in morphology of reduced Si is likely due to the change of overpotential and current density. Generally, when the overpotential is low and current density low, electrodeposits become field-oriented isolated crystals type, such as wires. 45 On the other hand, when the overpotential is higher and current density higher, the electrodeposits shift to unoriented dispersion type, such as particles. 45 In molten salt (i), the potential of 0.90 V would correspond to the low overpotential and current density, which results in the formation of wire-like Si. The potential of 0.70 V is considered to be classified as the high overpotential and current density, resulting in the formation of particle Si. In molten salt (iii), the electrochemical reduction of SiO4 4− starts from a more negative potential compared with SiO3 2−. Then, the potential of 0.70 V corresponds to the low overpotential and current density, giving wire-like Si. The potential of 0.50 V is classified as the high overpotential and current density, resulting in the formation of particle Si. In molten salt (ii), SiO4 4− and SiO3 2− are dominant and second dominant species, respectively. Therefore, by the same logic as above, wire-like Si is formed from SiO3 2− at 0.90 V and from SiO4 4− at 0.70 V. In the same manner, particle Si is electrodeposited from SiO4 4− at 0.50 V.
Figure 8. SEM images of the samples obtained by electrolysis (0.50 V, 0.70 V, and 0.90 V) at graphite plates in molten NaCl–CaCl2 containing different amounts of CaO and CaSiO3 (left vertical colum) at 1023 K. Charge density: −14 C cm−2.
Download figure:
Standard image High-resolution image
All the results shown above indicate that the electrodeposition of Si starts from approximately 0.2 V more positive for SiO3 2− compared with SiO4 4−. Considering that the formation of Ca–Zn, which reduces the current efficiency of Si–Zn alloy production, has been confirmed to proceed from 0.40 V, SiO3 2−, which has a wider potential range to Ca-Zn alloy formation than SiO4 4−, is more suitable for the Si–Zn alloy production. Therefore, molten salt (i), in which SiO3 2− is dominant and molten salt (ii), which contains SiO3 2− as a secondary dominant species, are suitable for the electrodeposition of Si at a liquid Zn cathode.
Conclusions
The ionic species and electrochemical reduction of silicate ions at a solid graphite substrate in molten eutectic NaCl–CaCl2 at 1023 K with various concentrations of O2− were conducted as a preliminary study for a liquid Zn cathode. The ionic species of silicates in molten salts containing (i) 1.0 mol% CaSiO3 ( = 1.0), (ii) 0.5 mol% CaO and 1.0 mol% CaSiO3 (
 = 1.5), and (iii) 1.0 mol% CaO and 1.0 mol% CaSiO3 (
 = 2.0) was investigated by Raman spectroscopy. The dominant silicon ion is attributed to SiO3
2− ion in molten salt (i) and SiO4
4− ion in molten salt (iii), which is consistent with the
= 2.0) was investigated by Raman spectroscopy. The dominant silicon ion is attributed to SiO3
2− ion in molten salt (i) and SiO4
4− ion in molten salt (iii), which is consistent with the  in the melt. In molten salt (ii), the primary dominant species was detected as SiO4
4− and secondary dominant species as SiO3
2− due to the poor stability of Si2O7
6−. In molten salt (i), electrodeposition of Si from 1.0 V was confirmed. In molten salt (ii), electrochemical reduction of SiO3
2− was indicated at 0.95 V and SiO4
4− from 0.80 V. Electrochemical reduction of SiO4
4− was indicated from 0.80 V in molten salt (iii). Formation of CaSi2 was confirmed at 0.50 V in all molten salts and no significant differences were observed in the potential range for pure Si deposition in molten salts with
in the melt. In molten salt (ii), the primary dominant species was detected as SiO4
4− and secondary dominant species as SiO3
2− due to the poor stability of Si2O7
6−. In molten salt (i), electrodeposition of Si from 1.0 V was confirmed. In molten salt (ii), electrochemical reduction of SiO3
2− was indicated at 0.95 V and SiO4
4− from 0.80 V. Electrochemical reduction of SiO4
4− was indicated from 0.80 V in molten salt (iii). Formation of CaSi2 was confirmed at 0.50 V in all molten salts and no significant differences were observed in the potential range for pure Si deposition in molten salts with  = 1.0 and 1.5 are almost same.
Acknowledgments
This study was partially supported by Grant-in-Aid for Scientific Research A, Grant Number 16H02410, from the Japan Society for the Promotion of Science (JSPS); and The Joint Usage/Research Center for Zero Emission Energy Research (ZE2020B-58), Institute of Advanced Energy, Kyoto University.