
Abstract
In this work, four selected ionic liquids (ILs), in combination with lithium bis(fluorosulfonyl)imide salt (LiFSI) were explored as electrolytes for anodes made from micron-sized metallurgical grade silicon. The ionic liquids were based on the cations; pyrrolidinium (PYR13), imidazolium (EMI) and phosphonium (P111i4) and the anions; bis(fluorosulfonyl)imide (FSI) and bis(trifluorosulfonyl)imide (TFSI). The cycling stability and rate performance were investigated in pseudo-full cells with silicon anode and commercial LiFePO4, and compared to a carbonate electrolyte. Electrolytes based on PYR13FSI and P111i4FSI exhibit a decent rate performance up to C/5 and showed stable cycling over ∼100 cycles, maintaining a reversible capacity of >1200 mAh gSi-1 at cycle 100 (C/5 rate) and over 2000 mAh gSi-1 at C/20. These electrolytes also had the best oxidation stability (> 5.3 V vs Li/Li). Based on assessment of the limiting current density in symmetrical cells, the Li-ion mobility was determined to be slightly higher for EMIFSI, but differences in Li-ion mobility cannot account for the differences in cycling stability among these electrolytes. While the SEI formed in EMIFSI electrolyte is the most conductive, the highest coulombic efficiency was obtained for PYR13FSI, indicating that the best passivating SEI was formed in this electrolyte.
Export citation and abstract BibTeX RIS

This is an open access article distributed under the terms of the Creative Commons Attribution 4.0 License (CC BY, http://creativecommons.org/licenses/by/4.0/), which permits unrestricted reuse of the work in any medium, provided the original work is properly cited.
From the beginning of its development in the 1970s, through the commercialization of the technology in the 1990s and the maturation during the 2000s, the rechargeable lithium ion battery (LIB) changed the world through enabling ever more advanced portable electronics. 1,2 But over the last decade the technology has moved on from just powering fancy gadgets to enabling large scale grid storage and competitive electric vehicles, thus firmly establishing itself as a crucial technology for the transition from an unsustainable fossil fueled society to a renewable and more sustainable one. Although the global electric vehicle stock has increased by roughly 60% annually the last five years, it still makes up less than 1% of the total cars globally. 3 With the same annual growth, almost all cars could be electric by 2030. For this—and the electrification of other modes of transport—to happen, more energy dense, faster charging, cheaper and safer batteries are just some of the requirements. 4
Fundamentally, to improve upon the battery technology one must look at the chemistry of the electrochemical cell, its negative and positive electrodes ("anode" and "cathode" respectively, from here on), its electrolyte, and their interaction. Today, graphite is the most used anode material, with a theoretical capacity of 372 mAh g−1 (837 mAh cm−3). 5 Lithium transition metal oxides with capacities around 150–200 mAh g−1 are used as cathodes, 6 and as the electrolyte; highly flammable organic carbonate solvents in combination with a hexafluorophosphate lithium salt. For mobile applications (electric vehicles and ships), safety is of great concern, and replacing current electrolytes based on carbonate solvents with more stable ones is of high priority.
Silicon has become the prime candidate to (partially) replace graphite as an anode material and is in fact already added in low quantities (∼4–5 wt%) in commercial graphite-NMC cells. 7–9 What makes silicon attractive is its high specific capacity of 3579 mAh g−1 (2194 mAh cm−3) and fairly low delithiation potential with lithium (∼0.4 V vs Li/Li+), 10 which could allow for an increase in energy density of 15%–20% on the cell level if used instead of graphite. 11 The reason why silicon is not used to a larger extent is the large volume expansion upon lithiation, reaching ∼280% of initial volume at the final composition of Li15Si4, 12 compared to only 13.2% for lithiated graphite, LiC6. 13 The volume changes cause a variety of issues ranging from pulverization and delamination of the active material to excessive solid electrolyte interphase (SEI) layer formation. 14 The excessive SEI is caused by repeated rupture and reformation of the layer, related to the corresponding repeated exposure of fresh surface of the active material to the electrolyte causing low coulombic efficiency and increased cell resistance. Several approaches have been attempted to mitigate these issues, with varying success and commercial feasibility, and can be categorized as: dimension/morphology control, 15–18 composite formation, 19–23 coating and encapsulation, 16,24–26 and electrolyte modification. 18,27–29
While numerous studies have been conducted with a variety of nano-Si as active anode material, or as part of Si/C composite anodes, micrometer sized metallurgical silicon (μMG-Si) is interesting mainly due to its cost advantage over different forms of nanostructured high-purity silicon, and it has been shown to work well in a composite silicon-carbon anode. 19,30 The low surface area of this material, and hence the reduced SEI formation and repair, has been suggested to improve the cyclability. 31
In LIBs specifically, exchanging todays flammable carbonate electrolytes with one based on ionic liquids (ILs) may improve the overall safety of the battery due to ILs inherent nonvolatility, and enable higher voltage cathodes due to higher oxidative stability.
N-propyl-N-methylpyrrolidinium bis(fluorosulfonyl)imide (PYR13FSI) has shown promise in electrolytes for both lithium metal, 32,33 graphite 34,35 and silicon anodes (nanoSi-cPAN 36 and microporous Si from etched wafers 37 ) often claimed to exhibit stable cycling due to formation of a favorable SEI. N-propyl-N-methylpyrrolidinium bis(trifluoromethanesulfonyl)imide (PYR13TFSI) is a similar IL, but the [TFSI]− anion is generally known for better thermal and electrochemical stability than the [FSI]−, 38 although its larger size means the IL is more viscous and thus have a lower conductivity. 39 1-Ethyl-3-methylimidazolium bis(fluorosulfonyl)imide (EMIFSI) has one of the lowest viscosities and highest conductivities of the ionic liquids considered for LIBs, 33 and has shown impressive rate capabilities with a composite anode of 50 wt% nano silicon. 40 But the imidazolium cation is known to have a low cathodic stability, 33,40 which might lead to poor cycle life if a stable SEI is not formed. Trimethyl(isobutyl)phosphonium bis(fluorosulfonyl)imide (P111i4FSI) has been shown to exhibit a wide electrochemical window, decent ionic conductivity and reversible cycling with a graphite anode, 41,42 but more importantly high capacity retention and good rate capability with a silicon anode made from rather coarse Si powder by ball-milling of Si wafers. 43 To the best of the authors knowledge these ILs represent some of the most promising LIB electrolyte candidates from the three main groups of ILs; pyrrolidinium, imidazolium and phosphonium.
The aim of this work was to identify the best performing ionic liquid electrolyte in combination with μMG-Si anodes among two pyrrolidinium ILs (PYR13FSI, PYR13TFSI), one imidazolium IL (EMIFSI) and one phosphonium IL (P111i4FSI). These ionic liquids were selected based on their physicochemical properties ("low" viscosity, thermal stability), and based on promising results from previous studies of different anodes. The anodes were made with μMG-Si as the only active material. Long term cycling, as well as rate performance was investigated for the electrodes in an LFP pseudo-full cell setup, in combination with electrolytes made with 0.74–0.79 m LiFSI mixed with each of the four ionic liquids, as well as one electrolyte with a conventional mix of carbonates as a reference (EC:DMC (1:2 w/w), 5 wt% FEC, 1 wt% VC). The ionic liquid electrolytes (ILEs) were characterized with respect to their total ionic conductivity, including the relative Li+ ion mobilities, as well as their electrochemical stability. Postmortem X-ray photoelectron spectroscopy was performed on the silicon electrodes after 1 cycle to identify the composition of the initial SEI formed. In this way a systematic comparison of effects of IL cations, as well as a comparison of the PYR13 + IL with FSI and TFSI anions, on the electrochemical performance of the silicon anodes was investigated. The assessment of properties like oxidation stability and Li-ion conductivity by the same methods allows for a ranking of these ionic liquids, which is otherwise challenging due to the variation in methods in reported works, and corresponding scatter of results. In particular, differences in cycling stability and rate performance could be understood in terms of the Li-ion conductivity, wetting properties and SEI forming property of each electrolyte.
Experimental
Electrolyte preparation
N-propyl-N-methylpyrrolidinium bis(fluorosulfonyl)imide (PYR13FSI, purity 99.9%), N-propyl-N-methylpyrrolidinium bis(trifluoromethanesulfonyl)imide (PYR13TFSI, purity 99.9%) and 1-Ethyl-3-methylimidazolium bis(fluorosulfonyl)imide (EMIFSI, purity 99.9%) were acquired from Solvionic (France) and used as received (< 20 ppm H2O by Karl Fischer). The viscosity of these Ils were stated as 52.7, 71.2 and 24.5 cP at 25 °C for Pyr13FSI, Pyr13TFSI and EMIFSI, respectively. Trimethyl(isobutyl)phosphonium bis(fluorosulfonyl)imide (P111i4FSI, purity > 98%, < 200 ppm H2O) was acquired from IoLiTec GmbH (Germany) and dried under vacuum at 80 °C for 12 h before use. The viscosity has been determined to be 40 cP. 42 The structural formula of each IL is given in Fig. 1. Battery grade ethylene carbonate (EC) and dimethyl carbonate (DMC) as well as fluoroethylene carbonate (FEC) and vinylene carbonate (VC) were acquired from Sigma Aldrich and used as received. Lithium bis(fluorosulfonyl)imide (LiFSI, purity >99.9%) was acquired from American Elements (USA) and dried under vacuum at 80 °C for 12 h before use. The electrolytes summarized in Table I were mixed in an argon-filled glove box (<0.1 ppm H2O/O2, MBraun, Germany) using a hot plate and stirring where necessary to dissolve the LiFSI. The compositions were chosen such that the LiFSI concentration was 1.2 M.
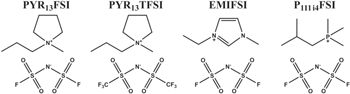
Figure 1. Schematic drawing of the structural formula of the four ionic liquids used in this work.
Download figure:
Standard image High-resolution imageTable I. Composition of electrolytes.
| Electrolyte | Composition |
|---|---|
| ILE1 | 0.77 m LiFSI in PYR13FSI (22:78 mol%) |
| ILE2 | 0.74 m LiFSI in PYR13TFSI (26:74 mol%) |
| ILE3 | 0.74 m LiFSI in EMIFSI (20:80 mol%) |
| ILE7 | 0.79 m LiFSI in P111i4FSI (22:78 mol%) |
| STD2 | 0.74 m LiFSI in EC:DMC:FEC:VC (EC:DMC (1:2 w/w), 5 wt% FEC, 1 wt% VC) |
Electrode preparation and cell assembly
Silicon anodes (73.2 wt% Elkem Silgrain® e-Si 400, 11.0 wt% Timcal C65 carbon black, 7.3 wt% Na-CMC binder from Sigma Aldrich and 8.5 wt% leftover buffer chemicals from citric acid and KOH) with a loading of 0.748 ± 0.042 mgSi cm−2 (corresponding to ≈2.68 mAh cm−2 based on 3579 mAh gSi −110 ) screen printed onto dendritic Cu-foil (16 μm thick) were provided by Institute for Energy Technology (IFE, Norway). The electrodes were cut into 12 mm diameter discs (1.13 cm2) and dried at 100 °C for 12 h before inert transfer and storage in an argon-filled glove box (<0.1 ppm H2O/O2, MBraun, Germany).
LiFePO4 (LFP) cathodes (89 wt% active material, ≈3.5 mAh cm−2) acquired from Custom Cells (Germany) were cut into 14 mm discs (2.01 cm2) and dried at 110 °C for 12 h before inert transfer and storage in the glove box mentioned above. The capacity of the LFP cathodes were purposefully oversized by > 100% with respect to the Si anodes to assemble Si-LFP pseudo-full cells, as introduced by Wetjen et al. 44 to i) have a stable reference potential of 3.45 V vs Li/Li+ to monitor the silicon anode potential in a two-electrode configuration (validity checked in three electrode cells, see Figs. S1/S2 available online at stacks.iop.org/JES/168/110506/mmedia), ii) provide a defined lithium reservoir to be able to exclude capacity loss due to a depleted lithium inventory and iii) minimize side reactions of the electrolyte at the counter electrode (compared to a lithium metal counter electrode). An additional reason was that the combination of Si-Li half cells and ILEs created issues with stray currents, possibly related to formation of dendrites on the counter electrode. Also, LiFSI will react with metallic lithium, with the corresponding risk of cross-talk in half-cells. The pseudo-full cells were assembled in either PAT-cells (EL-Cell, Germany) with 316 l stainless steel plungers or coffee bag (pouch) cells (as shown in Fig. S3) in an argon-filled glove box. An Evopor 5E02A (30 μm, Lydall) separator was used, soaked by 50 μl (PAT) or 30 μl (pouch) electrolyte.
Electrode morphology
The morphology of the as-received silicon electrodes was investigated using scanning electron microscopy (SEM). Cross section of a pristine electrode is shown in Fig. S4. Electrode cross sections were prepared using an Ar-ion beam cross-section polisher (Jeol IB-19520CCP, HV: 6 kV, Ar gas: 3.3, timer: 60 min), before recording SEM images with a Zeiss Ultra 55 lE (Carl Zeiss AG, Germany) with a thermal field emission electron source (3 kV) and an In-lens secondary electron (SE) detector.
The morphology of silicon electrodes cycled for 100 cycles vs a Li metal counter electrode in Hohsen 2016 coin cells were investigated using SEM with energy-dispersive X-ray spectroscopy (EDS). The electrodes were extracted and washed using DMC in an argon-filled glove box (<0.1 ppm H2O/O2, MBraun, Germany) and transported in sealed plastic bags to a Helios (G4 UX) or Dual-Beam (FEI/ThermoFischer Scientific) SEM equipped with both an electron beam and an ion beam (Ga+) column as well as an EDS detector (EDX Oxford Xmax 80 mm2 Solid angle (10 mm WD) 0.03409 srad, 127 eV). The electrodes had some air exposure (< 5 min) while being transferred into the instrument. Cross sections (∼20 μm wide) were made close to the center of the electrode by first depositing a protective Pt coating to the electrode surface before Ga+ ion milling. Two polishing steps were used to obtain a smooth surface. Images were collected with the electron beam and an SE detector (WD: 4.0 mm, acceleration voltage: 1–3 kV, emission current: 0.50 pA [TLD-SE]/0.1 nA [ICE-SE]). Elemental composition analysis was performed using the EDS detector (WD: 10 mm, acceleration voltage: 5 kV, emission current: 0.8 nA).
Electrochemical stability of the electrolytes
The electrochemical stability of the electrolytes was tested by performing cyclic voltammetry scans on three-electrode PAT-cells using a Li ring as a pseudo-reference. The reductive stability was tested vs Cu-foil (∅ 18 mm) in the range0.01–2.5 V (vs Li/Li+) and the oxidative stability vs Au (∅ 18 mm) in the range 5.5–3.5 V (vs Li/Li+) at 1 mV s−1, with a Li counter electrode (∅ 14 mm) in both cases. Three cycles were performed to look for passivating/non-passivating behavior.
Ionic transport properties
The ionic conductivity of the electrolytes was measured by alternating current (AC) impedance spectroscopy using an Autolab PGSTAT204 (Metrohm, Germany) with a FRA32M Frequency Response Analyser module for the frequency range 500 kHz to 100 Hz (10 mV DC). An airtight TSC70 cell (RHD Instruments, Germany) with platinum working and counter electrodes was used to carry out the measurements. The cell was filled with 70 μl of electrolyte in an argon-filled glove box (<0.1 ppm H2O/O2, MBraun, Germany) and closed before being mounted onto a Microcell HC temperature-controlled cell stand (RHD Instruments/Autolab, Germany, accuracy ±0.1 °C). The cell constant was determined by measurements on a standard solution of 0.1 M KCl at 20, 30 and 40 °C. The cell constant was determined before and after the measurements on the studied electrolytes, and the cell constant used to calculate the ionic conductivity for each electrolyte was determined from linear interpolation between these two values. The resistance (Ω) of the electrolytes was determined from fitted Nyquist plots using a simple RC-circuit.
The limiting current density was determined by programmed-current chronopotentiometry using a VMP300 and BSC805 battery testing system (BioLogic Sciences Instruments, France). Symmetrical Li-Li (∅ 14 mm) coffee bag (pouch) cells with nickel current collectors were mounted with a GF/A glass fiber separator (260 μm, Whatman) or El-Cell glass fiber separator (1.55 mm), soaked by 80 μl or 400 μl electrolyte respectively, in an argon-filled glove box. The cells were subjected to a current ramp of 15 μA s−1 from 0 A to 0.1 A with a cut off limit of 10 V at 20 °C. The diffusion-limited current density was taken as the current value where the voltage increases drastically as shown in Fig. S5.
Cycling performance
Long duration experiments (LD) were performed to test the cycling stability of the Si-LFP pseudo full cells in the different electrolytes at 20 °C. The cells were cycled galvanostatically in the potential window 3.40–2.40 V with a constant voltage step applied at the cut-off voltage of both charge and discharge until the current was halved (CCCV). The first cycle and subsequently every tenth/twentieth cycle were performed at a rate of C/20 (capacity based on 3579 mAh gSi −1) and the other cycles at C/5, for 101 cycles. The cycling window was set to be between cell voltages of 3.40 to 2.40 V vs Li/Li+ (∼0.05–1.05 V vs Li/Li+ on the silicon electrode), to try to limit the formation of the metastable crystalline highly lithiated (c−Li3.75 Si) and overlithiated (c−Li3.75+δ Si) silicide phases encountered below ∼50–70 mV, as shown by Ogata et al. 45,46 Several cells were cycled for each electrolyte, and average values with ± 1 standard deviation are given.
Electrochemical impedance spectroscopy (EIS) measurements were performed on Si-LFP cells before and after one C/20 cycle to both assess the electrode wetting and resistance from the initial SEI formation. A VMP300 potentiostat (BioLogic Sciences Instruments, France) was used to perform Galvano-EIS with a current perturbation amplitude of 150 μA, to not alter the state of the cell. The frequency range of the GEIS before cycling was limited to 1 MHz–10 kHz for the same reason, whilst after cycling a broader range of 1 MHz–0.1 Hz was used. The capacitance was estimated by plotting -Im(Z) vs 1/frequency for the close to linear part of -Im(Z) in the high frequency region in the Nyquist plots and then taking 1/slope of the linear fit to be the capacitance (see section S.5 in the Supplementary Information).
Rate test experiments (RT) were performed to test the capacity retention of the Si-LFP pseudo-full cells at higher currents at 20 °C. Cells were cycled galvanostatically (CC) between 3.40 and 2.40 V for four consecutive cycles at C/20, C/5, C/2, 1C, 2C and C/20, with the maximum charge current kept at C/2.
X-ray photoelectron spectroscopy measurements
X-ray photoelectron spectroscopy (XPS) measurements were performed on a pristine silicon electrode and on silicon anodes cycled for one full lithiation and delithiation in Si-LFP cells with the ionic liquid electrolytes. The cells were cycled galvanostatically at a rate of C/20 with a cutoff when the silicon anode reached 50 mV on lithiation (charge) and 1.05 V on delithiation (discharge). The cycled electrodes were harvested and washed for two minutes in dimethyl carbonate (battery grade, Sigma Aldrich) in the abovementioned glove box and subsequently dried under dynamic vacuum for 1 h in the antechamber connected to the glove box. The electrodes were then mounted on a Cu stub with Cu tape and transferred to the load lock of the XPS instrument using a transfer arm (Kratos, UK). XPS spectra were acquired with a monochromatic Al Kα
source (hν = 1486.6 eV, 10 mA beam current, 10 kV acceleration voltage) on an Axis Ultra DLD (Kratos Analytical, UK) with an operating pressure of ≈1 10−9 Torr. A survey scan was performed (5 sweeps, pass energy: 160 eV, resolution 0.5 eV, range: 1200–0 eV, aperture: 300 × 700 μm slot) followed by regional scans (10–20 sweeps, pass energy: 20 eV, resolution 0.1 eV, aperture: 300 × 700 μm slot) of F 1 s, O 1 s, N 1 s, C 1 s, S 2 s, Cl 2p, S 2p, P 2p, Si 2p and Li 1 s. These measurements were focused at the center of the electrode samples and with no applied potential. The XPS data were analyzed using the CasaXPS software (version 2.3.22) using a Gaussian/Lorentzian line shape (30%/70%) on top of a Shirley background. Binding energies were calibrated based on the adventitious carbon C 1 s signal set to 285.0 eV.
Results and Discussion
Electrochemical stability
Cyclic voltammetry was used to investigate the anodic and cathodic stability of the electrolytes. It should be mentioned that the potential found for the oxidative stability vs Au or reductive stability vs Cu will not accurately predict the stability against other electrode materials, but allows for a relative assessment of the electrochemical stability. Figure 2 shows the first half cycle current response of all electrolytes overlaid. All three CV cycles for each individual electrolyte can be seen in Fig. S6. The limiting potential of oxidation, Eox, is in all cases taken to be the onset potential of the excessive increase of the oxidation current. The Eox found in this work is summarized in Table II and literature values for the anodic and cathodic stability of a set of relevant electrolytes are summarized in Table SI. All voltages are expressed vs Li/Li+ unless otherwise stated.
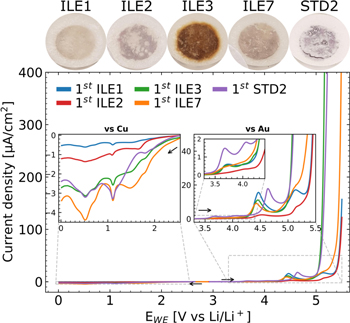
Figure 2. First cycle CV scans (1 mV s−1) for the anodic (vs Au) and cathodic (vs Cu) stability of electrolytes ILE1 (LiFSI:PYR13FSI), ILE2 (LiFSI:PYR13TFSI), ILE3 (LiFSI:EMIFSI), ILE7 (LiFSI:P111i4FSI) and STD2 (LiFSI:EC:DMC:FEC:VC) at 20 °C. Full scans (3 cycles) are shown in Fig. S3. Above the graph are photographs of the glass fiber separators recovered from the cells that were exposed to anodic CV scans (vs Au).
Download figure:
Standard image High-resolution imageTable II. Properties of the electrolytes and the μMG-Si∣∣LFP pseudo-full cells studied in the long cycling experiments. The ± values indicate one standard deviation based on at least two independent measurements, except for the ionic conductivity which is the propagated error of the bulk resistance determined from Nyquist plots.
| Electrolytes | ||||||
|---|---|---|---|---|---|---|
| Electrochemical properties | Units | ILE1 | ILE2a | ILE3 | ILE7 | STD2 |
| Lim. potential of oxidation, Eox | [V vs Li/Li+] | 5.4 | 5.4 | 5.1 b) | 5.3–5.4 | 5.1 |
| Ionic conductivity, σ | [mS/cm] | 4.72 ± 0.10 | 1.26 ± 0.03 | 10.48 ± 0.22 | 3.83 ± 0.08 | 12.24 ± 0.25 |
 c)
c)
| [mA/cm2] | 8.7 ± 0.9 | 2.1 ± 0.2 | 10.1 ± 0.1 | 6.9 ± 0.1 | 28 d) |
| Long cycling data | ||||||
| 1st cycle delithiation capacity | [mAh/gSi] | 2553 ± 252 | 217 ± 80 | 2944 ± 264 | 2349 ± 56 | 3072 ± 328 |
| 1st cycle Qloss | [mAh/gSi] | 359 ± 28 | 157 ± 35 | 415 ± 32 | 348 ± 27 | 511 ± 132 |
| 1st cycle CE | [%] | 87.6 ± 0.5 | 57.1 ± 8.8 | 88.1 ± 1.1 | 87.1 ± 0.8 | 84.8 ± 0.8 |
| 2nd cycle CE | [%] | 90.7 ± 1.7 | 97.4 ± 7.3 | 91.6 ± 1.2 | 89.5 ± 1.6 | 91.1 ± 3.8 |
| Average CE cycle 3–100 e) | [%] | 99.1 ± 0.5 | 95.6 ± 3.3 | 98.5 ± 0.8 | 99.2 ± 0.6 | 98.5 ± 0.5 |
Total capacity loss, 
| [mAh/gSi] | 2505 ± ... a) | 767 ± 262 | 3277 ± 74 | 1885 ± 463 | 3355 ± 416 |
| Capacity retention at cycle 100 (C/5 rate) | [mAh/gSi] | 1342 ± ... a)(53%) | 125 ± 14 (58%) | 896 ± 162 (30%) | 1245 ± 85 (53%) | 746 ± 81 (24%) |
| Capacity retention at cycle 101 (C/20 rate) | [mAh/gSi] | 2063 ± ... a)(81%) | 398 ± 129 (184%) | 1132 ± 61 (38%) | 2086 ± 77 (89%) | 817 ± 31 (27%) |
a)Not all cells reached the full 101 cycles and thus a standard deviation at cycle 100 could not be calculated. The values are regarded as representative according to the trend of the data. b)Nonpassivating with major decomposition happening from  in subsequent cycles. See Fig. S3. c)See Supplementary Information section S4 for details. d)Only one cell reached ilim. before shortcircuiting, see Fig. S4. An alternative carbonate electrolyte LP40: 15.3 mA cm−2. e)Average CE values for cycles 3–100 were filtered by removing data points deviating more than 1 SD. The final average CE value given for 3–100 is calculated from the remaining data points after filtering. This was done to remove the extreme CE values at and around the slow cycles performed every 10/20 cycles, as can be seen in full in Fig. S9.
Anodic stability on Au
All electrolytes exhibited several anodic peaks before the onset of excessive oxidation. The first peak onset is found at 3.5–3.6 V for all but ILE2, with the carbonate electrolyte STD2 exhibiting the largest currents. The apparent lack of this peak in the TFSI-dominated ILE2 leads us to believe this is related to oxidation of FSI− or impurities present in the FSI− ionic liquids. All ILEs share a significant peak at 4.5 V, whilst a similar peak is seen at 4.7 V for STD2.
ILE3 displays a large anodic prewave at 4.9 V before severe oxidation happens at 5.1 V. These findings are in good agreement with those of Kerner et al. 47 who investigated the stability of an electrolyte of identical composition to ILE3 (LiFSI in EMIFSI (20:80 mol%)) on stainless steel. They found an onset of oxidation close to 4 V, with peaks around 4.5, 4.8–4.9 and anodic limit around 5.2–5.3 V. Only linear voltammetry was performed, and the smaller peaks before the anodic limit were not commented.
ILE1, ILE2 and ILE7 display prewaves at ≈5.2 V before the final oxidation starts at 5.3–5.4 V. The anodic limit of PYR13FSI and PYR13TFSI have previously been found to be around 5.8–6.0 V on Pt and Ni working electrodes. 48–51 Yoon et al. 51 reported an anodic limit of 6.0 V for an electrolyte similar to ILE1 (0.8 m LiFSI in PYR13FSI) and observed that higher concentrations of LiFSI did not change the limit significantly. These reports are all significantly higher than our findings, but are likely explained by the different cell setups, reference electrodes, cycling parameters and possibly different levels of impurities in the electrolytes. The most similar anodic stability to our findings is reported by Paillard et al. 52 for a LiFSI:PYR14FSI (20:80 mol%) electrolyte on a Pt working electrode, with an anodic peak at 4.8 V and an anodic limit at 5.35 V.
Anodic limits of 5.6–5.7 V are reported for neat P111i4FSI on glassy carbon 41 and Pt, 42 and Salem et al. 42 found that the addition of 0.5 M LiPF6 salt reduced the limit to 5.4 V, approximately the same as our finding with ILE7 (0.79 m LiFSI in P111i4FSI).
The standard carbonate electrolyte (STD2) has an onset of the final oxidative current at 5.1 V, similar to ILE3.
The most severe oxidation is seen in ILE3, reaching current densities of almost 3 mA cm−2, followed by STD2 and ILE7 at ≈700 μA cm−2, ILE1 at 170 μA cm−2, and ILE2 at 11 μA cm−2, before reaching the cut-off potential of 5.5 V. ILE3 has the poorest passivating behavior as the anodic currents remained high and shifted to lower potentials upon further cycling (Fig. S6). STD2 has the best passivating behavior, with the largest decrease in anodic current density and a shift to higher onset potentials. Upon inspection of the cells after the CV scans, the separators were observed to have a discoloration following approximately the same trend of anodic stability, with a dark brown discoloration of ILE3 ranging down to only a slight yellow hue in ILE2 and no apparent discoloration of STD2, as seen in Fig. 2. It is also worth noting that all the ILEs showed large cathodic peaks around 4.4–3.5 V on the reverse scan, in the falling order of ILE1, ILE7, ILE3 and ILE2. These currents are maintained and slightly increased upon further cycling, with a significant shift to lower potentials for ILE3. STD2 shows no cathodic peak in the first cycle and only a miniscule one in the second and third cycle. This cathodic peak(s) might indicate reversibility of the species formed around 4.5 V on the anodic scan of the ILEs. This has to the best of our knowledge not been reported before. Reactions with or catalyzed by the gold working electrode is a possible explanation.
Cathodic stability on Cu
Several peaks can also be seen on the cathodic scan towards lower potentials vs Li/Li+ on Cu. The onset of reduction starts for all electrolytes around ∼2.5 V. The current gradually increases, with waves appearing around 2.1–1.8 V for all electrolytes except ILE2. Reactions around 2 V have been ascribed to the irreversible reduction of O2 traces by Aurbach et al., 53 forming LiOx, while reduction of salt anions is reported to happen from about 1.8 V. Jafta et al. 54 showed that the reduction of the FSI− anion in a 0.5 M LiFSI in EMIFSI on an ordered mesoporous carbon electrode could be achieved at 1.9 V through a constant voltage step, with a more rapid reaction happening at 1.8 V. Girard et al. 41 reported reduction of the FSI− anion in neat P111i4FSI from 2.2 V with a peak at 1.7 V on glassy carbon, while Salem et al. 42 did not observe this peak in the neat ionic liquid, but its appearance in a 0.5 M LiPF6 in P111i4FSI electrolyte was ascribed to impurities such as "...residual water, that might have been introduced by the lithium salt.."
The gradually increasing current levels off around 1.7 V for ILE2 and 1.5 V for the other ILEs, indicating self-limiting reactions that partly passivates the surface in these electrolytes. Aurbach et al.
53
suggests the irreversible reduction of H2O residue at ∼1.5 V, while Jafta et al.
54
ascribes a sharp peak at 1.52 V to FSI− reduction, forming mainly LiF, but also lithium oxides, nitrides, sulfoxides and sulfides. Both of these mechanisms are plausible for ILE1, 3 and 7, as the amount of charge passed is low, and would correspond to ppm levels of water. An increase in cathodic current is seen from ∼1.3 V for ILE2. Howlett et al.
48
ascribes a cathodic peak at ∼1.3 V for neat PYR13TFSI on Cu (∼1.4 V on Pt) to cleavage of the S–N bond in the TFSI− anion, forming soluble products like • and
and  in a self-limiting reaction. The amount and rate of reduction of TFSI has been shown to be strongly influenced by the electrode substrate and the presence and concentration of H2O.
55
in a self-limiting reaction. The amount and rate of reduction of TFSI has been shown to be strongly influenced by the electrode substrate and the presence and concentration of H2O.
55
A steep increase in current is observed for STD2 from ∼1.5 V, ascribed to reduction of the alkyl carbonate solvent. 53
A very distinct peak is present in all electrolytes at ∼1.1 V, although the peak is smaller for ILE2. Peaks approximately at this voltage are in the literature ascribed to the reduction of water or "impurities," 52,54 reduction of the salt 40 or not commented at all. 56 Based on the previously reported results, combined withthe smaller cathodic peak for ILE2, containing the least amount of FSI−, it is considered likely that this process is a further reduction of the FSI− anion or its derivatives, possibly catalyzed by OH− from reduced trace water. This reaction is also self-limiting and stabilizes the reductive current until ∼0.9 V for all electrolytes but ILE2. It is possible that a more passivating layer has formed on the Cu surface in the FSI--rich electrolytes at this point. ILE2 displays an almost linear increase in current until 0.5 V, with a small wave at ∼0.75 V. A subsequent lowering of the cathodic current follows with another wave at ∼0.3 V before a small increase is seen from ∼0.15 V until the cutoff is reached at 0 V.
For the other electrolytes, starting from 0.9 V, a similar development can be seen in the current, but with more distinct "shoulders" at the same positions as the waves for ILE2, forming a characteristic "triple peak." The shoulder around 0.75 V is more prominent for STD2, most likely due to reduction of ethylene carbonate. Overall, the FSI-based ILEs have similar cathodic responses, indicating that it is dominated by FSI reduction.
For the subsequent cycles (Fig. S6), a low and stable cathodic current related to the double layer charging is seen for alle electrolytes until ∼0.9 V, except for ILE2 which has a more sloping profile. This indicates that a passivating film form on the Cu in the FSI−-rich electrolytes during the first cycle. The characteristic "triple peak" formation from around 0.7 V is still maintained, although in a skewed manner. Taken in conjunction with the anodic peak formations around 1 V and 2 V on the reverse scan, underpotential deposition and subsequent stripping of lithium is likely part of the reason for these peaks. 51,53,57
According to Lane, 58 pyrrolidinium and phosphonium cations should at most be stable down to ∼0.2 V vs Li/Li+, while 1,3-dialkylimidazolium is reduced at ∼1.1–1.2 V. There are several reports on the cathodic stabilities of pyrrolidinium based electrolytes placing the limit around 0.1–0.3 V. 48–52 Reports on concentrated phosphonium based electrolytes even suggest stabilities to potentials lower than −1 V vs Li/Li+. 41 The stability limit is often defined in terms of the voltage at a certain current density, e.g. 1 mA cm−2. In these cases the stability is probably increased by the passivation layer formed on the electrode, and must be thought of as a "kinetic stability limit," whereas the true thermodynamic limit is more correctly defined by the lowest occupied molecular orbital (LUMO) of the electrolyte, 59 which in the electrolytes studied here will be the FSI− anion, which as previously discussed, starts decomposing at ∼1.8 V. Factors like temperature, type and concentration of impurities, co-solvents, electrode material, functional groups, chain length and the anion species affect the perceived limit in a system due to both kinetic and thermodynamic effects. 58 Reduction peaks attributed to the cation reduction cannot be observed in the voltammograms in this work, and are most likely hidden by FSI− and the impurity reduction peaks.
Ionic transport
The total ionic conductivities of all electrolytes at 20 °C are shown in Table II. The highest conductivity is recorded for STD2, followed closely by ILE3 and then ILE1, ILE7 and ILE2. Notably, all electrolytes had ionic conductivities above 1 mS cm−1 with ILE3 outperforming the other ILEs as the only one above 10 mS cm−1.
The same order of the ILEs was found for the limiting current densities between the electrolytes, also included in Table II (full E-I curves shown in Fig. S5), but the magnitude of the differences between the electrolytes are very different. STD2 has a significantly higher limiting current density than the ILEs, at >28 mA cm−2, although this value is uncertain due to a tendency of cells to short-circuit before reaching the limit. For a better comparison, the common carbonate LP40 electrolyte was also tested, and found to have a limiting current density of 15.3 mA cm−2. Out of the ILEs, ILE3 performs the best, but ILE1 and ILE7 are relatively close. The limiting current density will, assuming it is not limited by effects like lithium plating/dissolution, correspond to the maximum accessible lithium ion flux under the applied conditions, and can thus be taken as a relative measure of lithium ion mobility in the different electrolytes. 60 Provided that the thickness of the Nernst diffusion layers are the same, this is a reasonable approximation. One interesting observation (not shown) is that measured values of the limiting current densities are almost identical for separators of different thickness (i.e. 260 μm and 1.15 mm).
Cycling stability
The cycling stability (Fig. 3) of the μMG-Si anode was tested in pseudo-full cells with a capacitively oversized LFP counter electrode and the electrolytes given in Table I. Galvanostatic cycling with constant voltage steps at the cut-off voltages (CCCV) was performed at 20 °C for around 100 cycles at a rate of C/5, with the first cycle and every tenth or twentieth cycle at C/20, referred to as long duration (LD) cycling.
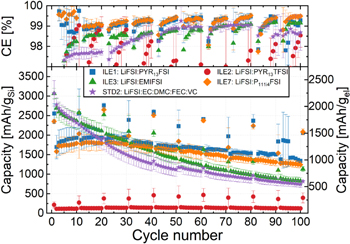
Figure 3. Long duration cycling of pseudo-full cells of μMG-Si (≈2.68 mAh cm−2, ∅ 12 mm) vs LFP (≈3.5 mAh cm−2, ∅ 14 mm) with electrolytes ILE1 ( ), ILE2 (
 ), ILE3 (
 ), ILE7 (
 ) and STD2 (
 ). Average discharge capacities of at least three cells shown with error bars representing one standard deviation. Full range of CE can be seen in Fig. S8.
Download figure:
Standard image High-resolution imageThe average gravimetric discharge capacities for the silicon electrodes presented in Fig. 3 are normalized to the weight of the active material (gSi) and the entire electrode mass except for current collector (gel). The coulombic efficiency (CE [%]) of the LDcycling of these cells is also given. Key metrics are summarized in. The standard carbonate electrolyte (STD2) has the highest delithiation capacity (3072 ± 328 mAh gSi −1) in the first cycle, but also the highest initial irreversible capacity loss (511 ± 132 mAh gSi −1). The low viscosity imidazolium IL (ILE3) has the second highest delithiation capacity (2944 ± 264 mAh gSi −1) followed by ILE1 (2553 ± 252 mAh gSi −1), ILE7 (2349 ± 56 mAh gSi −1) and ILE2 (217 ± 80 mAh gSi −1).
In the second cycle, the capacity drops due to a higher rate (C/5), and the drop is largest for the ionic liquids, in line with the limited Li-ion conductivity in these systems as compared to the carbonate electrolyte (see Table II). First cycle CE is in the range ∼85%–88% for electrolytes ILE1, ILE3, ILE7 and STD2, without a statistically significant difference between the ILEs. ILE2 has a significantly lower CE of around 57%, with a large data spread as indicated by the standard deviation (se). The low CE found in cells with ILE2 is most likely explained by the very low degree of lithiation, caused by high overpotentials, implying that a higher fraction of the overall capacity is due to side reactions from the SEI formation.
From estimated capacitances of cells before and after the first cycle (see Fig. S7), cells with ILE1, ILE7 and especially ILE2 have low capacitances (≈ poor wetting) compared to STD2 and ILE3. This can partly explain the difference seen in initial capacity. The initial capacitance appear to be inversely correlated to the viscosity of the ionic liquids, as given in the Experimental section. The increase in capacitance after one cycle is most likely reflecting the expansion of the silicon and corresponding increase in interfacial area, but could also indicate improved wetting. The capacitance in the cell with STD2 is lower after the first cycle, which can be explained by a good initial wetting and loss of active surface area due to particle isolation or SEI insulation upon cycling.
In the cycles following the first there are major differences in how the capacity develops between cells with STD2 or ILE3, and the other ILEs. STD2 and ILE3 have gradual decreases in capacity, whilst ILE1 and ILE7 (and ILE2) show a gradual increase in capacity for the first 20–30 (ILE2: 40) cycles. A higher overpotential associated with the lithiation of silicon in these electrolytes combined with poor wetting, causes a much lower initial utilization of the theoretical electrode capacity. This is also evident from the potential profiles and differential capacity plot of each electrolyte over multiple cycles, provided in Fig. S8, and the corresponding comparison of electrolytes at given cycles in Fig. S9. Upon lithiation, Si–Si bonds will gradually break down causing smaller and smaller negatively charged clusters to be formed and eventually fully separated Si atoms surrounded by Li+. 61 In the cells with ILE1 and ILE7 (and ILE2), smaller fractions of the Si particles are lithiated in the initial cycle compared ILE3 and STD2, leaving more c-Si left in the core of the particles. In the subsequent cycles at a higher rate (C/5), the first Si to be lithiated is the already amorphous silicon clusters, as the energy barrier for continuing to break up (lithiate) the amorphous Si clusters is lower compared to breaking up more of the c-Si matrix, 61 and the diffusion of Li+ in c-Si is lower than in a-Si. 62 Only a fraction of the remaining c-Si is lithiated in each C/5 cycle, and most likely only at the constant voltage step (∼0.05 V), as there is no signal from the c−Si→c−Li3.75(+δ) Si reaction (∼0.1 V) in the potential/differential capacity plot for these electrolytes (see Figs. S7/S8/S10). The available silicon from the c-Si matrix can then more easily participate in the next lithiation, and this can be seen in the potential/differential capacity plots as a growing plateau/peak at ∼0.2 V. This process will eventually be outweighed by the degradation mechanisms, leading to a subsequent loss of reversible capacity as seen after 20–30 cycles (see Fig. 3). For ILE3 and STD2 on the other hand, with lower overpotentials, more of the available silicon is lithiated to amorphous silicides in the early cycles, causing the degradation mechanisms to dominate from earlier on, as can be seen from the immediate loss in reversible capacity (see Fig. 3).
Overall, the cycling stability is superior in the ILE1 and ILE7 electrolytes. Cells with STD2 start underperforming ILE3 after about 10 cycles and ILE1/ILE7 after about 20 cycles. From about cycle 35, ILE3 underperforms ILE1 and ILE7 (see Fig. 3). These trends then hold true until the end of cycling. At cycle 100 (C/5 rate), ILE1 and ILE7 retains more than 1200 mAh gSi −1 while ILE3 and STD2 retain less than 900 mAh gSi −1. Even more interesting is the fact that in the following slow cycle (C/20 rate), ILE1 and ILE7 achieve reversible capacities of more than 2000 mAh gSi −1, corresponding to ∼81% and ∼89% of the initial cycle capacity. Meanwhile, ILE3 achieves around 1100 mAh gSi −1 (38%) and STD2 has a very marginal gain compared to the faster rate with around 800 mAh gSi −1 (27%). The cross section of μMG-Si electrodes cycled for 100 cycles in half cells, as shown in Fig. 4, complies with the results obtained from the electrochemical characterizations. Larger and more intact silicon particles are observed in cells with ILE1 and ILE7 compared to ILE3 and especially the cell with the STD electrolyte (STD is equal to STD2 except for having 1:1:3 w/w EC:PC:DMC instead of 1:2 w/w EC:DMC).
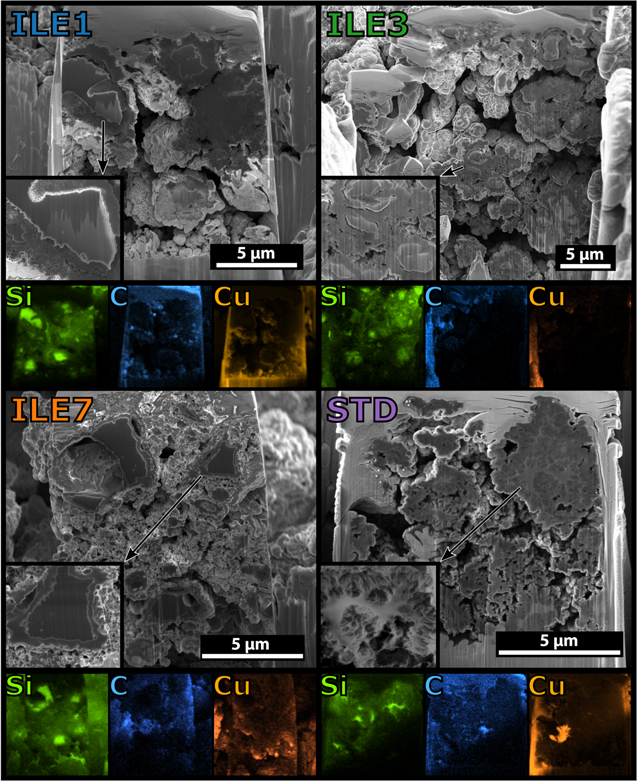
Figure 4. Scanning electron microscopy micrographs of μMG-Si electrodes cycled for 100 cycles vs a Li metal counter electrode in Hohsen 2016 coin cells with electrolytes ILE1 (LiFSI:PYR13FSI), ILE3 (LiFSI:EMIFSI), ILE7 (LiFSI:P111i4FSI) and STD (LiFSI:EC:PC:DMC:FEC:VC) at 20 °C. Insets show silicon particles/structures. EDS maps are included below each micrograph and show the signals from silicon, carbon and copper. Copper is from backsputtering or dissolution from the dendritic Cu foil and the Cu EDS is included. Cycling program: First four cycles capacity limited to 500–1000–1500–2000 mAh gSi −1 at C/20, then C/5 until the end of cycling at cycle 100.
Download figure:
Standard image High-resolution imageFigure 5 shows the cumulative capacity loss (CCL)  up to cycle n, calculated from Eq. 1,

where  and
and  are the specific capacities from the lithiation and delithiation step of cycle i, respectively. As expected, the cumulative capacity loss reflects the cycling stability, with the highest losses observed for the STD2 and ILE3 electrolytes. This is often called the "accumulated irreversible capacity" (AIC), and is, as shown by Holtstiege et al.,
63
not equivalent to the loss of active lithium, which is always less than the AIC/CCL. It should be noted that both kinetically and irreversibly trapped lithium is included in the CCL.
64,65
are the specific capacities from the lithiation and delithiation step of cycle i, respectively. As expected, the cumulative capacity loss reflects the cycling stability, with the highest losses observed for the STD2 and ILE3 electrolytes. This is often called the "accumulated irreversible capacity" (AIC), and is, as shown by Holtstiege et al.,
63
not equivalent to the loss of active lithium, which is always less than the AIC/CCL. It should be noted that both kinetically and irreversibly trapped lithium is included in the CCL.
64,65
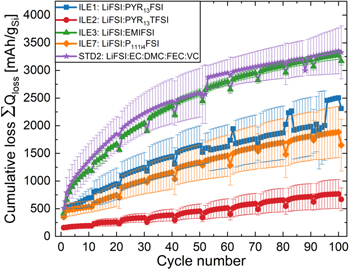
Figure 5. Cumulative capacity loss (CCL) for the long duration cycling of pseudo-full cells of μMG-Si (≈2.68 mAh cm−2, ∅ 12 mm) vs LFP (≈3.5 mAh cm−2, ∅ 14 mm) with electrolytes ILE1 ( ), ILE2 (
 ), ILE3 (
 ), ILE7 (
 ) and STD2 Average AIC of at least three cells shown with error bars representing one standard deviation.
Download figure:
Standard image High-resolution imageThe shape of the CCL curve resembles a square root function, especially for the electrolytes STD2 and ILE3, while ILE1, ILE7 and ILE2 are of a more linear nature. The slope is initially higher for STD2 and ILE3, corresponding well with the higher capacities in the first 20–30 cycles for cells with these electrolytes. After this, the slopes for these electrolytes decay, and resembles those of ILE1 and ILE7. The CCLs after 100 cycles are approximately 92%–94% of the theoretical maximum gravimetric capacity of silicon (3579 mAh gSi −1) for electrolytes STD2 and ILE3. According to Holtstiege et al. 63 active lithium loss likely amounts to around 70%–90% of the CCL, while the rest comes from parasitic reactions that does not consume lithium, like water splitting, electropolymerization etc. Such losses would of course be too high for practical use in a commercial cell where the total lithium content of the electrodes would be balanced. Here, the results confirm that the cyclable Li content of the cell is not a limiting factor in these experiments since the initial capacity of the LFP electrode is ∼2× that of the silicon electrode.
Figure 6 shows the fraction of capacity (in %) coming from the constant voltage step during a) lithiation and b) delithiation of the silicon electrode in cells with the different electrolytes. The capacity fraction,  was calculated according to Eq. 2,

where  and
and  are the capacity contributions from the constant current (CC) step and the constant voltage step, respectively. The capacity fraction from the constant voltage step will typically increase with increasing polarization of the electrode upon lithiation/delithiation, and thus provides a measure of the overpotentials.
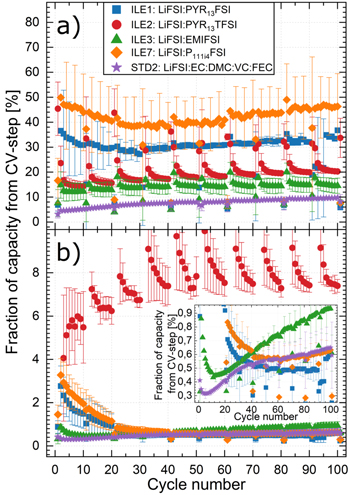
Figure 6. Capacity fraction (in %) from the potentiostatic (CV) a) lithiation (charge) and b) delithiation (discharge) step during long duration cycling of pseudo-full cells of μMG-Si (≈2.68 mAh cm−2, ∅ 12 mm) vs LFP (≈3.5 mAh cm−2, ∅ 14 mm) with electrolytes ILE1 ( ), ILE2 (
 ), ILE3 (
 ), ILE7 (
 ) and STD2 (
 ). Average values of at least three cells shown with error bars representing one standard deviation.
Download figure:
Standard image High-resolution imageFigure 6a shows the major differences between the electrolytes with respect to the share of the capacity associated with the constant voltage step during lithiation. In the first cycle, with a CC of C/20,  varies from ∼3% for STD2, ∼7%–8% for ILE1 and ILE3, ∼17% for ILE7 and ∼45% for ILE2. The high value for ILE2 is likely because of the poor ionic conductivity of this electrolyte. The cells with ILE2 have a consistently higher
  in the slow cycles (C/20 every 10th/20th cycle in Fig. 6a), compared to the "baseline" at C/5. The cells with the other electrolytes show a decreased
  for the slow cycles.
In Fig. 3, for ILE2, but also to some extent for the other ILEs, a significant drop in the CE after each slow cycle is seen. Similarly, in Fig. 6a, the  is declining after each slow step upon lithiation for ILE2 and ILE3, and also upon delithiation for ILE 2 (Fig. 6b). This will be referred to as a "waterfall" effect and is most likely related to the release of kinetically trapped lithium in the silicon during the slow cycle. The release of kinetically trapped lithium is evidenced by the >100% CE at each slow cycle (see Fig. S11). An illustration of this phenomenon is provided in Fig. S12, showing the capacity loss as a function of discharge capacity of each cycle. The slow cycles (C/20) can be seen to have negative values of capacity loss, meaning that more charge is released from the silicon during delithiation than is taken in during lithiation during these cycles, which is most likely due to the release of kinetically trapped lithium. Lindgren et al.
64
investigated lithium trapping in silicon anodes during galvanostatic cycling at C/20 and found that inefficiencies in the delithiation step led to a continuous increase of the lithium concentration of the silicon particles. This increasing amount of "trapped lithium" leads to a shift of the lithiation reaction to a lower potential, meaning that the cut-off potential is reached faster, and the capacity consequently decreases. This was deemed the main reason for the observed capacity loss of the cell. It was shown that adding a constant voltage step at the delithiation cut-off voltage could release some of the trapped lithium, thus regaining some of the lost capacity and prolonging the life of the cell. The waterfall effect experienced in this work in conjunction with the slow cycles (C/20) can thus be explained by a sudden release of kinetically trapped lithium that had been continuously built up due to inefficient lithiation during the fast cycles (C/5). Due to the release of trapped lithium, a higher degree of lithiation can take place for the next few cycles, until the silicon is "saturated" by lithium again.
is declining after each slow step upon lithiation for ILE2 and ILE3, and also upon delithiation for ILE 2 (Fig. 6b). This will be referred to as a "waterfall" effect and is most likely related to the release of kinetically trapped lithium in the silicon during the slow cycle. The release of kinetically trapped lithium is evidenced by the >100% CE at each slow cycle (see Fig. S11). An illustration of this phenomenon is provided in Fig. S12, showing the capacity loss as a function of discharge capacity of each cycle. The slow cycles (C/20) can be seen to have negative values of capacity loss, meaning that more charge is released from the silicon during delithiation than is taken in during lithiation during these cycles, which is most likely due to the release of kinetically trapped lithium. Lindgren et al.
64
investigated lithium trapping in silicon anodes during galvanostatic cycling at C/20 and found that inefficiencies in the delithiation step led to a continuous increase of the lithium concentration of the silicon particles. This increasing amount of "trapped lithium" leads to a shift of the lithiation reaction to a lower potential, meaning that the cut-off potential is reached faster, and the capacity consequently decreases. This was deemed the main reason for the observed capacity loss of the cell. It was shown that adding a constant voltage step at the delithiation cut-off voltage could release some of the trapped lithium, thus regaining some of the lost capacity and prolonging the life of the cell. The waterfall effect experienced in this work in conjunction with the slow cycles (C/20) can thus be explained by a sudden release of kinetically trapped lithium that had been continuously built up due to inefficient lithiation during the fast cycles (C/5). Due to the release of trapped lithium, a higher degree of lithiation can take place for the next few cycles, until the silicon is "saturated" by lithium again.
The lithium diffusion rate in silicon is expected to vary with lithium concentration, and this will affect the cycling performance. It has been suggested based on atomistic modelling that in amorphous silicide  the lithium diffusion coefficient (
 ) increases with an increasing degree of lithiation, x, because of increased long-distance diffusion, up to a certain concentration, at which too many diffusion pathways are blocked, lowering
  again.
66
again.
66
Huang et al.
62
shed light on this using staircase potentio-electrochemical impedance spectroscopy (SPEIS) to evaluate the different impedance contributions at different states of charge (SoC) for silicon anodes with the same silicon used in this study (Silgrain® eSi) and a similar electrode composition. The impedance response at low frequencies, associated with diffusion impedance in the electrode, was shown to decrease to ∼0.25 V ( 45
) before increasing again. This corresponds to an increase in the
45
) before increasing again. This corresponds to an increase in the  up to a lithiation of
  and then a decrease at higher concentrations of lithium. Trapped lithium in concentrations exceeding
  can thus be part of the reason why lithiation gradually becomes more difficult.
In the beginning of the fast cycles, with a CC of C/5, around 40%–50% of the charge capacity obtained with ILE1 and ILE7 stems from the constant voltage step (Fig. 6a). The  is lowered by approximately 10 percentage points over the first ∼30 cycles, coinciding with the increase in overall capacity observed for cells with these electrolytes for the first 20–30 cycles (Fig. 3). After this minimum in
  is reached, the fraction increases again, with a slightly higher slope for ILE7 than for ILE1. Looking at the potential profiles and differential capacity plots (Figs. S8 and S9), it is evident that the capacity from lithiation at ∼0.2 V vs Li/Li+, corresponding to the reaction process
  45
increases for ILE1 and ILE7 during these 20–30 cycles, before falling again. This can be explained by the gradual amorphization activating more and more of the available silicon in the electrode, as elucidated earlier. The increasing capacity will cease when the new silicon activated by this process is outweighed by the degradation processes, seen after 20–30 cycles in this case. It can also be seen that the polarization of the plateau/peak at ∼0.2 V vs Li/Li+ is higher for ILE7 than for ILE1 as the cycling progresses, i.e. shifting to lower potentials. Interestingly, it seems that the lithiation plateau/peak at ∼0.1 V, corresponding to the reaction process
45
increases for ILE1 and ILE7 during these 20–30 cycles, before falling again. This can be explained by the gradual amorphization activating more and more of the available silicon in the electrode, as elucidated earlier. The increasing capacity will cease when the new silicon activated by this process is outweighed by the degradation processes, seen after 20–30 cycles in this case. It can also be seen that the polarization of the plateau/peak at ∼0.2 V vs Li/Li+ is higher for ILE7 than for ILE1 as the cycling progresses, i.e. shifting to lower potentials. Interestingly, it seems that the lithiation plateau/peak at ∼0.1 V, corresponding to the reaction process  45,46
actually shifts slightly towards higher potentials for the ILEs (see Figs. S8/S9), thus reducing the distance (in potential) between these two prominent stages of lithiation. We hypothesize that the combination of 1) the increased polarization of the reaction
45,46
actually shifts slightly towards higher potentials for the ILEs (see Figs. S8/S9), thus reducing the distance (in potential) between these two prominent stages of lithiation. We hypothesize that the combination of 1) the increased polarization of the reaction  and 2) the lower polarization of the reaction
  phase can be explained as follows: The most easily accessible silicon is lithiated first (outer layers of the particle), and as more and more lithium is trapped in the silicon upon cycling, further lithiation to
  will occur in the more inaccessible/unlithiated core structure of the silicon in the electrode, explaining the increasing overpotentials (1). It follows that there will be an increasing amount of accessible and moderately lithiated silicon particles (
 ), needed for the further lithiation to the
  phase, thus decreasing the overpotentials relating to this reaction and increasing the capacity contribution from it (2).
As seen from Fig. 6b, the  values during delithiation are much lower than during lithiation. Which again is related to the larger distance (in voltage) from the delithiation plateaus/peaks to the cutoff potential (∼0.5 → ∼1.05 V vs Li/Li+), as compared to the lithiation plateaus/peaks to the cutoff (∼0.15 → 0.05 V vs Li/Li+), see Figs. S7 and S8.
For ILE2, the "waterfall" effect during delithiation can be explained in the same manner as during lithiation; much of the lithium that has been kinetically trapped during the fast cycles is released during the slow cycle. This increases the amount of a-Si, which can be lithiated during the next cycle, and there will thus be more lithium to extract during the next delithiation constant voltage step. Eventually trapped lithium kills the effect when it reaches a certain concentration and a new slow cycle is needed to properly delithiate the silicon again.
For the other electrolytes, the trend is different, with an initial reduction in  and no apparent waterfall effect (Fig. 6b). The initial reduction is reversed, and an increase in
  is observed after 5, 11 and 60 cycles for STD2, ILE3 and ILE7, respectively. For ILE1 a clear rise in
  is not observed during the first 90 cycles, differing from the other electrolytes.
The trends and inflection points in  (Fig. 6b) seems to coincide with the CE (Fig. 3) and can be generalized into three regimes, especially for cells with STD2:
- i)For the first (few) cycles, amorphization of Si and improved wetting increases the amount and accessibility of active material, thus lowering
 This outweighs the negative effects of particle cracking/roughening, namely increased SEI growth due to larger surface area, and electrical insulation and isolation of active material.
 - ii)The negative effects of particle cracking/roughening start to dominate and increases.
- iii)Eventually, most of the silicon particles are broken up into small clusters that are not prone to the same violent volume changes. From this point on the further increase in comes from less violent breaking and reformation of the SEI and gradual isolation of active material with each cycle.


Cells with the ILEs have slightly differing trends in  compared to STD2, where the main differences are delays in the cycle number where the trend shifts i), ii) and iii) happen and their extent. These later inflection points are due to slower Li+ transport (Table II) and thus higher overpotentials (Figs. S9 and S10) in the ILEs along with higher viscosity leading to slower wetting of the electrodes and a more gradual amorphization process. The largest deviations in the trend are the cells ILE1 and ILE7 where individual regimes are harder to distinguish. For cells with ILE1 it seems like the
  stabilizes at a lower level than for the other electrolytes, at least for ∼90 cycles, indicating that a more stable and less resistive SEI is formed in this electrolyte. ILE1 and ILE2 both contain the PYR13
+ cation (see Fig. 1). Thus, even though the cycling behavior is very different, it is worth noting that the
stabilizes at a lower level than for the other electrolytes, at least for ∼90 cycles, indicating that a more stable and less resistive SEI is formed in this electrolyte. ILE1 and ILE2 both contain the PYR13
+ cation (see Fig. 1). Thus, even though the cycling behavior is very different, it is worth noting that the  for delithiation seems to stabilize and not increase for ILE2 as well.
With ILE3, after in regime iii) the  continues rising with the highest slope of all electrolytes. This indicates that cells with ILE3 either form a more resistive SEI compared to the other electrolytes and/or experience gradual isolation of active material upon delithiation.
Wetjen et al. 44 explained similar trends as those described here by particle shrinkage (upon delithiation) resulting in temporary isolation and incomplete delithiation of silicon nanoparticles in composite anodes. They suggested that silicon detachment and loss of electrical contact was caused by an increasingly long mean electron conduction path length in the electrode with increasing silicon content. In the cells used in this work, all electrodes have the same composition, and differences in the performance is thus a direct or indirect consequence of the electrolyte composition and its effect on SEI layer formation and degree of (de)lithiation.
Rate performance
The rate performance of the μMG-Si anode was also tested in pseudo-full cells with the same electrolytes, and the results are shown in Fig. 7. ILE2 was left out of the rate test due to its poor performance in the long duration cycling. Four galvanostatic cycles were performed at each rate step; C/20, C/5, C/2, 1C, 2C, C/20, with the maximum charge current kept at C/2. No constant voltage steps were included in the program except for the first cycle.
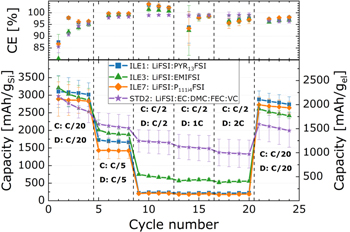
Figure 7. Rate test cycling of pseudo-full cells of μMG-Si (≈2.68 mAh cm−2, ∅ 12 mm) vs LFP (≈3.5 mAh cm−2, ∅ 14 mm) with electrolytes ILE1 ( ), ILE3 (
 ), ILE7 (
 ) and STD2 (
 ). Average discharge capacities of at least three cells shown with error bars representing one standard deviation. ILE2 omitted because of poor performance.
Download figure:
Standard image High-resolution imageFor the first four cycles at C/20, cells with all electrolytes deliver delithiation capacities in the range of 2500–3250 mAh gSi −1. There does seem to be a difference in the slope, with ILE3 and STD2 having more rapid loss of capacity than ILE1 and ILE7. This is also reflected in the lower CE of ILE3 and STD2 during these cycles. At the next rate step, C/5, there is a clearer difference in delivered capacity between the different electrolyte systems, ranking highest to lowest is STD2, ILE3, ILE1 and ILE7, consistent with the lithium transport properties of the electrolytes (see Table II), although the cycling data has a considerable standard deviation. The CEs are in the range 98%–99%.
At C/2, only the carbonate electrolyte (STD2) can maintain a decent delithiation capacity of around 1700 mAh gSi −1. ILE3 hovers around 650–750 mAh gSi −1 while ILE1 and ILE7 cannot deliver more than ∼200 mAh gSi −1. Coulombic efficiencies are stable for STD2 at ∼99%, while it is >100% for the ILEs, indicating that there is trapped lithium from the previous cycles being released upon delithiation. At rates of 1C and 2C, STD2 gradually loose capacity down to around 1300 mAh gSi −1, whilst ILE3 retains >500 mAh gSi −1. ILE1 and ILE7 exhibit capacities around 200 mAh gSi −1. CEs are consistent and high around 99% for STD2 at these rates, and lower and with higher standard deviations for the ILEs. In the last four cycles, returning to a slower rate of C/20, cells with ILE1, ILE7 and ILE3 retain capacities around and slightly below 2000 mAh gSi −1 while STD2 is around 1500 mAh gSi −1, although with a large standard deviation. The difference in slope is consistent with the initial four cycles and CEs are overlapping in the range ∼96%–98%.
Figure 8 shows the differential capacity profiles for all electrolytes at the third cycle of each rate step. Arrows of similar color within each subfigure represent corresponding Si lithiation and delithiation peaks from low to high C-rate. Peak assignments c2, c3, c4, d1/d1', d2, d3 and d4 denoting delithiation peaks and lithiation peaks, respectively, are adapted from the work by Ogata et al.
46
Crossed black arrows indicate where a peak disappears. At C/20, the cells with all electrolytes exhibit the correlated c2//d4 (∼0.25–0.3 V//∼0.55 V) and c3//d2 (∼0.1 V//∼0.3 V) peaks corresponding to reactions  and
and  respectively. The peak positions are very similar between the cells, and not far from the expected positions,
45,46
indicating low overpotentials at this rate. The peaks are expected to not deviate substantially from the real ESi value in the relevant voltage range from the assumption that
respectively. The peak positions are very similar between the cells, and not far from the expected positions,
45,46
indicating low overpotentials at this rate. The peaks are expected to not deviate substantially from the real ESi value in the relevant voltage range from the assumption that  which was verified through experiments using 3-electrode cells (Figs. S1 and S2). These showed that the deviations are generally low and within ∼0.05 V, with exceptions at high potentials on the silicon (beginning of lithiation, end of delithiation) and larger deviations for the electrolytes with the slowest Li+ transport.

Figure 8. Differential capacity plots of pseudo-full cell rate test cycling of μMG-Si electrode with an LFP cathode and electrolytes a) ILE1 (LiFSI:PYR13FSI), b) ILE3 (LiFSI:EMIFSI), c) ILE7 (LiFSI:P111i4FSI) and d) STD2 (LiFSI:EC:DMC:FEC:VC) at 20 °C. The curves shown are from cycles 3, 7, 11, 15, 19 and 23 with [charge∣discharge] rates of; [C/20∣C/20], [C/5∣C/5], [C/2∣C/2], [C/2∣1C], [C/2∣2C], [C/20∣C/20], respectively. Arrows of similar color within each subfigure represent corresponding Si lithiation and delithiation peaks from low to high C-rate. Data chosen from the individual cell for each electrolyte that was most representative of the average cell data shown in Fig. 7. The silicon electrode potential (ESi) was calculated from the cell voltage assuming a constant LFP electrode potential of 3.45 V (vs Li/Li+).
Download figure:
Standard image High-resolution imageSTD2 in addition has a weak signal from the c4 (∼50 mV) peak corresponding to the reaction  and a much larger peak d3 (∼0.48 V) corresponding to the asymmetric reaction
  This particular phase change is reported to cause additional degradation of the anode because of inhomogeneous volume shrinkage by going directly from the crystalline highly lithiated phase to the lower lithiated amorphous silicides.
46,67
The difference in size between the peaks indicates that some
This particular phase change is reported to cause additional degradation of the anode because of inhomogeneous volume shrinkage by going directly from the crystalline highly lithiated phase to the lower lithiated amorphous silicides.
46,67
The difference in size between the peaks indicates that some  phase was left over from the previous two cycles, likely mostly from the first cycle which includes a CV step at the end of lithiation.
At the C/5 step the c2 peak has shifted to slightly lower potentials vs Li/Li+ for all electrolytes, but more for ILE1 and ILE7 than for ILE3 and STD2. The larger shift is likely due to inferior lithium transport properties. More importantly, the peak has been severely narrowed at the side facing higher potentials (vs Li/Li+). This indicates a disproportionate reduction in the early reactions going from  where x is small. This is in line with the lithium trapping effect as explained by Rehnlund et al. and Lindgren et al.
64,65
and thus differences seen in the narrowing of the peak suggest more lithium is trapped in cells with ILE1 and ILE7 than in ILE3 and STD2. This is likely caused by the previously mentioned differences in the lithium transport properties of the electrolytes.
where x is small. This is in line with the lithium trapping effect as explained by Rehnlund et al. and Lindgren et al.
64,65
and thus differences seen in the narrowing of the peak suggest more lithium is trapped in cells with ILE1 and ILE7 than in ILE3 and STD2. This is likely caused by the previously mentioned differences in the lithium transport properties of the electrolytes.
A more severe polarization is seen for the c3 peak and the corresponding d2 peak. The overpotential is largest for ILE7, then ILE1, ILE3 and STD2. The shift of the c3 peak to beyond the cutoff potential is here identified as the main reason for the loss of capacity seen at higher rates (see Fig. 7). From similar rate tests in 3-electrode cells (see Fig. S2), the polarization of LFP with higher rates can be seen to not increase nor fluctuate substantially ( ), so the large shifts in c3/d2 cannot merely be ascribed to errors following the assumption that
The increased polarization is obviously related to the differences between the electrolytes, either directly through the electrolyte transport properties or indirectly through the narrowing of pores due to the expansion of the silicon. This last point is in agreement with the observed results of larger peak shifts at higher degrees of lithiation. Another possibility could be that the kinetics of the charge transfer process is significantly slower for these electrolytes when the surface of the silicon particles has a lithium concentration of  To the best of our knowledge, no published work has specifically investigated the relation between exchange current density,
  and state of charge (SoC) in a silicon anode for LIBs with similar electrolytes to the ones used here. The SPEIS data from Huang et al.
62
might give an indication of
and state of charge (SoC) in a silicon anode for LIBs with similar electrolytes to the ones used here. The SPEIS data from Huang et al.
62
might give an indication of  as a function of SoC for a carbonate electrolyte. They state that the interphase contact and charge transfer resistance increase at a SoC beyond
  Thus, the dependence of the charge transfer resistance as a function of SoC could also provide an explanation of results obtained here. Swamy et al.
68
investigated the charge transfer reaction kinetics of the silicon-liquid electrolyte interface for a fully lithiated ("
Thus, the dependence of the charge transfer resistance as a function of SoC could also provide an explanation of results obtained here. Swamy et al.
68
investigated the charge transfer reaction kinetics of the silicon-liquid electrolyte interface for a fully lithiated (" ") silicon wafer electrode in a standard carbonate electrolyte and stated that previous work on the charge transfer kinetics of silicon had reported values with "enormous variabilities." There seems to be potential for more investigations on this subject. Similarly, little is known about the desolvation energies of Li+ from ionic liquids. For standard carbonate electrolytes in combination with graphite anodes, this is the dominating contribution to the electrode resistance.
69–72
") silicon wafer electrode in a standard carbonate electrolyte and stated that previous work on the charge transfer kinetics of silicon had reported values with "enormous variabilities." There seems to be potential for more investigations on this subject. Similarly, little is known about the desolvation energies of Li+ from ionic liquids. For standard carbonate electrolytes in combination with graphite anodes, this is the dominating contribution to the electrode resistance.
69–72
At higher rates than C/5 only STD2 can maintain lithiation beyond  although with increasing overpotentials. ILE3 can sustain some capacity from the lithiation up to
  but with even larger overpotentials shifting the lithiation peak to ∼15 mV at a rate of C/2. ILE1 and ILE7 loses most of the capacity although ∼200 mAh gSi
−1 is retained through a small peak at ∼0.2 V on lithiation. It is peculiar that this peak has a lower overpotential with electrolytes ILE1 and ILE7 than for ILE3, if it is indeed from the
but with even larger overpotentials shifting the lithiation peak to ∼15 mV at a rate of C/2. ILE1 and ILE7 loses most of the capacity although ∼200 mAh gSi
−1 is retained through a small peak at ∼0.2 V on lithiation. It is peculiar that this peak has a lower overpotential with electrolytes ILE1 and ILE7 than for ILE3, if it is indeed from the  reaction. To verify that this is not capacity mainly from lithiation of carbon black we estimated its contribution. Based on data from the thorough characterization of Timcal Super P (virtually identical to Timcal Super C65 used here)
73
by Attia et al.,
74
and the electrode composition used in this work (see "Electrode preparation and cell assembly"), the capacity contribution from the carbon black additive should not be greater than ∼35 mAh gSi
−1, where more than 60% is expected to be from capacitive charge storage. There is also no distinguishing plateau in the voltage profile of Timcal Super C65. Most of the ∼200 mAh gSi
−1 is therefore likely from the lithiation of silicon.
reaction. To verify that this is not capacity mainly from lithiation of carbon black we estimated its contribution. Based on data from the thorough characterization of Timcal Super P (virtually identical to Timcal Super C65 used here)
73
by Attia et al.,
74
and the electrode composition used in this work (see "Electrode preparation and cell assembly"), the capacity contribution from the carbon black additive should not be greater than ∼35 mAh gSi
−1, where more than 60% is expected to be from capacitive charge storage. There is also no distinguishing plateau in the voltage profile of Timcal Super C65. Most of the ∼200 mAh gSi
−1 is therefore likely from the lithiation of silicon.
When returning to the C/20 rate, it is apparent that some lithiation capacity is lost in the c2 process, again indicating trapped lithium, but almost all capacity from c3 is regained, and this applies to all electrolytes.
SEI composition
The solid electrolyte interface (SEI) composition formed by each electrolyte onto the μMG-Si anode after one cycle is shown in Fig. 9. XPS spectra from survey scans and deconvoluted regional scans of F 1 s, N 1 s, C 1 s, S 2p, and Si 2p can be found in section S8 (Figs. S16–S23) and sources for all the peak assignments can be found in Table SIII.
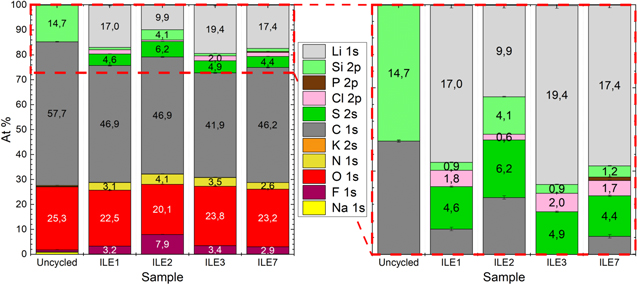
Figure 9. Surface composition of μMG-Si electrodes cycled in 3 electrode pseudo-full cells vs LFP with a Li metal reference for 1 cycle in ILE1 (LiFSI:PYR13FSI), ILE2 (LiFSI:PYR13TFSI), ILE3 (LiFSI:EMIFSI) and ILE7 (LiFSI:P111i4FSI) at 20 °C, compared to an uncycled pristine electrode. Right hand side is an expanded view of the at % range highlighted by red dashed lines.
Download figure:
Standard image High-resolution imageThe XPS data from electrodes after one cycle is expected to give some insight into the possible difference in extent and composition of the SEI at this early stage. An uncycled electrode is included for reference.
From Fig. 9 it can be seen that after 1 cycle, the Si 2p signal is significantly reduced for all cells. This can be used as an indication of the extent of the SEI formation on the electrode surface, as a thicker or less photoelectron-permeable SEI will weaken the silicon signal more. The cell with ILE2 show the strongest Si 2p signal, which is likely explained by the very low degree of lithiation with this electrolyte and correspondingly lower amounts of reduction products. The low degree of lithiation can easily be observed in the regional Si 2p scan in Fig. S25c where a strong  signal can still be seen and the Si peak has not been shifted very far to lower binding energies.
ILE1, ILE3 and ILE7 all have a very low Si 2p signal of around 1 at.%, down from almost 15 at.% in the pristine electrode. From the regional Si 2p scans, the peak position of  and
and  indicates a degree of lithiation ranking from high to low; ILE3 > ILE7 ≈ ILE1, which is in agreement with the difference in obtained capacities in cells with these electrolytes. Out of these three electrolytes, electrodes cycled in ILE7 has the strongest Si 2p signal and the lowest relative amounts of F, N and S; elements which all are expected to stem from the decomposition of electrolyte species, indicating a more photoelectron-permeable or thinner SEI with this electrolyte. It is important to stress that leftover unreacted electrolyte due to incomplete washing could possibly be part of the signal, but it is not assumed to be a major part at least for ILE1, ILE3 and ILE7, as it would then be expected that ILE3 would have the lowest F, N, S signals since it has the lowest viscosity and should be the easiest to wash off. This assumption is valid also for the rest of the analysis.
A peculiarity from the data in Fig. 9 is the significant signal from Cl 2p. This is likely chloride salt impurities originating from the production of the LiFSI salt, the ionic liquid or their precursors. 75,76 There is much less chloride on the surface of the electrode cycled in ILE2, containing a TFSI- ionic liquid, indicating that the impurity might be from the FSI–based ionic liquids. Chloride is known to increase the viscosity of ionic liquids 75 and to be corrosive towards the aluminium current collector on the cathode side. At the fairly low potentials of the LFP electrode (∼3.45 V vs Li/Li+), corrosion is not considered a major problem, 77 and no signs of corrosion were observed from visual inspection upon opening the cycled cells. Given this and the purity of the starting materials (see section "Electrolyte preparation"), chloride impurities are not expected to be a major factor in the performance of the cells studied here. Nonetheless, a substantial amount is detected in the SEI. It is unknown what compound the chloride embeds itself in the SEI as in this case, and what effect it has. LiF is readily formed and is considered a beneficial SEI component, so one might think that LiCl could be present, but it is unlikely as LiCl is a lot more soluble than LiF in most solvents (e.g. ∼150 times more soluble in a BMIMoTf at RT). 78
There is significantly higher concentrations of F, N and S on the electrode cycled in ILE2. The F can be explained by the TFSI− anion having three times more fluoride than the FSI− per ion whilst N and S can only be explained by more electrolyte or degradation products left on this electrode. The combination of the increase in F, N and S content with the high Si 2p signal and low degree of lithiation indicates that there is residual electrolyte on the surface, which is more likely for this highly viscous electrolyte as compared to the others. Because of this, extra caution is taken in the further analysis of the XPS data for ILE2.
Figure 10 shows the estimated relative amounts of nondegraded and degraded FSI from the deconvolution of the F 1 s and S 2p peaks for the electrodes cycled in ILE1, ILE3 and ILE7 (see Figs. S17 and S21). ILE2 was left out for the abovementioned reason as well as because of the combination of LiFSI and LiTFSI that leads to overlapping peaks that are hard to quantify especially in the case of S 2p. The relative amounts of degraded FSI− in Fig. 10 and comparison of overlaid S 2p and N 1 s spectra in Fig. S23 indicate a relatively higher amount of degraded of FSI− in cells with ILE3 and ILE7 than in ILE1 (and ILE2) for the first cycle.
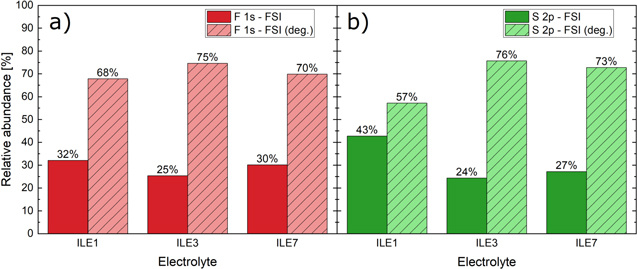
Figure 10. Relative amounts of nondegraded and degraded FSI- from a) F 1 s and b) S 2p regional X-ray photoelectron spectroscopy of μMG-Si electrodes cycled in 3 electrode pseudo-full cells vs LFP for 1 cycle in ILE1 (LiFSI:PYR13FSI), ILE3 (LiFSI:EMIFSI) and ILE7 (LiFSI:P111i4FSI) at 20 °C. See Figs. S20 and S24 in supplementary information for the deconvoluted F 1 s and S 2p peaks. Figure inspired by Araño et al. 79
Download figure:
Standard image High-resolution image
The F 1 s spectra (see Fig. S17) show LiF to be the main degradation product of the IL anion. The other peaks are ascribed to the unreacted Li(T)FSI salt and possibly indistinguishable fragments of it. Maintaining equal position and FWHM of the FSI− peak between the electrolytes leads to an additional peak at higher binding energies for ILE3, but it is not known whether this represents an unknown species or is an artefact of the fit.
The S 2p spectra (see Fig. S21) display a range of peaks that can be ascribed to sulfones, sulfates, sulfites and several different lithium (poly)sulfides stemming from reduction of the anion. Several proposed reduction mechanisms and degradation products for LiTFSI, LiFSI and PYR13 + are summarized in section S7 in the supplementary information and show how some of the detected species may have formed.
The N 1 s spectra (Fig. S19) provide insight into more degradation products, both from the anions and the cations. Li3N is present in the order of ILE3 > ILE7 > ILE1 > ILE2 and thus seems to scale with the overall degradation of FSI−, although the higher concentration in ILE3 might indicate it as a byproduct also of cation degradation (EMI+ has two N vs one in PYR13 + and none in P111i4 +). The lower stability towards reductive degradation of the ILE3 electrolyte compared to ILE1, ILE2 and ILE7 can be confirmed in the differential capacity curve in Fig. S16, where ILE3 displays a significant peak at ∼0.6 V and a less intense peak at ∼0.35 V vs Li/Li+, and lower stability is also reported in the literature (see Table SI). 58 Since neither of these cathodic peaks are present in the curves of the other electrolytes and the cation is the only differentiating factor between them, it is logical to assume that the peaks represent reduction reactions involving the EMI+ cation.
Jafta et al. 54 thoroughly investigated the reductive degradation of electrolytes based on LiTFSI or LiFSI in EMIFSI using operando SANS, EIS, ex situ XPS and electrochemical methods on high surface area mesoporous carbons. For TFSI− based electrolytes, the EMI+ cation was found to intercalate into the carbon structure and partially reduce in a broad peak at 0.55 V vs Li/Li+ due to the lack of a proper SEI. In LiFSI electrolytes, FSI−-degradation products were found to form a good SEI that hindered EMI+ intercalation, but an EMI+ reduction peak was assigned at 0.9 V, with a visible shoulder at ∼0.7 V. Peaks at ∼402 eV in the N 1 s regional XPS spectra and 286.0 eV in the C 1 s spectra that increased in intensity with the degree of lithiation were ascribed to carbonaceous decomposition products from EMI+. A literature report on XPS of a neat EMISCN IL puts the signal from the intact EMI+ cation at 401.8 eV. 80 It is thus unclear whether the peak oberserved at ∼402 eV in our work is from degraded EMI+ or intact cations from leftover IL. Also, although difficult to separate from C–O, C–S and C–P (see Fig. S20), there was no significant difference in the C–N signal of the C 1 s spectra between electrodes cycled with the imidazolium ILE (ILE3) and the other electrolytes.
Jafta et al. also reported the EMI+ cation to be unstable at a lithium surface even at OCV, proposing the formation of imidazole carbene that could further react with other cations to form dimers, or with water traces to eventually form Li2O, LiOH or LiF. Lane, 58 basing his views on a substantial amount of literature, proposed that 1,3-dialkylimidazoliums would likely form imidazolium radicals through electrochemical reduction of the C2 carbon (carbon between the two nitrogens), which could further undergo dimerization and disproportionation reactions, but also carbene formation for cations with sterically bulky substituents.
It is likely that in our work, reductive decomposition of the EMI+ cation through radical formation takes place, but not to a large enough extent to be easily distinguishable by XPS of the SEI after only one cycle, other than the EMI+ signal at ∼402 eV. A peak around 400.4 eV marked "C" in Fig. S19c could mark other degradation products from the cation. Imidazoles, amines, amides and nitriles are generally characterized by binding energies in the region 399.7–400.1 eV, 81,82 coinciding somewhat with the observed peak. Based on the lower stability of the EMI+ cation, it could be assumed that peak C would be specific to or at least more prominent in the sample cycled in ILE3 compared to the other electrolytes, but this is not the case. An equally large or larger peak can be found for the other electrolytes around the same binding energy. Even cells with the phosphonium-based ionic liquid electrolyte (ILE7), that does not contain nitrogen in the cation, seems to contain a feature at this position. This last point indicates that the peak at ∼400 eV can come from degradation of the anion.
It cannot be concluded whether the EMI+ cation is more prone to reductive degradation than the cations in the other electrolytes, nor in that case, which additional SEI species is formed, based on these XPS data after one cycle, although the dQ/dV curve show additional reductive peaks for ILE3, around 0.6 and 0.35 V (Figs. S24, S25) and a lower CE is observed upon extended cycling for cells with ILE3 (Fig. 3/Table II).
Likewise, it is difficult to prove the presence of decomposition products of the PYR13 + cation in ILE1 and ILE2 other than the signal at ∼403 eV, which is most often ascribed to the intact cation. 79,83,84 The peak marked "A" in Figs. S19a and S19b corresponds with the expected position of degradation products as stated in the literature (see Table SIII), but the similar peak in the N 1 s signature of ILE3 (peak C in Fig. S19c) and particularly the one in ILE7 (peak E in Fig. S22d), an electrolyte that does not contain nitrogen in the cation, makes the assignment and quantification of PYR13 + and EMI+ degradation products at this binding energy questionable. The deconvoluted peaks A/C/E could thus be products of fitting assumptions and/or be mainly influenced by degradation products from the FSI− anion. Some decomposition of the PYR13 + cation is however expected from the reported stability limits (see Table SI and Lane 58 ).
Regarding the P111i4 + cation, a small P 2p signal overlapped by the Si 2p plasmon band was detected (see Fig. S23). The position of the peak correlates well with the literature value for the unreacted phosphonium cation, 85 but due to a weak signal, deconvolution of the peak into potential degradation products was not deemed feasible. Girard et al. 86 saw no degradation of the cation on a Li metal electrode using a highly concentrated 3.8 m LiFSI in P111i4FSI electrolyte and Araño et al. 79 also showed no/little degradation of a similar 3.2 m LiFSI in P1222FSI electrolyte, but importantly saw some signs of degradation for electrolytes of lower concentration. Some limited degradation of the phosphonium cation is thus expected in the 0.8 m LiFSI electrolyte in this work.
Overall, the ILEs tend to form mostly similar SEIs where the main components are formed by degradation of the FSI anion, forming LiF, sulfones, sulfates, sulfites, (poly)sulfates, and Li3N. The possible degradation of nitrogen containing cations (PYR13 + and EMI+) could form amines, amides and nitriles, but this is as mentioned difficult to prove after one cycle. This is further complicated by the fact that some of the N 1 s peaks that in the literature are ascribed to degradation of the nitrogen-containing cations also seem to appear on the electrode cycled with the phosphonium-FSI electrolyte. XPS after extended cycling, possibly with similar ILEs containing different anions, would be of interest to elucidate the cation degradation of these ionic liquids on silicon. Survey scan data indicate larger amounts of SEI-components on the silicon electrode cycled in the imidazolium ionic liquid electrolyte compared to the other ILEs. Indications of EMI+ cation reduction in the dQ/dV analysis supports this finding, in agreement with other works describing it as the least cathodically stable. 58,87 However, previous studies have also shown that the reductive stability of i.e. EMI cations is influenced by the anion, and that SEIs formed in ILs based on FSI anions might be dominated by FSI reduction product, both due to "shielding effects," with Li+ and FSI ions dominating the inner electrode/electrolyte interphase, 88 as well as the fact that LiFSI anions are susceptible to decomposition. 89
Conclusions
Electrochemical performance of anodes made from low cost, metallurgical grade silicon in combination with ionic liquids based on PYR13, EMI and P111i4 cations, and FSI or TFSI anions was investigated. Cells with the PYR13FSI and P111i4FSI electrolytes showed the best cycling stability, maintaining reversible capacities of over 1200 mAh gSi −1 at a rate of C/5 (cycle 100) and over 2000 mAh gSi −1 at a rate of C/20 (cycle 101), as well as the highest average coulombic efficiency (99.1%) for the cycles 3–100. The poorer cycling stability of a standard carbonate electrolyte, and also the EMIFSI ionic liquid, is partly caused by the higher degree of lithiation in the initial cycles, and correspondingly faster degradation. The initial lithiation was affected by both the Li-ion mobilities, but also the wetting of the solid electrode surface by the electrolyte. For the ionic liquids, the capacitance of the electrodes increased significantly after cycling, indicating an increase in electrochemically active surface area. The opposite was observed for the carbonate electrolyte.
For electrodes cycled in the ionic liquids, the SEI appeared to be composed of mainly FSI− degradation products including LiF, sulfones, sulfates, sulfites, (poly)sulfates, Li3N, possibly some amines, amides and nitriles, as observed from post-mortem XPS studies. Degradation products from the ionic liquid cations could not be verified. However, the dQ/dV analysis indicated EMI+ cation reduction, but no reduction of PYR13 or P111i4, while the cyclic voltammograms were all similar. The excellent cycling stability of the PYR13FSI, in spite of the limiting current being very close to the EMIFSI (8.7 vs 10.1 mA cm−2), is an indication of a more favorable SEI for this electrolyte, while the SEI formed in EMIFSI appears to be more conductive, but less passivating.
Electrodes cycled with the standard carbonate electrolyte had the best rate performance, while the EMIFSI ionic liquid achieved the highest reversible capacities of the ILEs, retaining a discharge capacity of >500 mAh/gSi at a rate of 2C. Cells with the PYR13FSI and P111i4FSI electrolyte had only a limited capacity at a rate of C/2 and higher.
To conclude, LiFSI:PYR13FSI (ILE1) and LiFSI:P111i4FSI (ILE7) are viable as safer electrolyte candidates for μMG-Si anodes, with possible capabilities of working with high voltage cathodes (∼5 V). The sluggish lithium transport in these electrolytes prohibit their use in high power applications, although operation at higher temperature or as part of electrolyte mixes with cosolvents of lower viscosity could possibly mitigate some of the rate limitations.
Acknowledgments
This work was performed within MoZEES, a Norwegian Centre for Environment-friendly Energy Research (FME), co-sponsored by the Research Council of Norway (project number 257653) and 40 partners from research, industry and public sector. Institute for Energy Technology (IFE) is acknowledged for providing the Si electrodes. The Research Council of Norway is acknowledged for the support to the Norwegian Micro- and Nano-Fabrication Facility, NorFab, project number 245963/F50. The authors wish to extend special thanks to Professor Daniel Lemordant (University of Tours) and Dr Jan Petter Mæhlen (IFE) for providing invaluable input for overcoming key experimental challenges early on in the project.