

Abstract
The study deliberates the detection of ethanol/methanol concentration utilizing the phenomenon of lossy mode resonances on the multimode optical fiber by coating ZnO nanorods and bulk layers of TiO2 to serve as a lossy mode exciting layer. These layers have been characterized by FESEM, and their composition has been confirmed by EDS spectroscopy. Sensitivity of the ZnO nanorod coated optical fiber probe was found to be 28898.46 nm RIU−1, which is four times the sensitivity of the ZnO nanowire grown gas sensor for 1000 ppm of ethanol. Further, it is 4.5 times the sensitivity of TiO2 coated fiber probe. The sensitivity of TiO2 coated fiber optic probe comes about 7962.88 nm RIU−1, for methanol detection. The study reveals that the ZnO nanorod grown probe is highly recommended owning to the high figure of Merit i.e., 171.64 along with high sensitivity and detection accuracy values. The selectivity test also confirms the selectivity of this probe towards ethanol with ZnO NRs. Therefore, the development of an easy, durable, low-cost, and highly sensitive optical fiber sensing probe for the detection of ethanol and methanol has been achieved that may find ample considerations by the researchers in this field.
Export citation and abstract BibTeX RIS
Volatile organic compounds(VOCs) like ethanol and methanol are the major source of indoor environment pollution due to their presence in paint, wax, antifreeze solutions, detergent and also in combustion processes.
1,2
Consumption of these VOCs in any form can damage the respiratory system and may cause lethal disease such as cancer.
3
These VOCs (ethanol and methanol) have identical physical and chemical properties. Both are colourless, water soluble and have same density. These are not costly and are easily available in market. These can be widely used for production of spirits, wines and also as methanol contamination in hydrated ethyl alcohol fuel (AEHC).
4
On the other front, fruits and vegetables are major part of our diet. Tomato (Solanum esculentum) is consumed largely as a fresh vegetable and also as processed product like tomato ketchup and tomato jam.
5
It helps to reduce several diseases due to its antioxidant property.
6
It is a rich source of vitamins (C and E), phenolic compounds, potassium and also beta-carotene etc.
7
Extraction of methanol in tomato is done with Liquid Chromatography (LC) for different cultivars grown in Almeria.
8
Since past many years, methanol poisoning cases are continuously increasing. Adverse results like loss of vision, organ failure, nervous breakdown and loss of life are observed due to toxic nature of methanol.
9
Methanol is widely used in paints, in laboratories as a solvent, and also in chemical plants.
10,11
Wherever required it must be used with proper precautions because a little amount of methanol can cause dangerous issues if it is consumed through any mean such as inhalation, injection, drink spiking and absorption through the skin.
12
Recently during this pandemic of COVID-19, more than 1250 cases and more than 700 deaths happened in US, Iran and India due to consumption of methanol—contaminated hand sanitizers.
13,14
If someone intakes methanol in any form its adverse results can be traced within 30–60 min.
11,12
Methanol is also termed as methyl alcohol, and it is not highly toxic by itself. But, its by-products like formaldehyde and formic acid have high toxicity.
12
Once the methanol is consumed, it converts into formaldehyde by enzyme alcohol dehydrogenase (ADH) in liver.
1
Methanol metabolizes into formaldehyde with the rate of 85 mg  and in formic acid within next few minutes and then in carbon dioxide and water as its final products.
14
Complete process of metabolization can be seen from the reaction:
and in formic acid within next few minutes and then in carbon dioxide and water as its final products.
14
Complete process of metabolization can be seen from the reaction:
On the other hand, Ethanol is not that much dangerous if consumed within the limit but when it is taken beyond the limit, it may cause serious issues with nervous system and can be a reason of slow death. Since ethanol is an important part of foodstuffs, alcohol beverages, pharmaceuticals and cosmetic products, measurement of concentration of ethanol becomes more important to avoid the hazards due to the excess of ethanol in human body like fatigue, vomiting and headache.
15
Regular alcohol intake may cause high sugar level in blood.
16
A U-shaped relationship is found between alcohol and Type 2 diabetes. According to which, both high and low intake may cause high risk and moderate intake cause low risk of being a diabetic patient.
17
Feasting of carbohydrate after consumption of alcohol can cause hypoglycemia due to gluconeogenesis reduction in type 2 diabetic patient.
18
When methanol is consumed with ethanol, response time of metabolization and appearance of symptoms decrease with in 24 h.
19
Hence instant diagnosis becomes necessary for proper treatment and increasing the chance of recovery of the patient. Many techniques have been used for the detection of ethanol and methanol till now. Wolfgang et al. in 1990, developed a flow injection method with gas-diffusion dilution for determination of ethanol concentration in beverages.
20,21
Differential- Pulse Polarographic (DPP) method was used by Chen et al. in 1992 for ethanol detection in beer.
22
In 1996, Enzymatic method was used by Mizgunova et al. for ethanol and methanol detection.
23
High Performance Liquid Chromatography (HPLC) was used by Kuo et al. and Yarika et al. in 2002 for the detection of ethanol and methanol.
24,25
A rapid detection of methanol was done by Wang et al. (2004) using Gas Chromatography (GC).
26
In 2008, Fourier transform Mid Infrared and Near Infrared techniques were used for the determination of methanol in ethanol fuel.
4
Surface Plasmon Resonance (SPR) based optical fiber sensor was developed by Arakawa et al. in 2010 for alcoholic vapours detection.
27
Raman spectroscopy was used in 2012 by Bayoci et al. for detection of ethanol and methanol in alcoholic beverages.
28
 coated SPR based optical fiber sensor was developed for the NIR selective rays by Sharma et al. in 2018.
29
In these lines of development, nanoscience and nanotechnology are also gathering attention and showing rip-roaring change in the performance of the sensor due to the nanoscale dimensions of the material.
30–36
Interesting nature of these nanostructures is the change in the electrical, thermal, physical, chemical, magnetic and optical properties of the material by controlling their shape, size, temperature, aspect ratio and field.
37–41
There are numerous metal oxide materials such as ITO,
coated SPR based optical fiber sensor was developed for the NIR selective rays by Sharma et al. in 2018.
29
In these lines of development, nanoscience and nanotechnology are also gathering attention and showing rip-roaring change in the performance of the sensor due to the nanoscale dimensions of the material.
30–36
Interesting nature of these nanostructures is the change in the electrical, thermal, physical, chemical, magnetic and optical properties of the material by controlling their shape, size, temperature, aspect ratio and field.
37–41
There are numerous metal oxide materials such as ITO, 


 ZnO etc.,
42–48
which are also portraying their importance in sensing technologies.
49–52
Among them, Zinc oxide is playing an crucial role in optics and other fields due to their peculiar properties like strong absorption band in UV-Visible region, inversion symmetry of the structure, high melting point, high binding energy that supports the excitonic recombination at room temperature, high threshold level of optical damage, direct wide band gap that supports small wavelength and no thermal damage.
53,54
Due to numerous advantages, ZnO nanorods are widely used in nanowire lasers, field emission devices, nanowire photodetectors and fiber optic sensors etc.
55–58
Comparatively, nanostructured metal oxide semiconductors also have more adsorption than the metal oxide film which results more interaction between the target analyte and nanostructures and enhance the performance of the sensor.
59–61
The detection of toxic methanol using ZnO nanostructures has also been reported in literature.
62–66
ZnO etc.,
42–48
which are also portraying their importance in sensing technologies.
49–52
Among them, Zinc oxide is playing an crucial role in optics and other fields due to their peculiar properties like strong absorption band in UV-Visible region, inversion symmetry of the structure, high melting point, high binding energy that supports the excitonic recombination at room temperature, high threshold level of optical damage, direct wide band gap that supports small wavelength and no thermal damage.
53,54
Due to numerous advantages, ZnO nanorods are widely used in nanowire lasers, field emission devices, nanowire photodetectors and fiber optic sensors etc.
55–58
Comparatively, nanostructured metal oxide semiconductors also have more adsorption than the metal oxide film which results more interaction between the target analyte and nanostructures and enhance the performance of the sensor.
59–61
The detection of toxic methanol using ZnO nanostructures has also been reported in literature.
62–66
Further, Lossy Mode Resonance (LMR) based optical fiber sensors are also gaining popularity among all these techniques due to their compact size, low cost, capability to deal with electromagnetic interference, application in remote sensing and real-time monitoring etc.
67
In LMR based fiber optic sensors, waveguide modes couple with the coating modes to approach the resonance condition. An attenuation dip in the transmission spectrum appears corresponding to this resonance.
68
In the present study, we have developed a refractive index sensor for the detection of ethanol and methanol realizing the excitation of the lossy modes on to the core of a multimode optical fiber. ZnO NRs and  has been considered as the LMR active materials for the excitation of lossy modes. To comparatively analyse the sensing capabilities, two sets of the fiber probes were prepared: one of them was coated with the ZnO nanorods grown with the hydrothermal technique
69
and the other one was coated with the
has been considered as the LMR active materials for the excitation of lossy modes. To comparatively analyse the sensing capabilities, two sets of the fiber probes were prepared: one of them was coated with the ZnO nanorods grown with the hydrothermal technique
69
and the other one was coated with the  bulk layer. For the confirmation of successful deposition, FESEM and EDS characterizations were carried out. Our studies revealed that the present LMR based optical fiber sensor is capable of detecting even a very low concentration of methanol and ethanol dissolved in DI water. Different concentration samples were prepared to observe the effect of varying concentration on the resonance wavelength. Sustainability of sensor was confirmed from the stable response of the sensor even after four months. Sensitivity enhancement of this sensor is depicted by comparison with other VOCs detection sensors. The study may find ample consideration in the food and beverages industry for the detection of ethanol/methanol present in the food products to avoid hazardous side effects on human body.
Experimental
Materials used and sample preparation
Zinc acetate, sodium hydroxide (NaOH), zinc nitrate hexahydrate, deionized water, hexamethylene tetra amine (HMTA), titanium dioxide ( ), ethanol and methanol were the chemicals used in our work. All these chemicals were used without any further purification. Zinc acetate, NaOH and
  powder, 99.8% trace metal basis were purchased from Sigma Aldrich. Multimode plastic clad silica optical fiber with radius of 300 μm and deionized water were bought from Science Palace, Ajmer. Distilled water and acetone, which we have used for cleaning purpose were purchased from Sarthak Sales, Jaipur. Ethanol, methanol and HMTA were purchased from Alpha Easer. Magnetic stirrer with hot plate was used for continuous stirring at constant temperature which was bought from the Lab-sol company, India. Spectrometer, detector and the polychromatic light source were from Avantes Company (USA). For the preparation of samples, ethanol and methanol both were diluted with deionised water. To prepare different concentration solutions, 2 ml, 4 ml, 6 ml, 8 ml and 10 ml of ethanol were added in 20 ml of DI water respectively. In this way, 10%, 20%, 30%, 40% and 50% of ethanol solutions were prepared. Similar procedure was followed to prepare different concentration of methanol solutions.
Preparation of optical fiber probes
A multimode plastic clad silica (PCS) optical fiber of length 15 cm and core radius 300 μm was taken into consideration. Light gathering capacity or the numerical aperture of the optical fiber considered was 0.24. A cladding length of 0.5 cm was removed from both the ends of the optical fiber. For transmission of light through the fiber, faces of both ends were made circular and sharp. 1.0 cm length of cladding was removed from the central portion of the optical fiber. These fibers were cleaned with acetone and distilled water. Then, ZnO nanorods were grown on one of the optical fibers using hydrothermal technique and  bulk layer was deposited on the other fiber. This was the simplest and successful technique to deposit the
  bulk layer. Both the probes were tested with FESEM and energy dispersive X-ray spectroscopy (EDS).
Methodology
Growth of ZnO nanorods by hydrothermal technique
To grow the ZnO nanorods on the middle core part of the optical fiber, a well-established technique named "Hydrothermal technique" was used. First of all, 0.878 g of zinc acetate was dissolved in 40 ml of ethanol then stirred at 50 °C for 90 min. On the other hand, 0.160 g of NaOH was added in 40 ml of ethanol then stirred at same temperature for 60 min. With the vigorous stirring, the second solution was added dropwise into first solution to prepare the solution for the growth of seed layer of ZnO. This solution was stirred on magnetic stirrer for 120 min at 70 °C. Optical fiber was dipped into the prepared solution to grow seed layer of ZnO on fiber core. Fiber was dipped for 15 min and then annealed for 15 min at 150 °C in the furnace in our laboratory. This process was repeated three times. For growth of ZnO nanorods, another sample was prepared. 0.0881 g HMTA and 0.1878 g zinc nitrate hexahydrate were mixed in 250 ml of deionized water and stirred at 100 °C for 8 h, 12 h, 16 h and 20 h vigorously for four different probes to approach the best results. Finally, ZnO nanorods grown fibers were rinsed in deionised water at 100 °C for 1 h without stirring. Then ZnO nanorods grown optical fiber probes were sent to MNIT, Jaipur for characterisation.
Growth of TiO2 bulk layer by Hydrothermal technique
To deposit the bulk layer of  on the central core part of the optical fiber, a simple procedure was performed. 1.5 g of
  powder was dissolved into 50 ml of deionized water. The solution was stirred for 1 h continuously at room temperature on magnetic stirrer. The optical fiber was dipped in the above solution to coat a layer of the solution on uncladded portion of the optical fiber. Coated layer was annealed at 150 °C in the tube furnace for 2 h. Finally, the fiber was rinsed with distilled water and kept it idle for three days in room temperature. A transparent layer of
  was deposited on fiber core. For the confirmation of sample grown on the fiber, the probe was characterized using FESEM and EDS spectrometry.
Characterization
FESEM
Field Emission Scanning Electron Microscope (FESEM) use electrons for imaging, morphological study as the light microscopes use the visible light. It is a powerful and multipurpose tool for characterization of the materials. Figure 1a shows images of the ZnO nanorods grown on the fiber with nano size and micro size resolution respectively. These nanorods are of different dimensions and randomly oriented therefore they cannot be considered in localised mode. Diameter and length of these nanorods ranges between 200–300 nm and 2.5 μm respectively. Nanorods grown on fiber core are not hollow from inside. The image confirms solid nanorods with almost same length and diameter grown using hydrothermal technique. Similarly, Fig. 1b represents the  bulk layer deposited on the optical fiber core. Thickness of the deposited
  layer is of the order of 50 μm. It shows the non-uniformity of thickness of bulk layer deposited and clarifies that no nanostructure is fabricated on the optical fiber core.
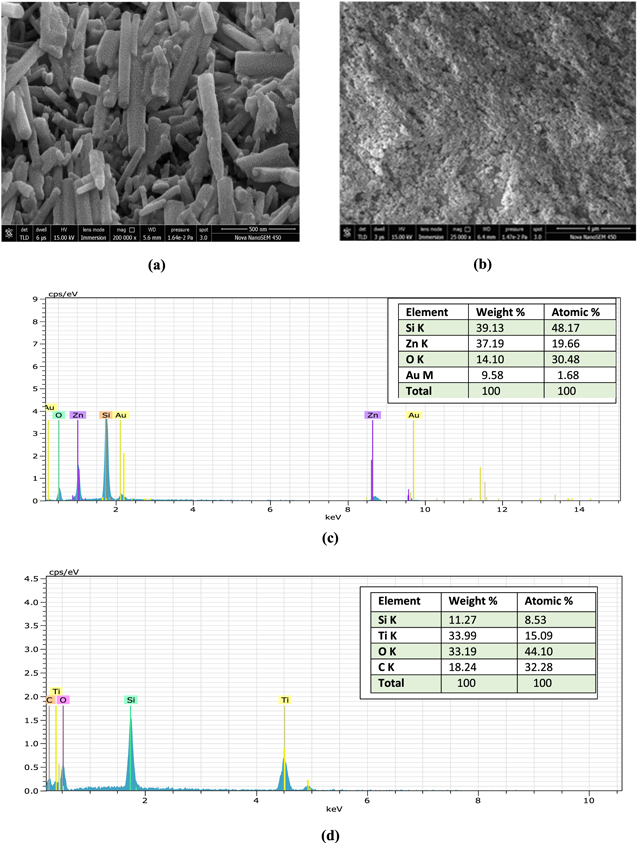
Figure 1. (a) SEM image of ZnO nanorods (b) SEM image of  bulk layer (c) EDS image of ZnO nanorods (d) EDS image of
  bulk layer.
Download figure:
Standard image High-resolution imageEDS/EDX
Energy Dispersive Spectroscopy (EDS/EDX) is a technique used for the confirmation of the elements in the sample. Figure 1c represents the EDS image for ZnO nanorods grown on optical fiber. Presence of both Zn and O can be analysed by the corresponding peaks shown in the image. Si, Zn, O and Au are corresponding to the inner K, K, K and M shells respectively. These shells correspond to the electron emission shells due to incidence of X-rays. Weight % of Si, Zn, O and Au are observed as 39.13, 37.19, 14.10 and 9.58 respectively, with total weight % of 100. Atomic % of Si, O, Zn and Au were observed as 48.17, 19.66, 30.48 and 1.68 respectively, with a total atomic % of 100. On the other hand, Fig. 1d represents the EDS image for  bulk layer grown on uncladded portion of the optical fiber. Presence of both Ti and O can be analysed by the corresponding peaks shown in the image. All the elements Si, Ti, O and C show peaks corresponding to the K-shell. Weight % of Si, Ti, O and C are observed as 11.27, 33.99, 33.19 and 18.24 respectively, with total weight % of 100. Atomic % of Si, O, Zn and Au are observed 8.53, 15.09, 44.10 and 32.28 respectively, with a total atomic % of 100.
Experimental procedure
Two probes were prepared viz. 1. ZnO nanorods grown fiber probe 2.  bulk layer deposited fiber probe. Experiment was performed for both the probes, independently. Flow cell was cleaned with distilled water before and after each use. Then, probe 1 was mounted in the flow cell with the help of rubber cork at both the ends of the flow cell as shown in the Fig. 2. Light was launched from the tungsten halogen source of light through one end of the optical fiber. Samples prepared with different concentrations of ethanol and methanol were inserted one by one in the increasing order of concentration into flow cell with the help of a syringe without disturbing the optical set-up. The light emitted from the other end of the fiber was detected by the detector interfaced with the computer where we were able to record absorption/transmission spectrum. The similar experiment was performed with probe 2 i.e., TiO2 coated fiber optic probe at room temperature.
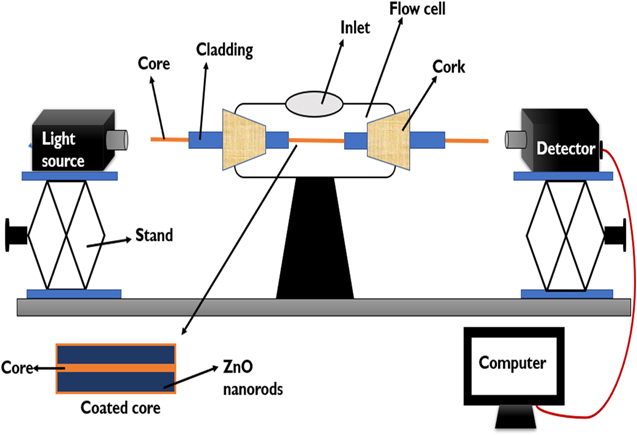
Figure 2. Pictorial representation of experimental setup of LMR based sensor.
Download figure:
Standard image High-resolution imageResults and Discussion
The Kretschmann configuration is the most popular technique for the excitation of surface plasmons.
70
Though, primarily utilized high refractive index prism set up, the core of a multimode optical fiber can also be used for the implementation of this configuration in which spectral interrogation method is preferred instead of angular interrogation method. We, in this study have used the same Kretschmann configuration realized on to the core of a multimode optical fiber to excite the lossy modes. For the excitation of lossy modes, ZnO NRs and  coated probes were prepared. Ethanol and methanol samples were prepared with different concentrations. This section contains the sensing mechanism or the interaction of ZnO and
  with alcoholic group, LMR spectra for both the probes, performance parameters along with comparative study for the evaluation of our sensor. Uniqueness of the sensor was confirmed with the selectivity of our sensor.
Sensing mechanism
The dissociation energy is the major parameter to explain the interaction of target analyte with the semiconductor metal oxide (ZnO and  ). ZnO and
  surfaces contain O¯ and
  ¯ oxygen vacancies which activates the O–H and C–O bond present in alcohols. At room temperature, dissociation of alcohol compound takes place due to low energy requirement to break their O–H and C–O bonds. As a result, alcohol compound breaks into O–H¯ ion (due to C–O bond breaking) and R–H¯ ion (due to O–H bond breaking). Further dissociation forms the aldehyde and water as shown in the equation below.
71,72
¯ oxygen vacancies which activates the O–H and C–O bond present in alcohols. At room temperature, dissociation of alcohol compound takes place due to low energy requirement to break their O–H and C–O bonds. As a result, alcohol compound breaks into O–H¯ ion (due to C–O bond breaking) and R–H¯ ion (due to O–H bond breaking). Further dissociation forms the aldehyde and water as shown in the equation below.
71,72
Since the dissociation of ethanol is easier than that of methanol, ethanol interacts easily and quickly with semiconductor metal oxides. ZnO NRs have more interaction with alcoholic group than  bulk layer because of more adsorption on nanostructure. Total number of available carriers on ZnO NRs is higher and subsequently the response magnitude for ethanol is higher than methanol and other alcohols. But
  has slightly greater interaction with methanol than ethanol and other alcohols because
  coated layer does not contain any nanostructure. Therefore,
  ¯ ions present on
  bulk layer has capability to interact with methanol due to its smaller size.
Dissociation energy and adsorption of analyte on metal oxide surface also affect the response time of the sensor. As soon as, the alcoholic group meets the O¯ species present on the metal oxide surface, dissociation of alcohol takes place within a few seconds. Sensing response of our sensor is quite high and response time is very short, nearly 4–5 s.
LMR spectra for ZnO nanorods grown fiber (probe 1)
As a consequence of lossy mode excitations, the LMR dip in the transmission spectra and LMR peak in the absorption spectra were observed owing to the coupling of the waveguide modes and the lossy modes. For resonantly exciting the lossy modes, the real part of the permittivity of the coated lossy material must be greater than zero and its magnitude should be larger than the magnitude of its own imaginary part and also must be larger than the magnitude of the permittivity of the sensing medium. 73 In the transmission spectrum more than one LMR dip can be obtained and the position of the dip can be tuned by varying the thickness of the film deposited on the fiber core and the surrounding medium refractive index. 74 The most beneficial part of this technique over surface plasmon resonance (SPR), is the involvement of transverse electric (TE) mode along with the transverse magnetic (TM) mode of light. 75 Inclusion of this TE mode increases the overlapping of modes in LMR. As a result, number of resonances increases and hence number of LMR dips also increases in the transmission spectrum. 73 To record the LMR spectra for ZnO NRs grown probe, the samples were prepared by the addition of deionised water in ethanol and methanol. Five samples for both ethanol and methanol with concentration of 10%–50% or 90–333 ppm were prepared. Here, 10% represents the 2 ml of ethanol/methanol in 20 ml of DI water. Refractive index variation with concentration of ethanol and methanol can be observed from the calibration curves as shown in Figs. 3a and 3b respectively. These curves confirm that the minimum concentration of ethanol and methanol have refractive indices 1.3543 and 1.3324 respectively. The refractive indices linearly increase with increase in the concentration of both the samples in deionized water. Refractive index ranges between 1.3543–1.3581 for ethanol and 1.3324–1.3352 for methanol concentrated samples. To achieve best possible spectrum, we have grown ZnO nanorods on to the core of four different optical fiber probes viz. P1, P2, P3 and P4 with varying stirring time period of 8 h, 12 h, 16 h and 20 h respectively using hydrothermal technique. Absorption spectra were observed for all probes at varying time period of stirring and the best results for absorption spectra were observed for 12 h stirring time of ZnO NR grown on the fiber core. The FESEM image of ZnO NRs grown for 12 h can be seen in Fig. 1a and the EDS image for composition confirmation of the same is depicted in Fig. 1c. Further experiments were performed with probe P2 (12 h stirring time). Different concentration of ethanol and methanol are used to see the effect of concentration of sensing medium on the absorption and wavelength shift.

Figure 3. Calibration curves showing refractive index variation with concentration of (a) ethanol (b) methanol.
Download figure:
Standard image High-resolution imageEthanol sensing with probe 1
Initially, the experiment was performed for 10% concentration of ethanol and absorption spectrum was recorded to observe the absorption peak and the variation of absorbance with resonance wavelength. Maximum absorbance was observed at 491.042 nm corresponding to this sample as a sensing medium. After that, all the samples were used as sensing medium and inserted in the flow cell one by one with concentration difference of 10%. Absorption spectra for varying concentration of ethanol are shown in Fig. 4a. Shift in resonance clearly indicates the sensitivity of layer deposited on fiber with change in refractive index. For 10%, 20%, 30%, 40% and 50% concentrated ethanol, resonance wavelength was observed at 491.042 nm, 543.586 nm, 577.573 nm, 588.543 nm and 606.797 nm respectively. As the concentration of ethanol is increased, the red shift in resonance wavelength can be clearly observed. For 10% change in concentration, there is approximately 52.544 nm shift in resonance wavelength. From the sensitivity curve in Fig. 4c, sensitivity of ZnO NR grown optical fiber was calculated and it was found to be 28898.46 nm RIU−1.
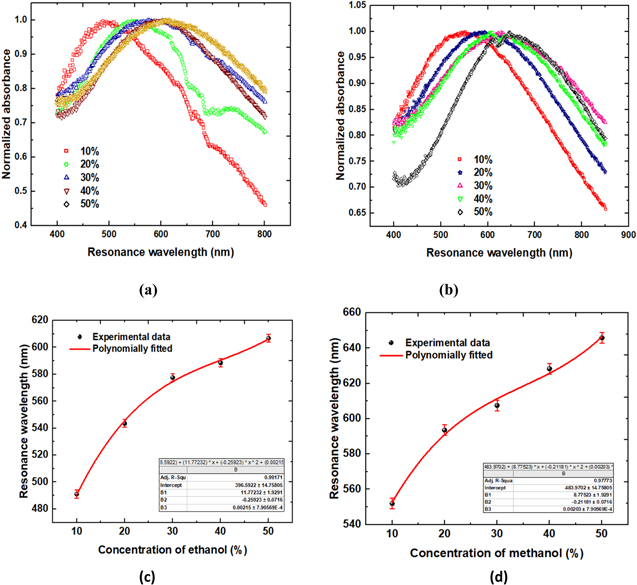
Figure 4. LMR spectra of Probe 1 for different concentration of (a) Ethanol (b) Methanol; (c) and (d) are their corresponding sensitivity curves.
Download figure:
Standard image High-resolution imageMethanol sensing with probe 1
Similar experiment was performed with different concentration of methanol. Absorption spectra for varying concentration of methanol are shown in Fig. 4b. Shift in resonance wavelength towards increasing wavelength can be observed with increase in concentration of methanol in DI water. Resonance wavelengths were observed as 551.927 nm, 593.525 nm, 607.460 nm, 628.323 nm and 645.836 nm corresponding to the 10%, 20%, 30%, 40% and 50% concentrated methanol samples respectively. For 10% change in concentration of methanol, there is nearly, 41.598 nm of maximum change in wavelength. From Fig. 4d, taking the slope of the sensitivity curve, sensitivity value of 23481.52 nm RIU−1 was observed.
To check the durability and repeatability of the sensor, the experiment was repeated five times on the same set of the optical fiber probe at different times. A minor change in resonance wavelength was observed within the approximate limit of 0.2%. These changes in resonance wavelengths might be due to the environmental effects and coupling of light in optical fiber. Error bars in Figs. 4c, 4d depicts the small variation in the resonance shift and confirms the sustainability of the fiber probe.
LMR spectra for  deposited fiber (probe 2)

 bulk layer was deposited on the optical fiber core by the hydrothermal technique as explained in previous sections. For confirmation of
  grown layer, it was characterized using Field Emission Scanning Electron Microscope (FESEM). FESEM image of
  can be seen from Fig. 1b. EDS image of
  confirming the presence of desired elements can be seen from Fig. 1d. Further, the experiment was performed with ethanol and methanol one by one, to compare the performance parameters. Different concentration of ethanol and methanol were used to see the effect of concentration of sensing medium on transmission spectra and shift in resonance wavelength. To record the LMR spectra for
  layer deposited fiber (probe 2), the samples were prepared by adding deionised water in ethanol and methanol. Five samples with concentration 10%–50% were prepared with varying refractive indices of 1.3324–1.3352 for methanol and 1.3543–1.3581 for ethanol. Increasing concentration of ethanol/methanol in DI water increases the effective refractive indices of the samples.
Ethanol Sensing with probe 2
Initially, the experiment for transmission spectra was performed with  deposited optical fiber probe and ethanol as a sensing region. Already prepared samples with varying concentration of ethanol are used as sensing region. Change in concentration of ethanol changes the refractive index of the sample. Transmission spectra were affected with the concentration of ethanol which can be observed from Fig. 5a with response time of 4 sec. Shift in resonance wavelength towards red end of the spectrum can be observed with increase in the concentration of ethanol in DI water. Resonance wavelengths were observed as 403.782 nm, 409.869 nm, 412.911 nm, 419.669 nm and 427.772 nm corresponding to 10%, 20%, 30%, 40% and 50% concentrated ethanol samples respectively. With 10% change in ethanol concentration, change in resonance wavelength of 8.103 nm can be observed and the sensitivity curve showing variation of resonance wavelength with varying concentration of ethanol is shown in Fig. 5c. From this curve, sensitivity of the sensor obtained was 6177.85 nm RIU−1.
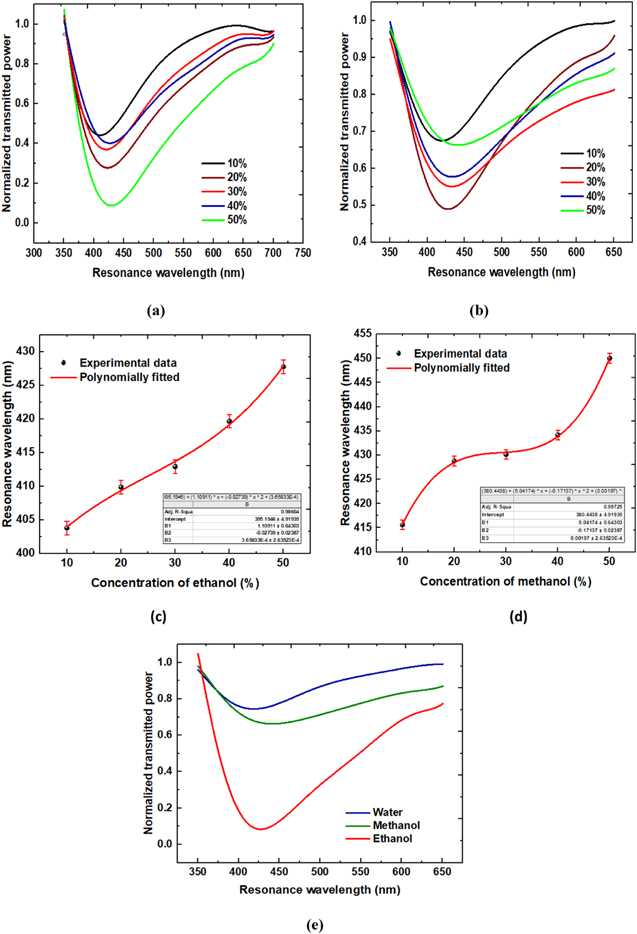
Figure 5. LMR spectra of Probe 2 for different concentration of (a) Ethanol (b) Methanol; (c) and (d) are their corresponding sensitivity curves, and (e) represents transmittance comparison for water, ethanol, and methanol.
Download figure:
Standard image High-resolution imageMethanol sensing with probe 2
For methanol as a sensing medium, similar experiment was performed to observe the transmission spectra for methanol. The prepared methanol concentrated samples were used as sensing region. Effect of change in concentration of methanol can be observed from the transmission spectra from Fig. 5b. Resonance wavelength shift towards increasing wavelength can be observed with increase in concentration of methanol in DI water. Resonance wavelengths can be observed as 415.615 nm, 428.785 nm, 430.135 nm, 434.183 nm and 450.026 nm corresponding to the 10%, 20%, 30%, 40% and 50% concentrated methanol samples respectively. Sensitivity curve is shown in Fig. 5d depicting the change in resonance wavelength of 13.17 nm with 10% change in methanol concentration. From this curve, sensitivity of the sensor was obtained to be 7962.88 nm RIU−1 with response time of 4 s. This sensor becomes more effective due to its fast response as compared with the sensor with  -Hydroxyapatite nano-composites.
76
Larger shift in resonance wavelength with concentration provides a ground for better detection capability of fiber probe. For comparison of the performance parameters of our sensor, experiment was performed with deionised water, 50% concentrated ethanol and 50% concentrated methanol as sensing region with refractive indices 1.3242, 1.3581 and 1.3352 at room temperature, respectively. Resonance wavelengths were observed at 407.164 nm,427.772 nm and 450.026 nm for DI water, ethanol and methanol respectively. This red shift in resonance wavelength can be seen from Fig. 5e, showing high response of probe 2 towards methanol as compared to ethanol and DI water. The experiment was repeated five times to check the repeatability of the optical fiber probe and the variation in resonance wavelength was observed approximately less than 0.3%. These minor changes in resonance wavelength may be due to environmental effects and coupling of light in optical fiber. Error bars in Figs. 5c and 5d depicts the small variation in resonance shift and confirms the sustainability of the fiber probe. Therefore, it reflects the high durability of the sensor which is a crucial requirement of any sensing probe.
-Hydroxyapatite nano-composites.
76
Larger shift in resonance wavelength with concentration provides a ground for better detection capability of fiber probe. For comparison of the performance parameters of our sensor, experiment was performed with deionised water, 50% concentrated ethanol and 50% concentrated methanol as sensing region with refractive indices 1.3242, 1.3581 and 1.3352 at room temperature, respectively. Resonance wavelengths were observed at 407.164 nm,427.772 nm and 450.026 nm for DI water, ethanol and methanol respectively. This red shift in resonance wavelength can be seen from Fig. 5e, showing high response of probe 2 towards methanol as compared to ethanol and DI water. The experiment was repeated five times to check the repeatability of the optical fiber probe and the variation in resonance wavelength was observed approximately less than 0.3%. These minor changes in resonance wavelength may be due to environmental effects and coupling of light in optical fiber. Error bars in Figs. 5c and 5d depicts the small variation in resonance shift and confirms the sustainability of the fiber probe. Therefore, it reflects the high durability of the sensor which is a crucial requirement of any sensing probe.
Performance evaluation
Red shift in spectrum and sensitivity
We have calculated the resonance wavelength shift and sensitivity for performance evaluation of our sensor. Here, sensitivity is the ratio of change in resonance wavelength to the change in concentration of the sample used and is defined as,
Here, 
 and
and  represents the concentrations corresponding to the two samples and since the concentration is the function of refractive index as observed from calibration curves in Figs. 3a and 3b, we have used estimated sensitivity in terms of nm/RIU (refractive index unit),
  represents the change in resonance wavelength or the wavelengths corresponding to the position of LMR dips. Here, resonance shift reached to a value of 52.544 nm for 10% change in concentration for ZnO nanorod grown fiber probe and the sensitivity value is obtained 28898.46 nm RIU−1. Similarly, for
  bulk layer deposited fiber probe, resonance shift and sensitivity were obtained 13.17 nm and 7962.88 nm RIU−1 for methanol as sensing region. The sensor response is compared with the ZnO nanowire grown gas sensor for ethanol detection. Sensitivity of ZnO nanorods grown fiber is approximately four time the sensitivity of the ZnO nanowire grown gas sensor as reported in Ref 77. For further evaluation of the quality of our LMR based sensor, the other parameters such as Quality factor (Q) and figure of Merit (FOM) have also been estimated.
Quality factor (Q)
Quality factor (Q) is the reciprocal of the central width of the LMR dip along the wavelength axis. This central width is termed as the Full Width at Half Maximum (FWHM). Numerically, higher value of Q- factor corresponds to the lower value of FWHM which gives a narrower curve. Quality factor is expressed as, 78

FWHM was measured from the LMR spectra by Gaussian fitting. Estimated value of FWHM for ZnO NRs grown probe (P1) is 168.365 nm for ethanol and 370.309 nm for methanol and for  coated probe (P2) is 115.176 nm and 100.484 nm for ethanol and methanol, respectively. Q factor is calculated by dividing the unit value by corresponding FWHM as expressed above and we got 5.939 μm−1 2.700 μm−1 for probe P1 and 8.682 μm−1 9.951 μm−1 for probe P2 corresponding to ethanol and methanol respectively.
Figure of merit
Ratio of sensitivity to FWHM is termed as figure of Merit (FOM) and is expressed as,
Figure of Merit is the combined effect of sensitivity (S) and the quality factor (Q). Higher value of FOM corresponds to the lager sensitivity of the sensor and low value of FWHM. A high FOM means sensor will be more sensitive and precise in wavelength location. For probe 1, spectral analysis and calculations give the numerical FOM values as 171.64 RIU−1 and 63.41 RIU−1 for ethanol and methanol, respectively. On the other hand, FOM values for probe 2 were calculated as 53.63 RIU−1 and 79.24 RIU−1 for ethanol and methanol, respectively.
Selectivity
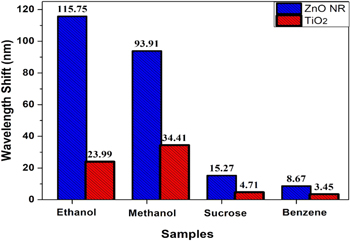
Selectivity is an important aspect of a sensor to detect a specific analyte. It defines the uniqueness of a sensor to a specific functional group or sensing analyte. To confirm the selectivity of our sensor, we have performed the same experiment with different functional groups including alcoholic, acetal, ketal and phenyl in a range of 10% to 50% of analyte diluted with DI water. Ethanol, methanol, sucrose and benzene were used to observe the transmission and absorption spectra. Here, ethanol and methanol belong to the alcoholic group, sucrose represents both acetal and ketal groups and benzene has the phenyl group. From the recorded transmission and absorption spectra, we have measured the resonance wavelength shift for all the analytes. The wavelength shift ( ) measured for ZnO nanorods are 115.75 nm, 93.91 nm, 15.27 nm and 8.67 nm for ethanol, methanol, sucrose and benzene analyte respectively. Shift in wavelength measured using
  film are 23.99 nm, 34.41 nm, 4.71 nm and 3.45 nm for the sensing analytes ethanol, methanol, sucrose and benzene respectively. Hence the sensor presents more wavelength shift and sensitivity towards the alcoholic group. It can also be observed from Fig. 6 that the resonance shift in wavelength for ZnO NRs is greater than
  coated probe due to more adsorption of analyte on NRs which results more interaction and more sensing response. Dissociation energy is an important factor which affects the adsorption of analyte on the metal oxide surface. Order of dissociation energy for all the analytes used in this study is ethanol > methanol > sucrose > benzene. Therefore, it becomes easier for the interaction of dissociated ethanol ions with O¯ ions present on the metal oxide surface. Consequently, ZnO NRs coated optical fiber sensor proves to be selective towards ethanol which confirms the selectivity of our sensing probe.
Figure 6. Selectivity study of ZnO NRs and TiO2 coated probe with different analytes.
Download figure:
Standard image High-resolution image
Comparative study of both the probes
The maximum resonance shift was observed to be 52.544 nm for ethanol with ZnO NR grown optical fiber probe which corresponds to the maximum sensitivity of 28898.46 nm RIU−1 which is more than 4.5 times the sensitivity of the  probe for ethanol sensing. Beside the resonance wavelength shift, sensitivity, FWHM, Q-factor and the combined effect of sensitivity and Q-factor were also calculated as discussed in the previous section.
  based probe for ethanol has shown minimum FWHM of 100.484 nm and maximum Q-factor of 9.951μm−1 . However, the largest value of FOM was observed to be 171.64 RIU−1 for ZnO NR grown fiber with ethanol as a sensing region, justifying the highest sensitivity and detection accuracy value. For this probe, sensitivity and Q-factor were observed to be 28898.46 nm RIU−1 and 5.939 μm−1 respectively. Since the experiment was repeated five times to check the sustainability of the probe and it has shown less than 0.2% variation in results. The comparative data of the performance of both the probes has been provided in Table I. Novelty of our sensor is confirmed by comparing our sensor with other alcoholic sensors from literature. It can be clearly observed that the sensitivity and accuracy of our sensor is commendable to other reported sources. All data for the comparative study of our sensor with others can be seen from Table II.
Table I. Comparative analysis of all performance parameters for both the probes.
| Probe | Sensing medium | Sensitivity (S) (In nm RIU−1) | FWHM (nm) | Q – factor (μm−1) | FOM (RIU−1) |
|---|---|---|---|---|---|
| ZnO NR | Ethanol | 28898.46 | 168.365 | 5.939 | 171.64 |
| Methanol | 23481.52 | 370.309 | 2.700 | 63.41 | |

| Methanol | 7962.88 | 115.176 | 9.951 | 79.24 |
| Ethanol | 6177.85 | 100.484 | 8.682 | 53.63 |
Table II. Comparative study of our sensor with other alcohol sensors.
| Probe | Sensing medium | RI range | Sensitivity (nm RIU−1) | Figure of Merit (1/RIU) | References |
|---|---|---|---|---|---|
| Fiber without grating | alcohol | 1.33–1.44 | 403 | — | 79 |
| Au/Ag nano-shell coated sensor | ethanol | 890.84 | 14.53 | 80 | |
| Fiber with grating | alcohol | 1.33–1.44 | 1246.7 | — | 79 |
| MIM waveguide based (SiO2) coated sensor | ethanol | — | 1406.25 | 156.25 | 81 |
| Au (40 nm) coated SPR sensor | alcohol | 1.34–1.46 | 5583.3 | — | 82 |
| ZnO coated LMR sensor | alcohol | 1.33–1.40 | >5000 | — | |
| D-shaped ITO coated LMR sensor | alcohol | 1.365–1.380 | 6007 | — | 83 |
| PCF based SPR sensor | alcohol | — | 6166 | — | 84 |
| TiO2 coated LMR based sensor | ethanol | 1.3543–1.3581 | 6177.85 | 53.63 | Present study |
| TiO2 coated LMR based sensor | methanol | 1.3324–1.3352 | 7962.88 | 79.24 | |
| ZnO NRs coated LMR sensor | methanol | 1.3324–1.3352 | 23481.52 | 63.41 | |
| ZnO NRs coated LMR sensor | ethanol | 1.3543–1.3581 | 28898.46 | 171.64 |
Conclusions
In the present work, lossy mode resonance based optical fiber refractive index sensor is designed for the detection of volatile organic compounds (ethanol and methanol). The two sensing probes prepared by the deposition of the ZnO nanorods and a bulk layer of the TiO2 on to the core of a multimode optical fibers were considered for the experiments. The study presented a detailed analysis for the sensing of ethanol and methanol. A comparative study about the performance parameters revealed that the maximum sensitivity was found for the probe with ZnO nanorods grown optical fibers towards ethanol detection. Sensitivity of ZnO nanorods grown fiber was found to be 28898.46 nm RIU−1 with sensitivity response of nearly four times the sensitivity of ZnO NW grown ethanol gas sensor and approximately 4.5 times greater than the sensitivity of  deposited layer for ethanol sensing. For
  deposited layer sensitivity reached to a value of 7962.88 nm RIU−1 with a response time of less than 5 s. Another important parameter was the estimation of Figure of Merit that also comes out to be a maximum for ZnO nanorod grown optical fiber probe for ethanol sensing. FOM was observed to be 171.64 RIU−1 with the variation in resonance wavelength of 0.2% while repeating the experiments. However, the value of the Quality Factor was found to be highest for TiO2 coated optical fiber probe towards methanol sensing. Thus, we have successfully fabricated an easy, quick responding, durable, and low-cost optical fiber sensing probe for the detection of the ethanol and methanol concentration. This sensor is highly selective towards ethanol sensing. The study may find plentiful consideration for the detection of ethanol/methanol content in various food items, beverages, sanitizers and other solvents.
Acknowledgments
Ms. Kavita gratefully acknowledges the Department of Science and Technology (DST-SERB), INDIA for financial support through the Project Fellowship (Reference no. - CRG/2020/005593).