
Abstract
The kinetics of passive oxide film formation, its thickening, and composition on Ni-22Cr and Ni-22Cr-6Mo wt% alloys were investigated at selected anodic potentials. Experiments were performed in acidic and alkaline sulfate environments using a number of characterization techniques including a combination of potentiodynamic polarization, on-line atomic emission spectro-electrochemistry (AESEC), in situ potentiostatic passive film growth, along with in situ neutron reflectometry (NR) and ex situ X-ray photoelectron spectroscopy (XPS). The roles of solution pH and Mo on the passivation behavior were discussed in terms of thermodynamic and kinetic factors governing passivation. The pH was found to have an impact on the relative chemical compositions of passive film of the Ni-22Cr alloy but not noticeably for the Ni-22Cr-6Mo alloy. Ni-rich films formed early during the passivation process while Cr(III) enrichment was observed at longer times, albeit less extensively than observed previously in Cl− solutions. The fraction of Cr(III) cations also increased with alloying of Mo at low and high pH demonstrating a strong effect of Mo on Cr(III) content during aqueous passivation in Ni based superalloys, however, a larger effect is seen in Cl−. This is a noteworthy finding as Mo is usually assumed to mainly influence pit and crevice stabilization.
Export citation and abstract BibTeX RIS
The passivation of pure Ni metal 1–12 and Ni-based alloys 3,9,12–20 in sulfate environments has been studied to understand the formation, dissolution mechanisms, and stability of the passive film. For Ni, its passive film is often described by a bilayer structure with an inner crystalline NiO and an outer porous, and hydrated Ni(OH)2 layer. This structure is observed on alloys exposed to sulfuric and perchloric acidic as well as to alkaline solutions with limiting thicknesses measured on the order of a few nanometers. 1
Electrochemical passivation can be greatly improved with the addition of alloying elements. At lower Cr concentrations, the passive film formed is predominantly NiO-based as there is not sufficient Cr present for formation of a continuous film. 16,21,22 Previous work reported that the addition of a few at% of Cr to Ni altered the preferred oxidation mechanism from one dominated by outward cation diffusion to one where oxygen ingress was substantial. 23 Above approximately 13 at% Cr, Ni-Cr alloys preferentially form a continuous Cr-rich oxide/hydroxide film because these particular compounds are more thermodynamically stable and also kinetically favored than Ni-rich ones. 15,22 In the case of high temperature oxidation at 700 °C, it was observed that NiO formed first, followed by subsurface Cr2O3 enrichment at the inner interface and eventually the emergence of large NiCr2O4 islands. 17 While in general, the addition of Cr to Ni introduces excellent resistance to localized corrosion 24–29 and increases passive film stability in halide-free acidic solutions, 18,30 transpassive dissolution is possible for Cr-rich passive films in highly oxidizing environments. 27,29 This can be remediated through alloying with other elements. 31–33
One of the most common alloying elements used in the Ni-Cr system for corrosion resistance improvement is Mo. Addition of Mo to pure Ni metal provides a less significant effect on the passive film structure compared to the effect of Cr. Ni alloyed with 13 wt% Mo and passivated in 1 N Na2SO4 solution acidified to pH 2.8 has been studied using scanning transmission electron microscopy. The electron diffraction results indicated only the presence of crystalline NiO particles with approximately 3 nm diameters. Mo, however, was found to be either finely dispersed in the NiO film or present as an amorphous species that did not appear in the electron diffraction patterns. 9 While the addition of Cr alone improves the passivity of Ni-based alloys, Mo addition has been argued to impair passivity as evidenced by increases in the passive current density and the film growth rate. 24 A defective, amorphous (Mo+4, Mo+6)xOy layer was produced which increases the defect concentrations in NiO, accounting for the observed increase in passive current density. 25
Alloying with both Cr and Mo, however, usually results in a highly synergistic relationship with regard to the passivity as seen in both the Fe and Ni-based systems. 34 This effect is especially notable in chloride containing environments but corrosion resistance is similarly improved in acidic sulfate environments. For instance, Alloy 59 (Ni-22.5Cr-15.5Mo-0.9Fe, wt%) has been studied in sulfuric acid solutions using potentiodynamic polarization, electrochemical impedance spectroscopy (EIS), X-ray photoelectron spectroscopy (XPS), and sputter depth profiling via Auger spectroscopy. 26 The results indicated a substantial increase in the passivity of the material when alloyed with high concentrations of Cr and Mo compared to pure Ni and its binary alloys. Passive films formed in air exhibited (Cr, Ni)-oxide films whereas those formed in solutions were hydrated (Cr, Ni)-hydroxides. 26 Additionally, the air-oxidized films were thicker by approximately a nanometer in sulfuric acid, likely due to the competition between film growth and dissolution absent in the case of the air-formed film's oxide. The passive film was not found to exhibit a bi-layered or multi-layered structure. Instead, XPS and Auger depth profiling suggested that the aforementioned oxide species were distributed throughout the film with no preferential segregation to the inner or outer interfaces. 26 Additional work has been reported in aggressive sulfuric acid solutions (0.5 M) deaerated by Ar and characterization by Time-of-Flight Secondary Ion Mass Spectrometry (ToF-SIMS) as well as XPS. 30,35 Passivation was achieved in this study at potentials of 0.25 V/SCE and 0.3 V/SCE, for Ni-20Cr and Ni-20Cr-10Mo (wt%) respectively (by stepping the potential from OCP to the selected potential, and maintaining the polarization for 4 h. The film was found to be enriched in Cr(III) for both alloys, and Mo oxide was suggested to form between the outer/inner layers interface for the Mo-containing alloy. 30,35 At higher potentials, soluble Mo species were formed. Cycles of spontaneous passivation after cathodic reduction supported the continuous accumulation of Mo cations in passive films. In another recent study, the potentiodynamic passivation of Ni-22%Cr and Ni-22%Cr-6%Mo, wt%, alloys were investigated using elemental resolved polarization curves in aerated and deaerated sulfuric acid solutions. 18 Alloying with Mo improved the long-term passivity by favoring the formation of Cr2O3 in the film and resulted in significant Mo accumulation within the oxide. The most recent studies of the passive film growth on the Ni-Cr alloy systems with alloying elements in deaerated chloride containing solutions were conducted for long periods of exposure up to 105 s 31,36 and 106 s. 37 These studies showed that Ni(II) formed early, Cr(III) enrichment occurred with time changing the overall oxide film composition. Cr oxides and hydroxides were formed at short passivation times while spinels were detected at longer times. 31,36,37 Mo was incorporated into these oxides. Therefore, while the studies in Cl− solutions provide information on the influence of Mo on Cr(III) enrichment in the passive film with time, the more recent ones in sulfate solutions do not contain such information. However, it is essential to know how the minor alloying elements influence on the growth and the composition of the passive film in sulfate solutions, at both acidic and alkaline pH.
The objective of this study is to revisit the effects of Mo at fixed solution pH on the kinetics of passive film growth on Ni-based alloys over second to 10 ks times frames without the effect of Cl− on film dissolution. In operando film growth is analyzed by atomic emission spectroelectrochemistry (AESEC), and single frequency-electrochemical impedance spectroscopy (SF-EIS) measurements in both acidic and alkaline sulfate environments. The film composition, thickness, and their variations with passivation time during a potentiostatic film growth are characterized using ex situ XPS and in situ neutron reflectometry (NR). The role of pH on passive film growth is investigated through direct comparison of a mildly acidic (pH 4) solution with a mildly alkaline one (pH 10). The results provide more insights into the role of Mo during acidic and alkaline passive film growth and its synergistic relationship when alloyed with Cr.
Materials and Experiments
The samples used in this study were polycrystalline, solid solution Ni-based alloys with the compositions of Ni-22Cr and Ni-22Cr-6Mo A that model common Cr and Mo concentrations in commercial Ni-based superalloys. The materials were arc-melted, cast, rolled, recrystallized at 1100 °C for 40 min, quenched, and sectioned. 27 Prior to each experiment, the samples were wet-polished up to 1200 grit using SiC paper, ultrasonically cleaned in ethanol, and rinsed with deionized water (Milli-Q, resistivity of 18.2 MΩ-cm) before being placed into a three-electrode electrochemical flat cell. A Pt mesh, saturated calomel electrode (SCE) and the sample were used as the counter, reference and the working electrode, respectively. A Gamry Reference 600 potentiostat was used for performing all electrochemical experiments.
The solutions used in film passivation experiments were 0.1 M Na2SO4 adjusted to pH 4 by 1.0 M H2SO4, and 0.1 M Na2SO4 pH 10 adjusted by 1.0 M NaOH. All solutions were prepared using reagent grade chemicals and deionized water. During electrochemical experiments, the solutions were deaerated using N2 gas.
An initial cathodic reduction step at −1.3 VSCE for 10 min was conducted before all electrochemical experiments in order to minimize the effect of air-formed oxides on the alloy surface.
28
Following the cathodic reduction step, potentiodynamic polarization was performed from −1.3 VSCE to +0.8 VSCE with 1 mV/s scan rate, while in situ monitoring the imaginary impedance  at 1 Hz using a 20 mVrms AC signal. Similarly, after a cathodic reduction step, potentiostatic passive film growth experiments were performed using the single frequency EIS method at +0.2 VSCE where the current density and
  was monitored at 1 Hz for 10 ks. The oxide thickness
  was estimated at the end of measurement. A full frequency EIS spectrum was acquired from 100 kHz to 1 mHz to obtain the constant phase element exponent
  via a circuit model fit
28
and correlate
via a circuit model fit
28
and correlate  to an oxide thickness,
  29
From these results, the oxidation current density,
29
From these results, the oxidation current density,  may be calculated as:


Here  is the applied frequency,
  is the dielectric constant (30 assumed
38
),
is the dielectric constant (30 assumed
38
),  is the vacuum permittivity of free space,
  is the exposed sample area,
  is the boundary interfacial resistivity (450
  assumed
39
),
assumed
39
),  is the total anodic current density,
  is the total measured dissolution current density,
  is the cation valency,
  is the oxide or hydroxide density,
  is Faraday's constant,
  is the oxide molar mass, and
  is the oxidation efficiency.
29
is the oxidation efficiency.
29
The AESEC was used to monitor the elemental dissolution rates during passivation. The detailed principles of this technique are available elsewhere.
40,41
The specimen was vertically placed in a specially designed electrochemical flow cell. The electrolyte containing the cations released from the specimen was transferred to an inductively coupled plasma atomic emission spectrometer (ICP-AES, Ultima ExpertTM Horiba Jobin Yvon) for chemical analysis. The elemental concentration of the electrolyte as a function of time,  was calculated from the atomic emission intensity with a characteristic wavelength of the element M,
  as:
as:

where  is the background signal and
  is the sensitivity factor of M obtained separately from a standard ICP calibration method. The elemental current density (
 ), equivalent to the elemental dissolution rates, may be calculated as:

where  is the oxidation state,
  is the flow rate of the electrolyte (2.8 mL min−1),
  is Faraday constant,
  is the exposed surface area (0.7 cm
2
), and
is the exposed surface area (0.7 cm
2
), and  is the atomic mass of M.
Electrochemical control was achieved using a Gamry Reference 600 potentiostat. After the cathodic reduction at −1.3 VSCE for 10 min,
28,42
a potentiostatic step to +0.2 VSCE, was implemented to grow the passive film for up to 10,000 s. This potential is relevant to the long-term open circuit potential of Ni-Cr-Mo alloys in seawater and other natural environments where passivation occurs sometimes punctuated by crevice corrosion.
43
Under this applied potential and at pH 4 and 10, the thermodynamically predominant oxidation states of the metals are Ni+2, Cr+3, and Mo+6.
44
The element-specific current density contributions for the cation species, Mz+, released into solution and not retained in the oxide as determined by the AESEC measurements,  were summed to obtain the total current density for dissolution and cation ejection reactions:

The  value was then subtracted from the total electrochemically measured DC current density,
  to estimate the total oxide formation current density,
  (t) in Eq. 8:

In order to evaluate the contribution of a specific element M towards passivation rather than direct cation ejection or film dissolution, the expected element-specific dissolution current density based on congruent alloy dissolution
B
where  is well above the oxidation potential for each element,
  was estimated:

and the oxidation current density contribution of element M may be obtained as follows:

The atomic composition of M cations at the surface,  , may be calculated as:


where  is Avogadro's number and
  is the integrated oxidation charge for element M. It is recognized that this estimated cation composition does not account for potential layering nor say anything about the type of oxide or hydroxide formed just the moles oxidized but not dissolved and solubilized per unit area. Equation 12 gives the cation fraction again with no consideration of phase separation or solute capture (in other words the structure and layering cannot be determined). This was used to estimate the oxidized cation fraction that joined the surface layer over 10 ks as a comparison to XPS and NR.
The changes in film composition and thickness were characterized by ex situ XPS using a PHI VersaProbe III instrument. The spectra were obtained for native air oxides, and periodically after 10 min of cathodic reduction at −1.3 VSCE and potentiostatic passive film growth of 100 s, 1000 s and 10 ks at +0.2 VSCE. This technique has been well-established for the analysis of the identity, concentration, and thicknesses of individual compounds present in surface thin films, 45 especially for the case of Ni-based alloys. 28,46,47 All XPS spectra were obtained using a monochromatic Al-Kα photon source (E = 1,486.7 eV). The take-off angles between the sample and detector were adjusted to 45 and 90°, whereas that between the detector and the X-ray source was fixed at 54.7° (Fig. 1). The instrument was calibrated to the 4f7/2 binding energy (E = 84 eV) of a metallic Au reference measured at the same time. Survey spectra were recorded on all samples using a pass energy of 200 eV, followed by high resolution analysis of the Ni 2p, Cr 3p, Mo 3d, and O 1s regions using a pass energy of 20 eV. No charge neutralization system was employed. The samples were in the electrical contact with the stage.
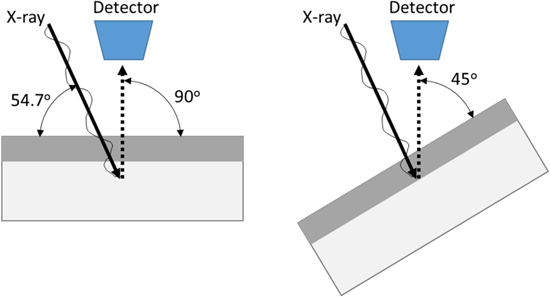
Figure 1. Schematic of the angle-resolved XPS set-up and effect of sample tilting on the probe depth.
Download figure:
Standard image High-resolution imageCommercial CasaXPS software was used to perform Shirley background corrections and spectra fitting based on the peaks and parameters for the expected oxide species. 48–50 The charge correction was done by shifting the C 1s peak binding energy to 284.8 eV and then shifting all other peaks to the same number of eV. The concentrations of Ni(II), Cr(III), and Mo(IV, VI) species in the passive films were computed by fitting the spectra to their observed metallic and oxide/hydroxide peaks as established in previous literature 46,47,50–53 and correcting these integrated peak areas to atomic sensitivity factors for Ni, Cr, and Mo (4.044, 2.427, and 3.321 for this detector and source configuration, respectively) 50 (Appendix A).
The calculation of the XPS enrichment/depletion factor f(Cr(III )) in passive film was accomplished using equation: 54

where An+, Bm+, Cl+—the cationic fraction of the element in the oxide; A, B, C—the atomic fraction of the element in the alloy.
The molecular identity and the layering of passive films were also analyzed using in situ neutron reflectometry. The experiments were conducted at the D3 beamline at the National Research Universal (NRU) reactor (Chalk River, Ontario, Canada), shown schematically in Fig. B·1 (Appendix B). This setup allowed NR measurements to be performed concurrently with electrochemical experiments. C Thin film samples for NR experiments were prepared by a sputter deposition system (Plasmionique Inc., Quebec, Canada) to produce approximate 25 nm thick Ni-Cr and Ni-Cr-Mo alloys on 100 mm diameter ×6 mm thick polished Si (111) wafers. XPS analysis following thin film preparation yielded bulk compositions of Ni-20Cr and Ni-20Cr-10Mo. The thin film samples for NR experiments were stored in a vacuum desiccator and, prior to experiments, were cleaned with methanol and dried in air.
For NR measurements, a conventional three-electrode electrochemical cell with a Pt thin foil counter electrode and a KCl saturated Ag/AgCl reference electrode (VAg/AgCl = +47 mVSCE) was used. The electrochemical experiments were conducted under a Solartron 1287 A potentiostat control. Similar to all mentioned above electrochemical experiments, the cathodic potential of −1.3 VSCE was applied for 5 min. D Then potentiostatic polarization was performed from −0.8 VSCE to +0.2 VSCE (potentials were adjusted to SCE values for better data comparability) with 0.2 V steps every 6 h (Fig. B·2, Appendix B). The NR measurements started 1 h after the applied potential was switched to the set value and each measurement took approximately 90 min to complete. At least two measurements were performed in each potential step to ensure a steady-state was achieved before moving to the next applied potential. The D3 neutron beam characteristics could be found in Ref. 29 and Appendix B.
For analysis of the passive film composition and thickness, the SLD profiles of the unoxidized alloys deposited on Si and of H2O exposed to vacuum were simulated using GenX software with the interfacial roughness and SLD values of each layer obtained from experiments (Fig. 2). 55 The SLD for the simulated base metals and electrolytes were then subtracted from the experimental SLD profiles, as indicated in Fig. 2, in order to extract the SLD versus depth data for only the passive films.
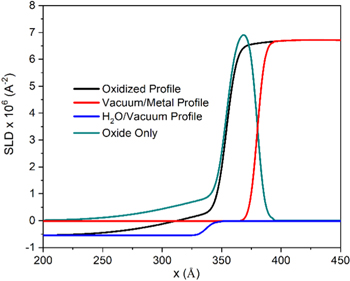
Figure 2. Sample profile subtraction for passivated Ni-22Cr-6Mo, wt%, where SLD profiles for the unoxidized metal and the H2O were subtracted from the experimental data in order to isolate the profile for the passive film. The same analysis method was applied to all alloys and environments.
Download figure:
Standard image High-resolution imageResults
Electrochemistry of Ni-Alloys in aqueous sulfate environments
The E-log(i) and  vs E curves of Ni-22Cr and Ni-22Cr-6Mo in the acidic and alkaline solutions of interest were established in Fig. 3a & 3b, respectively. The oxide thickness was estimated from –Z'' using Eq. 1 and the results were plotted in the same graph as the impedance data (Fig. 3b). In both solutions, the alloys exhibited a large passive range extending from the corrosion potential to above +0.5 VSCE (Fig. 3a). In addition, Ni-22Cr-6Mo exhibited a lower passive current density than Ni-22Cr, indicating the beneficial effect of Mo addition to the Ni-Cr system (Fig. 3a).
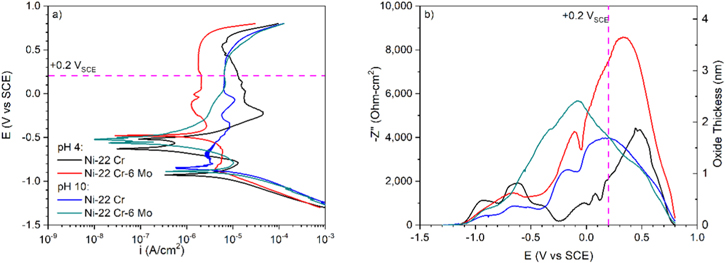
Figure 3. (a) DC current and (b) AC impedance variations during upward potentiodynamic polarization of Ni-22Cr and Ni-22Cr-6Mo alloys in deaerated 0.1 M Na2SO4 at pH 4 and 10 with the potential used in this study (+0.2 VSCE) indicated by the dotted lines.
Download figure:
Standard image High-resolution imageThe difference in the passivity of Ni-22Cr and Ni-22Cr-6Mo near +0.2 VSCE is evident in the alkaline environment. At small anodic overpotentials (e.g., from −0.5 to 0 VSCE), a lower passive current density and a thicker oxide (or passive layer with different dielectric constant) according to the impedance results were observed for the Mo-containing alloy which could be attributed to the effect of the minor solute on inhibiting dissolution. In addition, the films formed on the same alloy during cyclic polarization were, in general, thicker in the acidic environment compared to those formed in the alkaline. The characteristic thickening and thinning rates of each alloy (i.e., the slopes of the oxide thickness vs E curves in Fig. 3b) were similar and were consistent with passivity theory positing a few nm/V, with notably Ni-Cr film dissolution initiating at a lower potential and occurring more rapidly than Ni-Cr-Mo alloy in the acidic environment. This is due to a known electrochemical stabilization benefit of Mo. 44
SF-EIS application to Ni-alloys over a range of pH levels
Potentiostatic passivation of Ni-22Cr and Ni-22Cr-6Mo at +0.2 VSCE in acidic (pH 4) and alkaline (pH 10) 0.1 M Na2SO4 was monitored using SF-EIS to investigate formation of the passive film. The  as a function of time in the acidic environment for Ni-22Cr and Ni-22Cr-6Mo obtained from the SF-EIS measurements at 1 Hz and +0.2 VSCE are shown in Fig. 4. The
  and the corresponding
  calculated from Eq. 1, (assuming a Cr rich passive film) were slightly smaller in alloys containing Mo. This can be seen in both the early stage of passive film formation (i.e., a few seconds after the potentiostatic experiment) and at longer periods during film formation (i.e., above 1000 s). In addition, the passive film thickness did not change much after approximately 1000 s for both Mo-free and Mo-containing alloys.
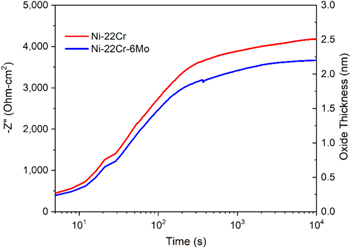
Figure 4. Measured increase in  at 1 Hz during passivation of various Ni-based alloys at +0.2 VSCE in deaerated 0.1 M Na2SO4 pH 4 solution for 10 ks with a subsequent full EIS spectrum obtained and fitted in order to compare
  for each method at the end of the passivation.
Download figure:
Standard image High-resolution imageThe passivation-time behavior of Ni-22Cr and Ni-22Cr-6Mo in 0.1 M Na2SO4 solution adjusted to various pH values are shown in Figs. 6a and 6b, respectively. It can be seen that at all pH levels,  is below
  and η is less than 1 even in the most alkaline solution. At early passivation times such as 10–100 s efficiency increases with increasing pH. At later times such as 1ks–10ks, efficiency approaches very low levels as the passive current density maintains a nearly constant passive film thickness. The film thickness estimated by SF-EIS on both Ni-22Cr and Ni-22Cr-6Mo increases with pH (Fig. 5), likely due to the chemical stability of certain hydroxides or oxides. This was confirmed through the analysis of the oxidation rate,
  and the efficiency,
  (Eq. 4), for the alloys, shown in Fig. 6. As predicted by the faster passivation with increasing pH values,
  generally increases for each alloy.
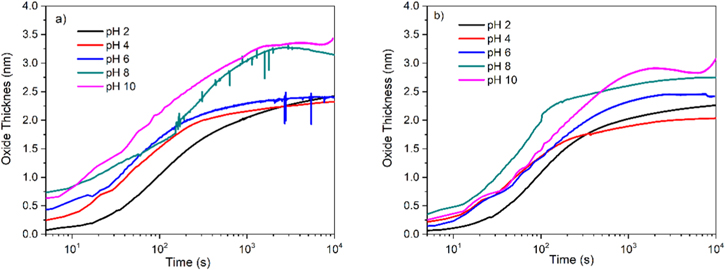
Figure 5. Influence of electrolyte pH on the measured film thickness,  computed using Eq. 1 for (a) Ni-22Cr alloy (b) Ni-22Cr-6Mo in 0.1 M Na2SO4 solutions.
Download figure:
Standard image High-resolution image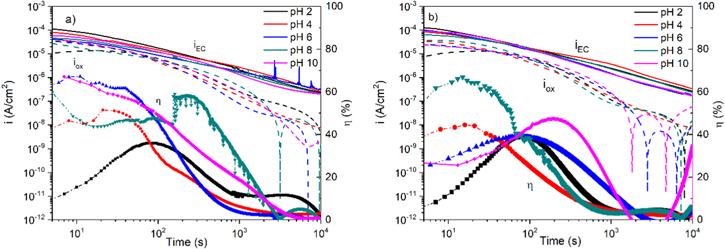
Figure 6. Influence of electrolyte pH on the measured  and
and  computed using the SF-EIS results in Fig. 5 and Eq. 3, and the current efficiency,
  computed using Eq. 4 for the (a) Ni-22Cr alloy and, (b) Ni-22Cr-6Mo in 0.1 M Na2SO4 solutions.
Download figure:
Standard image High-resolution imageAESEC passivation of Nickel alloys in 0.1 M Na2SO4
The equivalent elemental dissolution current densities,  determined using Eq. 6 for the Ni-22Cr (Fig. 7a) and Ni-22Cr-6Mo (Fig. 7b) alloys in 0.1 M Na2SO4 pH 4 solution are shown by solid lines with a comparison to the partial electrochemical current densities for each element (
 ) calculated using Eq. 9. The differences between the
  versus time for each element (

 ) and the corresponding
  indicates the elemental contributions to the non-dissolved oxidized species accumulating on the surface in some manner. It should be noted that the
  for the AESEC figures was convoluted, taking into account the residence time distribution of the elemental dissolution signal in the flow cell.
41
for the AESEC figures was convoluted, taking into account the residence time distribution of the elemental dissolution signal in the flow cell.
41
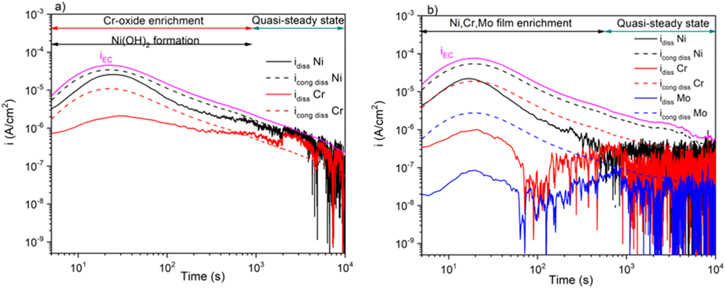
Figure 7. Experimentally determined iEC and experimental idiss AESEC current densities for cation emission versus total element specific current densities for congruent dissolution from the alloys (a) Ni-22Cr and, (b) Ni-22Cr-6Mo held at +0.2 VSCE in 0.1 M Na2SO4 pH 4 solution.
Download figure:
Standard image High-resolution imageThe low values of  compared to
  indicates that there is a higher efficiency but less than 1 for oxide growth versus dissolution at an early stage of passivation. However, a significant role of cation ejection during passivation in acidic sulfate solutions is evident. In the case of the Ni-22Cr, the AESEC data shown in Fig. 7a indicates that there were non-dissolved oxidized Ni-species present for the initial stage of passivation, followed by later enrichment of a passive, Cr-rich oxide film.
The Ni-22Cr-6Mo shown in Fig. 7b has similar initial Ni(II) formation accumulating on the surface over the first 10 s followed by Ni(II) mostly dissolving when oxidized during subsequent Cr-enrichment of the passive film. A gradual decrease in  nearly matches
  whereas
  and
and  remain below
  at all times indicating that these cations accumulate on the surface or join the passive film. At longer times, a quasi-limiting thickness is attained (Fig. 5b) and dissolution observed using AESEC corresponds to the ejection of alloying elements from the passive film and oxidation of elements to maintain the thickness in Fig. 5. The gradual enrichment of Cr(III) accumulated continually occurs after 100 s, as shown in Fig. 8a, presumably as a result of favorable oxide film formation with Mo-alloying.
56
The
at all times indicating that these cations accumulate on the surface or join the passive film. At longer times, a quasi-limiting thickness is attained (Fig. 5b) and dissolution observed using AESEC corresponds to the ejection of alloying elements from the passive film and oxidation of elements to maintain the thickness in Fig. 5. The gradual enrichment of Cr(III) accumulated continually occurs after 100 s, as shown in Fig. 8a, presumably as a result of favorable oxide film formation with Mo-alloying.
56
The  indicates that, after early Mo release during Cr-film enrichment, it likely becomes incorporated in the oxide at small concentrations.
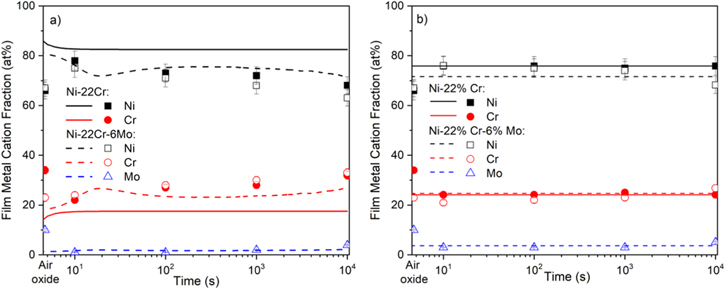
Figure 8. Relative accumulation of metal cations in the passive films during growth at +0.2 VSCE according to AESEC (lines) and XPS (symbols) measurements on the Ni-22Cr and Ni-22Cr-6Mo alloys in 0.1 M Na2SO4 (a) pH 4 and, (b) pH 10 solution. Native (air-oxide) composition according to XPS marked at 0 time (symbols).
Download figure:
Standard image High-resolution imageElemental dissolution rates of Ni-22Cr and Ni-22Cr-6Mo in the alkaline media, 0.1 M Na2SO4 pH 10, were under the detection limits, therefore, are not presented herein. The cation concentrations at the surface given in Fig. 8b were approximated using the base metal alloying content.
Neutron reflectometry of Nickel alloys
The reflectivity curves for the two alloys in 0.1 M Na2SO4 pH 4 are given in Fig. 9. These data sets were fitted using an algorithm developed by Parratt 55,57–59 to produce neutron SLD profiles versus depth (Fig. 10). The reflectivity curves were best fitted using a passive film model comprised of a single-phase inner oxide layer and an outer hydroxide layer rather than a model comprised of separated inner oxide layers of NiO and Cr2O3 and an outer hydroxide layer. At low depths, the SLDs were close to −0.5 × 10⁻⁶ Å2 corresponding to the electrolyte layer. At greater depths (i.e., between approximately 50 and 110 Å in Fig. 10a and between approximately 150 and 270 Å in Fig. 10b), the SLDs gradually increased to ca. 1.5 × 10⁻⁶ Å2, corresponding to the outer hydrated oxide layer. A steep increase in the SLD at higher depths (i.e., between approximately 110 and 130 Å in Fig. 10a and between approximately 270 and 290 Å in Fig. 10b) corresponded to the interface between the outer hydrated oxide layer and the inner oxide layer of the passive film. The humps in the SLD profiles at the depth between ca. 130 and 160 Å in Fig. 10a and between ca. 290 and 320 Å in Fig. 10b corresponded to the inner oxide layers. Finally, the SLD of the base metal alloys was reached at greater depths. Annotated in Fig. 10 as horizontal lines are the theoretical SLD of several stoichiometric oxides and hydroxides. SLD values of the inner oxide layers formed on the two alloys suggest the layers were rich in Ni-oxide species.
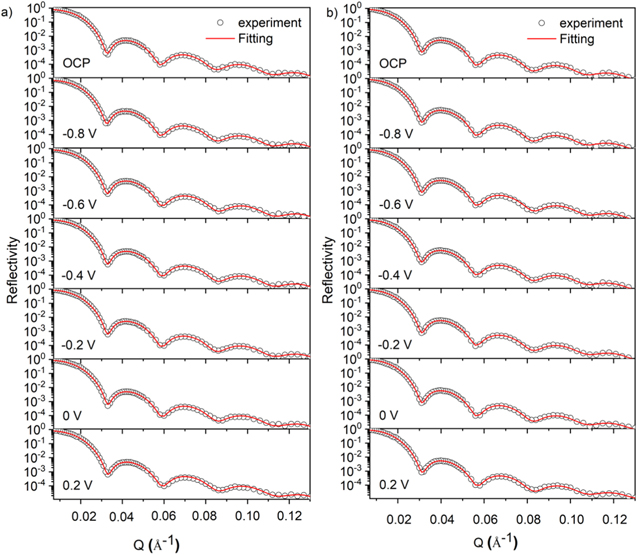
Figure 9. Measured reflectivity curves for (a) Ni-20Cr and (b) Ni-20Cr-10Mo films oxidized in 0.1 M Na2SO4 pH 4 solution at various potential steps (Fig. B·2, Appendix B). The NR measurements started 1 h after the applied potential was switched to the set value and each measurement took approximately 90 min to complete.
Download figure:
Standard image High-resolution image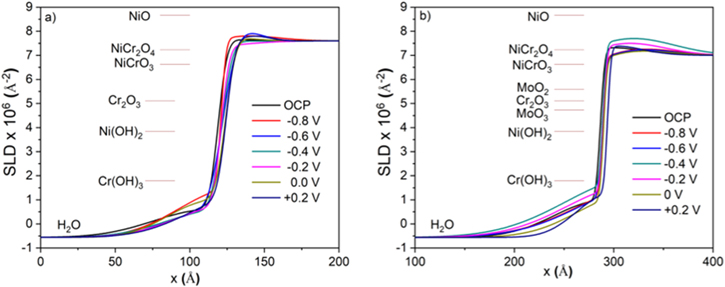
Figure 10. Full SLD profiles for (a) the Ni-20Cr film and (b) the Ni-20Cr-10Mo film oxidized in 0.1 M Na2SO4 pH 4 solution at various potential steps. The theoretical SLD values for differrent materials are indicated by horizontal lines.
Download figure:
Standard image High-resolution imageSimulated SLD profiles for a non-equilibrium film with varying Cr(III) content were produced using GenX software (Fig. 11). One notable change in the SLD profiles of a non-equilibrium film with varying Cr(III) is that when the content of Cr(III) increased, the SLD of the oxide layer gradually decreased until it reached the theoretical SLD value of Cr2O3.
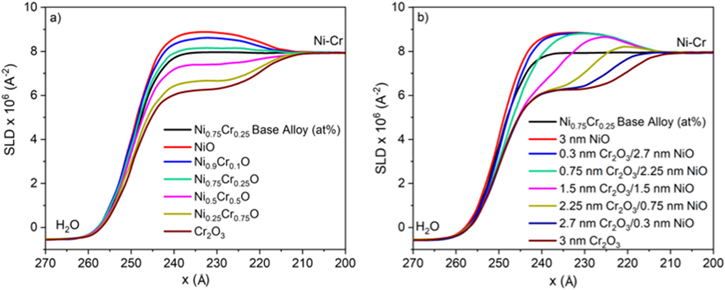
Figure 11. Simulated SLD profiles for (a) a non-stoichiometric oxide, Ni1-xCrxO, containing varying % Cr3+ and (b) a bilayer oxide comprised of Cr2O3 and NiO with varying thickness of each conformal layer. An interfacial roughness of 5 Å was used to replicate the experimental parameter.
Download figure:
Standard image High-resolution imageThe SLD profiles of the stand-alone passive film after subtraction of the metal and electrolyte SLDs (Fig. 2) are shown in Fig. 12. These results additionally allow for the estimation of  and the Cr(III) cation fraction using the width and height of the profile, respectively. Films with an SLD closer to the theoretical SLD value of NiO (8.7 × 10⁻⁶ A−2) will have a lower % Cr(III) compared to those near the theoretical SLD value of Cr2O3 (5.1 × 10⁻⁶ A−2), and the non-stoichiometric film possessing an SLD in-between the two. The SLDs of the inner layer on both alloys were close to the theoretical SLD value of NiO suggesting the oxide films on both alloys were rich in Ni, similar to previous work.
46,60,61
For Ni-Cr-Mo, the SLD of the outer layer decreased with increased potential suggesting a selective dissolution of Ni(II) in favor of Cr-enrichment as the potential increased (Fig. 12b). The small SLD of the outer layer is attributed to a highly hydrated nature of the layer. The thickness of the outer layer was estimated to be several nm from the SLD profiles.
and the Cr(III) cation fraction using the width and height of the profile, respectively. Films with an SLD closer to the theoretical SLD value of NiO (8.7 × 10⁻⁶ A−2) will have a lower % Cr(III) compared to those near the theoretical SLD value of Cr2O3 (5.1 × 10⁻⁶ A−2), and the non-stoichiometric film possessing an SLD in-between the two. The SLDs of the inner layer on both alloys were close to the theoretical SLD value of NiO suggesting the oxide films on both alloys were rich in Ni, similar to previous work.
46,60,61
For Ni-Cr-Mo, the SLD of the outer layer decreased with increased potential suggesting a selective dissolution of Ni(II) in favor of Cr-enrichment as the potential increased (Fig. 12b). The small SLD of the outer layer is attributed to a highly hydrated nature of the layer. The thickness of the outer layer was estimated to be several nm from the SLD profiles.
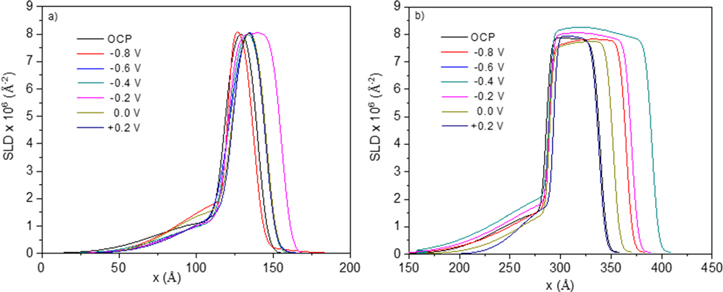
Figure 12. Analysis of the NR profiles given in Fig. 10 where a sample profile for the base metal exposed to water on a SiO2 substrate was simulated and subtracted from the overall reflectometry curve in order to obtain that of just the passive film for (a) Ni-20Cr alloy and (b) Ni-20Cr-10Mo alloy in 0.1 M Na2SO4 pH 4 where the peak SLD correlates to the Cr3+ cation fraction and the approximate  is indicated by the peak width.
Download figure:
Standard image High-resolution imageAnalysis of the Cr(III) metal cation fraction and the passive film thickness was conducted using the profile width and peak SLD values in Fig. 12. The Ni-Cr-Mo alloy exhibited greater Cr-enrichment in the oxide film than the Ni-Cr alloy across all potentials (Fig. 13a). The film thickness was also consistently greater on the Ni-Cr-Mo alloy at every potential investigated in this work, suggesting the effect of Mo on promoting Cr-oxidation and passive film formation (Fig. 13b). A small variation was observed in both Cr(III) cation fraction and film thickness with applied potentials due to relatively slow dissolution kinetics in sulfate environments. The slight thinning of the film at higher potentials can be attributed to the transpassive oxide dissolution. At higher potentials (e.g. +550 mVSCE), 44 fast transpassive dissolution of Cr(III) would result in more noticeable thinning. 62
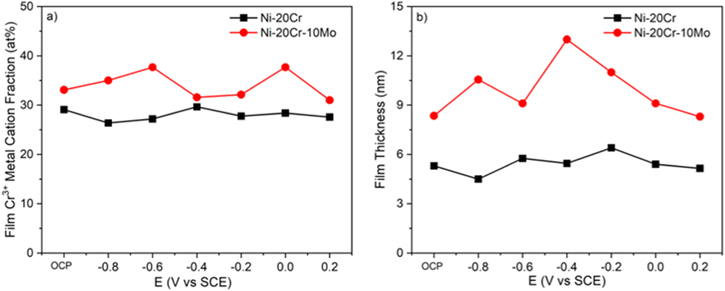
Figure 13. (a) Metal cation fraction and (b) passive film thickness computed from the peak SLD in Fig. 12 for Ni-20Cr and Ni-20Cr-10Mo alloys in 0.1 M Na2SO4 pH 4 oxidized at varying potentials.
Download figure:
Standard image High-resolution imageXPS analysis of Nickel alloys
An example of the deconvolution of the XPS spectra for the Ni-Cr-Mo alloy passivated at +0.2 VSCE for 10 ks after 600 s of cathodic potential step at −1.3 VSCE in 0.1 M Na2SO4 pH 4 is shown in Fig. 14. The fitted peaks are consistent with the presence of Ni(OH)2, NiO, Cr(OH)3, Cr2O3, MoO2, and MoO3 in the passive film but contain no structural verification. It should be noted that previous literature has additionally identified spinel compounds (e.g. NiCr2O4), 16,17,63–65 but it was found that during peak fitting these phases only constituted an insignificant fraction (≤1%) of the total integrated area and as such were excluded from the current analysis.
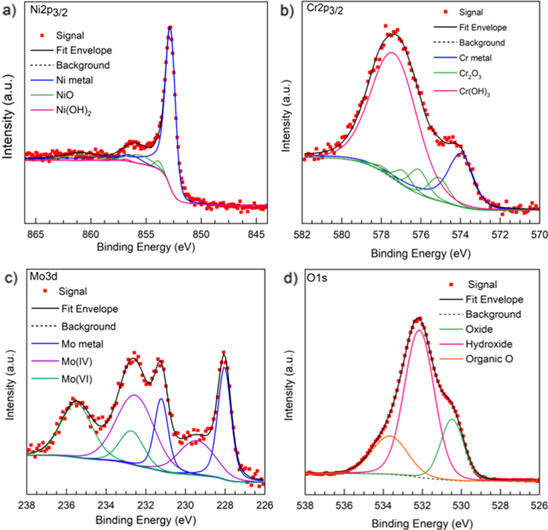
Figure 14. Focused, deconvoluted XPS spectra for (a) Ni 2p3/2, (b) Cr 3p3/2, (c) Mo 3d, and (d) O 1s bands collected on Ni-22Cr-6Mo alloy passivated at +0.2 VSCE for 10,000 s in 0.1 M Na2SO4 pH 4 where the solid black and magenta lines indicate the Shirley background and overall fit to the spectra, respectively.
Download figure:
Standard image High-resolution imageThe comparison of the XPS fitted data of native-formed oxide film (Figs. 8a & 8b) and that of the film after cathodic reduction (Table I) showed a slightly higher cation fraction of Cr(III) for Ni-22Cr alloy after cathodic reduction step at −1.3VSCE in both acidic and alkali solutions but only for Ni-22Cr-6Mo in acidic solution. At the same time, the composition of the film on Ni-22Cr-6Mo after cathodic reduction in 0.1 Na2SO4 pH10 solution remained close to the native-formed oxide. It must be mentioned that the thickness of the film after the cathodic reduction step was much lower (according to a comparison of the intensity of metal and metal oxides/hydroxides peaks), and the composition of the film underlying alloy layer remained almost unchanged.
Table I. Cation and elemental fractions calculated from XPS spectral fitting analysis after 10 min of cathodic reduction at −1.3VSCE in 0.1 M Na2SO4 pH 4 and pH 10 deaerated with N2(g).
| Passive Film Cation Fraction | Metal/Film Interface Elemental Fraction | ||||||
|---|---|---|---|---|---|---|---|
| Alloy | Take-off Angle | Ni | Cr | Mo | Ni | Cr | Mo |
| Ni-22Cr (pH 4) | 90° | 0.44 | 0.56 | — | 0.78 | 0.22 | — |
| 45° | 0.29 | 0.71 | — | 0.81 | 0.19 | — | |
| Ni-22Cr (pH 10) | 90° | 0.15 | 0.85 | — | 0.78 | 0.22 | — |
| 45° | 0.11 | 0.89 | — | 0.86 | 0.14 | — | |
| Ni-22Cr-6Mo (pH 4) | 90° | 0.32 | 0.57 | 0.11 | 0.78 | 0.17 | 0.04 |
| 45° | 0.28 | 0.58 | 0.14 | 0.81 | 0.14 | 0.05 | |
| Ni-22Cr-6Mo (pH 10) | 90° | 0.73 | 0.18 | 0.09 | 0.61 | 0.25 | 0.14 |
| 45° | 0.69 | 0.15 | 0.15 | 0.58 | 0.21 | 0.21 | |
The XPS enrichment/depletion factor fCr(III) in passive film calculated by Eq. 13 54 (Fig. 15) shows that at pH 4, the Ni-22Cr alloy (Fig. C·1, Appendix C) exhibited lower enrichment of Cr-species in its passive film than Ni-22Cr-6Mo (Fig. C·2, Appendix C), resulting in a higher cation fraction of Cr(III) in the passive film when Mo was alloyed. Upon comparing passivation in an acidic environment (Fig. 8a) to that in an alkaline one (Fig. 8b), there is an apparent difference in the composition between the films. The fraction of Ni(II) measured using XPS peak fitting and AESEC analysis remained steady for the Ni-22Cr alloy, whereas there was slight but statistically significant enrichment of Cr(III) within the film on the Ni-22Cr-6Mo alloy throughout the passivation time (Fig. 15). For all times, there was additionally a slightly greater fraction of Cr(III) within the film on the Ni-22Cr-6Mo alloy than on the Ni-22Cr alloy after 10 ks (Fig. 8a). Finally, the calculated cation fractions of Mo(IV, VI) in the passive film were lower for pH 10 (Fig. 8b) than that observed at pH 4 (Fig. 8a) probably due to MoO3 2− stability at high pH.
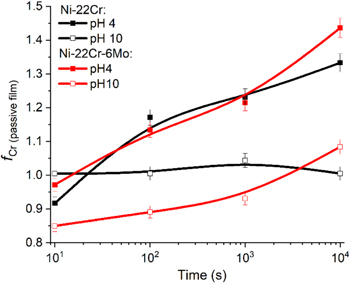
Figure 15. Passive film Cr(III) enrichment/depletion factor fCr(III) calculated by using Eq. 13 for Ni-22Cr and Ni-22Cr-6Mo alloys following 10 s to 10 ks of potentiostatic passivation at +0.2 VSCE in 0.1 M Na2SO4 at pH 4 and 10.
Download figure:
Standard image High-resolution imageIn the alkaline environment, the measured Ni 2p3/2 spectra were predominantly representative of Ni metal and Ni(OH)2 (Figs. C·3 and C·4, Appendix C) and Cr metal and Cr(OH)3 for the Cr 2p3/2 spectra. Spectral fitting suggests there were some oxide species present at all times in the acidic environment because of their favorable thermodynamics over the hydroxides, whereas both were stable at pH 10 and the oxides became hydrated Ni(OH)2 and Cr(OH)3. Less Mo(IV, VI) was found within the alkaline passive film. This can be attributed to its poor thermodynamic stability in high pH environments. 44
Following the 10 ks passivation, the films formed on Ni-22Cr and Ni-22Cr-6Mo in both the acidic and alkaline environments were analyzed using XPS take-off angles of 45o and 90o (Figs. C·5 to C·7, Appendix C). The spectra are normalized to the intensity of the metal peaks to demonstrate the increased sensitivity for the surface chemistry and suggest any preferential outer environment of certain oxide species. The spectra were representative of the same oxide/hydroxide species. Spectral fitting, however, demonstrated that there was slight enrichment of Ni(II) species and depletion of Cr(III) at the film/solution interface following passivation in the alkaline environment for both Ni-Cr and Ni-Cr-Mo (Fig. 16). Notably, Mo(IV, VI) was not affected by the preferential Ni(II) surface enrichment and appears to be present at a similar concentration throughout the film. No clear surface enrichment was observed for the films formed in the acidic environment.
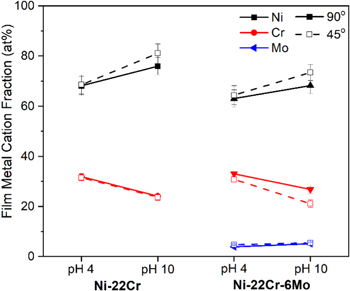
Figure 16. Film cation fraction according to angle-resolved XPS measurements at 90° and 45° on Ni-22Cr and Ni-22Cr-6Mo alloys surfaces following 10 ks of potentiostatic passivation at +0.2 VSCE in 0.1 M Na2SO4 at pH 4 and 10.
Download figure:
Standard image High-resolution imageDiscussion
Passive film formation is rapid during single step passivation and efficiency is lower than 100% for Ni(II), Cr(III), and Mo(IV, IV). For every nanometer of oxide formed, 0.5 nm of metal is dissolved at 100% efficiency. The results strongly suggest an early pre-dominance by hydroxylated NiO or Ni(OH)2, possibly containing solute captured Cr(III), followed by very slow enrichment of Cr(III) within the passive film during single step passivation. Evidence of solute capture are suggested by initial oxide cation fractions very close to the alloy element fractions and the slow dissolution rate of Ni in sulfate at pH 10 relative to Cl− where Cr(III) enrichment is faster. During single step passivation a pseudo steady state is reached after 1000 s 66 and in pH 10 sulfate remains rich in Ni(II). Alloying with Mo supports some later and gradual preferential oxidation of Cr to Cr(III) within the film, resulting in Ni(II) cation ejection. Mo, when included as a minor alloying element, becomes incorporated into the passive film in low concentrations.
The results performed in the mildly acidic (pH 4) and mildly alkaline (pH 10) sulfate environments demonstrate different characteristics of the passive films formed in each environment. Less preferential Ni-dissolution and subsequent Cr-enrichment were observed in the alkaline environment, probably due to the increased thermodynamic stability of these oxides and the lower solubility of NiSO4 compared to NiCl2 67 (Fig. 8b). This is supported by Pourbaix's predictions, 44 where NiO and Ni(OH)2 are thermodynamically stable at pH > 5. The lack of significant Cr enrichment in the passive films compared to previous studies performed in chloride environments 29 demonstrates the influence of preferential dissolution of Ni(II) on the evolution of passive film compositions. Passivation in a sulfate environment still supports the previous theory 66 that Mo alloying promotes the oxidation of Cr. The calculated enrichment of Mo(IV, VI) cations was lower for pH 10 (Fig. 8b) than that observed at pH 4 (Fig. 8a), due to its thermodynamic instability and likely selective dissolution in the alkaline environment as MoO4 2−.
The passive films formed in the acidic sulfate environment exhibited a distribution of cations that suggests nonequilibrium solute capture (Fig. 11a), where a mixed oxide is speculated (e.g. Ni1-xCrxOy) was observed instead of the traditionally expected, phase-distinct, bilayer structure (e.g. NiO/Cr2O3/Ni-Cr(-Mo)) (Fig. 11b). For the film formed in the alkaline sulfate environment, however, angle-resolved XPS exhibited some outer enrichment of predominantly NiO (Fig. 16). The difference was, albeit, slight but the stability of Ni(II) in the film resulted in some segregation to the film/solution interface. Interestingly, Mo was not observed to vary in composition throughout the film formed in either environment as a result of solute capture. Due to the low concentration within the alloy, no segregation was observed.
The passive dissolution rate and breakdown of the oxide are often attributed to rates regulated by the features and properties of the passive film. It is clear that the passive films of Ni-Cr-X alloys take on many forms depending on exposure conditions and aging (exposure time). Caution is therefore warranted in assigning corrosion properties under any one condition given that a large variety of passive film characteristics can be realized depending on anion (i.e., Cl− vs sulfate), pH, growth rate, potential, and exposure aging time. These variables need to be precisely controlled in order to produce a particular passive film which then governs the electrochemical corrosion properties likely in many cases to rely heavily on the exact make-up of the oxide.
Conclusions
The passivation and dissolution of Ni-22Cr and Ni-22Cr-6Mo (wt%) alloys, were investigated in both acidic and alkaline Na2SO4 environments under potentiostatic conditions using in operando AESEC and SF-EIS, in situ NR, and ex situ XPS. The combination of the AESEC technique may enable the determination of  distinctly from
  with high temporal resolution. It was determined that Ni-rich films form early during the passivation process, indicating the substantial influence of kinetic factors. At longer times, Cr(III) enrichment was observed when thermodynamics predominated the film composition. Surface films formed during potentiostatic polarization at +0.2 VSCE were consistent with non-stoichiometric solid solution rock salt and corundum oxide structures, likely containing solute captured Ni(II), Cr(III), and Mo(IV, VI) cations. No substantial layering was observed during oxide formation, with the films instead being Ni-rich at the film/electrolyte and Cr-rich at the metal/film interfaces. Oxides were first formed, with compositions governed by non-equilibrium solute capture. The electrochemical stability of Cr(III) cations also increased with alloying of Mo in the base metal, noted by the respective dissolution currents being measured below the detection limit for the Ni-22Cr-6Mo alloy in each environment. Surface films formed during anodic polarization in the alkaline environment were found to be enriched in Ni(II) cations because of the increased stability of NiO and Ni(OH)2.
Acknowledgments
The authors acknowledge support from ONR MURI "Understanding Atomic Scale Structure in Four Dimensions to Design and Control Corrosion Resistant Alloys" on Grant # N00014–16–1–2280 under the directorship of Dr. Dave Shifler. PHI VersaProbe III system was supported by NSF Award 162601, MRI Acquisition of an X-ray Photoelectron Spectrometer for Chemical Mapping of Evolving Surfaces: A Regional Instrument for Research and Teaching. The AESEC experiments conducted by JH were supported by the Agence Nationale de Recherche, grant # ANR-20-CE08–0031 (TAPAS 2020).
Appendix A: The Cation Concentrations Calculation from the XPS Data
where  is the cation fraction of a generic cation, M+,
  is the integrated XPS peak area for a generic metal oxide/hydroxide, and
  is the atomic sensitivity factor for different metals given above.
Appendix B: Neutron Reflectometry Experiment
D3 uses a collimated neutron beam with a wavelength of 2.37 Å. The neutron beam traveled through the Si wafer before it reached the metal/electrolyte interface at a small grazing angle. The intensity of the specular reflected beam was recorded at different grazing angles and the reflectivity curves were plotted as a function of the scattering vector,  whose magnitude is related to the incident beam angle,
  and the neutron wavelength,
  by the following expression:
57,58
by the following expression:
57,58

The thickness, roughness, and scattering length density (SLD) profile of the layers in the thin film sample were obtained by fitting the reflectivity curves to a thin film model using a least square fit algorithm which includes a recursion algorithm developed by Parratt. 55,57–59

Figure B·1. Schematic of the in situ neutron reflectometry (NR) experiment at the D3 beamline in the NRU reactor. Collimated neutron beam with a wavelength of 2.37 Å was used for neutron measurements. A custom three-electrode electrochemical cell was employed for chemical and potential condition control.
Download figure:
Standard image High-resolution image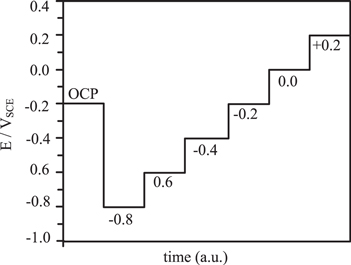
Figure B·2. A schematic of the potential steps during in situ neutron reflectometry experiments.
Download figure:
Standard image High-resolution imageAppendix C: XPS Analysis of the Films Formed on Ni-22Cr and Ni-22Cr-6Mo in Both the Acidic and Alkaline Environments During the Passivation
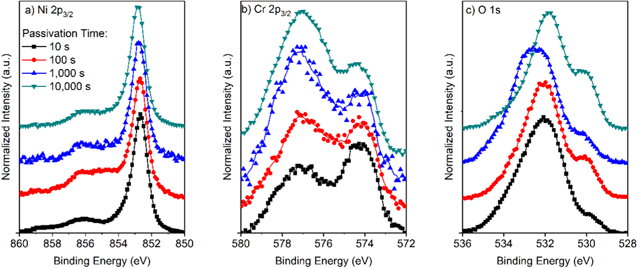
Figure C·1. (a) Ni 2p3/2, (b) Cr 2p3/2, and (c) O 1s peaks normalized to the metal peaks for Ni-22Cr alloy passivated at +0.2 VSCE for various times up to 10 ks in 0.1 M Na2SO4 pH 4.
Download figure:
Standard image High-resolution image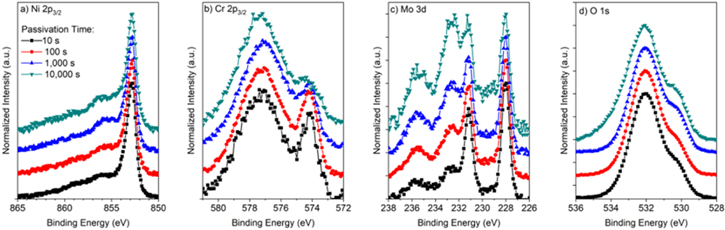
Figure C·2. (a) Ni 2p3/2, (b) Cr 2p3/2, (c) Mo 3d, and (d) O 1s peaks normalized to the metal peaks for Ni-22Cr-6Mo alloy passivated at +0.2 VSCE for various times up to 10 ks in 0.1 M Na2SO4 pH 4.
Download figure:
Standard image High-resolution image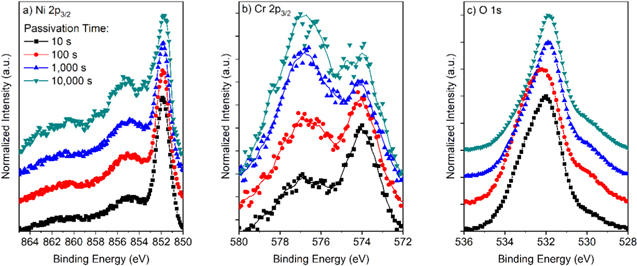
Figure C·3. (a) Ni 2p3/2, (b) Cr 2p3/2, and (c) O 1s peaks normalized to the metal peaks for Ni-22Cr alloy passivated at +0.2 VSCE for various times up to 10 ks in 0.1 M Na2SO4 pH 10.
Download figure:
Standard image High-resolution image
Figure C·4. (a) Ni 2p3/2, (b) Cr 2p3/2, (c) Mo 3d, and (d) O 1s peaks normalized to the metal peaks for Ni-22Cr-6Mo alloy passivated at +0.2 VSCE for various times up to 10 ks in 0.1 M Na2SO4 pH 10.
Download figure:
Standard image High-resolution image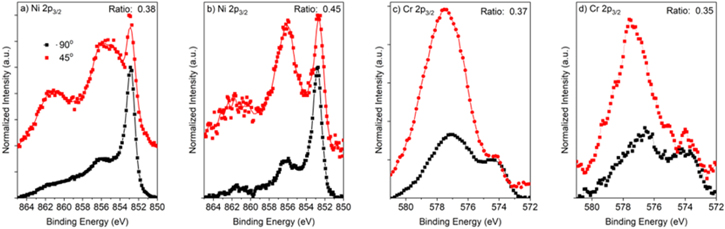
Figure C·5. (a), (b) Ni 2p3/2 and (c), (d) Cr 2p3/2 angle-resolved XPS spectras which were normalized to the metal peaks for Ni-22Cr alloy passivated at +0.2 VSCE for various times up to 10 ks in 0.1 M Na2SO4 (a), (c) pH 4 and (b), (d) pH 10. The ratio of the oxide areas for each angle measurement is included for reference.
Download figure:
Standard image High-resolution image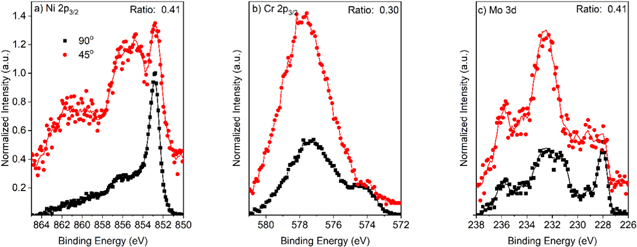
Figure C·6. (a) Ni 2p3/2, (b) Cr 2p3/2, and (c) Mo 3d angle-resolved XPS spectras which were normalized to the metal peaks for Ni-22Cr-6Mo alloy passivated at +0.2 VSCE for various times up to 10 ks in 0.1 M Na2SO4 pH 4. The ratio of the oxide areas for each angle measurement is included for reference.
Download figure:
Standard image High-resolution image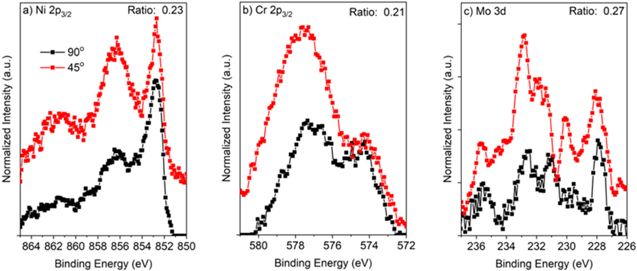
Figure C·7. (a) Ni 2p3/2, (b) Cr 2p3/2, and (c) Mo 3d angle-resolved XPS spectras which were normalized to the metal peaks for Ni-22Cr-6Mo alloy passivated at +0.2 VSCE for various times up to 10 ks in 0.1 M Na2SO4 pH 10. The ratio of the oxide areas for each angle measurement is included for reference.
Download figure:
Standard image High-resolution imageFootnotes
- A
In this study, Ni-22Cr (wt%) and Ni-22Cr-6Mo (wt%) alloys are denoted as Ni-22Cr and Ni-22Cr-6Mo, respectively. For XPS and AESEC calculations the alloys compositions in at. % - Ni-24Cr and Ni-24.7Cr-3.7Mo - were used.
- B
Congruent dissolution is a starting point and a reasonable assumption when there are large thermodynamic driving forces for dissolution of each alloying element, i.e.

- C
Because of the unfortunate shutdown of the D3 neutron beam line, in situ passivation measurements were only performed for 0.1 M Na2SO4 acidified to pH 4.
- D
A shorter time was used for the cathodic reduction for the NR experiments in order to minimize possible damage to the thin film sample caused by H2 evolution.
