Abstract
This study evaluated the influence of the membrane type on the performance of bioelectromethanogenesis reactors. The functional activities and taxonomic composition of bioelectrochemical systems (BES) with Nafion 117 or Ultrex CMI-7000 membranes were assessed. Functional activity was measured as methane production and current consumption rates throughout operation. Microbial biomass and phylogenetic diversity were characterized at strategic intervals related to the membrane type used. The Nafion-BES reactor showed the best performance in terms of current consumption and methane production in the early operational period and a strong selection for fermentative bacteria. However, the Nafion-BES was not able to sustain this activity over the course of 7 subpassages since methanogenic species were ultimately selected against and did not appear in the community composition for the last two subpassages. In contrast, the Ultrex-BES had a lower pH concentration gradient and lower overall current consumption activity; however, the methane production activity from the Ultrex-BES was equivalent or better than the Nafion-BES reactor and was sustained throughout the seven subpassages. The membrane type appeared to be responsible not only for differences in the electrochemical operation of the BESs but it also influenced microbial taxonomic composition and dynamics.
Export citation and abstract BibTeX RIS

This is an open access article distributed under the terms of the Creative Commons Attribution 4.0 License (CC BY, http://creativecommons.org/licenses/by/4.0/), which permits unrestricted reuse of the work in any medium, provided the original work is properly cited.
Microbial electrosynthesis has been reported as a promising new technology for the synthesis of value-added products from CO2 or other organic feedstocks.1 Microbial electrosynthesis relies on microbial population, applied potential, system design and the specific environmental conditions to define the final products and overall efficiencies of these systems.2–7 As a new technology, most of the studies in the area of microbial electrosynthesis address: i) proving the concept of using bacteria as electrocatalysts for targeted synthesis of a given product8,9 and ii) understanding the mechanisms of "communication" between microbial species and electrode surfaces used as electron donors.10–13 Pure microbial cultures have primarily been used as they can provide selectivity of the synthesis process.2,12–15 However, from a practical standpoint, natural mixed microbial communities may provide a better strategy for bioelectrochemical systems exploring microbial electrosynthesis because they are more robust relative to operational changes, have greater metabolic capacity for converting/synthesizing complex substrates and are less susceptible to contamination during long-term operation. Therefore, investigations into optimal microbial communities along with interspecies interactions have also gained attention in recent years.16–25
The practical application of microbial electrosynthesis still requires a deeper understanding of how reactor design may fundamentally impact performance and overall microbial composition. In most cases, a microbial electrosynthesis reactor is a dual-chambered system composed of an anode electrode, a cathode electrode and a separator.2,3,6,8,9,12,26 The electrodes are usually carbon materials such as graphite rods,2,6,12 carbon cloth,3,18 graphite granules,5,8 etc. Various types of membranes have also been used to separate the reagents and products of the half-reactions occurring at the anode and cathode and prevent crossover of reactive species, which could significantly reduce the efficiency of system operation and complicate the removal of the desired product;27 however, the presence of a membrane in the design of a given electrochemical system contributes to increased ohmic losses and concentration overpotentials, and thus decreases the overall system performance.28 When the ion transport across the membrane is not optimal, the system will suffer from decreased ion diffusion between electrodes, ohmic losses, and pH imbalance, which in turn causes concentration losses. Thus, an optimized membrane selection may significantly decrease the overpotential of the system operation and increase its efficiency as has been shown by Ki et al.28
It has also been shown that the membrane type selected for bioelectrochemical systems can influence microbial community dynamics.29 Sotres et al. demonstrated that the archaeal community at the anode of a microbial fuel cell (MFC) system was specifically impacted by the type of membrane used; however, the taxonomic composition of bacteria was not altered by membrane selection. A MFC equipped with Nafion N-117 membrane was enriched over time with Methanosarcina sp., which were not found in high relative abundance for MFCs with Ultrex CMI-7000 and Ultrex AMI-7000 membranes. A report by Suzuki et al., also demonstrated a difference in anodic microbial composition in MFC reactors that were operated with N-117 membranes or SPEEK membranes. The authors found that MFCs with N-117 featured Geobacter spp. on the anodes (representing 6.3% of the biofilm community), while the anodes from the MFCs with a SPEEK membrane had Acetobacterium malicum HAAP-1 as the most relatively abundant strain in the biofilm.30 To our knowledge, these two reports are the only studies to address the effect of the membrane type on the microbial population and dynamics in MFC anodes; and no reports have addressed the correlations between mesophilic microbial community composition and performance as a function of membrane type at the cathode.
Proton exchange membranes (PEM) such as Nafion are one of the most popular and commonly used membranes in both chemical and biological fuel cells.31–33 Nafion membrane is composed of a fluorocarbon backbone substituted with sulfonate groups (-SO32−). The fluorocarbon backbone provides the hydrophobic properties of the membrane, while the sulfonate groups introduce local hydrophilicity. The thickness of Nafion membranes varies from 127 to 254μm and conductivity of 0.1 S/cm. Nafion membrane is selective toward protons but its also permeable for other cations where the selectivity of the membrane increase with growth of cation radius.34 The main purpose of utilizing a membrane in microbial electrosynthesis is to prevent oxygen and substrate crossover from the cathodic compartment into the anodic compartment while still promoting ionic exchange. In general, bioelectrochemical systems (BES) are inherently limited by low proton concentration gradients due to the near-neutral pH required for bacteria, enzymes or other biological entities used. Therefore, the permeability of the membrane to protons is one of the main factors determining the performance of BESs.28,35
Due to the high concentration of ions in microbial fuel cell electrolytes, the primary carriers of positive charge across the membrane are more general cations and not specifically protons, thus cation-exchange membranes (CEM) have also been explored in the design of biological fuel cells.31,32 A common CEM for MFC applications is Ultrex CMI-7000, which is a thicker membrane that can provide structural robustness and is cheaper than Nafion. Ultrex CMI-7000 is a polypropylene CEM with 450μm in thickness, 25–30 Ω/cm2 membrane resistance and over 97% selectivity.36 The Ultrex membrane can be used in applications within a pH range 1–10.
Higher cation concentrations in the electrolyte will result in lower proton transfer across the membrane due to the competing penetration of the protons and cations. On the other hand, it has been observed that the membrane resistance increases dramatically at low ionic concentrations.35 When four types of ion membranes were explored in bioelectrochemical systems inoculated with wastewater, it was observed that the electrochemical performance of the BESs does not correlate with their ability to transport protons and/or hydroxyl ions.37 Among the tested membranes, Nafion 117 was shown as the best performing membrane under the conditions tested in terms of high current densities resulting from the lowest potential losses. However, the same membrane did not possess the highest transport numbers for protons and/or hydroxyl ions, and the Nafion 117 could not prevent pH changes in the anodic and cathodic compartments. The latter is a result of the predominant transport of cation species rather than protons across the membrane.37
To characterize how microbial communities and reactor performance may change as a function of membrane selection, we assessed the functional activities of microbial electromethanogenesis and taxonomic composition in BES reactors with Nafion 117 or Ultrex CMI-7000 membranes. Functional activity was measured as methane production and current consumption rates throughout operation. Microbial biomass and phylogenetic diversity were characterized at strategic intervals related to the membrane type used.
Experimental
BES construction and operation
The bioelectrochemical systems used in this study were two-chamber glass reactors with a liquid volume of 110 ml in each chamber (Adams & Chittenden, Berkeley CA, P/N 948113) as described previously.18 The reactors had a carbon based working electrode (WE) composed of three carbon cloth pieces stacked together (Zoltek, PW06, St. Louis, MO) with an apparent surface area of 28.5 cm2 (total surface area of 85.5 cm2). The counter electrode (CE) was constructed out of titanium mesh (Cleveland Wire cloth, 40×40 mesh, Cleveland, OH) and had an apparent surface area of 66 cm2. Working and counter electrodes were treated in acetone overnight to remove surface impurities, rinsed with distilled water, and dried in an oven at 100°C before use. Nafion 117, a proton-exchange membrane (DuPont, Wilmington DE) and Ultrex CMI-7000, a cation-exchange membrane (Membranes International Inc.) with surface area of 30 cm2 were used between the working and counter electrode chambers. 1M Ag/AgCl reference electrode (CH Instruments, Chicago IL, P/N CHI111) was embedded in the working electrode chamber at distance of 0.25 cm away from the working electrode stack.
A modified Methanosarcina barkeri Medium (Medium 120) was used as the electrolyte in the working and counter electrode chambers (pH 6.8). The media was prepared without the addition of Na2S and Resazurin. Namely 1L of medium contained 0.348g of K2HPO4, 0.227g of KH2PO4, 0.500g of NH4Cl, 2.250g of NaCl, 0.002g of FeSO4 × 7H2O, 0.850g of NaHCO3, 0.300g of cysteine, vitamins and trace elements. The BES reactors were operated in batch mode under anoxic conditions and CO2 was used as the sole carbon source at the working electrode. CO2 was diffused into the media and headspace in both reactor chambers by degassing the media in each chamber with sterile filtered mixed gas of 80%N2:20%CO2 (v/v).
The working electrode chamber was inoculated with BES-associated microbial communities and the counter electrode chamber was kept abiotic. Both BES reactors were operated with the working electrodes constantly poised at a potential of −700 mV vs Ag/AgCl (−500 mV vs SHE) using a potentiostat (Gamry Instruments MultEchem, Warminster, PA). Corresponding current consumption at the working electrode was monitored every 10 min using the Gamry Instruments Framework software.
BES inoculation and subpassage procedures
The first BES reactor was inoculated with electrode samples from a previous BES enrichment that had been operating for 12 months.18 The original BES enrichment started from 5 g of rice paddy soil (Koda Farms, South Dos Palos, CA) mixed with the modified 120 media under anoxic conditions, degassed with N2:CO2 and operated potentiostatically at −700 mV vs Ag/AgCl.18 The single graphite felt electrode from this BES was divided in half and each half was placed into two new sterile BES reactors of the type shown in Bretschger et al. 2015.18 Each BES subpassage was conducted for 7 to 14 days under batch operation. The time line of the experiment along with the points for the subpassages are shown in Figure 1. At the end of each batch cycle, an electrode from the electrode stack was subpassaged into a new sterile reactor to accelerate the enrichment of electron-consuming methane-producing communities. A schematic describing the subpassage process is shown in Bretschger et al. 2015.18 Briefly, medium was withdrawn from the reactors and a single electrode from the three-electrode stack was removed and sandwiched between two sterile electrodes in the new reactor. The other electrodes from the stack were sectioned into 1–2 cm2 samples and used for DNA extraction for 16S rRNA sequence analysis, protein quantification, and confocal microscopy. To maintain anoxic conditions, the inoculation and subpassage procedures were performed in an anaerobic chamber (Coy Instruments, Grass Lake, MI). The anaerobic chamber was purged several times with 100% N2 to avoid the presence of H2 during reactor subpassages. The H2 readings on the gas detector were observed to be zero. After removing from the anaerobic chamber, reactors were degassed with sterile filtered 80%N2:20%CO2 (v/v) and then operated.
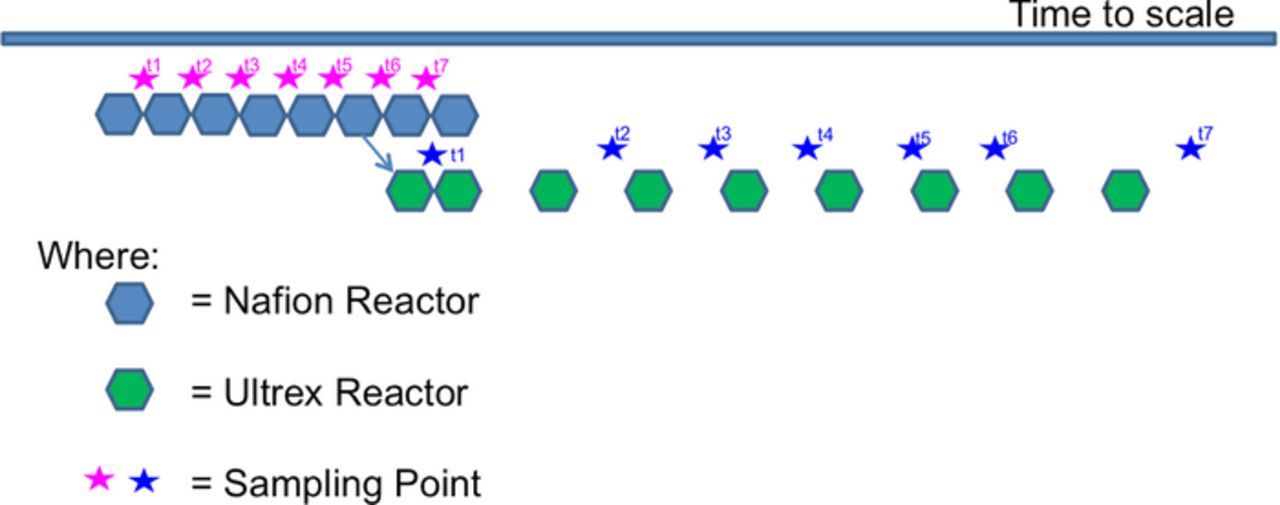
Figure 1. Schematic description of the experimental time line.
The BES reactor with Nafion membrane has been operated for 49 days with seven subsequent subpassages. The sixth subpassage was transferred into an Ultrex-containing BES and further operated for 110 days (Fig. 1). Thus, the microbial community at the working electrode of the Nafion-BES was used as an inoculation source for the Ultrex-BES. The sampling time for Ultrex-MES was increased from 7 to 14 days due to practicality.
Membrane pretreatment
Nafion 117 membrane was soaked in 5% HCl for 2–3 hours followed by rinsing with DI water and heat-treatment in DI water at 85°C for 30 minutes. Then the membrane was boiled in 3% H2O2 for 1 hour, followed by rinsing and subsequent boiling in 0.5M H2SO4 at 85°C for an additional 1 hour. Finally, the membrane was rinsed and stored in DI water until use.
Ultrex CMI-7000 membrane was presoaked in DI water prior to use.
Membrane characterization
Electrochemical Impedance Spectroscopy (EIS) was used to evaluate the resistance of the membranes. The EIS measurement was performed with a Gamry Instrument 600 potentiostat/galvanostat. A three-electrode setup was used for the EIS with the cathode being the working electrode, the anode as a counter and Ag/AgCl reference electrode. Potentiostatic EIS measurements were carried out in a frequency range from 100,000 Hz to 0.01Hz at 0V vs. open circuit potential of the working electrode and perturbations of 5mV/ms. Three BES configurations were tested: 1) without a membrane to evaluate the internal resistance of the BES construction (BES no membrane); 2) a BES with a Nafion membrane (Nafion-BES); and 3) a BES with an Ultrex membrane (Ultrex-BES). The resistance of the membrane was then calculated as RBES no membrane – RBES with membrane.
Methane quantification
The amount of methane produced during electromethanogenesis was measured using a Gas Chromatograph (Agilent 6890N GC with FID detector) as described previously.18 Reactor headspace samples were extracted every 2–3 days for each subpassage. 50 μL headspace samples were collected and analyzed with Agilent J&W 123–3233 DB-FFAP column and N2 carrier gas. Total soluble methane in the reactors was calculated using the following equation:38
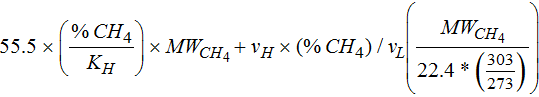
Where 55.5 is g-moles/L of H2O, %CH4 is measured, the KH is 44900 at 30°C, MWCH4 is the molecular weight of CH4 (16.04 g/mol), vH is the volume of headspace (35 mL), vL is the volume of liquid (110 mL), 22.4 is the L/mol of methane, and 303°K is the sample temperature.
Methane production rates in mg/L/day were calculated using the observed methane concentration divided by the time (in days) it took to reach this value for each subpassage.
Hydrogen quantification
Hydrogen production was also measured using a Gas Chromatograph (Agilent 6890N GC with FID detector) with ChemStation software Rev. B.02.01-SR1 (260). Headspace samples were collected and analyzed with Varian Chrompack Capillary column (CP-Molsieve 5Å 10 m × 0.53 mm × 50 μm). 0.25 mL manual injection of reactor headspace was run on a 1min method using a split mode inlet at 120°C with N2 carrier gas (5.84 psi, 115 mL/min), column flow of N2 (5.84 psi, 10.2 mL/min, 115 cm/sec), oven temperature of 80°C, and a TCD detector at 120°C (reference flow at 10 mL/min, makeup flow N2 at 5 mL/min). A standard curve was prepared using 5%H2:95%N2(v/v) at different injection volumes, producing a sharp H2 peak at ∼0.35 mins and a broad background peak at ∼0.42 mins.
Protein quantification
During each subpassage, 1 cm2 samples of the working electrode were used to estimate the amount of protein associated with the electrodes according to an extraction process previously described18 and quantified using the Pierce BCA Protein Assay Kit Enhanced test tube protocol (Thermo Scientific, Waltham, MA, P/N 23227). Biomass per unit area was calculated by dividing the observed value from the assay normalized to BSA standards per actual measured geometrical electrode sample size.
Confocal microscopy
During each subpassage, 2 cm2 samples of the working electrodes were cut, preserved in 2% paraformaldehyde and stored at 4°C for confocal microscopy. Prior to imaging, samples were stained with 10 μL/mL Concanavalin A Alexa Fluor 633 Conjugate (Life Technologies, Carlsbad, CA, P/N C21402) stain (5 mg/mL in sterile 0.1 M sodium bicarbonate at pH 8.3) and stored at 4°C overnight. Subsequently, 1 μL/mL of 10,000× SYBR Green I (Life Technologies, P/N S-7567) was added to each sample vial and incubated for approximately 20 minutes.
Stained samples were placed in a modified tissue well plate with 8 mL of phosphate buffer solution (8 g/L NaCl, 2 g/L KCl, 1.44 g/L Na2HPO4, 0.24 g/L KH2PO4 at pH 7.4). Images were taken with 10× objective and 63× water immersion objective using a Leica model #DM6000 CS SP5 and the associated Leica LAS AF software. Images were taken with z stack. To image DNA and reflected light from electrode surface, the settings were adjusted to 488 nm laser at 25%, reflection at 488 nm, green at 501–585 nm, using RSP 500 mirror. To image the extracellular polymeric substances, the settings were adjusted to 633 nm laser at 75%, red at 645–730 nm, using TD 488/543/633 mirror.
Microbial composition analysis
Total DNA was extracted from the working electrode-associated biofilms using the PowerBiofilm DNA Isolation Kit (MO Bio, Carlsbad CA, P/N 24000–50) according to manufacturer instructions. PCR was conducted using primers 341F (CCTACGGGRBGCAGCAG) and 806R (GGACTACNNGGGTWTCTAAT) for 16S rRNA analysis and the resulting ∼500bp products were sequenced using the Illumina Miseq paired-end reads technology. The sequences obtained were analyzed using the standard operating protocol in mothur v.1.32.0 using the SILVA database as a reference for alignment and classification. Briefly, sequence reads were filtered to remove adapter contamination followed by identification of chimeric sequences and taxonomic classification. Neighbor-joining phylogenies were estimated in CLC genomics workbench 8.0 assuming Jukes-Cantor model and 100 bootstrap replicates. All raw data including the nucleotide sequences reported in this paper have been deposited in GenBank under accession numbers (ACCESSION # KAFP01000000).
Principal component analysis
Principal Component Analysis (PCA) is a statistical tool used to analyze data sets in order to find patterns.39 PCA visualizes correlations and anticorrelations among samples and variables. It creates uncorrelated components called principal components. The first principal component (F1) has the largest possible variance and the second, orthogonal to the first, has the largest possible inertia (F2).
In this study, the results collected throughout the tests of the two BES, such as design parameters, electrochemical performance and microbial community data were included in the PCA matrix as variables. The two BES evaluated at different time points were used as samples. PCA in XLSTAT was applied to the dataset.
Results and Discussion
BES operation
The two BES reactors having identical construction but differing in the membrane type were operated for 49 and 110 days for the Nafion-BES and Ultrex-BES, respectively. The working electrode of the two BESs was constantly polarized at −0.7 V vs. Ag/AgCl and the current consumption along with the methane production rates were monitored over time (Fig. 2 and Table I).
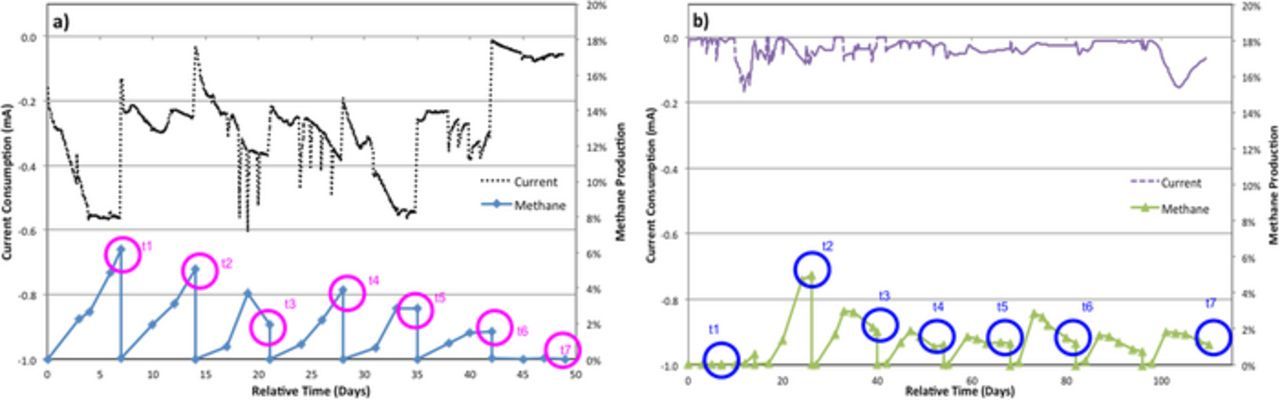
Figure 2. Current consumption and methane production rates for a) Nafion-BES and b) Ultrex-BES.
Table I. Performance metrics of the reactors. Avg current consumption is calculated as the average of values of current consumption measured at −0.7 V poised potential vs. Ag/AgCl taken every 10 minutes throughout the batch cycle. Electrode-associated biomass is the measured protein from electrode samples taken at the end of each subpassage in μg/cm2, and maximum CH4 production is the highest-measured conversion of CO2 to CH4 across each subpassage. ηE and ηCE are energy and Columbic efficiencies, respectively.40
| Nafion BES | |||||
|---|---|---|---|---|---|
| Time point | Avg Current (mA) ± StdDev | Protein, μg/cm2 | Max CH4, mg/L | ηE (%) | ηCE (%) |
| t1 | −0.449 ± 0.12 | 28.69 | 1.23 | 3% | 19 |
| t2 | −0.249 ± 0.03 | 22.01 | 1.02 | 5% | 29 |
| t3 | −0.273 ± 0.11 | 20.79 | 0.74 | 3% | 19 |
| t4 | −0.294 ± 0.06 | 15.05 | 0.78 | 3% | 19 |
| t5 | −0.422 ± 0.11 | 12.52 | 0.57 | 2% | 10 |
| t6 | −0.284 ± 0.05 | 17.97 | 0.31 | 1% | 8 |
| t7 | −0.051 ± 0.02 | 7.36 | 0.00 | 0% | 1 |
| Ultrex BES | |||||
| t1 | −0.011 ± 0.01 | 5.82 | 0.00 | 0% | 2 |
| t2 | −0.041 ± 0.03 | 6.92 | 1.00 | 28% | 172 |
| t3 | −0.035 ± 0.02 | 9.31 | 0.61 | 20% | 122 |
| t4 | −0.018 ± 0.01 | 12.34 | 0.38 | 25% | 151 |
| t5 | −0.043 ± 0.01 | 5.69 | 0.31 | 8% | 51 |
| t6 | −0.029 ± 0.01 | 8.06 | 0.58 | 23% | 141 |
| t7 | −0.082 ± 0.05 | 14.69 | 0.37 | 5% | 32 |
As shown in Figure 2, the current consumption rate was higher for the Nafion-BES than for the Ultrex-BES. At the same time, the amount of methane produced had comparable magnitudes for the two systems with the Nafion-BES demonstrating slightly higher values. The amount of protein extracted from the electrodes during the subsequent subpassages was more variable, with the Nafion-BES having consistently higher biomass associated with the working electrodes until the last subpassage, when all functional activity appeared to stop for that system (Table I). Damaging the microbial community during the electrode transfer might be one of the reasons for the drastically decreased activity after subpassage 6.
Since CO2 reduction to CH4 in the studied reactors is a result of microbial catalysis, the current consumption and methane production rates were normalized to the amount of biomass accumulated at the surface of the working electrode (Fig. 3). Overall, the Nafion-BES was characterized with more efficient current consumption in comparison to the Ultrex reactor; however, the per-biomass methane production rates between the two reactors showed that the Ultrex-BES had equivalent or higher methane production than the Nafion-BES regardless of the per-biomass current consumption trends (Fig. 2 and Fig. 3). Therefore the energy and Columbic efficiencies of the Ultex-BES appeared higher than Nafion-BES (Table I). One of the contributing factors to these results might be the difference in the membrane's resistance, where Nafion membrane has a lower resistance than Ultrex membrane (Table II).
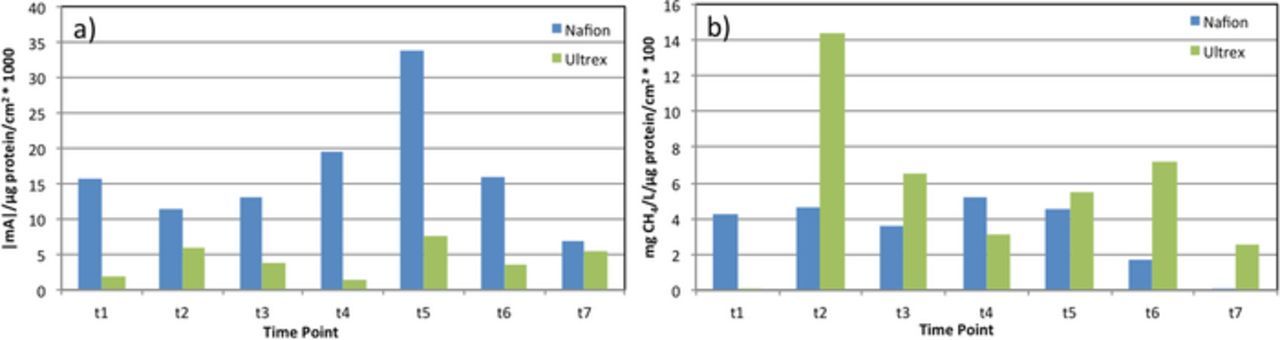
Figure 3. a) Current consumption and b) methane production rates, normalized to the protein amount on the electrode surface.
Table II. BES characteristics, where ECE is the measured potential of the counter electrode.
| Reactor | BES internal resistance, Ω | Membrane resistance, Ω | ECE, V vs. Ag/AgCl |
|---|---|---|---|
| BES no membrane | 7.5 | - | 1.82 |
| Nafion-BES | 23.9 | 16.4 | 1.61 |
| Ultrex-BES | 46.0 | 38.5 | 1.29 |
The resistance of different membranes depends on the nature of the electrolyte, the concentration of the electrolyte solution and its pH.35 Therefore, to confirm the hypothesis that the difference in the current consumed for the two types of BES is a result of the membrane characteristics, the resistance of the two membranes was evaluated using EIS. The internal resistance of abiotic BESs (membraneless, with Nafion or Ultrex membrane) was determined and the observed variations were ascribed to the resistance of the membrane as the only design component differing between the reactors (Table II and Fig. S.1).
As shown previously,27,35 the resistance of the Ultrex membrane was more than double that of the Nafion membrane. Thus the high ohmic losses occurring during the operation of the Ultrex-BES may explain the lower reduction currents measured for this reactor.
The higher internal resistance of both of the membrane-containing BES reactors may contribute to variations in the potential of the counter electrode (Table II), where higher membrane resistance implies lower potential of the counter electrode, impairing the oxidation of water and the production of protons at the Ultrex-BES counter electrode. The variations in the H+ concentration might also influence the mechanism of CO2 reduction to methane.
Therefore, we also monitored the pH variations in the two compartments of BESs. As shown in Figure 4, the pH of working compartments (WC) of the two reactors was 6.4 ± 0.1 and 6.7 ± 0.5 for Nafion- and Ultrex-BES, respectively. Similar pH (6.4 ± 0.3) was measured at the counter compartment (CC) of the Ultrex-BES. On the contrary, the pH in the CC for the Nafion-BES was significantly lower (pH = 4.1 ± 1.0, P < 0.01) across the experimental framework. The lower pH in the CC of the Nafion-BES indicates a higher proton production rate as a result of water splitting at the electrode surface, or suggests accumulation of protons due to a higher production rate than transport rate across the membrane.
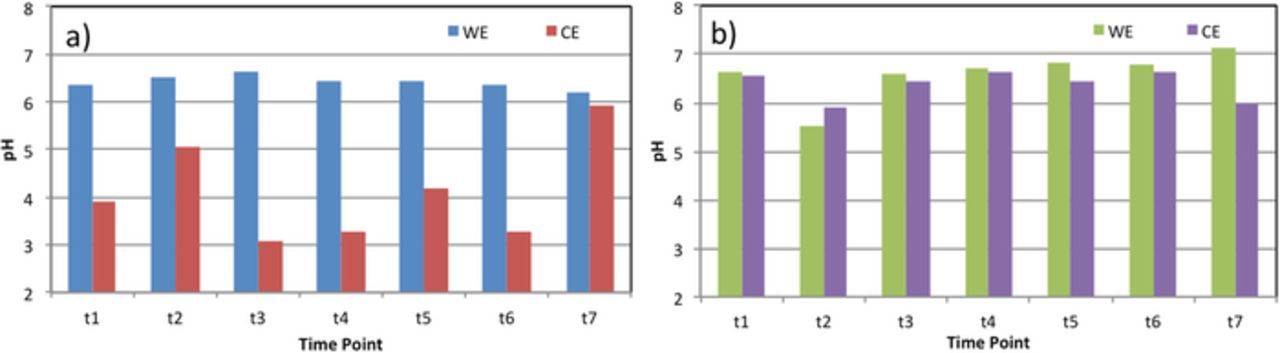
Figure 4. Variations in pH at the two compartments of a) Nafion-BES and b) Ultrex-BES.
To investigate if the lower pH at the CC was a result of the lower proton transport across the membrane or the higher rate of water splitting, the potential of the counter electrode in the reactors during the polarization of the working electrode at −0.7 V vs. Ag/AgCl was measured (Table II). Theoretically in a three-electrode set-up, the membrane type or the presence of membrane in general should not influence the potential and reaction rate at the CE. However, we see that the presence of a membrane and the membrane type clearly influence the polarization of the CE and thus, the rate of water splitting. The higher potential of the CE for the Nafion-BES indicates higher rate of water oxidation (2H2O(l) → O2(g) + 4H+(aq) + 4e−). Thus, the higher rate of proton production coincides with the lower pH at the counter electrode compartment.
Microbial dynamics
Confocal images of the working electrodes collected at the end of each subpassage showed no notable qualitative differences in the structural features of the biofilms formed in the two BES reactors (Fig. 5). Both reactors featured relatively uniform bacterial coverage and comparable surface coverage.
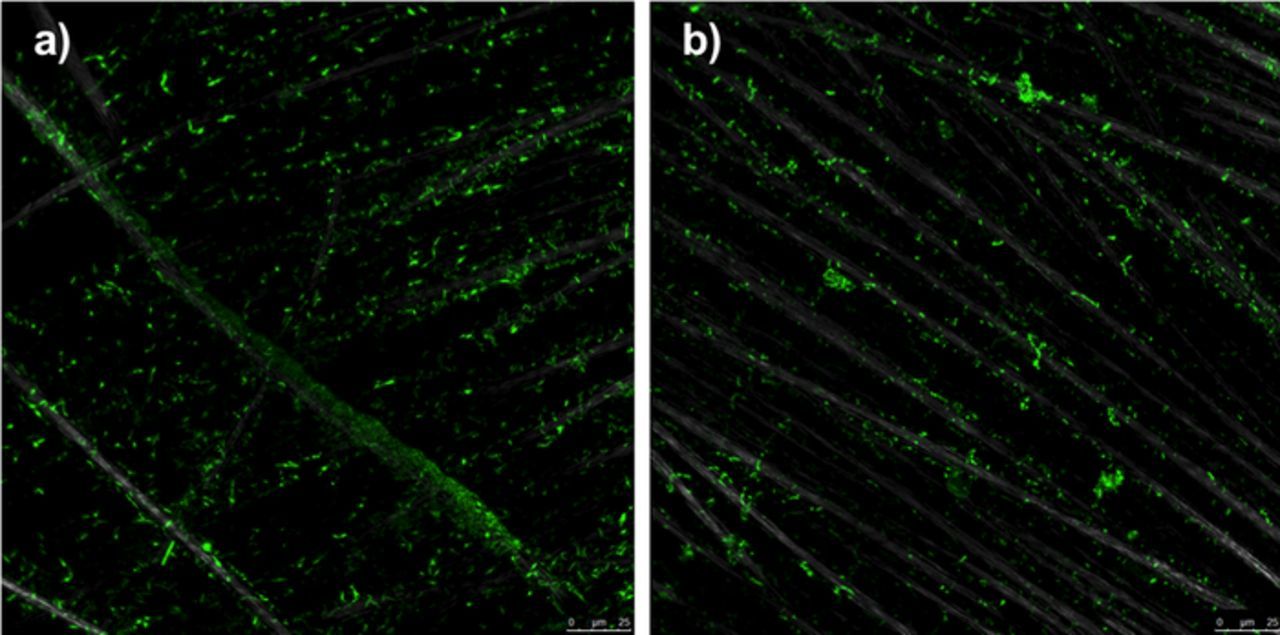
Figure 5. Representative confocal fluorescent microscopy images of a) Nafion-BES (t6) and b) Ultrex-BES (t3).
Samples for 16S rRNA analysis were collected at the end of each subpassage to characterize the microbial taxonomic composition and potential taxonomic changes along the course of the BESs operation (Fig. 6). It is evident that both BESs provided an enriching environment for methanogenic phylotypes, which are present in negligible proportions in the initial inoculum. Also, the predominant microbial taxa were similar across the passages for the two reactors at the order-level; however, the relative abundance of the different orders varied between the BESs with different membranes. In the Nafion-BES, an abundance of species from the order Methanobacteriales can be seen in the early subpassage, through t5; however, this population disappears during t6 and is absent in t7. The Ultrex-BES featured an even higher relative abundance of Methanobacteriales compared to the Nafion-BES in t2 and t3 and the relative abundance maintained at approximately 20% of the community population through t7.
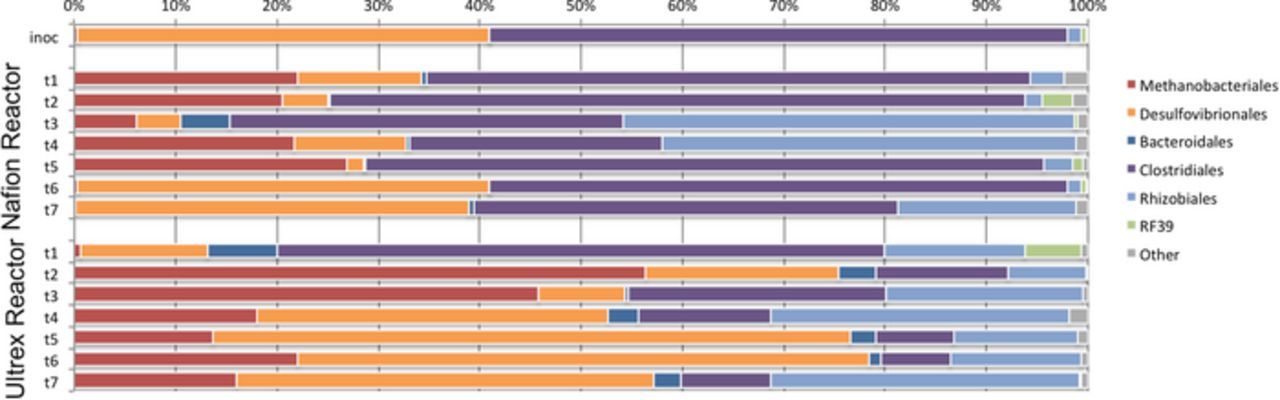
Figure 6. Taxonomic distribution of 16S rRNA community profile within electromethanogenic biofilm over time for the Nafion- and Ultrex-BES.
A higher abundance of Desulfovibrionales was also observed in the Ultrex-BES relative to the Nafion-BES; however, phylotypes in this order appeared mainly after the third subpassage (t3) for both of the reactors and their abundance grew to occupy up to 60% of the community composition in the Ultrex-BES and approximately 40% of the community composition in the Nafion-BES. The results suggest that Desulfovibrionales species may be competing with Methanobacteriales species, since more methanogenic species appeared when less Desulfovibrionales were present at the electrode surface for both reactors.
The presence of Methanobacteriales correlates with higher current consumption and methane production rates supporting the microbial role in the CO2 reduction process (Figures 2 and 6). Also, the lack of methanogenic species at the surface of the Nafion-BES electrode after subpassage 5 may explain the lack of produced methane and the significant decrease of the current consumed. The current recorded for Nafion-BES after t5 is likely a result of a non-biological reaction occurring at the electrode surface similar to the current recorded in the abiotic control BES (Fig. S.2).
Rhizobiales was also found to occupy approximately 20% of the community population for both of the reactors tested; however, greater fluctuations in abundance of these species were observed in the Nafion-BES relative to the Ultrex-BES. Some Rhizobiales are known as methane oxidizing species,41 and may account for the drop in total methane over a batch run; however, a deeper taxon-level analysis did not show predominance of known methanotrophic rhizobial strains (Fig. 6).
Clostridiales and Bacteroidales were also found in both reactors; however, the relative abundances of these two Orders were variable depending on the membrane in the BES. Clostridiales were at a higher relative abundance in the Nafion-BES (between 20% and 55%) for each subpassage. Comparatively, Clostridiales was found to occupy 60% of the community at the t1 subpassage in the Ultrex-BES and decreased in relative abundance to between 7% and 25% for subpassages t2 and t7.
Phylogenetic insights into deeper level taxa
Although quantitative differences in the microbial community composition are apparent at the order level, examining specific phylotypes supported by the two kinds of membranes can further illuminate the metabolic microcosm of the two reactors. We used phylogenetic inference method to analyze whether different membranes support distinct metabolic capacities exhibited by the presence of distinct strains within the same order. As shown in Figure 7, the predominant (>1% in relative abundance across all time-points) microbial community across all time-points in the Nafion-BES was highly diverse and included three distinct phylotypes each of Rhizobiales and methanogens, and two distinct phylotypes each of sulfate-reducing and fermentative bacteria. Similar but fewer phylotypes were observed in Ultrex-BES across the experimental timeline despite comparable sequencing reads (∼1000 per time-point per reactor) analyzed for each reactor. Additionally, the two BESs vary in the relative abundance of predominant phylotypes.
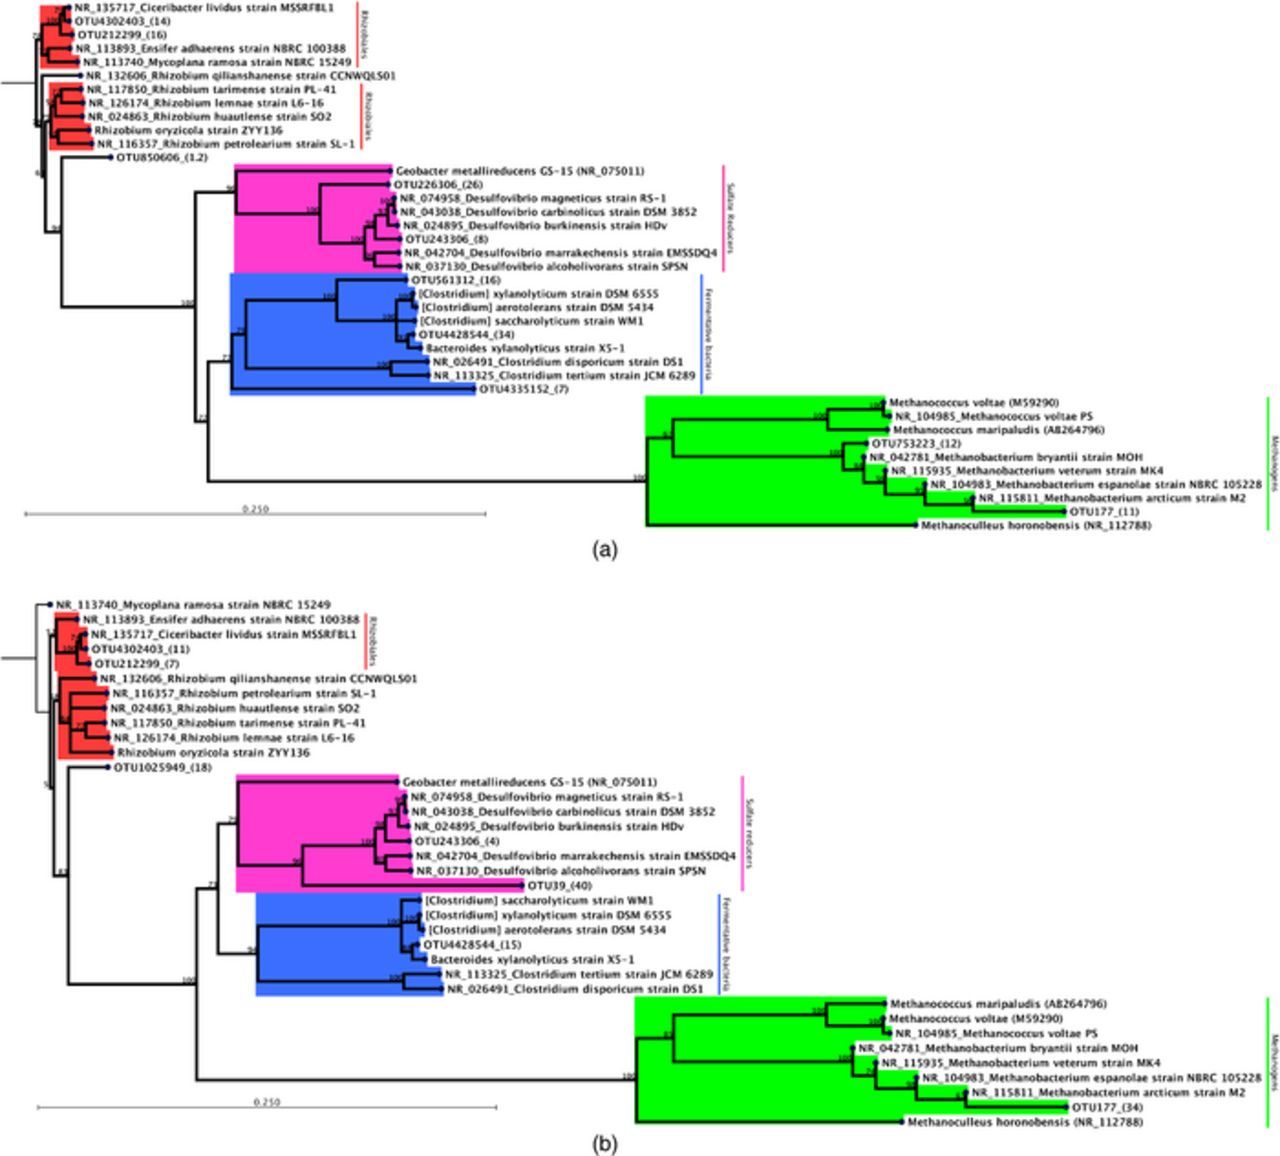
Figure 7. Phylotypic make-up of the reactors. Neighbor-joining phylogeny of predominant OTUs (>1% relative abundance across all time-points) along with % bootstrap support is shown for Nafion-BES (top) and Ultrex-BES (bottom). The parentheses next to each OTU ID shows the relative abundance in % across all time-points.
The methanogenic community consisted mainly of Methanobacterium phylotypes. In Nafion-BES, phylotypes similar to M. espanolae and M. bryantii were found at high relative abundance (>1%), whereas M. espanolae largely predominated the methanogenic community in Ultrex-BES. Previously studied isolates of M. espanolae and M. bryantii show high substrate-specificity with H2-CO2 as the sole substrates utilized for methanogenesis and growth42,43 (Heine-Dobbernack et al. 1988; Patel et al. 1990). Although other methanogens are capable of using volatile fatty acids as carbon and energy sources during methanogenesis, this capacity has so far not been reported in the predominant phylotypes found in our study. This suggests that hydrogen was actively being produced in our reactors either through purely electrochemical reaction or through bacterial activity, or both.
Many fermentative bacteria including the predominant phylotype, Clostridium saccharolyticum, found in our reactors are known to produce hydrogen, acetate and CO2 as byproducts of fermentation of a variety of carbohydrates.44 Amongst the fermentative bacteria, phylotypes closer to Clostridium saccharolyticum/xylanolyticum were highly abundant in Nafion-BES compared to Ultrex-BES, in which their abundance amounted to less than 1% although many Clostridium phylotypes at lower than 1% relative abundance were present in the Ultrex-BES. These results may indicate that Clostridium saccharolyticum and/or other Clostridium spp. may have been digesting cellular debris into the preferred carbon and energy sources for electromethanogenic activities within the community. The variations in Clostridium spp. relative abundance between the Nafion- and Ultrex-BES may also suggest that hydrogen, acetate and CO2 were more abundant in the Nafion-BES and could have helped to impact the composition of methanogens (Methanobacteriales), sulfate-reducers (Desulfovibrionales), and potential methane oxidizers (Rhizobiales).
It should also be noted that the samples extracted from the Nafion-BES corresponded to a methane-maximum in the system with the exception of the t3 subpassage, where the highest relative abundance of Rhizobiales (potential methane oxidizers) was identified across all subpassages. In contrast, the Ultrex-BES was sampled after the methane-maximum was observed, with the exception of the t2 subpassage, where the highest relative abundance of methanogens was identified for the Ultrex-BES across all subpassages.
Variation in phylotype diversity was also observed in the Order Rhizobiales with phylotypes matching closer to Ciceribacter predominating the community in Nafion-BES, and the Ultrex-BES showed an additional phylotype closer to the genera Mycoplana or Ensifer.
Although we did not observe distinct phylotypes in the sulfate-reducing fraction of the population, the relative abundance for one of the predominant phylotypes related to Desulfovibrio magneticus varied widely in the two reactors with 25% in Nafion-BES and 40% in Ultrex-BES. Desulfovibrio magneticus has been reported as a dominant OTU in acidophilic biocathodes remediating zinc and sulfate from wastewater;45 however, little is known about how this species may cooperate or compete in methanogenic microbial communities.
Mechanism of methane microbial electrosynthesis in the two BESs
Two main mechanisms of microbial electrosynthesis of methane from CO2 have been proposed. According to the first mechanism, CO2 conversion proceeds with direct electron transfer (DET) and requires direct contact between microbes and electrode surface (Eq. 1). The second mechanism, the mediated or indirect ET (IET)1,46, relies on electron shuttles or intermediate electron carriers to transfer the electrons from the electrode to the microorganisms (Eq. 2). The electron carrier is usually hydrogen produced at the surface of the electrode during proton reduction (Eq. 3). Thus, the type of CO2 reduction mechanism depends on the concentration of protons/hydrogen present at the working electrode. Higher proton/hydrogen concentration will lead to IET and a higher methane production rate. Theoretically, at the potential applied to the working electrode (−0.7 V vs. Ag/AgCl) both mechanisms of CO2 reduction are possible.
![Equation ([1])](https://content.cld.iop.org/journals/1945-7111/164/3/H3015/revision1/d0002.gif)
![Equation ([2])](https://content.cld.iop.org/journals/1945-7111/164/3/H3015/revision1/d0003.gif)
![Equation ([3])](https://content.cld.iop.org/journals/1945-7111/164/3/H3015/revision1/d0004.gif)
To determine the mechanism of CO2 reduction to methane, the amount of hydrogen present in the working compartment of the BESs was measured using a GC. No hydrogen was detected in the system; however, the limit of detection (LOD) for the method used was 0.7 mM, which is significantly higher than the H2 threshold for methanogens (0.4 to 95 nM).14 Therefore, we cannot exclude the possibility that hydrogen was produced or used as an intermediate for methane production. A more sensitive method will be explored in the future to evaluate potentially low concentrations of hydrogen present in the reactors.
The higher proton concentration gradient in the Nafion-BES reactor might lead to higher current uptake rates, which resulted in a different selection of fermentative bacteria, as well as acidophilic sulfate-reducers, and the promotion of both biotic and abiotic IET (Fig. 8). Thus, we can speculate that when the Nafion membrane is used, a consortium of fermentative species and methanogens develops, where fermentative bacteria contribute hydrogen, which is utilized by methanogens for CO2 reduction. In addition, a competing interspecies interaction between Desulfovibrionales and methanogens may take place. Desulfovibrionales are sulfate-reducing bacteria (SRBs) known to couple the oxidation of H2 or other organic material with the reduction of SO42− to HS−. The utilization of hydrogen for sulfate reduction makes SRBs a competing species to methanogens.47 A higher amount of SRBs in this case is related to lower current consumption and methane production rates (such as t6 and t7 in Nafion-BES). Thus, for both of the reactors, IET is most likely to be the mechanism of CO2 reduction although H2 concentrations above 0.7 mM were not detected. The driving force resulting from the pH gradients in the Nafion-BES appeared to have a stronger selective pressure against methanogenic phylotypes and an enriching selection for fermentative bacteria and sulfate reducers, as is evidenced by the disappearance of methanogens in the last two subpassages (t6 and t7).
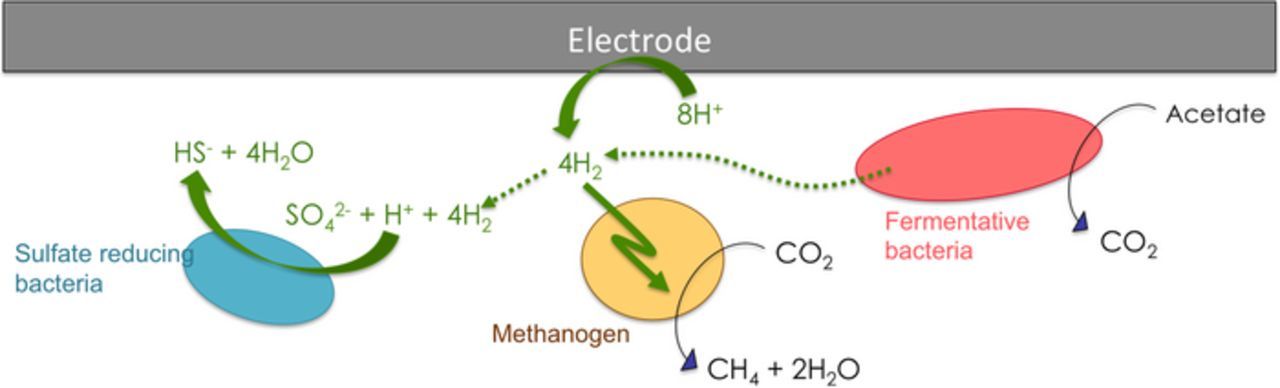
Figure 8. Schematic representation of the hypothesized processes occurring in the working compartment of BES.
Principal component analysis
Principal Component Analysis (PCA) was used as a statistical tool to look for correlations between the BESs' characteristics and operation (Fig. 9a). Principal component 1 (PC1) divides the samples based on the membrane type confirming the importance of this variable on the overall BES operation. The higher current consumption demonstrated by the Nafion-BES is a result of the lower membrane resistance, higher protein content at the electrode surface and the presence of Clostridia species. On the contrary, the presence of SRBs and the higher membrane resistance of Ultrex-BES led to lower current consumption, although the appearance of more Methanobacteriales in the Ultrex-BES reactor is likely responsible for the observed methane production relative to the Nafion-BES. When the average current was not considered as an input parameter in the PCA, the sample and variable grouping did not change (Fig. 9b). This further supports that the current consumption during the CO2 reduction is a function of other variables of the BES rather than a determinant of any of them. Therefore, the observed microbial diversity between the two BESs may not be dependent on the current passing through the system but rather contributes to determining the net current of the system.
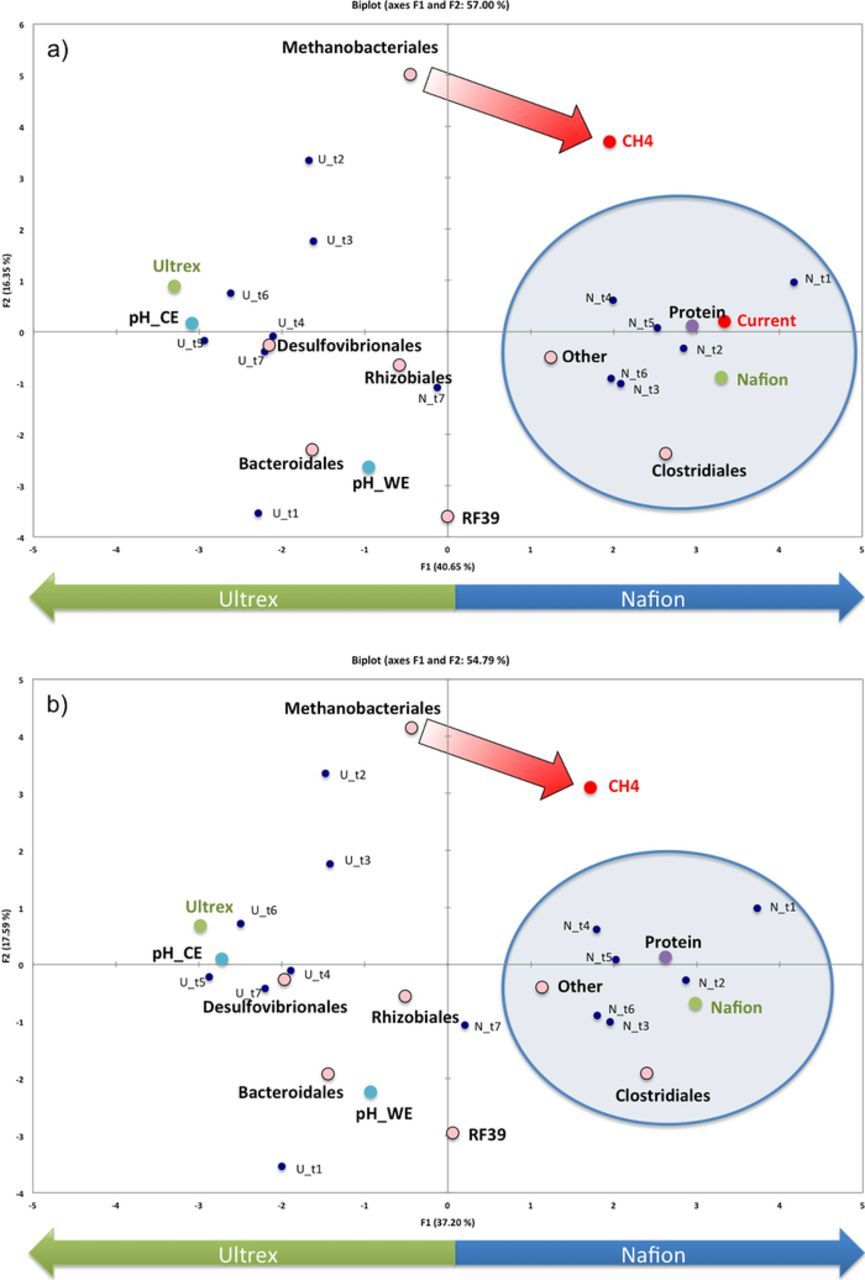
Figure 9. PCA biplot where scores (samples) and loadings (variables) for BESs are plotted on the first two components. a) The variable current is included in the PCA and b) the variable current was excluded from the PCA.
The higher biomass accumulation at the WE of the Nafion-BES is likely due to the growth of species from the order Clostridiales. Therefore, the higher methane production rates for the Nafion-BES might be related to the higher abundance of fermenters, while the higher current production from the Nafion-BES may be more directly related to the pH gradients (Fig. 4).
Conclusions
The performance and microbial taxonomic dynamics of BESs featuring either a Nafion or Ultrex membrane were evaluated. The results suggest that membrane selection for bioelectromethanogenesis reactors will drive microbial community dynamics in different ways. The Nafion-BES reactor showed the best performance in terms of current consumption and methane production in the early operational period and a strong selection for fermentative bacteria. However, the Nafion-BES was not able to sustain this activity over the course of 7 subpassages since methanogenic species were ultimately selected against and did not appear in the community composition for the last two subpassages. In contrast the Ultrex-BES had a lower pH concentration gradient and lower overall current consumption activity; however, the methane production activity from the Ultrex-BES was equivalent or better than the Nafion-BES reactor and was sustained throughout the seven subpassages. Collectively, these results suggest that mixed mechanisms for electron uptake and methanogenesis likely exist given the methanogenic phylotypes that were identified. However, an indirect mechanism of hydrogen exchange appeared to dominate both BES reactors. Finally, higher current consumption activity in BESs may not ultimately lead to the most robust electromethanogenic performance given that methanogenic phylotypes ultimately disappeared from the highest current consuming system (Nafion-BES), which correlated in time with a rapid decline of methane production.
This study emphasizes the need of a thorough research in order to determine and evaluate the impact of membrane usage and membrane type on microbial electrosynthesis in terms of product production, electrochemical performance, microbial population and dynamics, scalability and practical application. Membrane selection should be carefully considered in BES applications and fundamental studies since it may induce significant impacts on system efficiencies and microbial community selection.
Acknowledgments
This work was supported by NASA Cooperative Agreements NNX13AI31A and NNX13AI31A S02 and The Roddenberry Foundation.