Abstract
Adequate water management represents one of the main challenges in the design and operation of polymer electrolyte membrane fuel cells. In this work, the influence of inlet gas humidification on cell performance is investigated by in-situ current density measurements obtained using the segmented cell approach. Particular attention is paid to the combined effect of cell temperature and relative humidity of the anode and cathode feed streams. When operated at 80°C and low humidity conditions, the cell is seen to undergo a severe voltage decline that is not observed at 60°C. The analysis shows that the variation with temperature of the water uptake rate of the gaseous streams plays a key role in determining the observed differences in performance stability. In the case of 60°C operation, the water uptake rate of the cathode stream at 50% inlet relative humidity is roughly 30% of its value at 80°C at the same humidification level, resulting in a significantly lower drying capacity. A simple balance of water model, able to explain the observed cell behavior, is finally presented and discussed.
Export citation and abstract BibTeX RIS

This is an open access article distributed under the terms of the Creative Commons Attribution 4.0 License (CC BY, http://creativecommons.org/licenses/by/4.0/), which permits unrestricted reuse of the work in any medium, provided the original work is properly cited.
Energy demand has become one of the most serious concerns of modern society due to the problems related with greenhouse gas emissions and the depletion of fossil fuels. In this context, hydrogen is expected to play an important role as future energy vector, with polymer electrolyte membrane fuel cells (PEMFCs) being the leading candidates to provide efficient and clean electric energy conversion during the XXI century. Recently, significant progress has been made toward meeting the challenging cost and performance targets required for the widespread use of PEMFCs, specifically in the automotive industry.1 The state-of-the-art of polymer electrolyte membrane fuel cell technology is based on perfluorosulfonic acid (PFSA) polymer membranes operating at a typical temperature between 60°C and 80°C.2 Since the ionic conductivity of PFSA membranes depends on the water content of the membrane,3,4 water management is one of the most important issues for successful operation, high performance, and good durability of PEMFCs. Excess inlet gas humidification as well as condensation processes within the cell are likely to produce the accumulation of liquid water in the porous electrodes and gas diffusion media (effect known as flooding), thereby decreasing cell performance. On the other hand, an insufficient level of gas humidification lowers the ionic conductivity of the membrane and also results in a performance reduction.
Numerous studies have investigated the operation of PEMFC under dry conditions in order to simplify operation.5,6 Early work to demonstrate stable performance for PEMFC using dry or slightly humidified gases has been reported by Büchi et al.5 Strategies for operating polymer electrolyte fuel cells include also the reduction of humidification of both reactant gases7–10 or the dry operation of the cathode11,12 or anode13 sides. In the last decade, a wide variety of diagnostic and visualization tools have been used to investigate the complex phenomena involved in water management in PEMFCs. One of these tools is the segmented cell,9,14–20 which enables the possibility of studying the homogeneity of the current density distributions and other local processes.13–16,21,22 Other techniques, such as electrochemical impedance spectroscopy (EIS) or cyclic voltammetry (CV), have also been extensively used in the literature. More recently, neutron imaging, X-ray tomography and optical visualization techniques have enabled access to the liquid water distribution in operating fuel cells, providing a novel paradigm for the investigation of water management issues in PEMFCs.23–32
Regarding the relationship between cell performance stability and the relative humidity of the supplied gases, several investigations33–36 have shown the relation between cathode water accumulation and voltage instability in a PEMFC simulated stack. Other studies7,18,37,38 have reported unstable cell behavior under low cathode humidification conditions due to membrane dehydration. Some of these works18,38 describe these instabilities as oscillations, i.e., transitions from high to low performance levels corresponding to a change from hydrated to dehydrated cell conditions, an unusual phenomenology that has also been addressed by the modeling community.39
This work reports an investigation about the influence of the relative humidity of the inlet gases on cell performance stability and on the current density distributions. The main aim of the work is to find the minimum values of the relative humidities of the anode and cathode inlet streams which are compatible with high and stable cell performance. With this aim, two different operating temperatures were selected (60°C and 80°C), in order to compare the influence of the different water uptake rates of the gaseous streams at both temperatures on the cell behavior. A simple balance of water model that reproduces the observed phenomenology is also presented, along with an energy analysis comparing the heat required for humidification and the heat available in the cell under the conditions tested in the experiments.
Experimental
To study the cell response at different humidification levels, a single cell with an electrode area of 142 cm2 was used. The cell was developed in-house to be used in stack testing at the German Aerospace Center (DLR). The test bench is equipped with programmable logic controllers (PLCs) and commercial electronic loads. It allows automatic control of the operating cell conditions, such as cell pressure, cell temperature, gas flow rates, and humidity of the reactants. The relative humidity (RH) of the inlet gases is controlled by mass evaporator mixers and the cell temperature (Tc) is kept constant at 60°C or 80°C using a thermostat. The electronic load may be operated in galvanostatic (i.e., constant current) or potentiostatic (i.e., constant voltage) modes.
The operating conditions are summarized in Table I. Performance stability was investigated by recording the voltage in galvanostatic conditions for at least 50 min. If the voltage decay was smaller than twice the usual degradation rate, the performance was considered stable. Normal fluctuations in the voltage signal during this time were observed to be less than 50 mV. Cell responses not fulfilling these conditions were classified as either semi-stable, if only a slight drop (<20%) of performance was observed, or unstable, if a drastic drop (>20%) of performance was detected.
Table I. Experimental conditions.
| Cell temperature (Tc) | 60°C, 80°C |
| Absolut pressure | 1.5 bar |
| Current | 100 A (galvanostatic mode) |
| Cell surface | 142 cm2 |
| Gas flow rates | Anode: 840 ml min−1 (λ = 1.2) |
| Cathode: 3320 ml min−1 (λ = 2.0) | |
| Relative humidity (RH) | Varying |
| Flowfield (see Figure 1): | Counter flow |
| Segment Nr. | |
| Anode inlet | A1, B1, and C1 |
| Anode outlet | G10, H10, and I10 |
| Cathode inlet | G1, H1, and I1 |
| Cathode outlet | A10, B10, and C10 |
| Membrane | Nafion XL |
| Catalyst Loading on both sides | 0.3 mgPt cm−2 (Ion Power Inc) |
| Gas Diffusion Layer | Sigracet 25 BC (SGL Group) |
For the sake of clarity, it should be pointed out that although in some parts of the text the dry gases supply is referred to as 0% RH when the gas humidification is inactive, the actual relative humidity is in this case about 2%.
The membrane electrode assembly (MEA) used in the present work consists of a commercial Nafion XL membrane, with an anode and cathode platinum loading of 0.3 mgPt cm−2 on each side (Ion Power Inc). For the GDL, SGL Group Sigracet 25 BC was used for all measurements.
In order to visualize the effects of different gas relative humidity levels on the homogeneity of the current density distribution, locally resolved current density measurements18,25 were performed. For that purpose, the DLR patented printed circuit board (PCB) for current density measurements was adapted for the use in a multi-serpentine segmented bipolar plate with a 142 cm2 MEA, allowing for a maximum working temperature of 210°C. The PCB is divided into 90 segments, with 25 integrated temperature sensors, and was used as anode bipolar plate. The coupling of the anode and cathode current density distributions on DLR's PCB is described by Lin et al.40
The bipolar plate of a fuel cell generally conducts current in three dimensions. To measure the current density distribution in cells with plane MEAs, in-plane current spreading within the plates has to be avoided. For this reason the bipolar plate of the cell is replaced by a current density measurement board which conducts current in only one dimension, i.e., only in the through-plane direction. This is achieved by using a plate made of non-conducting material which is covered with conducting layers. The top and back layer of the board are connected which each other by conducting wires and the layer which is in contact with the MEA (segmented surface) is divided into segments to avoid lateral (i.e. in-plane) conduction. This setup forces the current between the segmented surface and the collector surface (back layer) on discrete pathways which connect every segment surface with the collector surface. The current flow in each of the pathways can then be easily measured by integrating calibrated resistors in each path and measuring the voltage drop across each resistor via sense wires connected to a data acquisition unit.
Figure 1 shows the multi-serpentine segmented bipolar plate design used in the present experiments, indicating the location of the cell segments in a) anode side and b) cathode side flow fields, as well as c) the position of the segments in the current distributions diagrams, and d) the color code used in this work. This color code will allow easy identification of changes in the homogeneity of the current density distributions at the different operating conditions considered in Figs. 2–7. For clarity in the evaluation of the cell performance stability, all the plots showing the time evolution of the cell voltage (Figs. 2–7) include the average (Avg) value and the standard deviation (STD) from the average cell voltage.
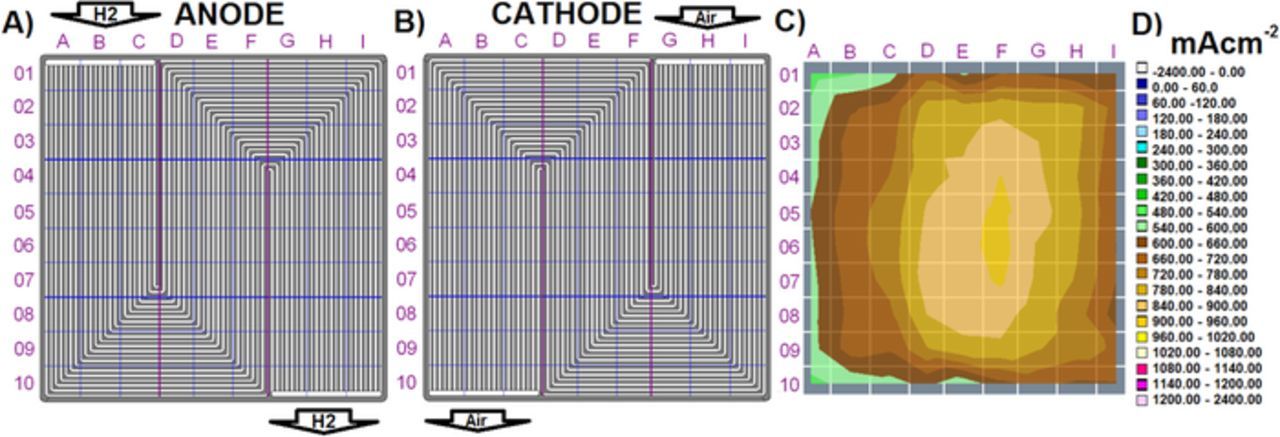
Figure 1. Multi-serpentine segmented cell design; a) anode side flow field showing the location of the cell segments and H2 inlet and outlet, b) cathode side flow field showing the location of the cell segments and air inlet and outlet, c) current density distribution obtained in a sample run at 80°C, and d) color code used for the current density distributions presented in Fig. 1c and in Figs. 2–7.
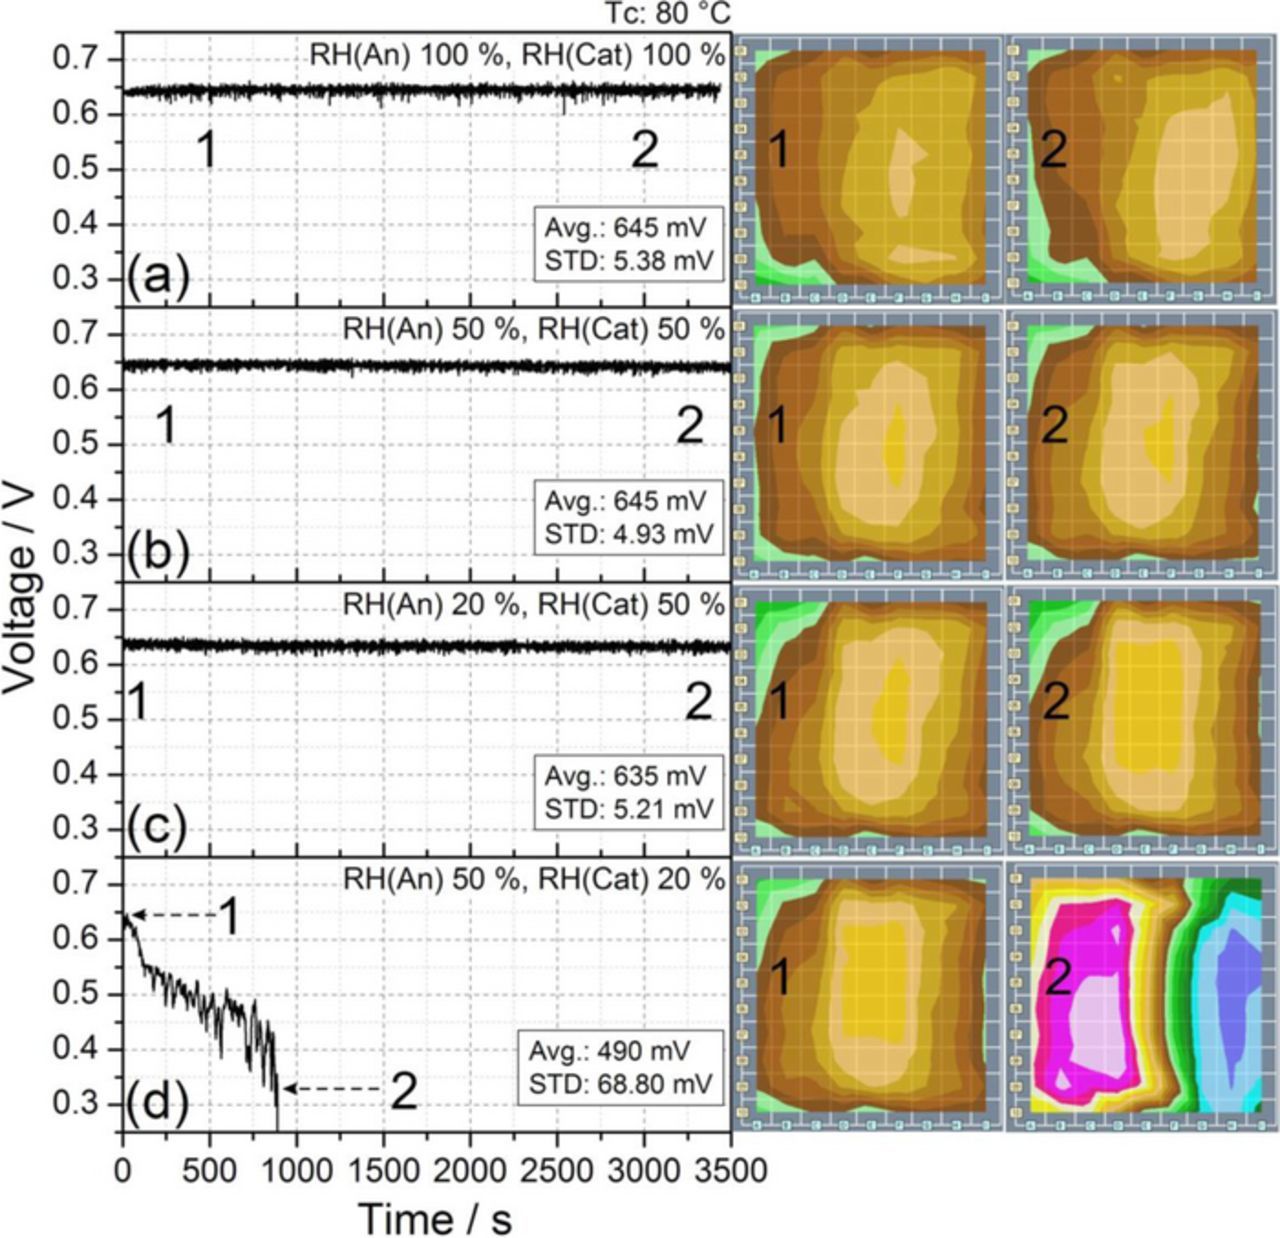
Figure 2. Examples of stability of the cell response at relative humidity levels of a) 100% and b) 50% on both anode and cathode sides, c) RH(An) 20% and RH(Cat) 50%, and d) RH(An) 50% and RH(Cat) 20%. The plots show the average value and the standard deviation of the cell voltage, as well as two current densities mappings at different instants of time (see Fig. 1 to correlate segment positions and current scale). The condition shown in plot b) (i.e., 50% RH on both sides) was chosen as reference condition. The experiments were performed under the conditions reported in Table I at Tc 80°C. The plots only report a portion of the whole duration of the experiment.
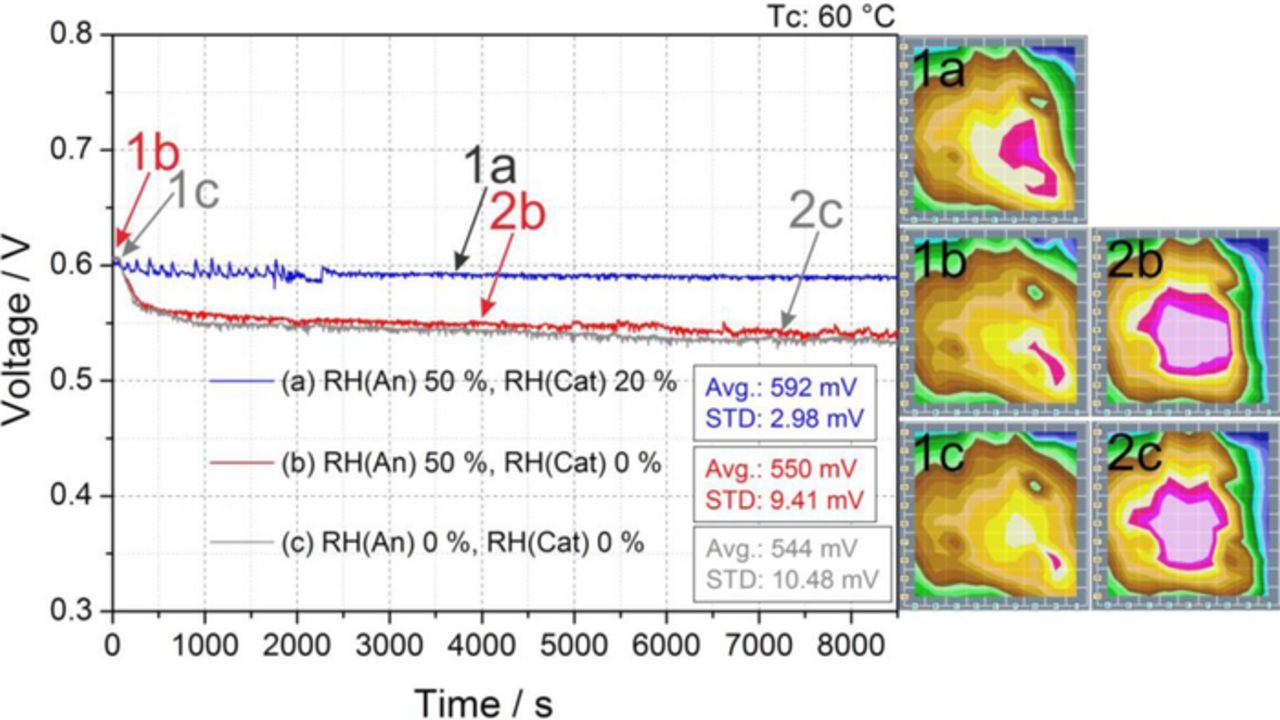
Figure 7. Effect on cell response of the reduction of cathode RH from the reference conditions of 50% RH on both sides at Tc 60°C to a) (blue) 50% anode, 20% cathode, b) (red) 50% anode, 0% cathode and c) (grey) 0% anode, 0% cathode. Current density distribution maps recorded at the beginning of the test and after 1 or 2 h are shown.
Results and Discussion
All the experiments were performed under the conditions shown in Table I. Under such conditions (pressure, cell current, flow rates, relative humidities), the capacity of the gases to absorb water varies significantly with temperature. The water uptake rate is also referred in the following as water advection capacity (since both the flow rate and the thermodynamic properties of the inlet and outlet streams determine uptake rates). For the particular conditions considered in this work, the (negative, i.e., drying) advection capacity of the cathode stream at 50% inlet relative humidity is roughly 30% of its value at 80°C at the same humidification level. This notable difference can justify the dissimilar behavior observed at low values of RH at the two temperatures under study, which are to be described below.
Cell temperature 80°C
With the initial aim of finding humidity conditions that allow cell operation without significant performance loss, the cell was first tested at 100% RH on both anode and cathode sides. The measured evolution of the cell voltage is plotted in Fig. 2a (Avg = 645 mV, STD = 5.38 mV), along with two very similar current density distributions taken with a time lapse of about an hour. The cell was then tested with partially humidified gases, concluding that values of 50% RH on anode and cathode did not reduce the performance compared to fully humidified gases (Avg = 645 mV, STD = 4.93 mV); such conditions even improved the cell stability (smaller STD) due to the lack of liquid water inside the cell, maintaining the highly stable and homogeneous current density distribution shown in Fig. 2b. For this reason, reference humidification conditions were defined at 50% RH on both sides.
In order to reduce influences between consecutive experiments, and to ensure the same initial cell conditions before measuring at different RH levels, the cell was always returned to the reference conditions (i.e., 50% RH on both sides) after each experiment. These conditions were maintained until the reference cell output voltage and current density distributions shown in Fig. 2b were recovered.
To study the influence of reducing the relative humidity of the feed streams from their reference level, RH was reduced to 20% first on the anode, and then on the cathode. Figures 2c and 2d show the voltage responses and current density distributions after the corresponding RH reduction was performed.
Figure 2c shows that decreasing the RH to 20% on the anode side does not produce any important changes in the stability and current density homogeneity, the cell power output being reduced by less than 1.6% compared with the reference conditions of Figs. 2a and 2b. Conversely, Fig. 2d shows that the same percentage reduction in the RH on the cathode side produces the deactivation of large areas of the MEA, which shows very low current densities in the region dominated by the cathode inlet (Fig. 1, columns G, H, and I). As the deactivated area increases with time, the voltage response is no longer stable, and a drastic voltage decline eventually occurs, as previously reported by Sanchez and Garcia-Ybarra.9 It is worth noting that in the experimental conditions considered here the mass flow rate of the cathode stream is about four times larger than that of the anode (see Table I), which justifies the much larger influence of cathode RH on cell performance stability.
As demonstrated in the experiments reported in Figs. 2c and 2d (whose purpose was to find the lowest values of humidification compatible with stable cell behavior), the reduction of the relative humidity in the anode side does not lead to a drastic loss of cell performances and stability. Therefore, the cell was then operated with dry gas supply at the anode side, while successively reducing the relative humidity of the cathode side. Figure 3 shows the measured cell responses for a) 100%, b) 70%, c) 50%, and d) 20% RH cathode feed (i.e., air supply).
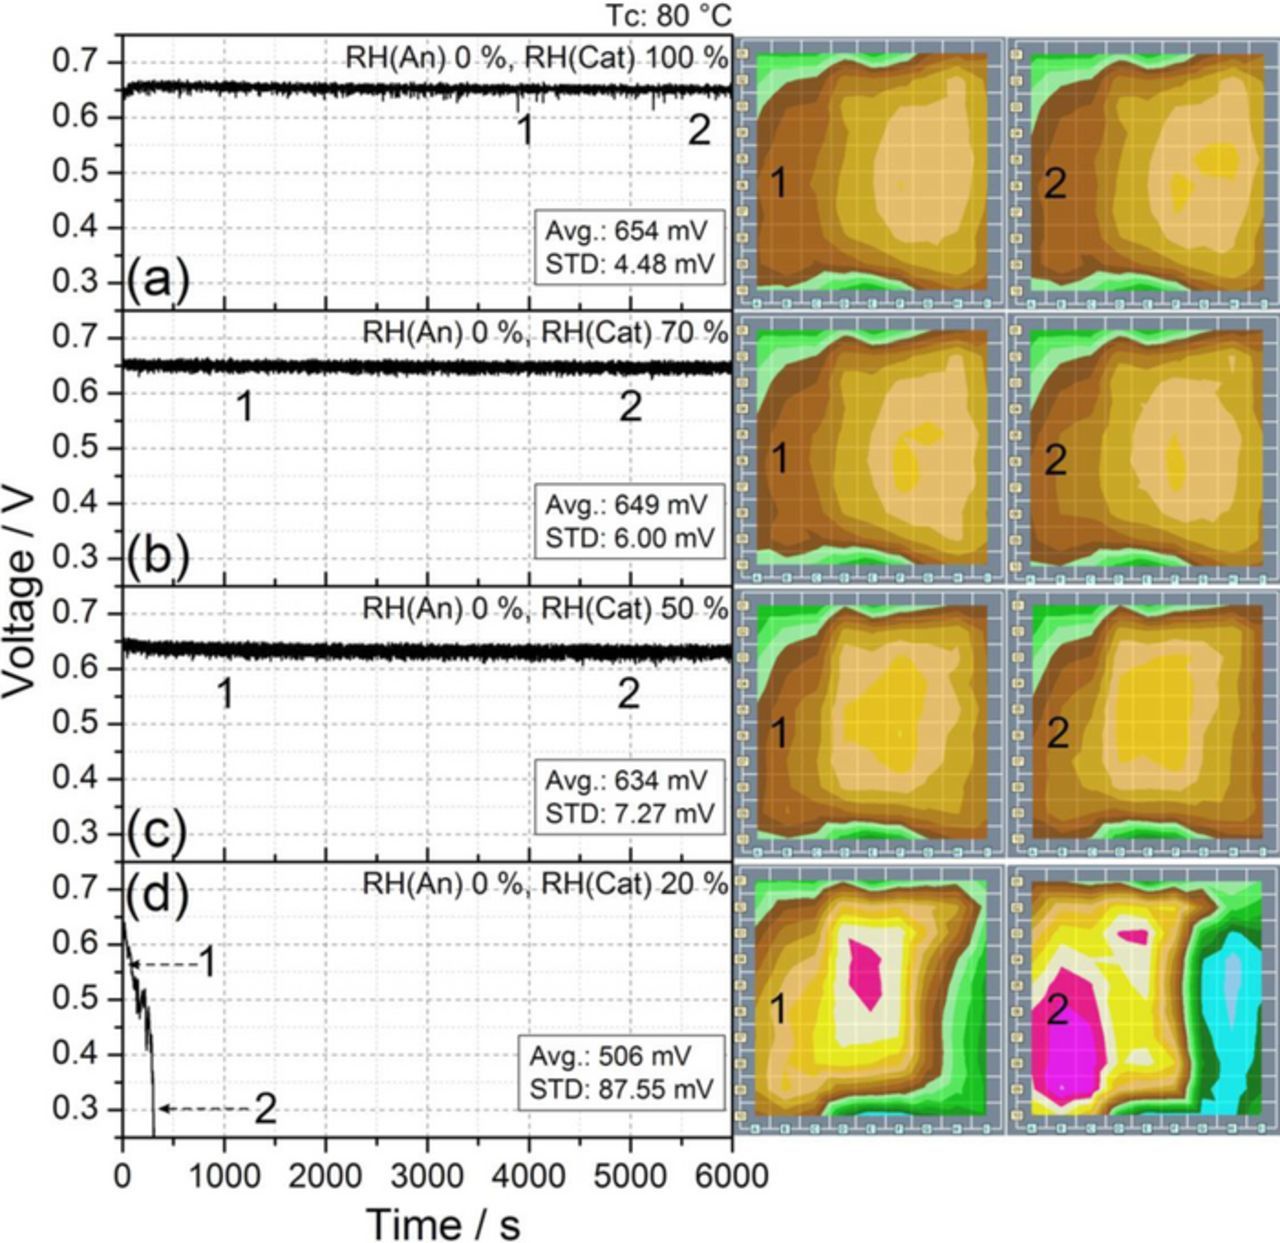
Figure 3. Transient cell response at Tc 80°C under dry anode supply and different RH values at the cathode inlet: RH (Cat) a) 100%, b) 70%, c) 50%, and d) 20%. Other experimental conditions are reported in Table I. The numbers represent the times corresponding to the relative current density distribution maps shown on the right.
At cathode RH between 100% and 50%, a stable cell response without significant performance losses is observed. Furthermore, the current density distribution is quite homogeneous and similar to the reference conditions reported in Figs. 2a and 2b. In contrast, Fig. 3d shows that 20% RH on the cathode produces an unstable behavior, accompanied by current density deactivations and a drastic voltage drop. This behavior can be correlated to the observation in Fig. 2d. Note that the voltage drop is faster in Fig. 3d than in Fig. 2d as a result of the lower RH at the anode side.
The experiments reported in Fig. 3 showed the possibility of running the cell under low anode humidification, whereas cathode humidity levels below 20% RH where seen to produce a high decline in cell voltage. Thus, new tests were carried out to study the cell response and performance stability under low cathode and increasing anode humidification levels.
Figure 4 shows the consequence of raising the humidification in the anode side under low cathode humidification, particularly with 20% RH at the cathode side. Values of 70% RH on the anode, Fig. 4e, cannot counteract the low cathode humidification, producing current density deactivations and consequently a drastic voltage drop, as previously observed in Figs. 2d and 3d.
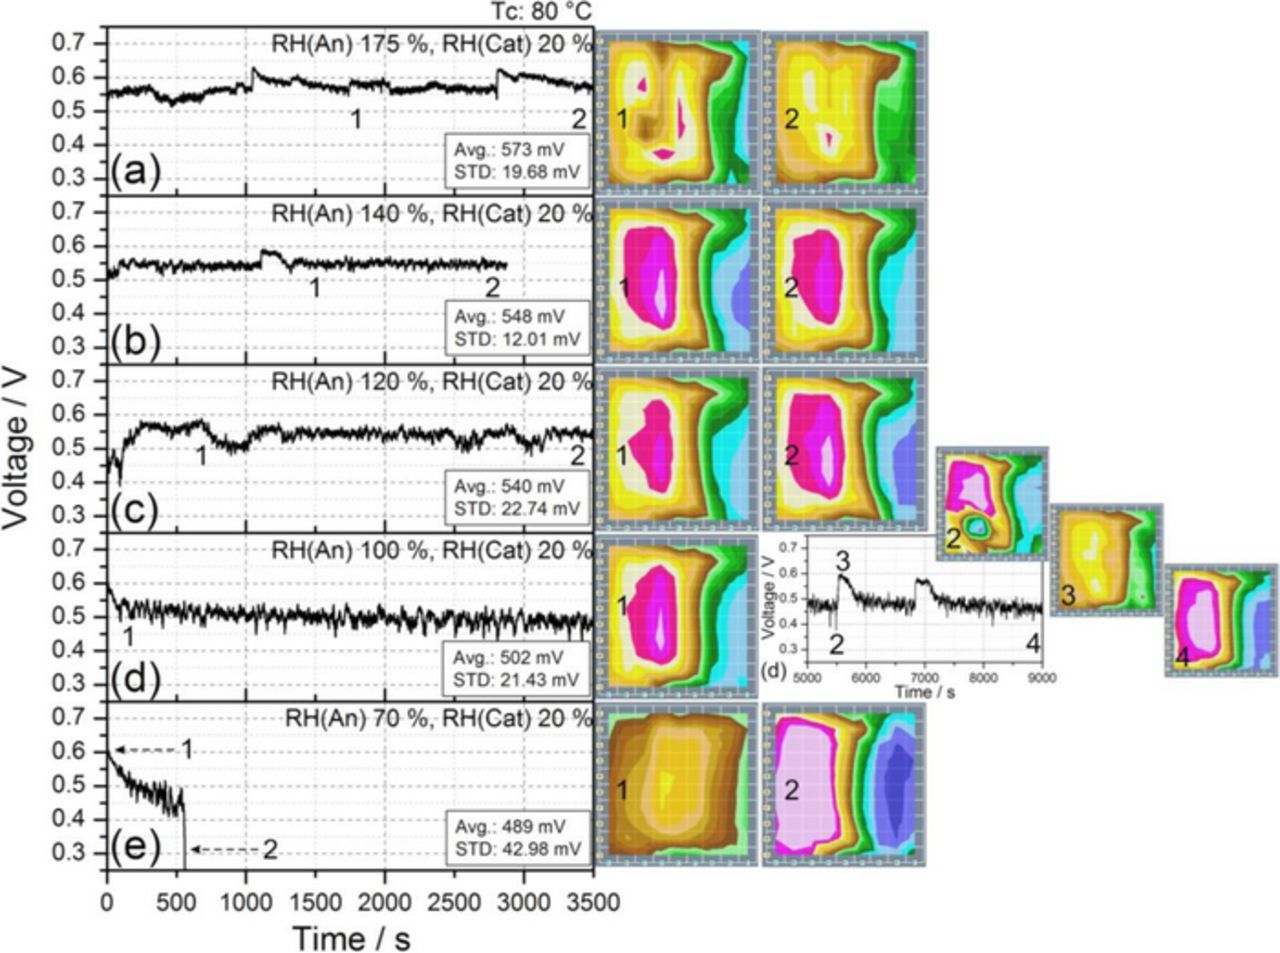
Figure 4. Transient cell response at Tc 80°C under different values of anode RH, with 20% RH on the cathode side and under the experimental conditions reported in Table I. The numbers represent the times corresponding to the relative current density distribution maps shown on the right.
Figure 4d shows how increasing anode RH from 70% to 100% prevents the voltage drop, creating a stable state with a significantly lower cell voltage (about 22% less) than in the reference conditions. This was previously reported in the studies by Sanchez at al.18,38 investigating oscillatory cell behavior under low cathode humidification. Such characteristic voltage oscillations can also be observed in Fig. 4d, points 2 and 3. Under such conditions, the drying process in the cathode side dominates the cell behavior, producing the current deactivation in areas dominated by the cathode inlet (Fig. 1, columns G, H, and I), as a consequence of the low humidification at the air supply.
Figures 4a, 4b and 4c show how raising the relative humidity at the anode side up to values of RH 175% can produce improved voltages with less current density deactivations. Supplying the anode side with over saturated gas produces, however, the erratic accumulation of liquid water on some specific areas of the flow field (see, e.g., segment C7 in Fig. 1a, where the flow channel changes direction). Excess liquid water (i.e., flooding) results in the partial blockage of some channels, which leads to a current reduction on these areas as a result of oxygen starvation, an effect that can be observed in diagram 1 of Fig. 4a.
Once the possibility of working under low cathode humidification (20% RH, Figs. 4a and 4b) has been ascertained, the question that remains is whether it could be possible to operate the cell under dry air supply at 80°C. With this aim, new experiments were performed, successively increasing the RH in the anode side while keeping the cathode side under dry gas supply. Stable cell operation was obtained with high performance at sufficiently high values of anode RH; in particular, a quite good response (around 600 mV average voltage) was observed at 250% anode RH, meaning strong water condensation at the anode. In contrast to that observed in Fig. 4a with 175% RH at the anode and 20% RH at the cathode, the use of dry cathode supply with the same anode RH of 175% leads to an unstable behavior with a drastic voltage drop.
The experiments carried out with low cathode humidification are consistent with previous results obtained with the differential cell technology25 and show how the instable cell behavior, occurring as a result of low cathode humidification, could be compensated using very high relative humidities at the anode (Fig. 4).
Cell temperature 60°C
After illustrating in the previous section the influence that low relative humidities of the feed streams have on the response stability and in the current distribution homogeneity at a cell temperature of 80°C, similar experiments were performed at a cell temperature of 60°C. The aim is to understand the effect of the different advection capacities of the feed streams at different temperatures on the cell performance and stability.
Figure 5 displays that similar voltage evolutions and current density distribution are obtained when operating the cell at RH values of 100% (Avg = 611 mV, STD = 6.14 mV) and 50% (Avg = 615 mV, STD = 3.15 mV) on both sides under a cell temperature of 60°C. The same behavior previously observed at 80°C, see Figs. 2a and 2b. In both cases (80°C and 60°C) the cell response was more stable at 50% RH due to the reduction of the flow perturbations induced by the absence of liquid water in the cathode flow field.
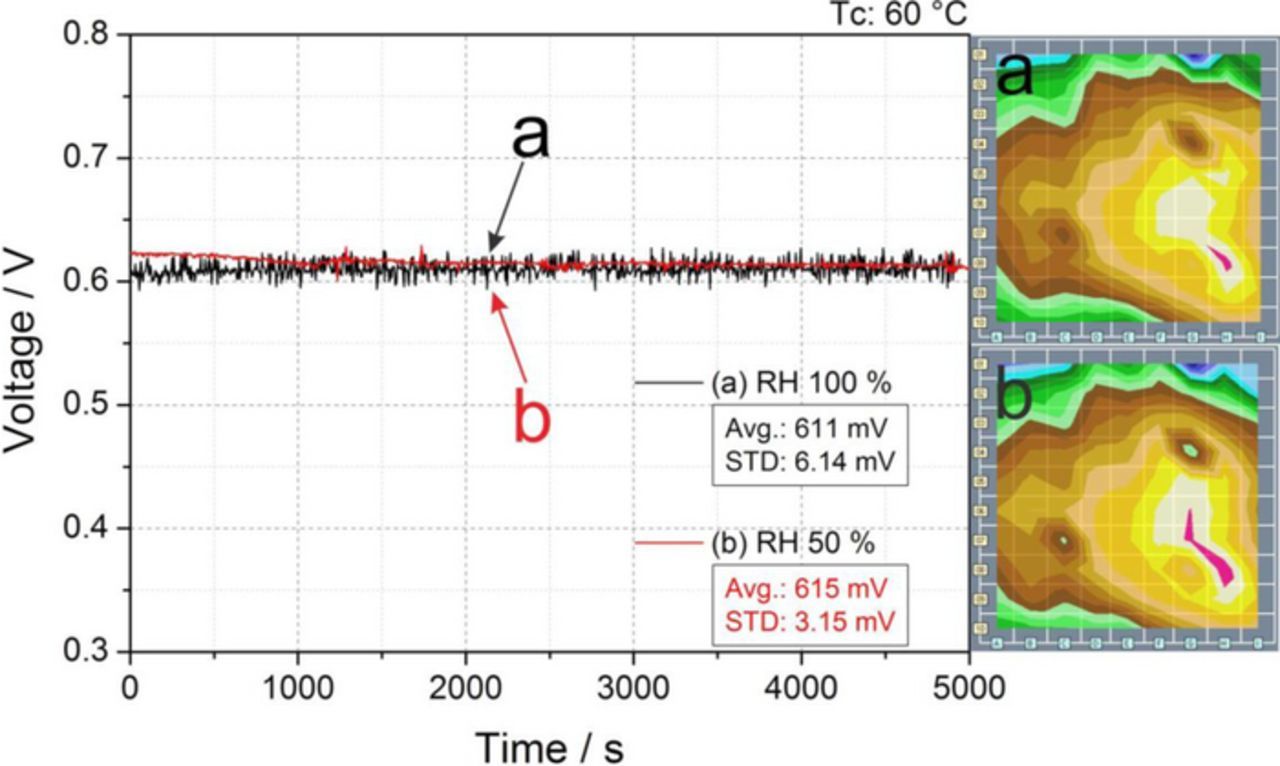
Figure 5. Comparison of cell response between relative humidity levels (same on anode and cathode) of 100% (black) and 50% (red), measured at Tc 60°C under the operating conditions reported in Table I. The labels a and b represent the conditions corresponding to the relative current density distribution maps shown on the right.
As previously observed at 80°C (Fig. 3), reducing the relative humidity of the anode feed has a negligible influence on cell stability and performance also at 60°C. Figure 6 shows the stable operation obtainable under dry anode supply, for a) 100%, b) 70%, c) 50%, and d) 20% RH cathode feed. Only a slight decrease of 5% in cell performance was observed during the test at 20% RH on the cathode side (Fig. 6d), accompanied by a minor local current decrement in the segments of columns H and I corresponding to the cathode inlet23 (Fig. 1). Comparison of Figs. 4d and 6d shows that the drastic voltage drop and current losses observed at 80°C under low humidity conditions does not occur at 60°C. The calculations presented in the next section indicate that the (negative, i.e., drying) advection capacity of the gases at the cathode side at 60°C is much smaller than at 80°C with the same RH cathode feed. This could explain why at a cell temperature of 60°C, under low levels of cathode RH, such as 20%, the deactivation of the cathode inlet segments is not so drastic, and is compatible with a stable cell response, as shown in Fig. 6d.
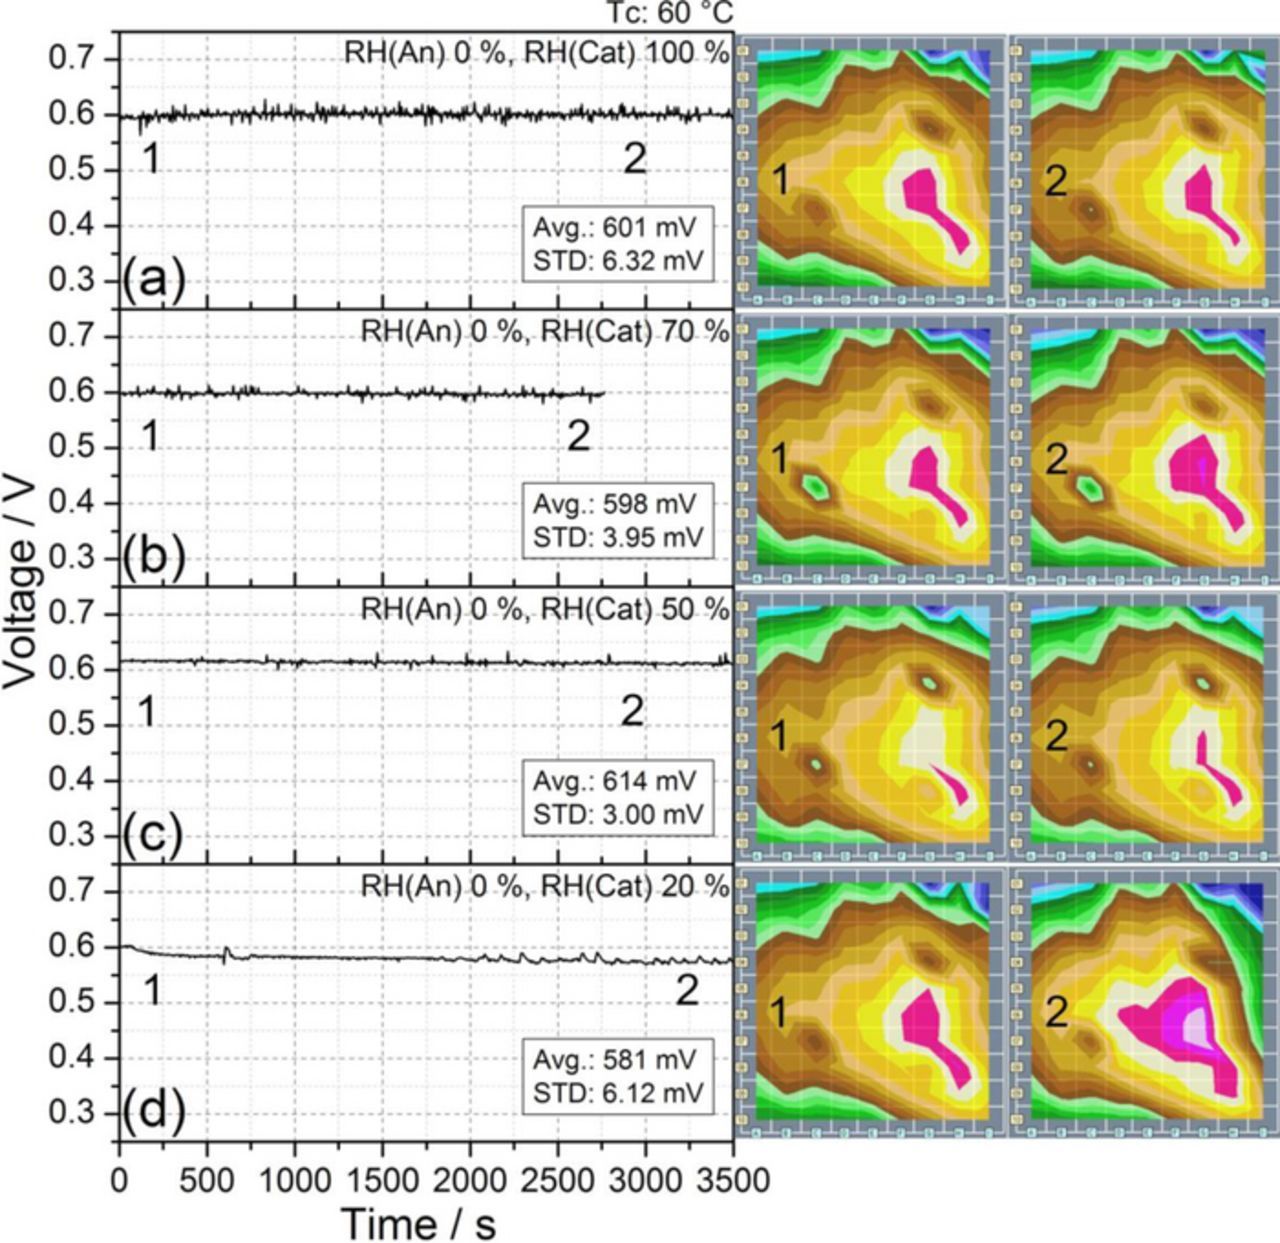
Figure 6. Transient cell performance at Tc 60°C under dry anode supply and different RH values at cathode inlet: a) 100%, b) 70%, c) 50% and d) 20%. The other experimental conditions are reported in Table I. The numbers represent the times corresponding to the relative current density distribution maps shown on the right.
The experiments reported in Fig. 6 show the possibility to operate the cell under low anode humidification even when cathode humidification levels are as low as 20%. Thus new tests were carried out to study the cell response and stability when working under low (20% RH) and dry (0% RH) cathode humidification. Figure 7 illustrates how a reduction on cathode relative humidity from 50% (reference condition, Fig. 2b) to 20% (Fig. 7, curve a) and later to 0% (Fig. 7, curve b) does not produce a significant effect in the voltage, even when the cell is supplied with dry air. Only a small decrease in cell performance was measured (approximately 3% and 11% less than in the reference condition for 20% and 0% RH cathode feed, respectively), and the cell reached always a stable behavior after several minutes of operation, a markedly different behavior compared to the drastic voltage drop observed at 80°C at the same RH conditions (see, e.g., Fig. 2d for 50% RH anode and 20% RH cathode).
Thus, stable working conditions can be achieved even when the cell is supplied with dry air at a cell temperature of 60°C. The current density plots included in Fig. 7 show the evolution of the current density distribution from the beginning of the experiment (a), and after some minutes of running the cell with dry air supply (b). A reduction of the current on the segments dominated by the cathode inlet (Fig. 1, columns G, H, and I) can be observed. This decrease was more pronounced at 0% RH (Fig. 7b) than at 20% RH (Fig. 7c) as a result of the lower (negative, i.e., drying) advection capacity of the cathode stream at 20% RH than at 0% RH. Indeed, it has already been claimed that this could be the reason for the voltage drop.9 Anyway, this slight voltage decline is regarded as acceptable (which is not the case at 80°C, see Fig. 2d), and it does not compromise the stability of the cell response, as observed in Fig. 7.
The experiment illustrated in Fig. 7c shows the interesting possibility of operating the cell at 60°C with dry gas supply on both anode and cathode. The plot of the voltage evolution displays how in the first 1000 s the voltage decreases by 50 mV, accompanied by a simultaneous current decrement in the segments of columns H and I located at the cathode inlet. However, after the first 1000 s a stable behavior was established, with no further changes in the current density distribution, thus demonstrating the possibility of operating the cell with dry gases.
Taking into account all the experiments performed at 60°C and 80°C, a stability map was generated summarizing the observed cell behavior. Figure 8 provides an intuitive mapping of the cell stability achievable at different RH of the anode and cathode feed streams. Colors are correlated with performance stability, and boundaries were defined using the experimental results reported in the previous sections, which are represented by hollow squares in the diagram. Looking at this chart, it is clearly seen that the relative humidity of the cathode is the min parameter controlling the performance stability: in fact, RH values on cathode side between 50% and 20% are critical to obtain a relatively stable behavior, while minimizing the level of RH. Table II summarizes the average and standard deviation values of the cell voltage corresponding to the most substantial experiments presented so far.
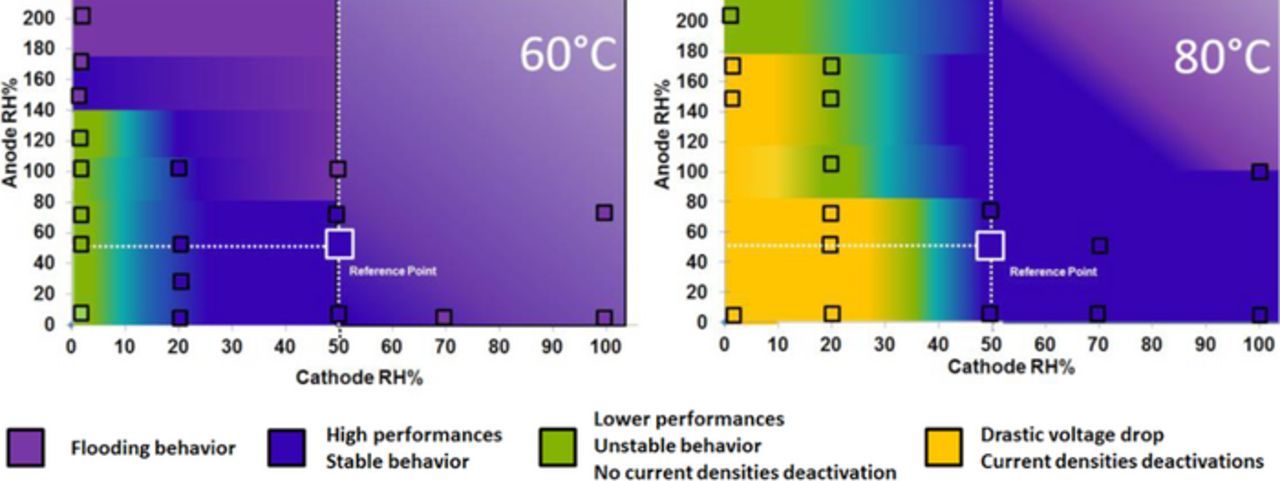
Figure 8. Relation between RH and cell performance stability. Squares represent the combination of RH conditions at anode and cathode adopted during the different experiments. Purple is used for flooding behavior, blue for high performances at stable condition, green for slight loss of performances with stable behavior, and orange for unstable behavior with deactivation.
Table II. Summary of voltage average (Avg) and standard deviation (STD) values from Figures 2, 3, 4, 5, 6 and 7; (D) indicates drastic voltage drop.
| 80°C | 60°C | ||||||
|---|---|---|---|---|---|---|---|
| Anode RH | Cathode RH | Avg (mV) | STD (mv) | Figure | Avg (mV) | STD (mv) | Figure |
| 100 | 100 | 645 | 5.38 | 2a | 611 | 6.14 | 5a |
| 50 | 50 | 645 | 493 | 2b | 615 | 3.15 | 5b |
| 20 | 50 | 645 | 5.21 | 2c | |||
| 50 | 20 | 490 | 68.80 (D) | 2d | 592 | 2.18 | 7a |
| 50 | 0 | 550 | 9.41 | 7b | |||
| 0 | 100 | 654 | 4.48 | 3a | 601 | 6.32 | 6a |
| 0 | 70 | 649 | 6.00 | 3b | 598 | 3.95 | 6b |
| 0 | 50 | 634 | 7.27 | 3c | 614 | 3.00 | 6c |
| 0 | 20 | 506 | 87.55 (D) | 3d | 581 | 6.12 | 6d |
| 0 | 0 | 544 | 10.48 | 7c | |||
| 175 | 20 | 573 | 19.68 | 4a | |||
| 140 | 20 | 548 | 12.01 | 4b | |||
| 120 | 20 | 540 | 22.74 | 4c | |||
| 100 | 20 | 502 | 21.43 | 4d | |||
| 70 | 20 | 489 | 42.98 (D) | 4e | |||
Global balance of water
In order to provide insight into the experimental results reported in the previous section, we present now a global balance of water for operating PEM fuel cells. It is well known that the net amount of water added to (or removed from) the cell is closely related to the flow rate and the water content of the inlet and outlet streams, and to the water production rate provided by the electrochemical reactions. A control volume analysis results in the following global balance of water for the cell
![Equation ([1])](https://content.cld.iop.org/journals/1945-7111/163/3/F150/revision1/d0001.gif)
which states that the net mass of water that accumulates in the cell per unit time (BOW) is equal to the water flow rates provided by the anode (mH2O,a,in) and cathode (mH2O,c,in) feed streams, minus the water flow rates removed from the cell by the anode (mH2O,a,out) and cathode (mH2O,c,out) outlet gases, plus the water production rate due to the oxygen reduction reaction (mH2O,P = I MH2O/2F, where MH2O is the molar mass of water and F is the Faraday constant). As previously discussed, all the experiments were carried out in galvanostatic mode with I = 100 A, hence the water production rate in Equation 1 remained constant at mH2O,P = I MH2O/2F = 9.32 · 10−6 kg/s = 33.5 g/h in all cases. Note that in principle a negative BOW means global dehydration of the cell, whereas a positive BOW indicates overall hydration.
Let us first consider the advection capacities of the anode (A) and cathode (C) streams, defined as the net mass of water that they supply or remove from the cell per unit time
![Equation ([2])](https://content.cld.iop.org/journals/1945-7111/163/3/F150/revision1/d0002.gif)
The advection capacities are obtained as the mass flow rate of water supplied by the inlet (i.e., feed) stream minus the water mass flow rate removed by the outlet stream.
A negative advection capacity indicates that the corresponding stream is drying (i.e. removing water from) its side of the cell, whereas a positive value means the stream is hydrating it. To determine the inlet and outlet mass flow rates some assumptions must be made. In particular, the mass flow rates of the feed streams are calculated assuming gas flows at the inflow conditions given in Table I. The anode feed is therefore considered a partially humidified hydrogen stream (at a given anode % RH) and the cathode feed a partially humidified air stream (at a given cathode % RH). By contrast, the outlet streams are assumed to be fully humidified gases, with mass flow rates that differ from those of the inlet streams due to the consumption of reactants and the generation of products by the electrochemical reactions. Thus, at the anode side (1.2 stoichiometry) the outlet stream carries only (1.2–1)/1.2 = 16.7% of the initial hydrogen flow, whereas at the cathode side (2.0 stoichiometry) the outlet stream carries only (2–1)/2 = 50% of the initial air oxygen flow. As a result, the outlet streams are able to carry less water than the corresponding inlet streams at the same RH, something that has a relevant impact on global water management, as will be seen below.
Figure 9 shows the variation of the advection capacities A and C with the relative humidity of the anode and cathode feed streams without considering electrochemical water production for the cell operating at 60°C (Fig. 9a) and 80°C (Fig. 9b). As can be seen, the advection capacity of the anode stream is typically positive (except close to dry conditions), whereas that of the cathode stream is typically negative and large (except at very high inlet humidification levels). This is due to the higher reactant consumption in the anode side relative to the reactant inflow rate. This makes that even a fully humidified anode outlet stream carries a very small amount of water, which would reduce to zero in the limit of a dead-end configuration. According to the numerical results shown in the figure, the anode stream hydrates the cell above 20% RH, while the cathode stream hydrates above 90% RH, regardless of the cell temperature. For reference purposes, Fig. 9 also shows the variation of the advection capacity of the cathode stream with the RH of the air supply for cases where the outlet gases are not fully humidified. As can be observed, since the outlet stream removes less water when it is partially humidified, the advection capacity becomes less negative, reaching positive values for humidification levels of the air supply below 90% RH. At 80°C there is a reduction of the cathode advection capacity close to 1 g/h per 1% RH reduction, whereas at 60°C the reduction is about 0.2 g/h per 1% RH reduction. The effect of reducing the humidification of the outlet gases on the anode side is negligible compared to that of the cathode.
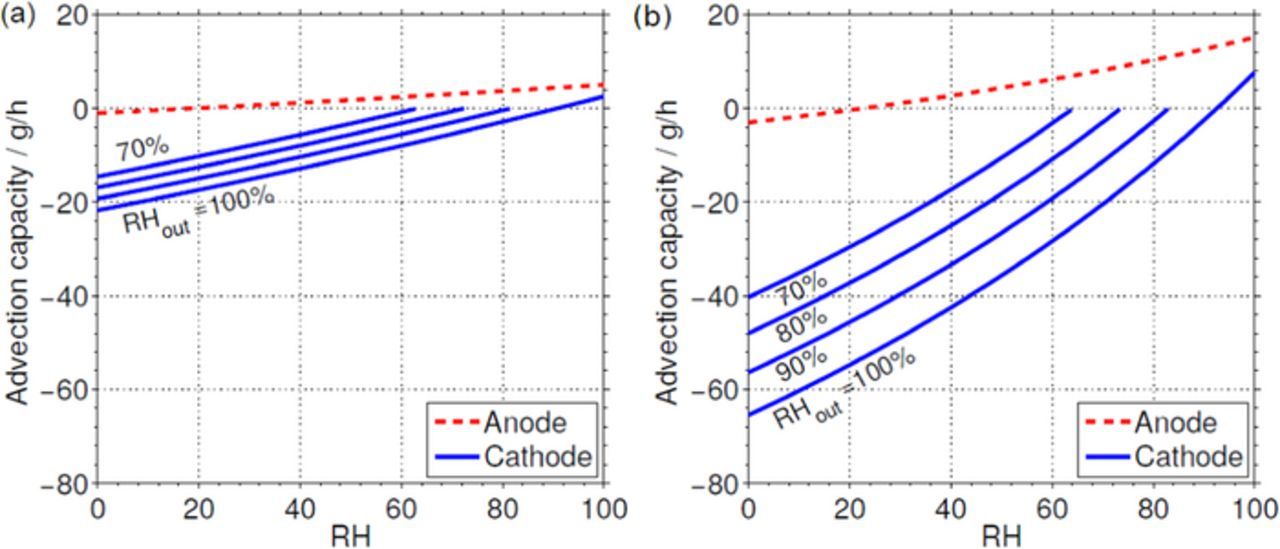
Figure 9. Advection capacities of anode and cathode streams at a) 60°C and b) 80°C. Different relative humidities of the outlet cathode stream are considered for reference purposes.
Figure 10 shows BOW isocontours obtained from Equation 1 for different relative humidities of the anode and cathode streams, superimposed onto the experimentally measured cell voltages, shown as the background color map. It is observed that in most cases a positive BOW implies stable cell behavior (voltage ≥ 0.6 V). At 80°C (Fig. 10b) the experimental results show severe deactivation for cathode RH conditions below 50%. At such low water contents, the calculated BOW indicates cell dehydration regardless of the anode RH condition. Note that even a fully saturated anode stream can hardly compensate the cell drying due to the significantly lower anode mass flow rate compared with that of the cathode. At 60°C (Fig. 10a) only slight voltage losses were observed at low humidity conditions due to local deactivation at the gases inlets, but no global dehydration of the cell is observed, in agreement with the positive BOW obtained for all anode and cathode RH conditions.
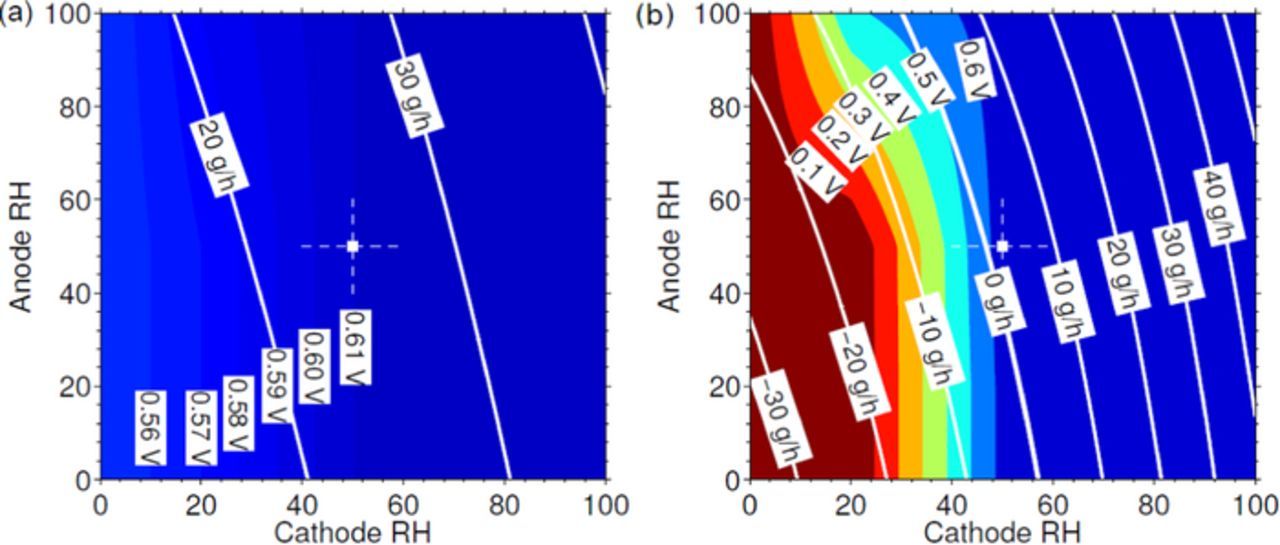
Figure 10. White lines represent BOW isocontours in g/h for a) 60°C and b) 80°C, and the underlying color map shows the cell voltages obtained experimentally, expressed in Volts. The color scale uses blue for stable conditions and red for severe deactivation. The reference conditions (50% RH at both anode and cathode) are indicated by a white cross. As can be seen, negative values of BOW are clearly correlated with the deactivation of the cell, as shown in the experiments at 80°C.
It is interesting to note that any non-zero value of BOW is incompatible with steady cell operation under the assumptions stated above; particularly, the assumption of fully humidified outlet gases must be revised for both positive and negative BOWs. On one hand, if the cell is operated with a positive BOW, water is being accumulated in the system. However, this accumulation could be easily removed by any condensate water being expelled at the outlet. Thus, for small positive BOWs a new stable regime may be reached where liquid water accumulating inside the cell is periodically removed by small water droplets leaving the cell. On the other hand, a negative BOW produces a continuous drying of the cell. In that condition the outlet streams may not reach full humidification. For slightly negative BOWs a new stable condition could also be reached with a new equilibrium relative humidity of the outlet gases slightly below 100%; for example, our experiment at 80°C with dry anode and 50%RH cathode feed is stable even with a small negative BOW. The new stable conditions attained with small positive or negative BOWS cannot be sustained either for large positive BOWs, which lead to flooding, or large negative BOWs, which lead to membrane dehydration, both cases being incompatible with stable cell behavior.
Figure 11 shows the estimation of the global balance of water for a range of inlet relative humidities similar to that considered in the experimental campaign. The color scale has been chosen so as to reproduce the qualitative behavior of the cell shown in Figure 8. As can be seen, Figs. 8 and 11 have a qualitatively similar aspect, with all stable conditions being correlated with positive values of BOW. For reference purposes, in Figure 11b the negative BOW isocontours have been substituted by the relative humidity at the outlet gas streams (assumed equal for anode and cathode) that gives zero BOW.
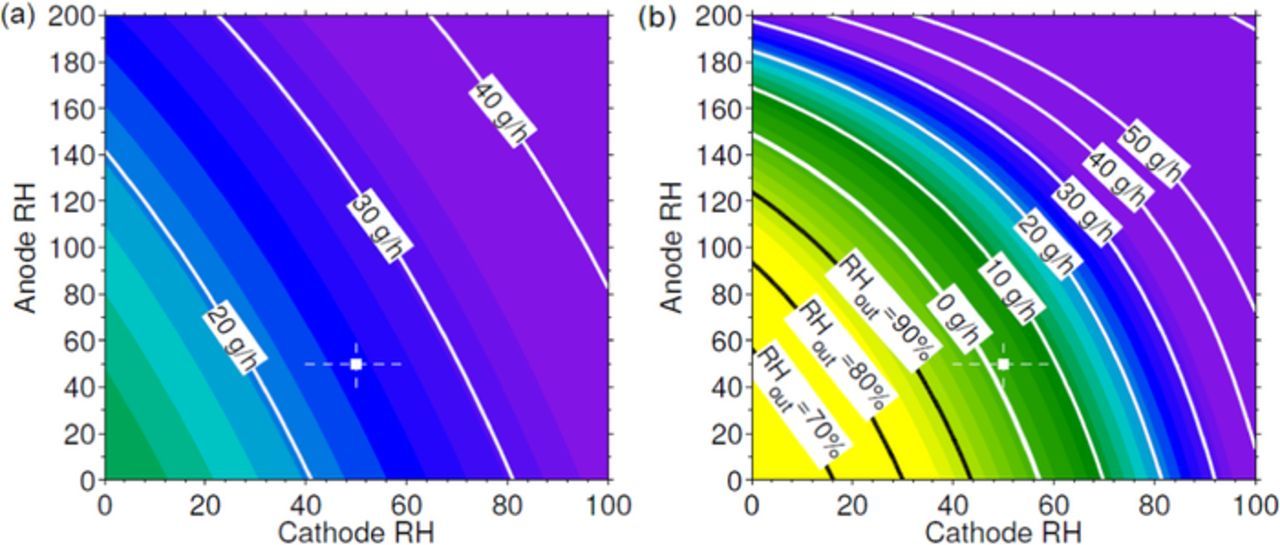
Figure 11. Estimation of the global balance of water (BOW) in g/h at a) 60°C and b) 80°C. The reference conditions (50% RH at both anode and cathode) are indicated by a white cross. Color scale represents a qualitative behavior of the cell. Blue is used for high performances at stable condition, purple for flooding behavior, green for slight loose of performances with stable behavior and yellow for unstable behavior with deactivation. As shown, BOW at 60°C is always positive and the cell behavior remains always stable. In contrast, at 80°C BOW is negative for low cathode RH conditions which evidences unstable cell performances. Negative BOW levels have been substituted by lines that indicate the relative humidity of the outlet streams that gives zero BOW.
Energy analysis
During cell operation, the anode and cathode feed streams must be conveniently heated and humidified. In this section we shall evaluate the amount of energy required for the conditioning process in all the conditions tested in the experiments, and compare this value with the residual heat available in the cell. Several models have been proposed in the literature for the evaluation of the required energy.41–48 These models are based on a series of assumptions that are commonly adopted for the calculations: the cell is assumed to operate in steady state; cathode and anode inflow and outflow streams are considered mixtures of ideal gases; the temperature of the cell is assumed uniform due to its high thermal conductivity; and, finally, product water is assumed to be either in liquid or gaseous phase. In this work, the water produced by the oxygen reduction reaction will be assumed to be in liquid phase, so that the enthalpy of reaction to be used is the higher heating value.48 In this case, the latent heat of evaporation required to vaporize the liquid product water must be included in the energy balance, since, as previously discussed, we assume that the anode and cathode outlet streams are completely gaseous. This assumption may not be correct for the flooding conditions, but those cases are out of the scope of this work, which is devoted to the study of low humidification conditions.
The sensible heat used to heat the feed streams, QSEN, must include all the species entering the anode and cathode sides. The anode feed contains hydrogen and water, whereas the cathode feed contains oxygen, nitrogen, and water, so we may write
![Equation ([3])](https://content.cld.iop.org/journals/1945-7111/163/3/F150/revision1/d0003.gif)
where mi,a/c,in and cp,i are the inlet (anode/cathode) mass flow rate and heat capacity of species i, respectively, T0 = 15°C is the temperature of the gaseous supply line, and TCELL is the operating temperature of the cell.
The latent heat, QLAT, measures the amount of energy required to vaporize the water employed to humidify the anode and cathode streams
![Equation ([4])](https://content.cld.iop.org/journals/1945-7111/163/3/F150/revision1/d0004.gif)
where Hlv = 2257 kJ/kg is the enthalpy (or latent heat) of the liquid-vapor phase change.
The total heat used to condition the feed streams, QHUM, is given by the sum of the sensible and latent heats
![Equation ([5])](https://content.cld.iop.org/journals/1945-7111/163/3/F150/revision1/d0005.gif)
Figure 12 shows the condition heat, QHUM, separately for the anode and cathode streams at the two cell temperatures studied in this work. It should be noted that the cathode side requires substantially more power due to its significantly higher mass flow rate. In addition, for 80°C the required thermal power is 2.5 times that for 60°C due to the larger amount of water that must be vaporized to reach the same RH.
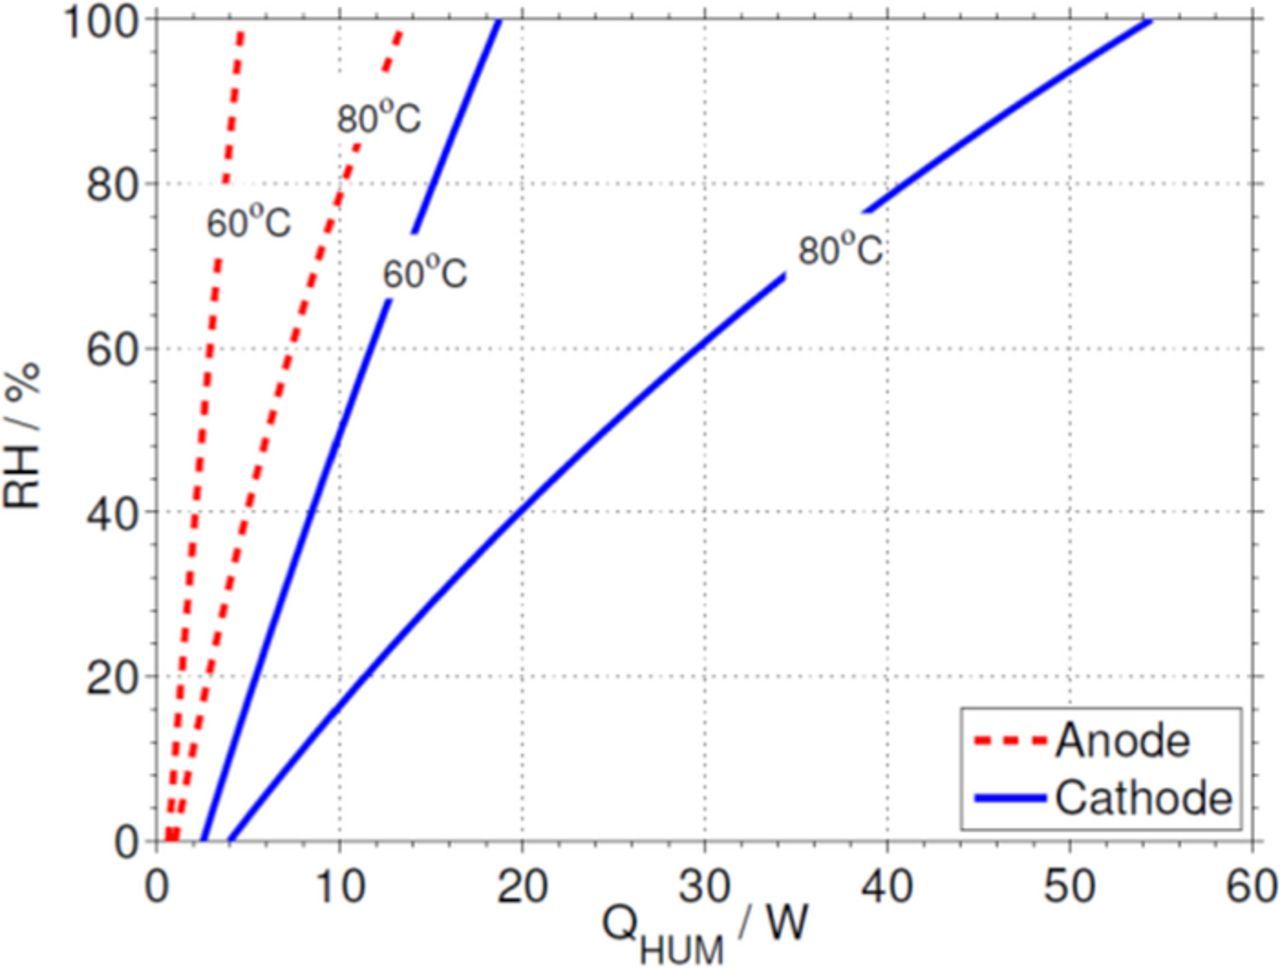
Figure 12. Condition heat QHUM for the anode and cathode streams at different cell temperatures. The condition heat is nearly 4 times higher for the cathode than for the anode due to the larger mass flow rate involved, whereas it is nearly 2.5 larger at 80°C than at 60°C for both electrodes.
The heat required to evaporate the liquid product water, QP, is estimated as Hlv times the liquid water production rate mH2O,P introduced in Equation 1
![Equation ([6])](https://content.cld.iop.org/journals/1945-7111/163/3/F150/revision1/d0006.gif)
As previously discussed, for the conditions tested in the experiments (I = 100 A), water was produced at a rate of mH2O,P = 33.5 g/h, resulting in a heat of evaporation of QP = 21.0 W.
The electrochemical reaction releases a certain amount of heat, QRES, which must also be accounted for in the energy balance. This term is estimated as the difference between the theoretical energy that can be produced by the electrochemical reaction, QTH = I · ETH, and the electrical power actually produced, WELEC = I · V,
![Equation ([7])](https://content.cld.iop.org/journals/1945-7111/163/3/F150/revision1/d0007.gif)
where ETH denotes the thermoneutral voltage, and V is the actual cell voltage. Since water is assumed to be produced in liquid phase, the higher heating value must be used in the evaluation of ETH = ΔHHHV/ 2F.41–48 Note that the ratio between the electrical power, WELEC, and the theoretical heat of reaction, QTH, also given by the ratio between the cell voltage, V, and the thermoneutral voltage, ETH, is the so-called voltage efficiency of the cell η = WELEC/QTH = V/ETH.
Summarizing, the net heat available during cell operation is that given by the residual heat, QRES, minus the heat used to evaporate water production, QP,
![Equation ([8])](https://content.cld.iop.org/journals/1945-7111/163/3/F150/revision1/d0008.gif)
In Fig. 13 this heat is compared with the total heat required to condition the feed streams, QHUM, given by Equations 3–5. As can be seen, at both operating temperatures (60°C and 80°C) the estimated condition heat is always lower than the available heat, even for fully humidified gases. As a result, in our particular experimental setup the condition heat could always be provided by the available residual heat regardless of the anode and cathode RH conditions.

Figure 13. White contour plots show the total condition heat QHUM in Watts at a) 60°C and b) 80°C. The color map represents the residual heat QRES. The reference conditions (50% RH at both anode and cathode) are indicated by a white cross. Due to the stability of operation at low humidification conditions, QRES remains approximately constant at 60°C, whereas it shows a large increase at low cathode RH due to the reduction of the voltage efficiency of the cell, accompanying severe cell dehydration. QHUM is significantly lower at 60°C than at 80°C, being dominated by the cathode side in both cases.
In case the outlet streams where not completely gaseous, as was assumed here, but there was some liquid water instead, as expected for those conditions with a positive BOW (e.g., flooding conditions), the latent heat required to evaporate the gaseous fraction of the product water would be smaller than QP, and therefore the available heat would be larger than QAVAILABLE. As a result, the hypothesis of fully gaseous gases at the outlets does not invalidate the main result of the energy analysis, namely, that the available heat is always higher than the condition heat required to heat and humidify the inlet streams.
As an illustrative example, decreasing the relative humidity of both streams at 80°C from 100% to 50% and 20% reduces the power used for humidification respectively to about 45% and 21% of that corresponding to fully humidified gases. Note that in this experiment the power required to reach 100% RH on the anode and cathode streams is about 13.5 W (anode) + 54.5 W (cathode) = 68 W, which is roughly the residual heat available at those conditions. At 60°C the power reduction is to about 54% and 29% of that corresponding to fully humidified gases, but in this case the power required to reach fully humidified gases is 4.6 W (anode) + 18.7 W (cathode) = 23.3 W, which is about one third of the available residual heat.
It should be emphasized that the results of the energy balance presented here could not be directly extrapolated to commercial stacks due to our particular experimental conditions. However, the same methodology could be used to assess whether the heat available at certain operating conditions would be sufficient to condition the anode and cathode feeding streams.
Conclusions
This work has investigated the influence of the relative humidity of the inlet gases on the cell stability and current density distributions. The experimental results show that the relative humidity of the cathode is the main parameter controlling the performance stability of the cell, with RH values on the cathode side between 50% and 20% being critical to obtain a relatively stable behavior. The results of a simple global balance of water (BOW) model seem to correlate satisfactorily with the reported stability conditions. The proposed model could therefore be used as a fast evaluation tool for predicting the stability of a certain operating condition. Nevertheless, similar tests should be carried out using different current densities and channel configurations to validate the model in more general situations.
An overall energy analysis, which accounts for the sensible heat required to increase the temperature of the feeding streams to the cell operating temperature and for the latent heat of vaporization required to humidify the gases to the desired RH, has revealed a remarkable positive energy balance at 60°C. The total heat used to condition streams at 80°C is almost three times larger than at 60°C, although it could still be provided by the available residual heat.
Due to operational stability at low humidification at 60°C, this seems to be the most efficient condition for our particular cell configuration, despite the small reduction of approximately 6% in cell power output with respect to 80°C. The application of this methodology to commercial stacks could be helpful to asses if the heat available under a given operating condition could be enough to condition the anode and cathode feeding streams.
The instable behavior, occurring as consequence of low humidification at the cathode, could be compensated using very high values of RH at the anode side.
Acknowledgments
This work has been partially supported by the European Union's Seventh Framework Programme (FP7/2007-20013) for Fuel Cell and Hydrogen Joint Technology Initiative under grants no 303446 and 325239, and by Project ENE2011-24574 of the Spanish Ministerio de Economía y Competitividad. Authors would also like to thank H. Sander at DLR and P. García-Ibarra at the Dept. de Física Matemática y de Fluidos (UNED) for helpful suggestions and discussions.