Abstract
Zirconium oxide based conversion coatings are nickel-free alternatives to trication phosphate coatings. Here, the role of intermetallic inclusions in aluminum alloy AA6014 on the formation of Cu-rich particles inside ZrO2-based conversion layers with a film thickness of 25-30 nm was investigated. The role of the intermetallic inclusions on the deposition mechanism was characterized by varying the immersion time of the substrate and analyzing the coatings by electron microscopy and atomic force microscopy. Statistical analysis on the growth of the copper rich particles showed instantaneous nucleation of these particles, with a subsequent homogeneous in-plane growth at constant height. A strong preferential nucleation of the Cu-rich particles on the intermetallic particles was observed, and was attributed to the cathodic nature of the intermetallics. Raman spectroscopy indicated the presence of crystalline CuO and amorphous ZrO2 in the film. Enhanced layer formation in the vicinity of intermetallic particles was observed.
Export citation and abstract BibTeX RIS

This is an open access article distributed under the terms of the Creative Commons Attribution Non-Commercial No Derivatives 4.0 License (CC BY-NC-ND, http://creativecommons.org/licenses/by-nc-nd/4.0/), which permits non-commercial reuse, distribution, and reproduction in any medium, provided the original work is not changed in any way and is properly cited. For permission for commercial reuse, please email: oa@electrochem.org.
Conversion coatings are widely used to protect metal surfaces from corrosion and to promote the adhesion of subsequently applied organic paints.1 While phosphate-based conversion coatings still have a large range of applications and some aspects of their formation are subject to more recent work,2,3 current efforts focus on the replacement of conventional, µm thick phosphate and chromate containing systems by thin coatings that results in layers with an average thickness of just few tens of nm, without toxic ingredients.4-7 One class of candidates are rare-earth based coatings.4,6,8-10 Other candidates are nanoceramic conversion coatings, typically containing zirconium or titanium oxides. Such coatings are either deposited on the surface by sol-gel chemistry, or by immersion into a fluoric acidic of Zr/Ti. Nanoceramic coatings have been shown to provide good multi-metal corrosion protection for various substrates including steel, zinc, and Al alloys,11-17 and combine good corrosion performance with excellent adhesion properties.5,18-22
A lot of work has been specifically focused on investigation of zirconium or titanium based pretreatment on Al alloys. Their basic film formation mechanism is (i) fluoride etching of the oxide layer (which can be replaced by alkaline treatment),23 (ii) onset of hydrogen evolution reaction, i.e. water reduction with a consequent increase in pH near the interface, and (iii) subsequent precipitation of oxyhydroxides as oxide precursors.24-27 Inclusion of CuII salts (or alternatively, Fe salts) in the bath has been shown to lead to higher overall growth rate of the film on cold rolled steel compared to the solutions without CuII.25,28 Coatings prepared by including copper in the solution were also shown to be thicker and showed enrichment of copper within the conversion film.25,28 Painted cold-rolled steel pretreated with a Cu-containing ZrO2-based coating shows low frequency impedance moduli comparable to painted phosphate pretreated steel.25 Further, the mechanism was discussed of deposition of a Cu-containing ZrO2-based conversion coating on a variety of substrates including AA6014.29 The presence of Cu was shown to be the driving force behind the increase in pH on the substrate which leads to a more homogeneous deposition.30 Differences have been reported in the Cu distribution between the different substrates steel, zinc, and aluminum alloys, where especially on AA6014 large inhomogenities have been found.30 So far, the nucleation times and mechanism of the Cu particles present on the surface have not been investigated, which is one of the major motivations for this work. As metallic Cu is unlikely to nucleate on a surface that is already covered with ZrO2, the competition between Cu deposition and ZrO2 deposition may lead to interesting co-localisation phenomena. A further aim of this work is to correlate the spatial distribution of Cu particles on the surface with features present in the substrate. Al alloys are particularly interesting in this regard, because of the presence of intermetallic inclusion.
The presence of intermetallics in Al alloys is required to achieve specific mechanical properties.31 On the other hand, intermetallics often also function as hot spots for any electrochemical surface processes. For example, they effectively accelerate filiform propagation in under-paint corrosion processes.32,33 Intermetallic removal does not, however, prevent filiform propagation.34 Previous studies have shown that intermetallics present on the surface are preferential nucleation sites for coatings because of their cathodic nature and it is clear that these properties vary depending on the exact alloy composition.34-36 Concerning deposition of nanoceramic conversion coatings, direct evidence has been presented that intermetallic particles act as local cathodes, leading to increased pH in the region of the intermetallic particles, and subsequently to increased deposition of TiO2/ZrO2-based conversion coatings in the absence of Cu.36,37 The inhomogeneity of the deposition can be affected by stirring (convection).37 Because intermetallic particles act as local cathodes, preferential deposition of nanoceramic conversion coatings has been observed near the boundaries of the intermetallics, which limited the formation of a good quality conversion layer in the absence of Cu.36,37
In this paper, a nanoceramic pretreatment, which is based on hexafluorozirconic acid, was applied to Al alloy AA6014 in the presence of CuII in the deposition bath. The structure and morphology of the conversion layer was investigated. In addition to a detailed structural characterization of the layers, the time dependence of the formation of small particles on the surface was studied, with the aim to obtain information on the nucleation mechanism (instantaneous vs. progressive) of Cu particles. To that end, quantitative image analysis of scanning probe microscopy images was performed. Special emphasis is put on the analysis of the local structure of the resulting coatings around intermetallic particles.
Experimental
Materials and sample preparation
Samples of Al alloy AA6014 were used as substrates. AA6014 contains < 0.25 wt-% Cu, < 0.35 wt-% Fe, 0.4-0.8 wt-% Mg, and 0.3-0.6 wt-% Si as major alloy elements.38,39 Samples were stepwise abraded with SiC polishing paper from 600 to 4000 grit, then polished with 1 µm diamond paste (in ethanol) and subsequently ultrasonicated in ethanol. Afterwards, the sample surfaces were immersed for 3 min in an alkaline cleaner solution at pH 10.9 and 55°C. This alkaline cleaner solution contained 3% of alkali-containing Ridoline 1574 and 0.3% of surfactant component Ridosol 1270 (Henkel, Düsseldorf, Germany). After rinsing with deionized water, pretreatment was conducted by immersion of the substrate surfaces for 5 to 120 s in a modified hexafluorozirconic acid solution (Henkel, Düsseldorf, Germany) that contained < 200 mg L− 1 Zr and < 50 mg L− 1 Cu, as used in other works.25,30 The solution contains fluoride, as a hydrolysis product of hexafluorozirconic acid. The pH of the solution was adjusted to 4 by using Neutralizer 700 (Henkel, Düsseldorf, Germany). All samples were rinsed with deionized water and dried in a nitrogen stream after the thin film deposition process. This preparation procedure results in surfaces that are rich in intermetallic particles.
Instrumentation
X-ray photoelectron spectra (Quantum 2000, Physical Electronics, USA) at a take-off angle 45° were obtained using a monochromatic Al Kα source (1486.6 eV) at a pass energy of 23.5 eV with an energy resolution of 0.2 eV. Depth profiles were recorded by argon plasma sputtering with 2 kV, a current of 2 mA and a rate of 3.2 nm min− 1 calibrated for the actual ZrO2-based conversion layer system. It should be noted that the sputtering will always cause a local roughening of the surface and smear out the transition from one medium to the next.
By means of a JAMP-9500F (JEOL, Tokyo, Japan), Auger electron spectroscopy (AES) was performed. Before measuring, sample surfaces were cleaned by a 60 s argon sputtering step with 1 kV, a current of 450 nA (corresponding to 3.8 nm with the sputter rate of SiO2), to avoid effects from surface contamination. Spectra were detected at an angle of 30° at a voltage of 5 kV and a beam current of 5 nA which results in a spot size of 30 nm. Quantification was done using the peak-to-peak ratio in differentiated spectra with consideration of the sensitivity factors.
Scanning electron microscopy (SEM) was performed with a Zeiss Leo 1550VP Gemini (Carl Zeiss SMT AG, Germany). Images were obtained in secondary electron contrast with an acceleration voltage of 5-10 kV and a working distance of 5-7 mm. The microscope is equipped with an energy dispersive X-ray spectrometer (EDX; Oxford Instruments).
Surface topography analysis was conducted using a JPK NanoWizard Atomic Force Microscope (AFM; JPK Instruments AG, Berlin, Germany). Topography images were recorded in tapping mode employing Si micro-cantilever tips with radius < 10 nm and a resonant frequency of 318 kHz. The statistical analysis of the particles detected by AFM was carried out by the threshold technique over AFM images using Gwyddion software version 2.28.40
Raman spectra were recorded on a Horiba Jobin Yvon Labram confocal Raman microscope with an excitation wavelength of 514 nm.
Results and Discussion
Structure of the ZrO2-based conversion coatings
In agreement with previous studies,25,26,36,41 the thickness of the layers obtained was found to be 25-30 nm by XPS sputter depth profiling. The layers consisted mainly of Zr, Cu, and O.
The pre-treated polished AA6014 surfaces were imaged by SEM after a deposition period of 120 s. Figure 1 shows several characteristic features, which partially are revealed from image contrast: bright, inhomogeneously shaped particles in the µm-regime are intermetallic particles, as is shown by EDX below (Figure 2). Although these particles form on the surface in the initial stages of the preparation process, their electrochemical effects can be considered as identical to those of inclusions, which are much less abundant on the surfaces. Smaller, circularly shaped bright particles in the sub-µm regime appear to be randomly distributed all over the Al surface. However, a detailed analysis reveals a preferential localization along Al-grain boundaries (see, for example, the marked area in Figure 1a). Dark regions around some of the intermetallic particles result from lower secondary electron emission that causes contrast enhancement due to topographical inhomogenities (Figure 1b).
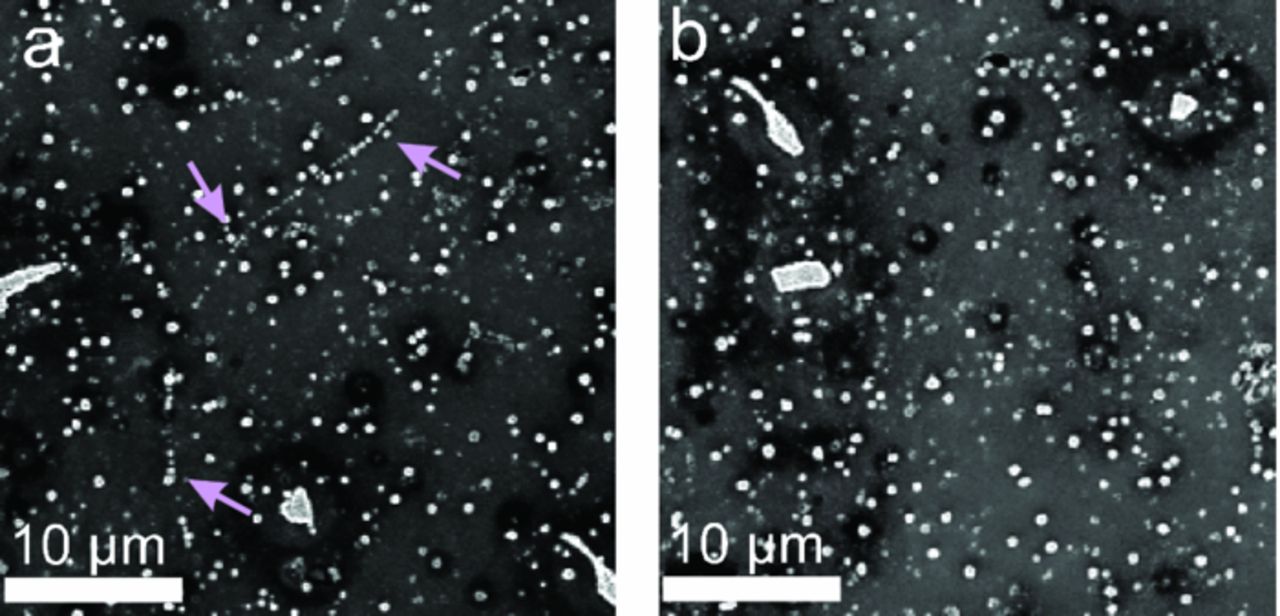
Figure 1. SEM images of two representative regions of a conversion film coated AA6014 surface (immersion time: 120 s). (a) Preferential deposition of "chains" of small particles highlighted by arrows. (b) Darker regions are found in the vicinity of the intermetallic particles.
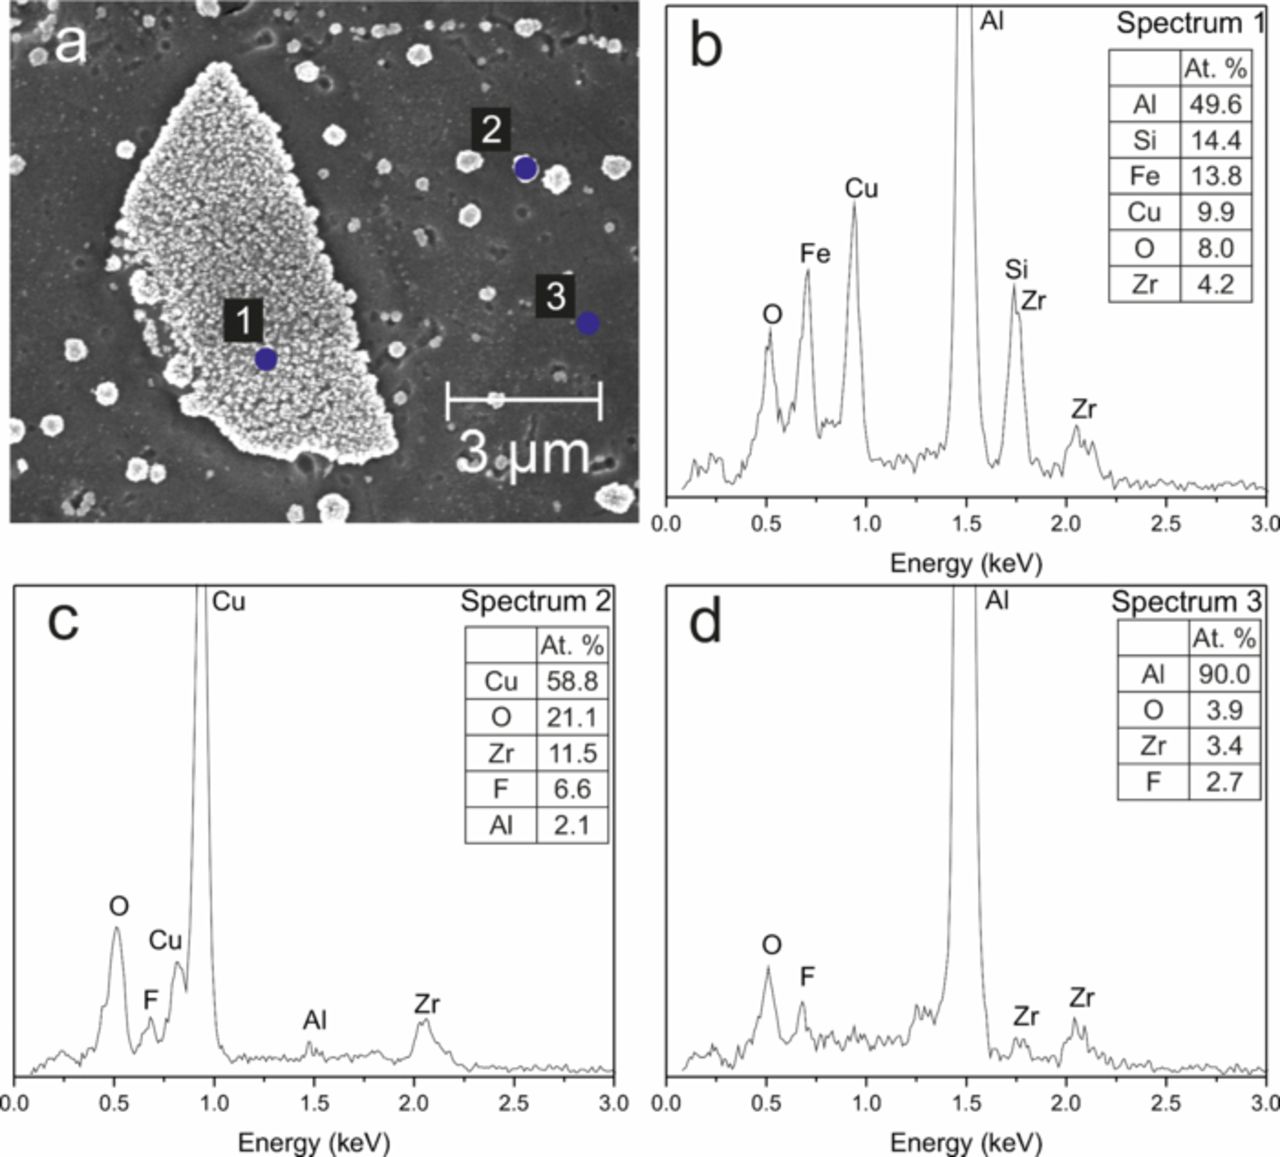
Figure 2. (a) SEM image of an intermetallic particle and surrounding area on an AA6014 surface coated (immersion time: 120 s) with a ZrO2-based conversion coating. (b), (c) and (d) EDX spectra measured at points 1, 2 and 3, respectively, marked in (a). The composition at the respective points is given in the inset.
A previous investigation of deposition kinetics of zirconium oxide around intermetallic particles on AA6060 alloy surfaces during sample immersion in H2ZrF6 in the absence of Cu salts reported an increased zirconium oxide deposition around the intermetallic particles.37 Increased deposition was attributed to the cathodic particle nature of the intermetallic particles, and the local alkalization from the ongoing oxygen reduction on the intermetallic particles.37
Figure 2 shows different point EDX spectra recorded on the particles. Spectrum 1 was recorded on top of the larger intermetallic particle and shows the presence of Fe and Si along with the elements from the conversion coating. These elements are present as alloy elements in AA6014. Focusing on the smaller particles (spectrum 2) shows that these particles had a very high Cu content - because of the relatively low lateral resolution of EDX, a certain radius of the surrounding contributed to the spectra. Furthermore, spectrum 3, which was recorded on an area without any particles, shows Al along with Zr. However, no detectable amount of Cu was observed. Based on these measurements, it can be inferred that the majority of the Cu deposited was concentrated on the intermetallics and the Cu-rich particles. Cu-rich particles were also observed on the Al-rich surface areas. Therefore, a significant part of the deposited Cu originated from the solution. Nevertheless, contributions from dissolved Cu from the bulk alloy cannot be completely excluded.
Because of its large sampling volume, EDX is not suitable for surface analysis. Consequently, to investigate the composition of the outermost surface layers, AES was employed. Figure 3 shows two different regions of a conversion film coated AA6014 surface. Figure 3a shows Cu-rich particles, and Figure 3b shows a part of an intermetallic particle. In both images, points 1 and 2 were measured on top of the particles and point 3 and 4 were measured off the particles. The atomic ratio Cu/Zr is given below the respective image. Both components originated from the pretreatment solution. It is apparent from the table that the Cu content was higher on the intermetallic and the Cu-rich particle, as compared to off the particles, i.e. on the Al-rich part of the AA6014 surface. Moreover, the fraction of Zr was always higher than that of Cu on all points. The high percentage of Zr being detected indicates the presence of an ultrathin layer of ZrO2 covering all regions of the surface, i.e. on Al-rich regions, intermetallic particles as well as Cu-rich particles.
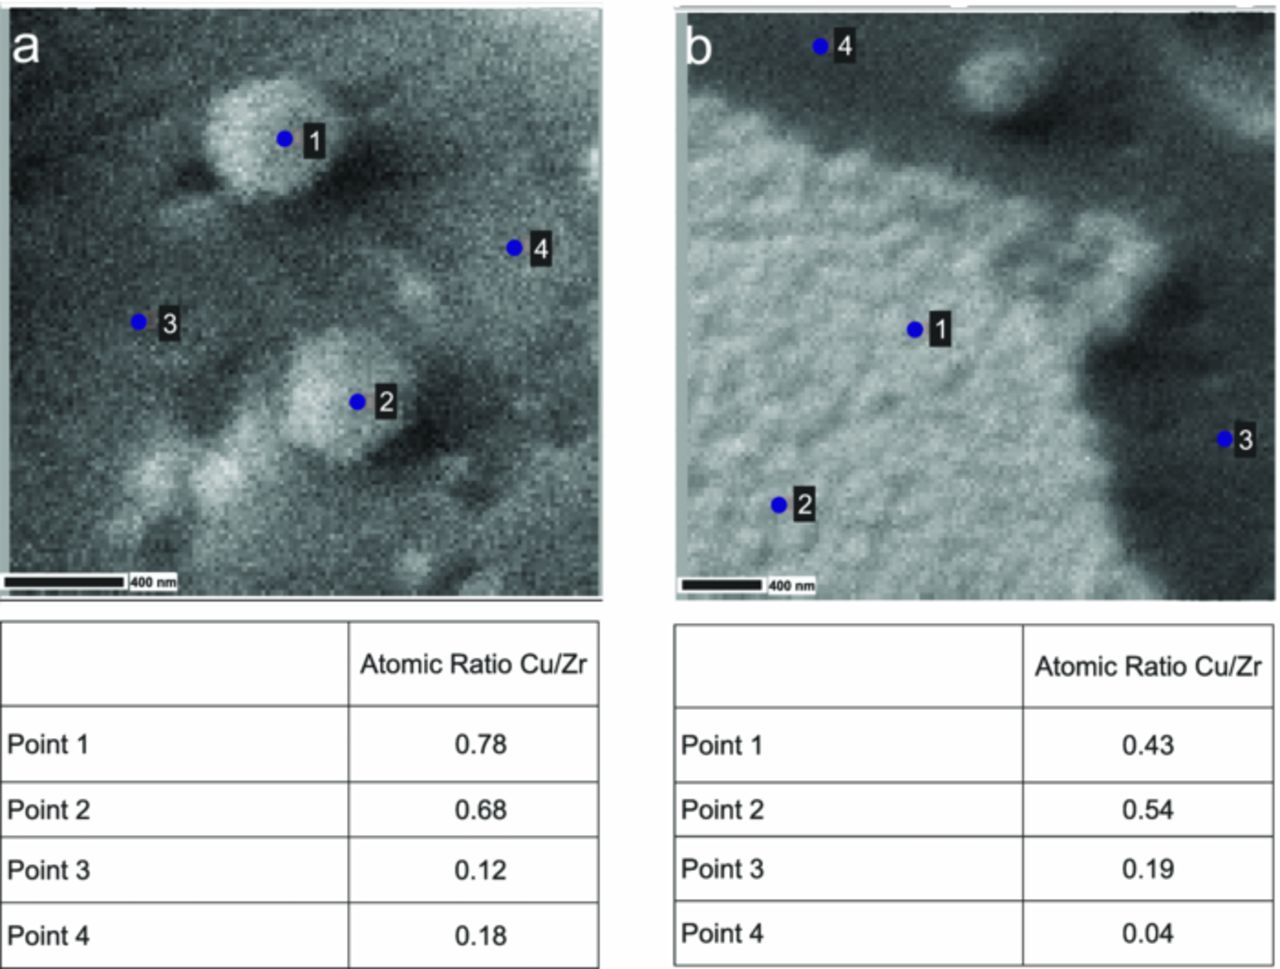
Figure 3. SEM image with points used for AES analysis of a pretreated AA6014 surface after 120 s immersion time, (a) on and near a small Cu-rich particle and (b) on and near a big intermetallic particle. Below the respective image, the atomic ratio Cu/Zr at different points is given.
Comparing the results from the two elemental analysis techniques EDX and AES, shows apparently contradictory results. AES shows a higher concentration of Zr, whereas in the EDX analysis of both intermetallic and Cu-rich particles, the Cu concentration is higher. This apparent inconsistency originates from the different sampling depths of the two techniques. AES is extremely surface sensitive (few atomic layers), whereas most of the signal from EDX results from the subsurface region. This explanation in turn supports the conclusion that the Cu particles and the intermetallic particles were covered with a ZrO2 layer, as was the Al surface.
The Raman spectrum of a pretreated AA6014 substrate is shown in Figure 4. The major peaks observed in the spectrum at 297 and 628 cm− 1, with a shoulder at 343 cm− 1 are characteristic for crystalline tenorite CuO.42-45 Cu2O is expected to show signals at 151, 280 and 650 cm− 1,45,46 which are not observed here. The broad peak present at 1110 cm− 1 is assigned as the second harmonic of the Bg mode of CuO at 628 cm− 1. The spectra obtained closely resemble those of particle sizes well above 100 nm in a systematic investigation of the particle-size dependence of the fundamental modes of CuO.47 Hence, the CuO present in the conversion coatings is crystalline. The second major component of the conversion coating ZrO2 is interestingly exhibiting only a few weak peaks in the Raman spectrum at 233 and 470 cm− 1.48 In a study of the temperature-dependent crystallization of ZrO2, featureless Raman spectra of amorphous ZrO2 were obtained at temperatures below 200°C, while peaks were only observed after annealing to higher temperatures.48 The absence of any major peaks from ZrO2 in Figure 4 can be treated as an indication of its amorphous form in the conversion coating. On the other hand, metallic Cu is known to enhance Raman scattering intensities, leading to surface-enhanced Raman spectra (SERS).49 As CuO may be present in the vicinity of metallic Cu, its dominance of the Raman spectrum may be caused by the presence of SERS.
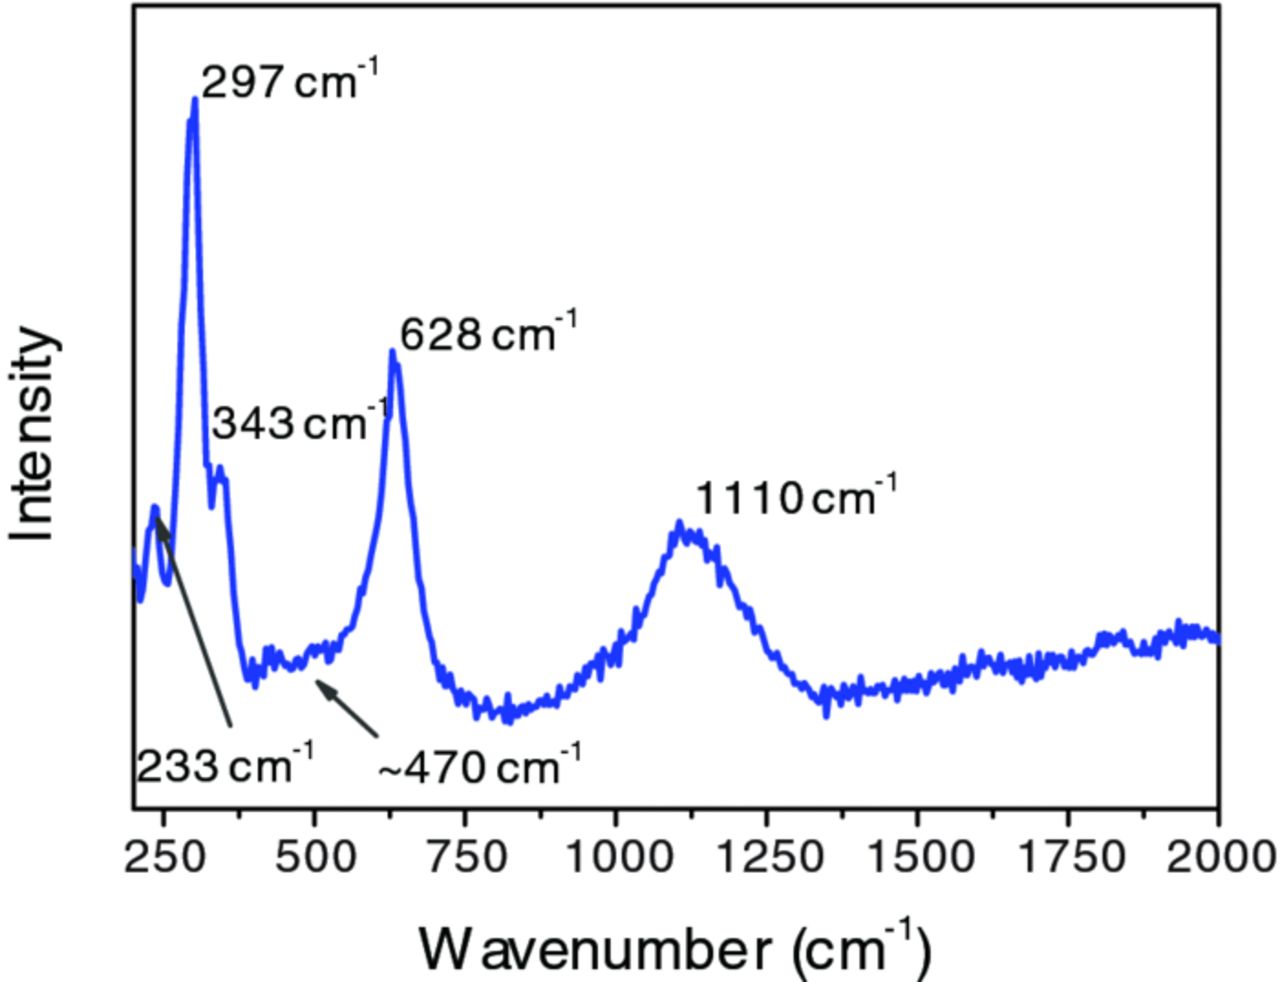
Figure 4. Raman spectrum of the ZrO2-based conversion coating on AA6014 substrate (immersion time: 120 s).
The nature of the Cu in the films can be further analyzed from the Cu 2p region of the XP spectrum. Figure 5 shows detailed XP spectra of Cu present in the conversion layer. The Cu 2p spectrum from the surface shows the presence of CuII (Cu 2p3/2 at 933.8 eV) along with a second peak which originates from metallic Cu in the film (Cu 2p3/2 around 932 eV).50 After a sputtering step, the peak of metallic Cu becomes more prominent. Further, the CuII satellite peak is absent. Comparing the Cu LMM Auger peaks it also becomes clear that the surface of the conversion coating contained oxidized copper, whereas below the surface the film was composed mainly of copper in metallic form. (The possibility of reduction during the sputtering process cannot be completely excluded, however.) As has been shown by EDX and AES (Figure 2 and Figure 3), Cu is concentrated on the Cu-rich particles and intermetallics. The presence of CuO on the surface and metal inside the film indicates that during deposition, Cu deposited in metallic form. Subsequently, either in the liquid bath or upon contact with air, the top layer oxidized.
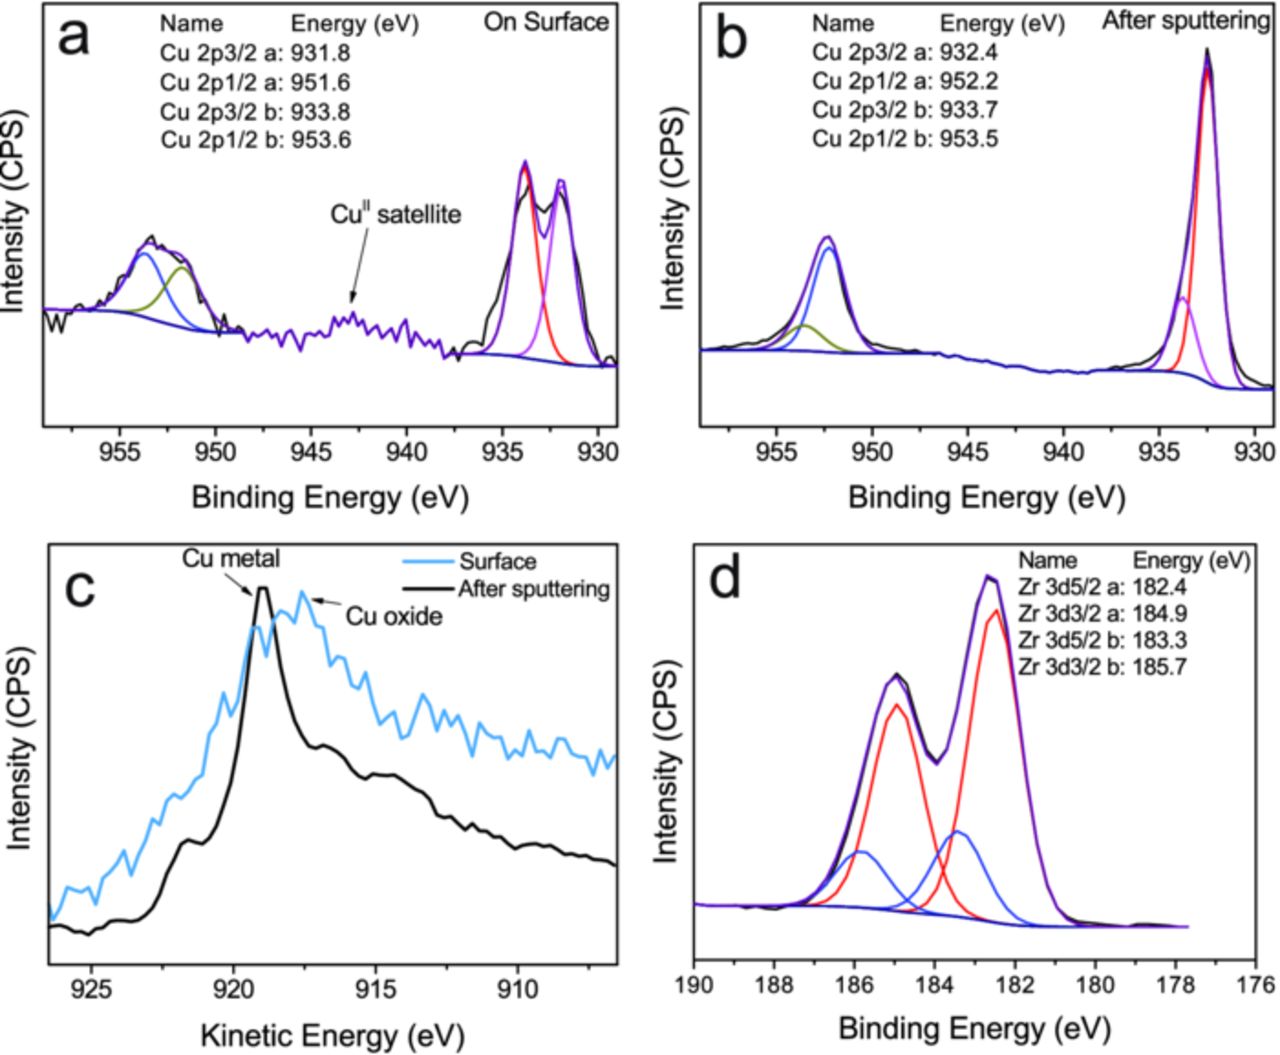
Figure 5. XP spectra of a pretreated AA6014 surface (immersion time: 120 s). (a) Peak fittings for Cu 2p peaks measured on the surface. (b) Peak fittings for Cu 2p peaks measured after a sputtering step of 4 min to ensure measurement around the center of the coating in a depth of ≈ 10 nm. (c) Cu LMM Auger peak in the XP spectra showing presence of copper oxide on the surface and metallic copper in the film. (d) Zr 3d peaks showing two components, ZrO2 and a doublet with higher binding energy.
An analysis of the Zr 3d peak (Figure 5d) shows the presence of two major doublets. The major component with a binding energy of 182.4 eV of the 3d5/2 peak accounts for ≈ 3/4 of the total Zr 3d5/2 intensity, while the component with higher binding energy for the remaining ≈ 1/4. The doublet with the higher concentration can be safely assigned to be originating from ZrO2.50 The doublet with higher binding energy originates from a more electronegative element bound to Zr, for which the only candidate is F. The EDX results reported in Figure 2 show the presence of F on the surface, which was confirmed by AES. The higher binding energy could also indicate the presence of extra oxygen around the Zr atom. The overall interpretation is that the peak shows a mixture of oxyhydroxides and oxyfluorides.
The samples that were treated for 5 s and 40 s were also analyzed using XPS. The sputter depth profile (not shown) of the 5 s treated sample already showed presence of Zr. Moreover, in contrast to the 120 s treated surface, the 5 s treated surface showed a significant amount of AlIII, whereas the 40 s treated sample did not show any Al at all. Thus, it can be concluded that the fluoride attack was still underway after 5-7 s, but the deposition process of the conversion layer had already started.
Analysis of particle growth
To visualize the growth of the Cu-rich particles, ex situ SEM and AFM images of the conversion coating surface were recorded after different immersion times. Figure 6 shows SEM images from AA6014 surfaces that had been pretreated for varying immersion times, showing the typical large intermetallic particles (µm-sized) and the sub-µm-sized Cu-rich particles. Starting from the SEM image from the surface treated for 5 s, it is clear that the Cu-rich particles initially deposited on the periphery of the intermetallic particles. From the image of the 20 s treated surface, it is evident that once the peripheral area was saturated (shown by the bright border), preferential deposition on the intermetallic particles continued. Once the intermetallic particle was saturated (40 s and 80 s), the rest of the surface started to become populated with the Cu-rich particles.
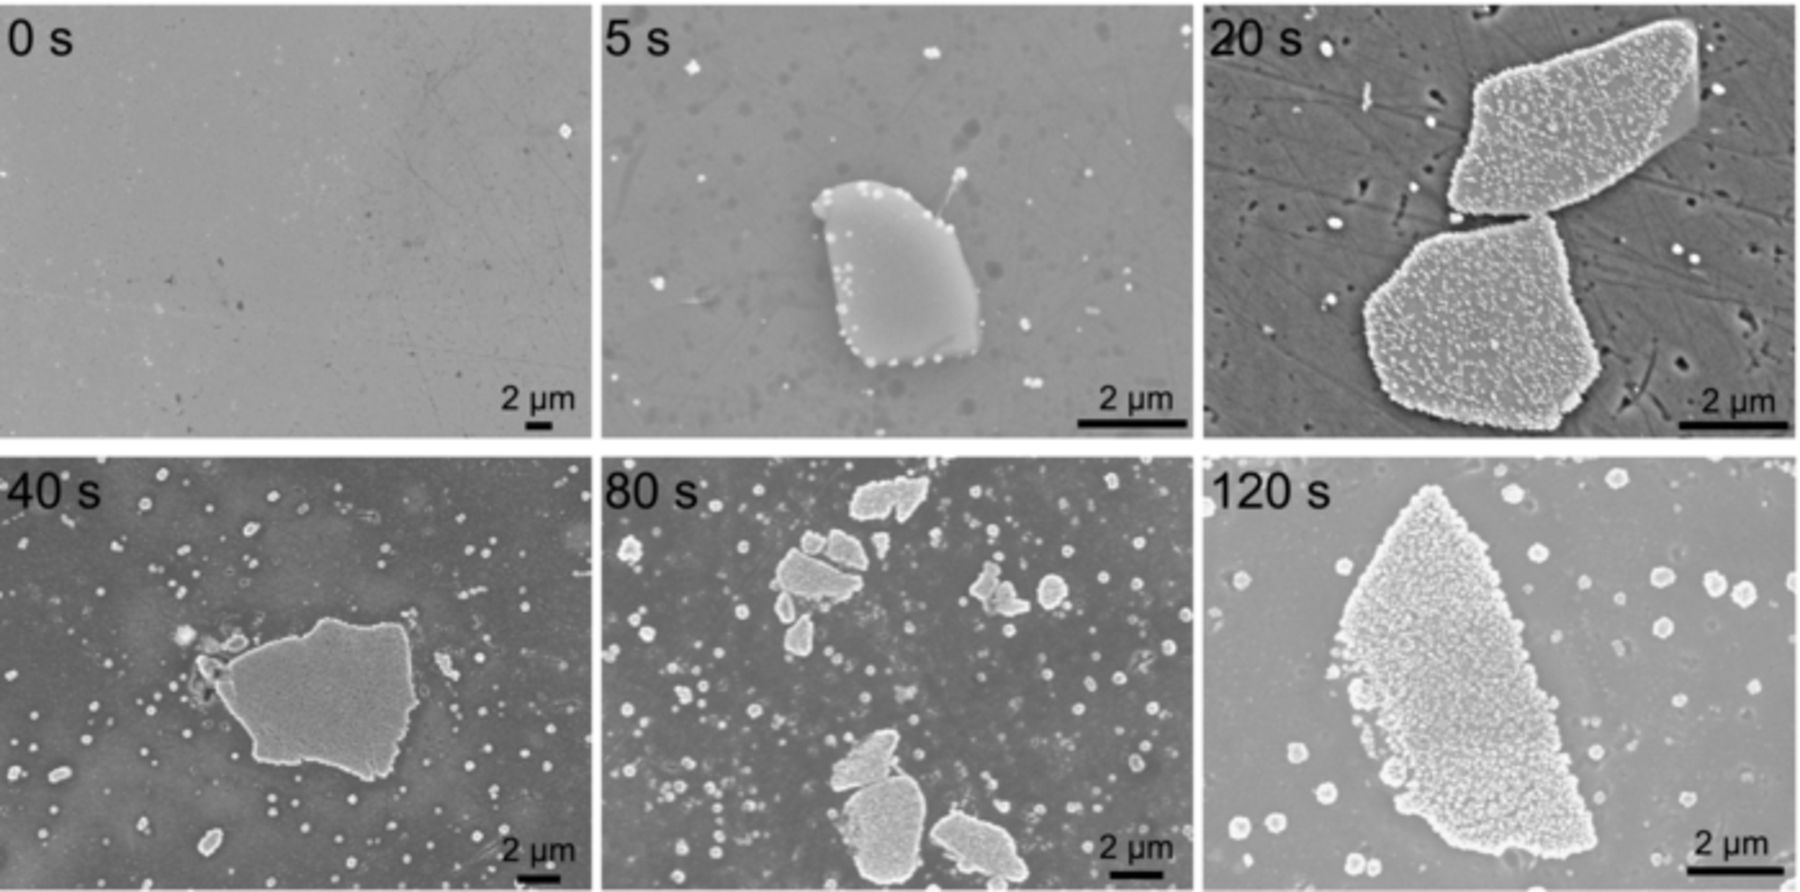
Figure 6. SEM images of pretreated AA6014 substrates after different immersion time.
AFM images of the conversion coating surface are shown in Figure 7. Initially (0 s), polishing lines are visible on the AA6014 surface. After 5 s deposition, intermetallic particles and the Cu-rich particles are visible. An increase in the density and size of the Cu-rich particles is evident from 20 to 80 s.
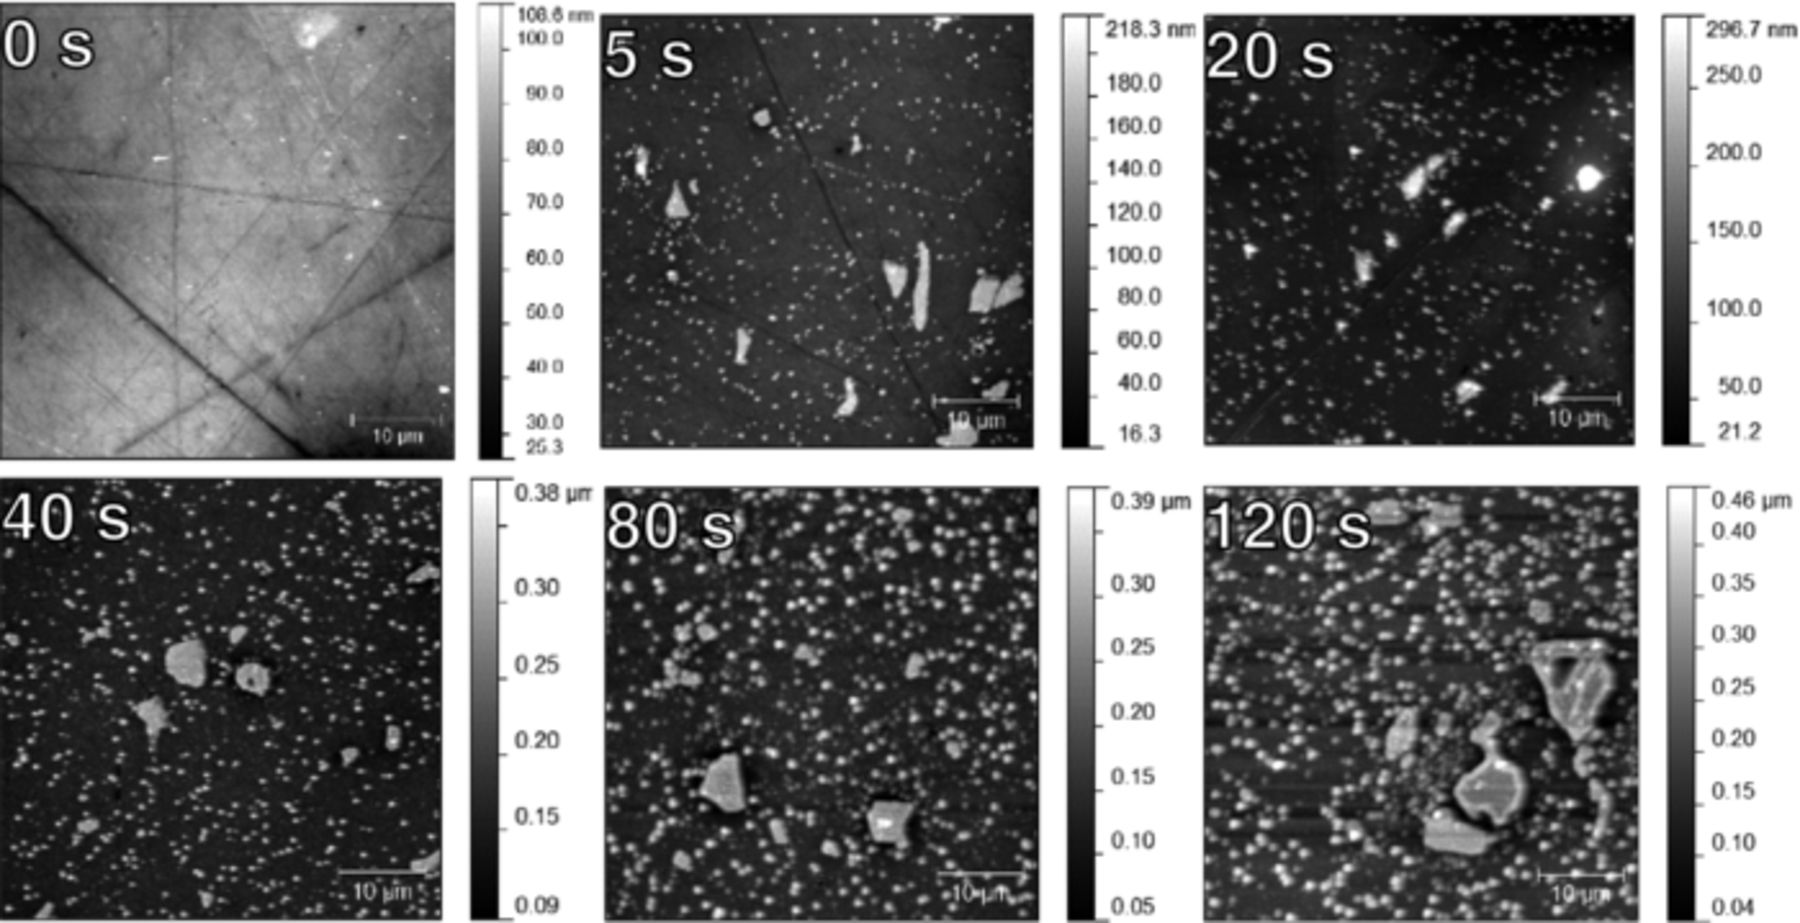
Figure 7. AFM images of pretreated AA6014 surfaces after different immersion times from 5 s to 120 s as indicated in the image.
A quantitative analysis of the AFM images yields histograms of different size parameters, which are shown in Figure 8, with trends of crucial parameters summarized in Figure 9. For the calculation of these histograms, only the smaller Cu-rich particles outside areas covered by intermetallics were considered. The intermetallic particles of irregular shapes themselves were excluded. Cu-rich particles on the intermetallic particles were also excluded from the analysis. The particle radius was determined as the radius of a circumventing circle. For disk-like or hemispherical particles, the information is the same as in the surface area, which is obtained from a pixel-by-pixel analysis. Both radius and area show a strong prevalence of low sizes, with a small but growing fraction of larger particles. Both quantities show a similar trend, which is a strong indication of homogeneous in-plane growth. On the other hand, the height of the particles does not show any visible trend with time: the overall height of the particles hence did not change significantly with time. Therefore, the particles grew only in-plane, but not perpendicular to the surface.
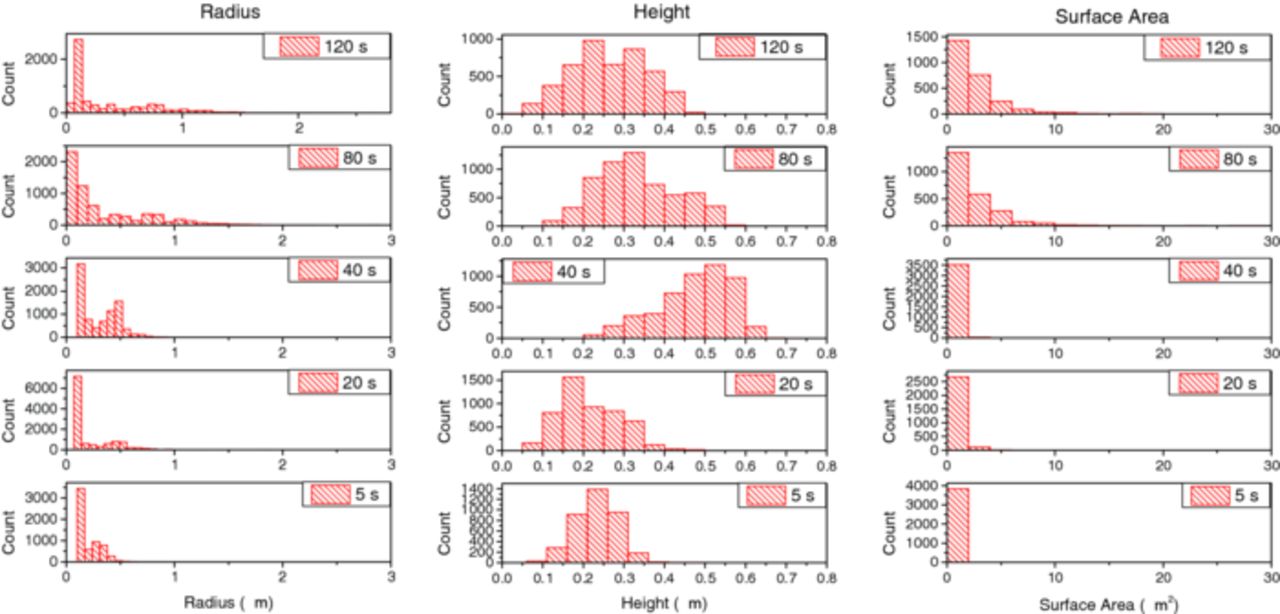
Figure 8. Histograms showing the distribution of radius (left column), height (middle column) and surface area (right column) of the Cu-rich particles on the Al-rich regions from the AFM images for different immersion times as indicated on the graph. Intermetallic particles were ignored in this analysis.
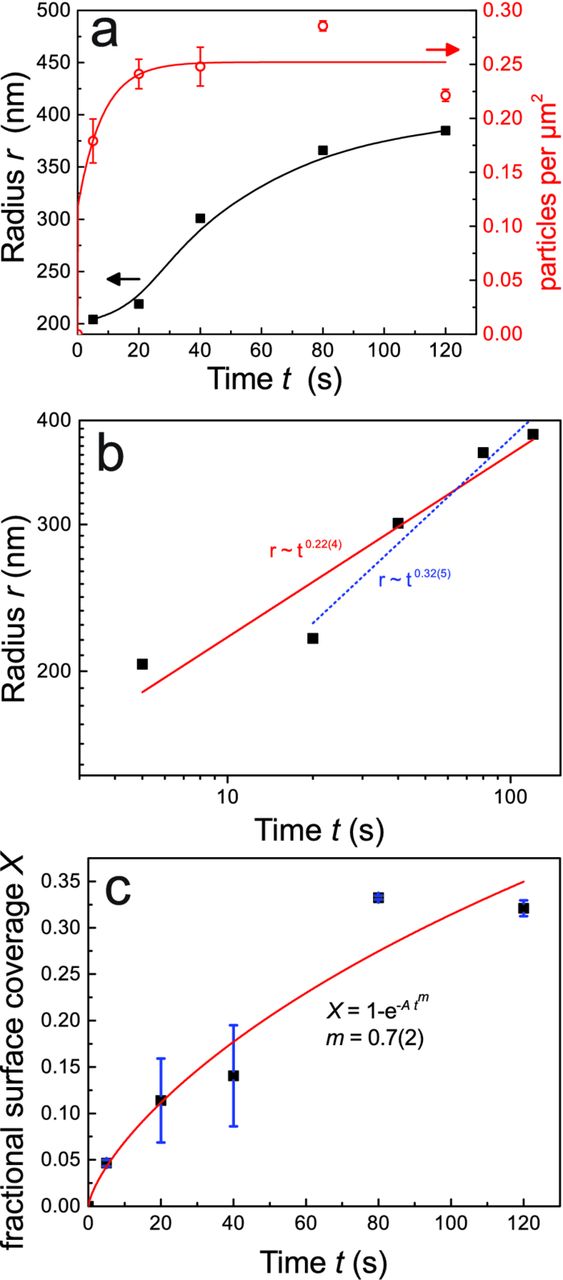
Figure 9. (a) Average radius r (■; left scale) of the Cu-rich particles on Al-rich parts of the surface as a function of immersion time t, on a linear scale (line is a spline to guide the eye) and number of particles per unit area (○; right scale) as function of t (line is a fit to the empirical function ∼ (1 − e− t/τ)). Values for r were derived as arithmetic means of the data used to draw the histograms shown in Figure 8, while the number of particles represent the sum. (b) r of t on a double logarithmic scale. Linear fits were performed over the full time range, yielding r ∼ t0.22 ± 0.04 (straight line) and excluding the first point, yielding r ∼ t0.32 ± 0.05 (dashed line). (c) Surface coverage as function of immersion time. Results have been fit to the Kolmogorov-Johnson-Mehl-Avrami equation. Error bars in (a) and (c) represent the standard deviations obtained after averaging over two different samples.
The analysis of the total number of particles (Figure 9a) shows a steady growth of the initially nucleated particles, indicating an instantaneous nucleation of Cu-rich particles in the initial phase of the pretreatment, and subsequent growth. The total number of particles can be fitted empirically to a function of type ∼ (1 − e− t/τ), with a characteristic nucleation time τ of ≈ 8 s. However, not all nucleated particles may be detected at the initial measurements after 5 s, because some particles may have been too small. Therefore, this characteristic nucleation time presents an upper estimate; nucleation of most particles was complete already during the initial measurement at 5 s.
The initial preferential growth of the Cu-rich particles on the boundaries of the intermetallic particles also manifests itself in the growth kinetics of the Cu-rich particles on the Al-rich areas of the surface. The behavior of particle radius r with immersion time t shows a multiphase growth of the Cu-rich particles, as shown in Figure 9a. Comparing the time ranges in this curve to the SEM images in Figure 6 shows that the initial phase, which terminated after 40-60 s immersion time was identical to the growth of particles at the boundaries of the intermetallic particles, i.e. the onset of the second growth phase was observed only after saturation of the domain boundaries. The particles on the Al-rich areas of the surface grew significantly after this growth phase was finished, as in this phase, there was less competition for the dissolved CuII species. To test if the growth of the particles could be described by a power law in the form r ∼ tn, a double logarithmic plot is shown in Figure 9b. The data over the full time range are not described well by a power law, and the exponent n obtained from a linear fit of (0.22 ± 0.04) is not correlated to a known growth mechanism. On the other hand, when considering only data at t ≥ 20 s, a better correlation is found, with n = (0.32 ± 0.05). At the atomistic level in two dimensions, an equivalent power law with n = 1/3 is characteristic of diffusion-limited growth of self-similar, rather than circular, structures.51,52 The observed circular growth is typical for diffusion-controlled growth also for thin films.53 An analysis of the surface coverage X within the classical two-dimensional Kolmogorov-Johnson-Mehl-Avrami equation,54,55  , yields an Avrami exponent m = (0.7 ± 0.2), as shown in Figure 9c. Avrami exponents of m ≤ 1 have been reported for nucleation at grain boundaries and at dislocations, similar to the situation observed here, but in stark contrast to the exponent m = 4 for nucleation of a new volume phase with a constant nucleation rate.55
Conclusions
Intermetallic particles and Al grain boundaries in AA6014 cause an enhanced deposition of Cu-rich particles during the formation of a ZrO2-based conversion coating if CuII is present in solution. The major component of the conversion coating, i.e. ZrO2, covers the entire surface, including Al-rich regions, intermetallic particles and Cu-rich particles; the latter forming the minor component in the coating. An increased deposition around the intermetallic particles is observed and is caused by the cathodic nature of these particles.35 Detailed XPS peak fitting analysis of Zr as the major component of the film showed the presence of ZrO2 and a bond between Zr and an element more electronegative than O, i.e. Fluorine. Consequently, the film likely consists of oxyhyroxides or oxyfluorides, in accordance with the current state of knowledge.56 The film also contains Cu both in metallic form and as CuO. The presence of metallic Cu indicates a similar mechanism of deposition as proposed recently on hot-dip galvanized steel.28
AFM analysis of different stages of the growth of the conversion coating shows instantaneous nucleation and a subsequent growth of the Cu-rich particles in lateral direction in at least two phases. No growth in height is observed, which may be attributed to the importance of the contact to the Al substrate for growth. In the initial phase, the Cu-rich particles grow near the boundaries of the intermetallic particles. After saturation of the contact line with the Al surface, they saturate the intermetallic particles. After completion of this phase, particles nucleated on the Al surface grow with a diffusion-limited kinetics, without nucleation of further particles.
The observation of instantaneous nucleation for the Cu-rich particles is in line with a formation of this particles via a simple cementation of Cu on the oxide-free surface, which occurs only in the initial stages of the deposition process. The oxide-free surface is formed by fluoride etching. Soon after Cu deposition, the surface will be deactivated by the initiation of ZrO2 deposition, so that only those particles can grow, which are local cathodes and which have been nucleated before oxide deposition.
Acknowledgment
A.S. and A.E. acknowledge Henkel AG & Co. KGaA, Düsseldorf, for funding this work. Prof. M. Stratmann is acknowledged for his continuous support. M.M.L. personally thanks Salzgitter Mannesmann Forschung GmbH for a collaborative research project. The authors thank G.S. Frankel for helpful comments on the manuscript.