
Abstract
Chemical mechanical polishing (CMP) behavior of Cu/Ru/TiN barrier liner stack was investigated with a slurry comprising of silica abrasives, potassium permanganate (KMnO4), guanidine carbonate (GC) and benzotriazole (BTA) in the alkaline region. The corrosion and polishing behavior of the Cu, Ru and TiN films in the solution consisting of the above additives were characterized by open circuit potential and potentiodynamic measurements, polishing rates, dissolution rates and contact angle measurements. A slurry comprising of 10 mM KMnO4, 1 wt% GC and 5 wt% Silica at pH 10 has shown adequate polish rates as well as low individual film corrosion. However, 1 mM BTA was needed to maintain the ΔECORR of both the Cu/Ru and Ru/TiN couples at <20 mV essential to inhibit any galvanic corrosion while still maintaining low corrosion rates for Cu, Ru and TiN films. The removal rate ratio of Ru:Cu with the optimized slurry was ∼0.8, minimizing the possibility of dishing.
Export citation and abstract BibTeX RIS

This is an open access article distributed under the terms of the Creative Commons Attribution 4.0 License (CC BY, http://creativecommons.org/licenses/by/4.0/), which permits unrestricted reuse of the work in any medium, provided the original work is properly cited.
As the scaling of trenches and vias continue, making high volume manufacturing of 14 nm devices feasible, deposition of defect free Cu seed layer upon the TaN/Ta barrier liner1,2 used in earlier generation Cu interconnects has become a challenge. At the reduced trench widths of ∼50 nm or less associated with these devices, it is not possible to deposit a conformal Cu seed layer without voids.3–6 Also, as the TaN/Ta barrier liner is scaled to ∼5 nm or less in thickness, its increased electrical resistance causes the resistance-capacitance delay to increase. Hence, the advantages of replacing it with several other barrier and barrier liner candidate materials and have been investigated by various authors.7–9 These include Ru, Co and Mn and their alloys.
Among these, Ru has good barrier properties with a high melting point of 2310 °C.7 Due to its low resistivity (∼7 μΩ cm) and excellent wettability characteristics with Cu, direct electroplating of Cu is possible eliminating the need for a seed layer.7 However, it was found that atomic layer deposited (ALD) Ru alone is not a good diffusion barrier due to its columnar growth structure that provides diffusion paths for Cu at the grain boundaries10,11 and poor adherence to underlying dielectric.12 Hence, it was proposed that a thin TaN barrier layer (∼2-3 nm) be first deposited followed by a ∼1-2 nm thick Ru liner, alleviating the need for a Cu seed layer.13,14 However, the higher resistivity of TaN (∼200 μΩ cm) is still a concern.
Recently, Amanapu et al.15 showed that Ru films deposited on TiN, another commonly used barrier layer16,17 with a lower resistivity of ∼130 μΩ cm, have higher removal rates (RRs) compared to those deposited on TaN due to the difference in the crystalline orientation of the Ru films deposited on these two materials. Hence, a thin Ru liner (∼2 nm) over a thin TiN barrier layer (∼2 nm), both deposited by ALD, has been proposed as a promising barrier liner for future Cu interconnects.
In these structures, since Ru is in contact with both TiN and Cu (Figure 1), there is a possibility of galvanic corrosion because of the difference in the standard reduction potentials (SRP) of these three materials: Cu2+/Cu (0.10 V), Ru2+/Ru (0.21 V) and Ti2+/Ti (−1.87 V).18 At the Ru/Cu interface, the potential gap is 0.110 V while it is much higher at about 2.07 V at the Ru/TiN interface, both sufficiently large to initiate galvanic corrosion at the two interfaces. Hence, before Ru/TiN barrier can be implemented, galvanic corrosion of these two galvanic couples in this tri-metallic stack must be controlled to prevent the formation of surface defects (voids and slits) during polishing while also maintaining minimal individual film corrosion. This is more challenging due to the presence of two galvanic couple interfaces as opposed to the single Cu-barrier interface in the earlier Cu/(Ta/TaN) structures. Also, achieving an optimal removal rate selectivity among the three materials at a low polishing pressure of ≤2 psi is essential.

Figure 1. Schematic of a Cu/Ru/TiN stack deposited on oxide.
As it turns out, achieving these targets even for Ru/Cu couple is challenging. Sagi et al.19 have reported minimal galvanic corrosion of the Ru/Cu couple in the presence of 1 wt% H2O2 and 1 wt% guanidine carbonate (GC) at pH 9 but the post-polished coupons of Ru showed pits caused by high individual corrosion. They showed that DBSA can reduce the corrosion of Ru by a factor of ∼100 but when it was added to the polishing slurry the Ru RRs were suppressed to an undesirable value of ∼2 nm/min. Park et al.20 studied the etching and polishing behavior of Ru in a potassium permanganate (KMnO4) based slurry and showed that Ru had low static etch rates at pH 8. Recently, Lagudu et al.21 proposed that, in the presence of KMnO4, the corrosion of Al and Co was controlled by the formation of a MnO2 passivating film on the surface of these metals that can be easily removed during polishing. Cui et al.22 studied the polishing and corrosion behavior of polycrystalline Ge2Sb2Te5 (GST) film, also using a KMnO4 slurry at pH 11 and obtained better surface characteristics than when a H2O2 based slurry was used. There were also no corrosion-induced pits. Hence, we investigated the effectiveness of KMnO4 when used as an additive to a GC based slurry for polishing the Cu, Ru and TiN stack and found that it is effective in reducing the associated corrosion and galvanic corrosion issues while also maintaining adequate RRs at a polishing pressure of 2 psi. These results are described in the following.
Materials
Ru (10 nm and 30 nm thick) and TiN (∼40 nm thick) films were deposited on 300 mm Si wafers at IMEC (Leuven, Belgium) by plasma-enhanced atomic layer deposition (PE-ALD) in a 300 W NH3 plasma at 330 °C, using ethylcyclopentadienylpyrrolylruthenium as the precursor for Ru and tetrakis(dimethylamino)titanium (TDMAT) as the precursor for TiN. All the Ru films were deposited on an intervening ∼1--2 nm TiN layer. Cu (500 nm thick) films were electrodeposited on a Ru (1–2 nm) seed layer deposited on a ∼1--2 nm TiN layer on 300 mm Si wafers. The wafers on which these films were deposited were diced at IMEC in the form of 0.75'' × 0.75'' coupons and supplied to us. SiO2 films deposited using tetraethylorthosilicate (TEOS) on 8'' diameter Si wafers were obtained from WRS materials, diced into 2'' diameter discs and then used to determine the oxide RRs.
Experimental
Polishing experiments
All the polishing experiments were performed on a Center for Tribology Research (CETR) CP-4 bench-top polisher. Cu, Ru and TiN coupons (0.75'' × 0.75'') diced out of 300 mm wafers were used for the polishing. A custom made carrier that can hold 0.75'' × 0.75''coupons was used for polishing these film coupons while a 2'' carrier was used for polishing the SiO2 samples. A 9'' diameter Fujibo pad, attached on to a platen, was used for all the polishing experiments and was cleaned with a DI water jet for 1 min after every polish. All the polishing experiments were performed at a polishing pressure of 2 psi, with a slurry flow rate of 120 ml/min, and platen/carrier speeds of 90/90 rpm. Colloidal silica abrasives (Nexsil 35A) of average diameter ∼35 nm, obtained from Nyacol Nano Technologies, were used to prepare the dispersions employed in all the polishing experiments.
The thickness of Ru and Cu films was determined, before and after polish, by measuring the resistance of these films using a four-point probe. The resistance of the each metal coupon was measured at three different locations from one corner to another along a diagonal, and averaged to determine the film thickness. SiO2 film thickness was obtained using a Filmetrics F-20 interferometer before and after polishing at 16 different locations and averaged and the difference was used to determine the RRs. Each experiment was conducted at least twice and these data were used to compute the average RRs and the standard deviation.
Electrochemical experiments
A Gamry-PCI4 potentiostat and a three-electrode glass cell (200 mL volume) with a Pt counter electrode and a saturated calomel reference electrode were used to acquire the potentiodynamic polarization and EOC data. EOC was allowed to stabilize for ∼2000 seconds to ensure a stable potential value. A voltage scan rate of 5 mVs−1 was used to obtain the potentiodynamic data in the voltage range of Eoc ± 0.5 V. In some cases, when linear polarization data were being obtained, the scan range was limited to EOC ± 0.2 V. Some of the 0.75'' × 0.75'' Cu, Ru and TIN coupons were further diced at Clarkson into 0.75'' × 0.37'' rectangular coupons for use as the working electrodes. Only a 1 cm2 active area of the coupon was exposed to the electrolytes. A fresh sample was used for each electrochemical experiment. All the experiments were carried out in solutions stirred at ∼150--200 rpm by a stir bar. Some of the experiments were repeated using a rotating disk electrode system and the data obtained validated the measurements obtained from the stirred solutions as discussed later. Reagent grade chemicals supplied by Sigma Aldrich were used in all the experiments without further purification. The pH of the aqueous solutions of the additives was adjusted using KOH and HNO3.
Contact angle measurements
A goniometer and CAM software (KSV Instruments Ltd., Finland) assembly on a vibration-free optical table was used to measure contact angles. Cu, Ru and TiN coupons (0.75'' × 0.75'') were polished in the desired slurry for 1 minute and then dried with an air jet. The contact angles of a deionized water drop on these coupons were measured at 4 different places and the average value is reported.
Dissolution rates
Cu, Ru and TiN coupons were dipped for 1 min in 100 mL of the desired solutions maintained at 40 °C. The thickness of Cu, Ru and TiN films before and after dipping was measured using a four-point probe and dissolution rates were calculated based on the difference. When the observed dissolution rates were lower than 2 nm/min, the sensitivity of the instrument, the coupon dip time was increased to 3 min to improve accuracy.
Surface roughness measurements
Post-polish film surface roughness was measured using a Burleigh Horizon non-contact optical profilometer. Roughness was measured in a sample area of 269 μm × 269 μm at three different locations on the post-polished coupons.
X-Ray photoelectron spectroscopy (XPS)
XPS spectra were acquired using a Surface Science Instrument model SSX-100 spectrometer using a monochromatic Al Kα X-ray source (1486.6 eV) at Cornell Center for Materials Research. Data reported are for an electron emission angle of 55° and a pass energy of 150 eV for survey scans and 50 eV for high resolution scans.
All scans were made on 1.9 mm × 1.9 mm Cu, Ru and TiN coupons dipped in 10 mM KMnO4 solution, without other additives, for ∼1 min and then dried in a stream of air. The spectral data were analyzed using CASA XPS software. The Shirley background was used in the analysis of the survey scans and symmetric Gaussian-Lorentzian-product peak shape function, with a Lorentzian content of about 15%, was used in the analysis of high resolution scans.
Results and Discussion
Removal Rates (RR) in the presence of KMnO4
Cu, Ru and TiN polishing rates obtained using a dispersion containing 5 wt% silica abrasives and various concentrations of KMnO4 at pH 9, chosen to avoid the formation of toxic RuO4,23 are shown in Figure 2. As the concentration of KMnO4 in the dispersion was increased from 1 mM to 50 mM, the RRs of Cu, Ru and TiN increased from ∼4 nm/min to ∼8 nm/min, ∼1 nm/min to ∼5 nm/min and ∼30 nm/min to ∼80 nm/min, respectively.

Figure 2. Removal rates of Cu, Ru and TiN in the presence of 5 wt% Silica abrasives and "X" mM KMnO4 at pH 9.
As shown in the Reactions 1 to 8 below, in the presence of KMnO4 at pH 9, Cu forms Cu2O and CuO (1, 2),18 Ru forms Ru(OH)4 (3)18 and is chemically converted to RuO29 as Ru(OH)4 = RuO2 + 2H2O and TiN forms TiO2 (4).24,25 No dissolution of Cu, Ru and TiN films was observed in the presence of KMnO4 (1 mM to 50 mM) at pH 9.
![Equation ([1])](https://content.cld.iop.org/journals/2162-8777/5/5/P256/revision1/d0001.gif)
![Equation ([2])](https://content.cld.iop.org/journals/2162-8777/5/5/P256/revision1/d0002.gif)
![Equation ([3])](https://content.cld.iop.org/journals/2162-8777/5/5/P256/revision1/d0003.gif)
![Equation ([4])](https://content.cld.iop.org/journals/2162-8777/5/5/P256/revision1/d0004.gif)
The electrons and hydronium ions generated by these reactions are consumed by the possible cathodic Reactions 5–818,26 which have higher standard reduction potentials (SRPs) in the range 0.16 V to 1.7 V18,26 than the SRPs of the anodic reactions of Cu, Ru and TiN in the range −0.6 V to 0 V.18,25
![Equation ([5])](https://content.cld.iop.org/journals/2162-8777/5/5/P256/revision1/d0005.gif)
![Equation ([6])](https://content.cld.iop.org/journals/2162-8777/5/5/P256/revision1/d0006.gif)
![Equation ([7])](https://content.cld.iop.org/journals/2162-8777/5/5/P256/revision1/d0007.gif)
![Equation ([8])](https://content.cld.iop.org/journals/2162-8777/5/5/P256/revision1/d0008.gif)
During polishing, the oxides and hydroxides present on the Cu, Ru and TiN films are removed by the abrasive action of silica particles. The RRs of Cu and Ru are low compared to TiN presumably because their oxides and hydroxides on Ru (3-5) and Cu (1, 2) are comparatively harder and removed more slowly. Since the RRs of Ru and Cu remained ∼4–5 nm and ∼7--8 nm, respectively (Figure 2), when the KMnO4 concentration was increased from 10 mM to 50 mM, we have chosen to work with only 10 mM KMnO4 concentration in all our further experiments. This also allows us to maintain a low K+ ion concentration. Even though the RRs of Ru are unacceptably low at ∼5 nm/min at this 10 mM concentration of KMnO4, we investigated the corrosion behavior of these three films to get an idea of the driving forces behind it and then identify appropriate additives to optimize the result.
Open circuit potential and potentiodynamic measurements in the presence of KMnO4
The open circuit potentials (OCP or EOC) of Cu, Ru and TiN were determined in the presence of 10 mM KMnO4 at pH 9. The OCPs were measured over a period of 2000 seconds in order to ensure that a stabilized value is reached and were found to be 572 mV, 615 mV and 570 mV for Cu, Ru and TiN, respectively, as shown in Figure 3. The observed increase in the OCPs of Cu, Ru and TiN from 517 mV to 572 mV, 535 mV to 615 mV and 525 mV to 570 mV, respectively, in a span of 2000 seconds is due to the formation of the respective oxides and hydroxides along with the formation of a passive Mn oxide/hydroxide layer as discussed below.

Figure 3. Open circuit potentials of Cu, Ru and TiN in the presence of 10 mM KMnO4 at pH 9 (REF), 10 mM KMnO4 + 1 wt% GC at pH 10 (REF+GC) and 10 mM KMnO4 + 1 wt% GC + 1 mM BTA at pH 10 (REF+GC+BTA).
In the alkaline region in the presence of KMnO4 four cathodic reactions, oxygen reduction 5, and the three permanganate ion (MnO-4) reduction Reactions 6–818,21,26 consume the electrons generated from the anodic Reactions 1–4. It is well known that during the permanganate ion reduction reaction, MnO-4 gets reduced to MnO2 which then adsorbs on the surface18,21 of the metal films. The MnO2 can in turn be reduced to Mn2O3 and MnOOH18,26 as shown in the above Reactions 7, 8. The OCP values of Cu, Ru and TiN and their respective rate of increase are more or less similar in all the cases. This indicates that, apart from the formation of their respective oxides and hydroxides in the presence of KMnO4 at pH 9, MnO2, Mn2O3 and MnOOH are likely formed on all the three surfaces and could fill the porous regions as well as form an adsorbed passive layer on the respective oxides and hydroxides of Cu, Ru and TiN and, hence, have similar open circuit potential (OCP) values.
XPS analysis of Cu, Ru and TiN surfaces
Figure 4 shows the XPS survey scan spectra of Cu, Ru and TiN surfaces dipped in 10 mM KMnO4 solution at pH 9 for ∼1 min and then dried in a stream of air. The XPS results show photoelectron peaks of C 1s, O 1s, N 1s, K 2s, K 2p, Cu 2p, Ru 3p, Ti 2p, and Mn 2p. The observed high amounts of carbon on all samples is most likely due to contamination. The Cu 2p3/2 peak at 934 eV in the survey scan of the Cu coupon is attributed to CuO.27,28 Similarly, the Ru 3p3/2 peak at 462 eV in the survey scan of the Ru coupon, and the Ti 2p peak at 458 eV in the survey scan of the Ti coupon are attributed to RuO229,30 and TiO2,31,32 respectively.

Figure 4. XPS survey scans of Cu, Ru and TiN surfaces dipped for ∼ one minute in solutions of 10 mM KMnO4 at pH 9.
All the three surfaces showed the presence of Mn atoms (peak at 642 eV in the survey scan), originating from the KMnO4 oxidizer. The high resolution scans for Mn 2p shown in Figure 5a, indicated the presence of Mn2O3 and manganese oxide-hydroxide (MnOOH) on all three surfaces. The high resolution spectra of the Mn 2p can be deconvoluted to consist of an Mn3+ peak at 642 eV and a weaker Mn4+ peak at 644.5 eV,33–35 corroborating the fact that Mn2O3 and MnOOH are formed along with small concentrations of MnO2.

Figure 5. a. High resolution XPS scans of Mn 2p on Cu, Ru and TiN surfaces dipped in solutions of 10 mM KMnO4 at pH 9 for ∼1 min at room temperature. b. High resolution XPS scans of O 1s on Cu, Ru and TiN surfaces dipped in solutions of 10 mM KMnO4 at pH 9 for ∼1 min at room temperature.
Deconvolution of the O 1s high resolution scan shown in Figure 5b, confirmed the presence of O2−, OH−, and possibly chemisorbed H2O, as suggested by Nesbitt et al.35 at 529 eV, 531 eV and 532.5 eV, respectively. The O2− peak contribution is attributed to the presence of the oxides, MnO2, Mn2O3 and MnOOH, as well as the oxides CuO, RuO2 or TiO2 depending on the substrate under consideration (Cu, Ru, or TiN, respectively). It should be noted that in addition to MnOOH, species such as KOH may also contribute to the OH− peak. Indeed, a significant concentration of K atoms (5 to 10 atom %) were found on all test surfaces. Therefore, a combination of Mn2O3, MnOOH and MnO2 forms a passivating layer on all the samples in the presence of 10 mM KMnO4 at pH 9.
Contact angles of Cu, Ru and TiN surfaces
This formation of an adsorbed passive layer of Mn oxides/oxide-hydroxide, during the OCP experiment time span, was also confirmed by the contact angle data (Table I). The contact angles of Cu, Ru and TiN coupons in DI water at pH 9 were 68°, 75° and 63°, respectively, and decreased to 49°, 44° and 47°, respectively, in the presence of KMnO4 at pH 9. Also, the color of all the three surfaces changed (pictures not shown) to mild brown after dipping the coupons in a solution of 10 mM KMnO4 at pH 9 for ∼2000 seconds. These changes indicate that the surfaces became more hydrophilic as compared to the surfaces of the Cu, Ru and TiN coupons dipped in DI water, undoubtedly due to the formation of Mn2O3, MnOOH and MnO2.Similar formation of passivating film/corrosion inhibition was observed in the presence of permanganate ion by several authors.20–22,26
Table I. Contact angles of Cu, Ru and TiN films dipped in DI water and KMnO4 solutions at pH 9 for 2000 seconds.
| Contact Angle Values | |||
|---|---|---|---|
| Solution | Ru | Cu | TiN |
| DI water at pH 9 | 68° ± 1 ° | 75° | 63° ± 3° |
| 10 mM KMnO4 at pH 9 | 44° ± 2° | 49° ± 3° | 47° ± 1° |
The difference in OCPs of Cu/Ru galvanic couple and Ru/TiN galvanic couple measured in the presence of 10 mM KMnO4 at pH 9 is ∼45 mV in both cases. To inhibit any likelihood of galvanic corrosion at these two bimetallic interfaces (Cu/Ru and Ru/TiN) this potential gap should be lowered to less than 20 mV.8,9
Potentiodynamic experiments were performed in the potential range of EOC ± 500 mV and at 5 mV/s scan rate to study the individual corrosion behavior of Cu, Ru and TiN in the presence of 10 mM KMnO4 at pH 9, in solutions stirred at ∼150 rpm and also using a rotating (∼150 rpm) disk electrode. The results from the two sets of experiments are the same within the experimental error and are shown in Figure 6. The corrosion potentials (ECORR), obtained from the intersection point of cathodic and anodic curves of potentiodynamic plots of Cu, Ru and TiN are 470 mV, 480 mV and 475 mV, respectively, all very close to each other. The resulting ΔECORR for Ru/Cu couple and ΔECORR for Ru/TiN couple are 10 mV and 5 mV, respectively, well within the desired limits of <20 mV to minimize any galvanic corrosion.

Figure 6. Potentiodynamic plots of Cu, Ru and TiN in the presence of 10 mM KMnO4 in the EOC ± 500 mV range.
It is interesting to note that ECORR and EOC of the Cu, Ru and TiN films differ from each other by about ∼100 mV, likely due to the presence of various additives and multiple reactions occurring at the electrode surface. As is well known, EOC is measured in the absence of any external voltage and hence all the reactions occurring at the electrode surface are governed by the mixed potential theory. On the other hand, ECORR is measured under potentiodynamic conditions by applying an external voltage and can be influenced by various reactions that can occur and modify the material surface. During the potentiodynamic measurements, these multiple reactions occurring at high over potentials can affect the anodic and cathodic plots making it difficult to find well defined linear regions for calculating the ICORR using Tafel analysis.36–40 Indeed, this is the case for the three potentiodynamic plots in Figure 6.
Different corrosion potentials in the presence and absence of external voltage and associated problems with the calculation of ICORR in the presence of an external voltage were reported by several authors36–39 and, in particular, with the GC system by Rock et al.40 and Sagi et al.19 Hence, similar to these authors, instead of ICORR, we chose to rely on linear polarization resistance (Rp) determined from potentiodynamic data obtained with the scan range limited to EOC ± 20 mV to obtain a qualitative measure of the corrosion currents and, therefore, the surface reactivity.19,36–40
Rp is determined from the experimental current (i) vs overpotential (η) graphs using the definition19,36–40

where η is the overpotential, η = E-ECORR.
The polarization conductance (1/Rp) value, which is the slope of i vs η graph, gives an indirect measure of corrosion currents and surface reactivity.
In our case, the potentiodynamic data were re-measured in the narrower (EOC ± 200 mV) range for Cu, Ru and TiN in the presence of 10 mM KMnO4 at pH 9, shown in Figure 7 and the 1/Rp values were obtained from the scan range limited to EOC ± 20 mV. The potentiodynamic data were now measured in the narrower range to limit other possible reactions at higher over potentials and get better correlation of the corrosion potentials obtained from OCP and potentiodynamic data. From this data, it was found that ΔECORR Ru/Cu is ∼55 mV and ΔECORR Ru/TiN is ∼30 mV as shown in Table II, both somewhat higher than the values obtained from the data in the EOC ± 500 mV range. The 1/Rp values of Cu, Ru and TiN obtained from this data are ∼169 μS/cm2, ∼82 μS/cm2 and ∼172 μS/cm2, respectively (shown in Figure 8 and Table II). The 1/Rp value of Ru is ∼82 μS/cm2 is lower by a factor of ∼10 compared to the value of ∼1984 μS/cm2 in the presence of H2O2 and GC obtained by Sagi et al.19 and is strongly suggestive of a very low potential for pitting corrosion. Thus, KMnO4 solutions do not raise any corrosion or galvanic corrosion concerns and hence can form a basis for further development.
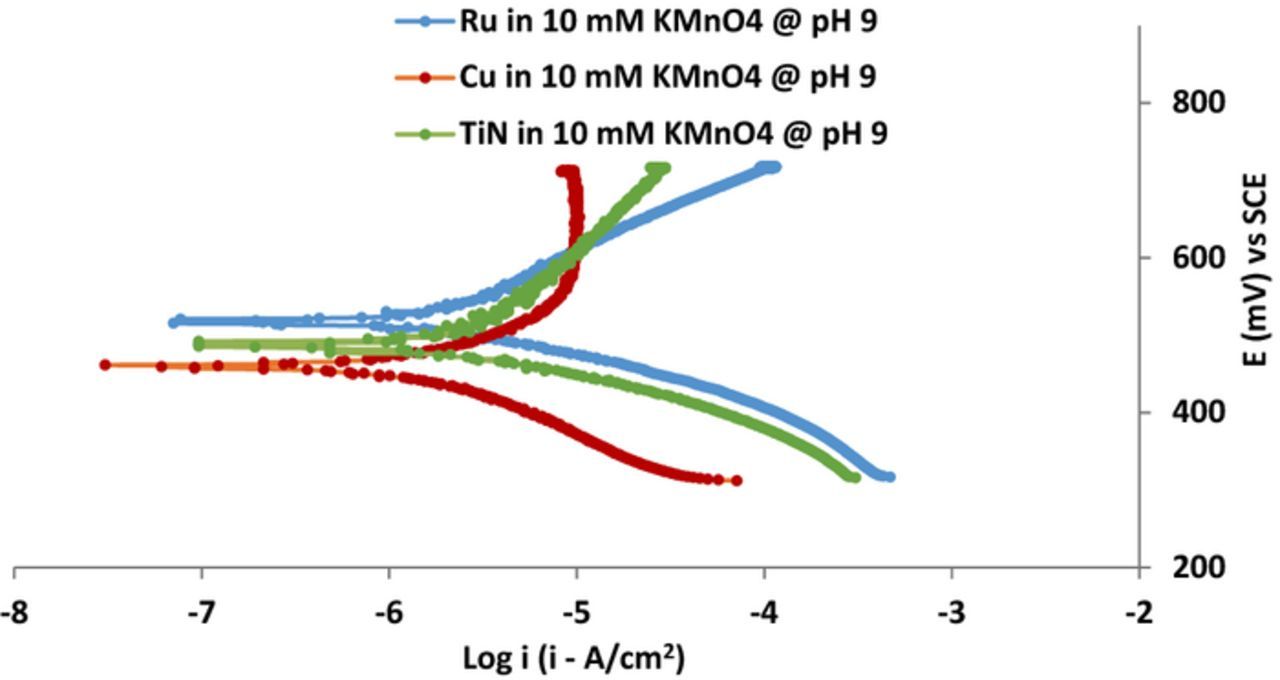
Figure 7. Potentiodynamic plots of Cu, Ru and TiN in the presence of 10 mM KMnO4 in the EOC ± 200 mV range.
Table II. Potentiodynamic data of Cu, Ru and TiN in the presence of KMnO4, GC and BTA and in the EOC ± 200 mV range at pH 9 and pH 10.
| ECORR (mV) | ΔECORR (mV) | 1/Rp (μS/cm2) | ||||||
|---|---|---|---|---|---|---|---|---|
| Solution | Ru | Cu | TiN | Ru/Cu | Ru/TiN | Ru | Cu | TiN |
| 10 mM KMnO4 @ pH 9 | 515 | 460 | 485 | 55 | 30 | 169 | 82 | 172 |
| 10 mM KMnO4 + 1 wt% GC @ pH 10 | 465 | 410 | 465 | 55 | 0 | 140 | 255 | 186 |
| 10 mM KMnO4 + 1 wt% GC + 1 mM BTA @ pH 10 | 470 | 460 | 450 | 10 | 10 | 139 | 123 | 205 |

Figure 8. Plots of current (i) vs η (E-ECORR) of Cu, Ru and TiN in the voltage range of EOC ± 20 mV and in the presence of 10 mM KMnO4 at pH 9.
However, as shown in Figure 2, the RRs of Ru are only ∼4 nm/min, lower than a more desirable ∼20 nm/min. So based on the results of Amanapu et al.,15 we investigated whether the addition of GC to 10 mM KMnO4 will be effective in increasing the RRs of Ru while maintaining the excellent corrosion and galvanic corrosion characteristics seen above.
RR behavior in the presence of GC
Figure 9 shows the RRs of Cu, Ru and TiN measured using different concentrations of GC in the presence of 5 wt% silica abrasives and 10 mM KMnO4 at pH 10. Since GC is a very strong base (pKa of 13.6), its addition to silica abrasives and KMnO4 increased the pH of the slurry to pH 10. In the presence of these same additives and concentrations, the RRs of Cu, Ru and TiN at pH 9 were similar (data not shown) to these at pH 10. Hence, we chose to stay with the natural pH of the slurry mixture, eliminating the need to add an acid, for all our further experiments. With the addition of only 0.1 wt% GC to 5 wt% silica abrasives and 10 mM KMnO4, the RRs of Cu, Ru and TiN increased from 7 nm/min to 26 nm/min, 4 nm/min to 9 nm/min and 48 nm/min to 80 nm/min, respectively. However, the RR ratio of Ru:Cu is very low at ∼0.3 which is undesirable and therefore, investigated the effect of increasing the concentration of GC. As the concentration of GC was increased from 0.1 to 1 wt%, the RRs of Cu, Ru and TiN increased from 26 nm/min to 28 nm/min, 9 nm/min to 17 nm/min and 80 nm/min to 120 nm/min, respectively (as shown in Figure 9). Since increasing the concentration of GC beyond 1 wt% made the slurry unstable due to agglomeration, all further experiments were limited to a concentration of 1 wt% GC.

Figure 9. Removal rates of Cu, Ru and TiN in the presence of 5 wt% Silica abrasives, 10 mM KMnO4 and "X" wt% GC at pH 10.
Since TiN is the last layer to be polished in the Cu, Ru and TiN stack (Figure 1) the higher TiN RR, compared to that of Cu and Ru, should not have any detrimental effect on dishing of Cu and Ru. Also, the dissolution rates of Cu, Ru and TiN films measured in the same slurry were low at ∼0.4 nm/min, ∼0.2 nm/min and ∼0.6 nm/min, respectively, values that prevent any material loss during static conditions.
As mentioned by Amanapu et al.,15 Ru oxides/hydroxides likely form complexes with guanidinium ions in the presence of GC and KMnO4 at pH 10. These complexes are then polished away by silica abrasives at a down pressure of only 2 psi. The higher RR of Ru compared to that obtained by Sagi et al.19 who worked with H2O2 instead of KMnO4, both in the presence of GC, suggests that the mechanical strength of Ru oxide-guanidinium complex layer is reduced by the Mn oxides/hydroxides present in it. In the case of Cu, as was shown already,19,41,42 the carbonate ions associated with GC, can form CuCO3Cu(OH)2, [CuCO3]2− and [CuCO3(OH)2]2− complexes which are easily polished away. Similarly, TiO2 can presumably form complexes with guanidinium ions or carbonate ions associated with GC or both and removed by abrasive action of slurry.
OCP and potentiodynamic data in the presence of GC
The OCPs of Cu, Ru and TiN measured in a solution consisting of 10 mM KMnO4 and 1 wt% GC at pH 10 are 475 mV, 513 mV and 515 mV, respectively, as shown in Figure 3, compared to 572 mV, 615 mV and 570 mV, respectively, obtained in the absence of GC. The ECORR and 1/Rp values of Cu, Ru and TiN from the potentiodynamic experiments in the EOC ± 200 mV range (Figure 10) in the presence of 1 wt% GC and 10 mM KMnO4 at pH 10 are shown in Table II. The ΔECORR gap for Ru/Cu couple is ∼55 mV while for Ru/TiN couple is 0 mV. The 1/Rp values of Ru and TiN remained more or less the same at 140 μS/cm2 and 186 μS/cm2, respectively (as shown in Figure 11 and Table II), but increased for Cu from ∼82 μS/cm2 to ∼255 μS/cm2 (Figure 11 and Table II). This increase could be due to the formation of soluble [CuCO3]2− and [CuCO3(OH)2]2− complexes.19,41,42 Also, the ΔECORR gap of Ru/Cu couple remains high at ∼50 mV and has potential to induce galvanic corrosion and needs to be reduced. Furthermore, the RR ratio of Ru:Cu is only ∼0.6 in this GC containing dispersion and needs to be closer to ∼1 as a higher Cu removal rate leads to undesirable dishing in the Cu trenches.

Figure 10. Potentiodynamic plots of Cu, Ru and TiN in the presence of 10 mM KMnO4 and 1 wt% GC at pH 10 in the EOC ± 200 mV range.

Figure 11. Plots of current (i) vs η (E-ECORR) of Cu, Ru and TiN in the voltage range of EOC ± 20 mV and in the presence of 10 mM KMnO4 and 1 wt% GC at pH 10.
Thus, while the addition of GC increased the RR of Ru as desired, galvanic corrosion and RR selectivity issues are now of concern.
Effect of the addition of BTA
We were able to address and mitigate these concerns by adding BTA, a commonly used Cu corrosion inhibitor1,9 to the GC and KMnO4 based slurry. Indeed, the addition of only 1 mM BTA to 10 mM KMnO4 and 1 wt% GC at pH 10 increased the OCP of Cu to ∼505 mV without affecting the OCPs of both Ru and TiN as shown in the Figure 3. Also, the ECORR value of Cu increased to ∼455 mV (Figure 12 and Table II), which reduced the ΔECORR gap for Ru/Cu couple to ∼10 mV and that for Ru/TiN couple is ∼15 mV, indicating minimal possibility of galvanic corrosion for both the couples (Figure 12 and Table II). Also, upon addition of 1 mM BTA, 1/Rp of Cu was reduced to 123 μS/cm2 (Figure 13 and Table II). The 1/Rp values of Ru and TiN remained more or less the same.

Figure 12. Potentiodynamic plots of Cu, Ru and TiN in the presence of 10 mM KMnO4, 1 wt% GC and 1 mM BTA at pH 10 in the EOC ± 200 mV range.

Figure 13. Plots of current (i) vs η (E-ECORR) of Cu, Ru and TiN in the voltage range of EOC ± 20 mV and in the presence of 10 mM KMnO4, 1 wt% GC and 1 mM BTA at pH 10.
The removal rate of Cu also decreased to 22 nm/min upon addition of 1 mM BTA consistent with the reduced corrosion values while the RR of Ru and TiN remained same at 17 nm/min and 120 nm/min, respectively. As such, the removal rate ratio of Ru:Cu is now ∼0.8 decreasing the potential for dishing of Cu considerably. Further increase in the concentration of BTA to 5 mM did not affect the RRs of Cu much (Figure 14) as well as its corrosion behavior (data not shown).

Figure 14. Removal rates of Cu, Ru and TiN in the presence of 5 wt% Silica abrasives, 10 mM KMnO4, 1 wt% GC and "X" mM BTA at pH 10.
Post-polish surface of Cu, Ru and TiN films.
The post-polished surfaces of Cu, Ru and TiN in the presence of this reasonably optimal dispersion of 5 wt% silica abrasives, 10 mM KMnO4, 1 wt% GC and 1 mM BTA slurry system at pH 10 are shown in Figure 15. There is no evidence of pits on all the surfaces consistent with the observed low corrosion data. The surface roughness (Sq) of all the three post-polished coupons was less than 1 nm and the peak to valley (P/V) ratio is less than 5 nm indicating very good planarized surfaces.

Figure 15. Surface images and RMS roughness (Sq) and peak to valley distance values of Cu(a), Ru(b) and TiN(c) films after polishing with 3 wt% silica + 10 mM KMnO4 + 1 wt% GC + 1 mM BTA slurry at pH 10.
Conclusions
Polishing the Cu, Ru and TiN stack with 5 wt% silica abrasives, 10 mM KMnO4 and 1 wt% GC slurry system at pH 10 gave adequate RRs and low Ru film corrosion with a potential gap between Ru/TiN couple of <20 mV. Addition of BTA to the above slurry reduced the potential gap of Cu/Ru also and maintained the potential gap of Ru/TiN couples at <20 mV. In addition, the removal rate ratio of Ru:Cu has increased to ∼0.8 minimizing the possibility of dishing. Therefore, a slurry for Cu/Ru/TiN stack polishing comprising of 5 wt% silica abrasives, 10 mM KMnO4, 1 wt% GC and 1 mM BTA at pH 10 is capable of controlling galvanic corrosion of the Cu/Ru and Ru/TiN couples, minimal individual film corrosion and adequate RRs of Cu, Ru and TiN.
Acknowledgments
We acknowledge Prof. Sitaraman Krishnan at Clarkson University for his inputs and suggestions in analyzing XPS data and the Cornell Center for Material Research and Jonathan Shu for performing our XPS experiments. We also acknowledge IMEC for providing Cu, Ru and TiN coupons and Fujibo pads and NYACOL for supplying silica slurry.