
Abstract
β-sialon (Si6−zAlzOzN8−z):Eu2+ phosphors with the oxygen concentrations as low as less than 1 wt% were synthesized by using the pure Si metal as the Si source. The oxygen concentrations could be controlled in the range of 0.3–0.7 wt%, which corresponds to the z value of 0.06–0.13 by using the mixtures of the Si metal and α-Si3N4 powder. The photoluminescence of the samples showed the blue shifted emission spectrum and the narrower line width when the oxygen concentration was decreased. A wider color gamut can be achieved by using the β-sialon with the low oxygen concentration.
Export citation and abstract BibTeX RIS
Rare-earth-activated oxynitride/nitride phosphors have shown excellent luminescence properties under ultraviolet or blue light irradiations,1–19 leading to their potential use in white light-emitting diodes (LEDs).20–27 Among these, β-sialon:Eu2+ is an interesting green phosphor emitting at around 535 nm with a sharp line shape, which is preferable for backlight application.13,17–19,27 β-sialon is structurally derived from β-Si3N4 by the equivalent substitution of Al–O for Si–N, and its chemical composition can be written as Si6−zAlzOzN8−z (0 < z ≤ 4.2). The luminescence spectrum is tunable by changing the z values. In the previous work,17 the influences of the z value (z = 0.1 ∼ 2.0) on luminescent properties were investigated. The emission peak wavelength is blue shifted by reducing the z value. This blue shift is more favorable for backlight applications, since wider color gamut can be obtained. For the purpose of further reduction of the z value, the oxygen concentration of β-sialon should be decreased. However, it is difficult to achieve the oxygen concentration as low as less than 1 wt%, because unintentional oxygen concentration from Si3N4 powders which are conventionally used as the Si source is inevitable. In this work, we tried to use the high purity Si metal powder to reduce the oxygen incorporation. Si and Si3N4 powder mixtures were used to control the oxygen concentration. Photoluminescence (PL) spectra were measured and their dependence on oxygen concentrations was clarified.
Besides α-Si3N4 (SN-E10, Ube Industries, Japan), the high purity (4N) Si metal powder (Shin-Etsu Chemical Co. Ltd., Japan) was also used as the Si source. AlN (Type F, Tokuyama Corp., Japan) and Eu2O3 (Shin-Etsu Chemical Co. Ltd., Japan) were selected as Al and Eu sources, respectively. The z values were controlled by varying mixing ratios of α-Si3N4 and Si. The total atomic ratio of Si and Al was kept constant to examine the controllability of oxygen concentrations, since otherwise certain amount of self alignment may occur. The Eu concentration was set constant at 0.05 at% after the consideration of phase stabilities in the previous work.17
The powder mixtures were packed into boron- nitride crucibles and were fired in a nitrogen atmosphere with two steps using a gas pressure sintering furnace (Fujidempa Kogyo Co. Ltd., Osaka, Japan) with a graphite heater. In the first step, to eliminate the oxygen incorporation, the samples were heated up to 800°C under 10−2 Pa in vacuum with a heating rate of 500°C/h. At 800°C, a nitrogen gas (99.999% purity) was introduced into the chamber and the temperature was raised up to 1300°C with a rate of 500°C/h. Then these samples were heated again up to 1600°C slowly with a ramp rate of 1°C/min and kept for 8 h under the nitrogen gas pressure of 0.5 MPa. With this process, the Si metal powder was nitridized. The slow ramp rate is essential for temperature control of the exothermic reaction. After the sintered samples were milled into fine powders, they were introduced into the chamber and finally fired again at 2000°C for 8 h under the nitrogen pressure of 1.0 MPa.
The chemical compositions of these samples were analyzed by an induction coupled plasma method (ICP) and oxygen-nitrogen analyzer (TC-436, LECO). The phase products were identified by x-ray diffraction (XRD) (Smart Lab, Rigaku) using Cu Kα1 radiation. The PL and PLE spectra of the phosphors were measured by a fluorescence spectrophotometer (MODEL F-4500, Hitachi).
The oxygen concentration was successfully controlled by using mixtures of Si sources as shown in Fig. 1. The residual oxygen concentration was 0.74 wt%, when only Si3N4 was used. It monotonically decreased, and further reduced down to 0.33 wt% by using the high purity Si metal powder only. This oxygen concentration corresponds to the z value of 0.06. The usage of the Si metal is hence thought to be effective to reduce the oxygen concentration.
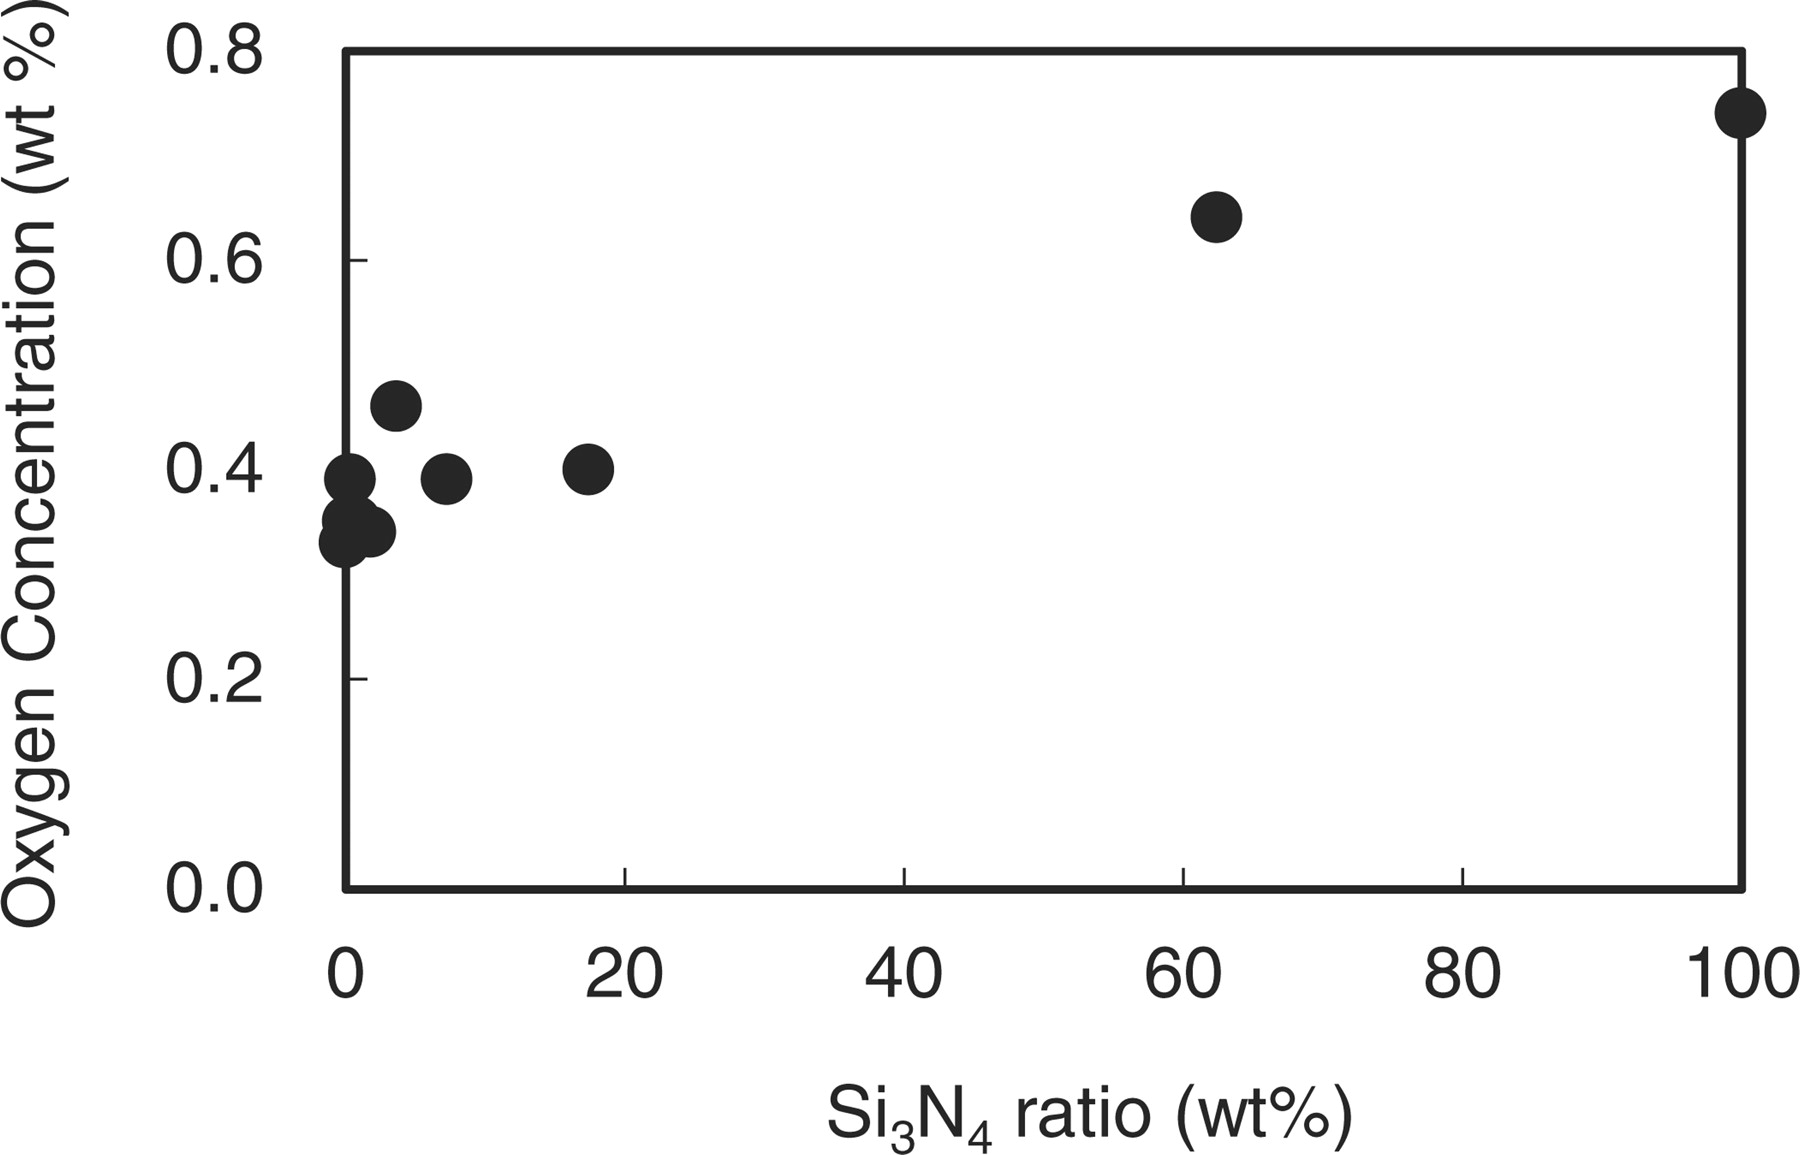
Figure 1. Variations of the oxygen concentration in β-sialon:Eu with altering Si3N4 and Si metal ratios (= Si3N4/(Si3N4+Si)).
All samples have the single phase of β-sialon. Si crystal trace (θ = 28.5) was not detected in the XRD pattern as shown in Fig. 2. It means that the whole Si metal source has been nitridized by the above mentioned process. The Al / Si ratios measured by ICP were constant at the z value of 0.2. The excess Al elements may exist in the phosphor those amounts were too small to be detected by XRD.
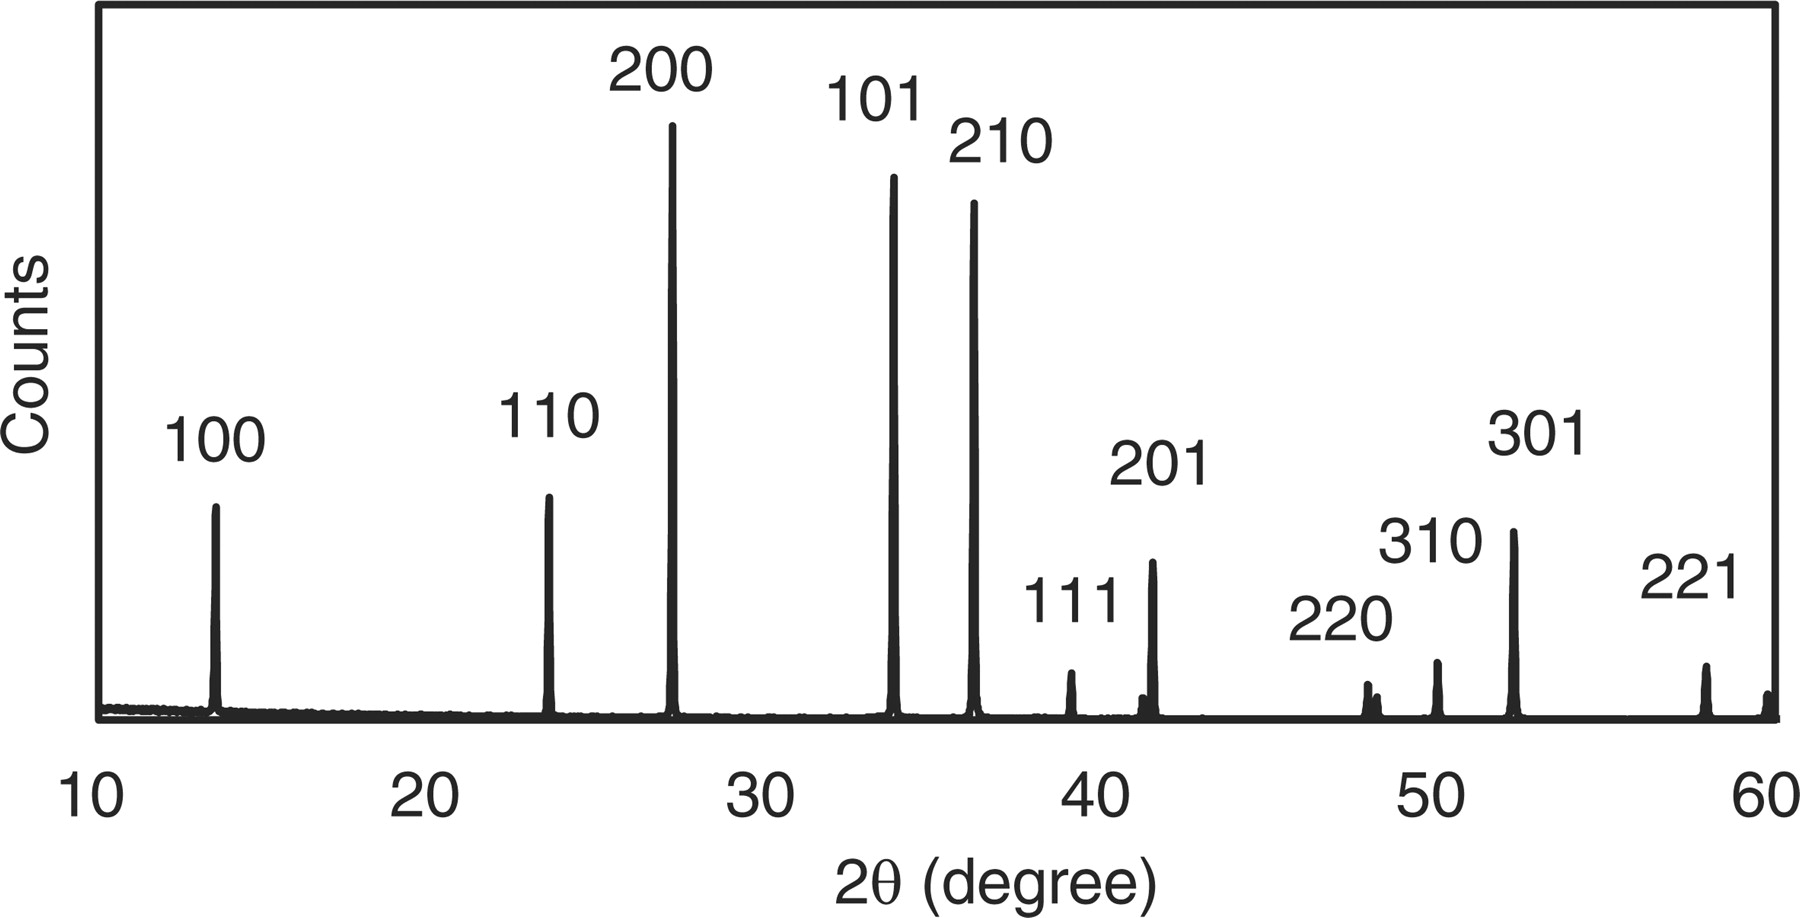
Figure 2. X-ray diffraction pattern of β-sialon:Eu using only the Si metal as the Si source.
Typical images of the microstructure are presented in Fig. 3 for the samples with the single use of the Si metal and the Si3N4 powder, respectively. The particles have a rod like shape, and there are not significant changes of the particle morphology and size by using different Si sources. By applying this process, similar sintering reactions were achieved although the oxygen concentration was quite low.
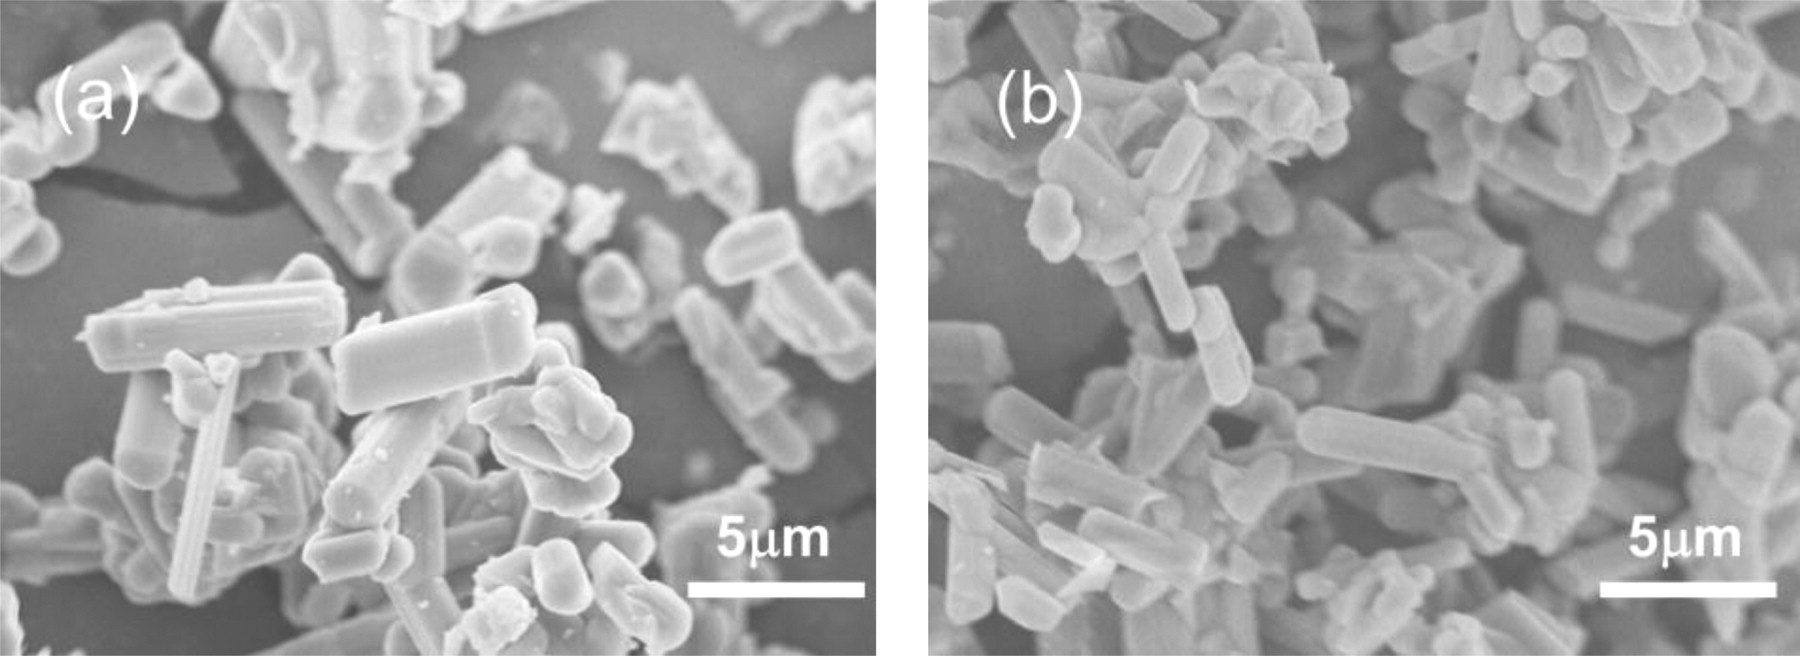
Figure 3. Scanning electron microscopy images of β-sialon:Eu particles when (a) only Si metal, and (b) only Si3N4 powers were used.
In the next, PLs from these samples were measured at room temperature. Typical PL emission spectra are shown in Fig. 4, for the samples with oxygen concentrations of 0.74, 0.40 and 0.33 wt%. (z = 0.13, 0.07 and 0.06) They correspond to the samples by using only Si3N4, the mixture of Si3N4 and Si, and only Si metal, respectively.
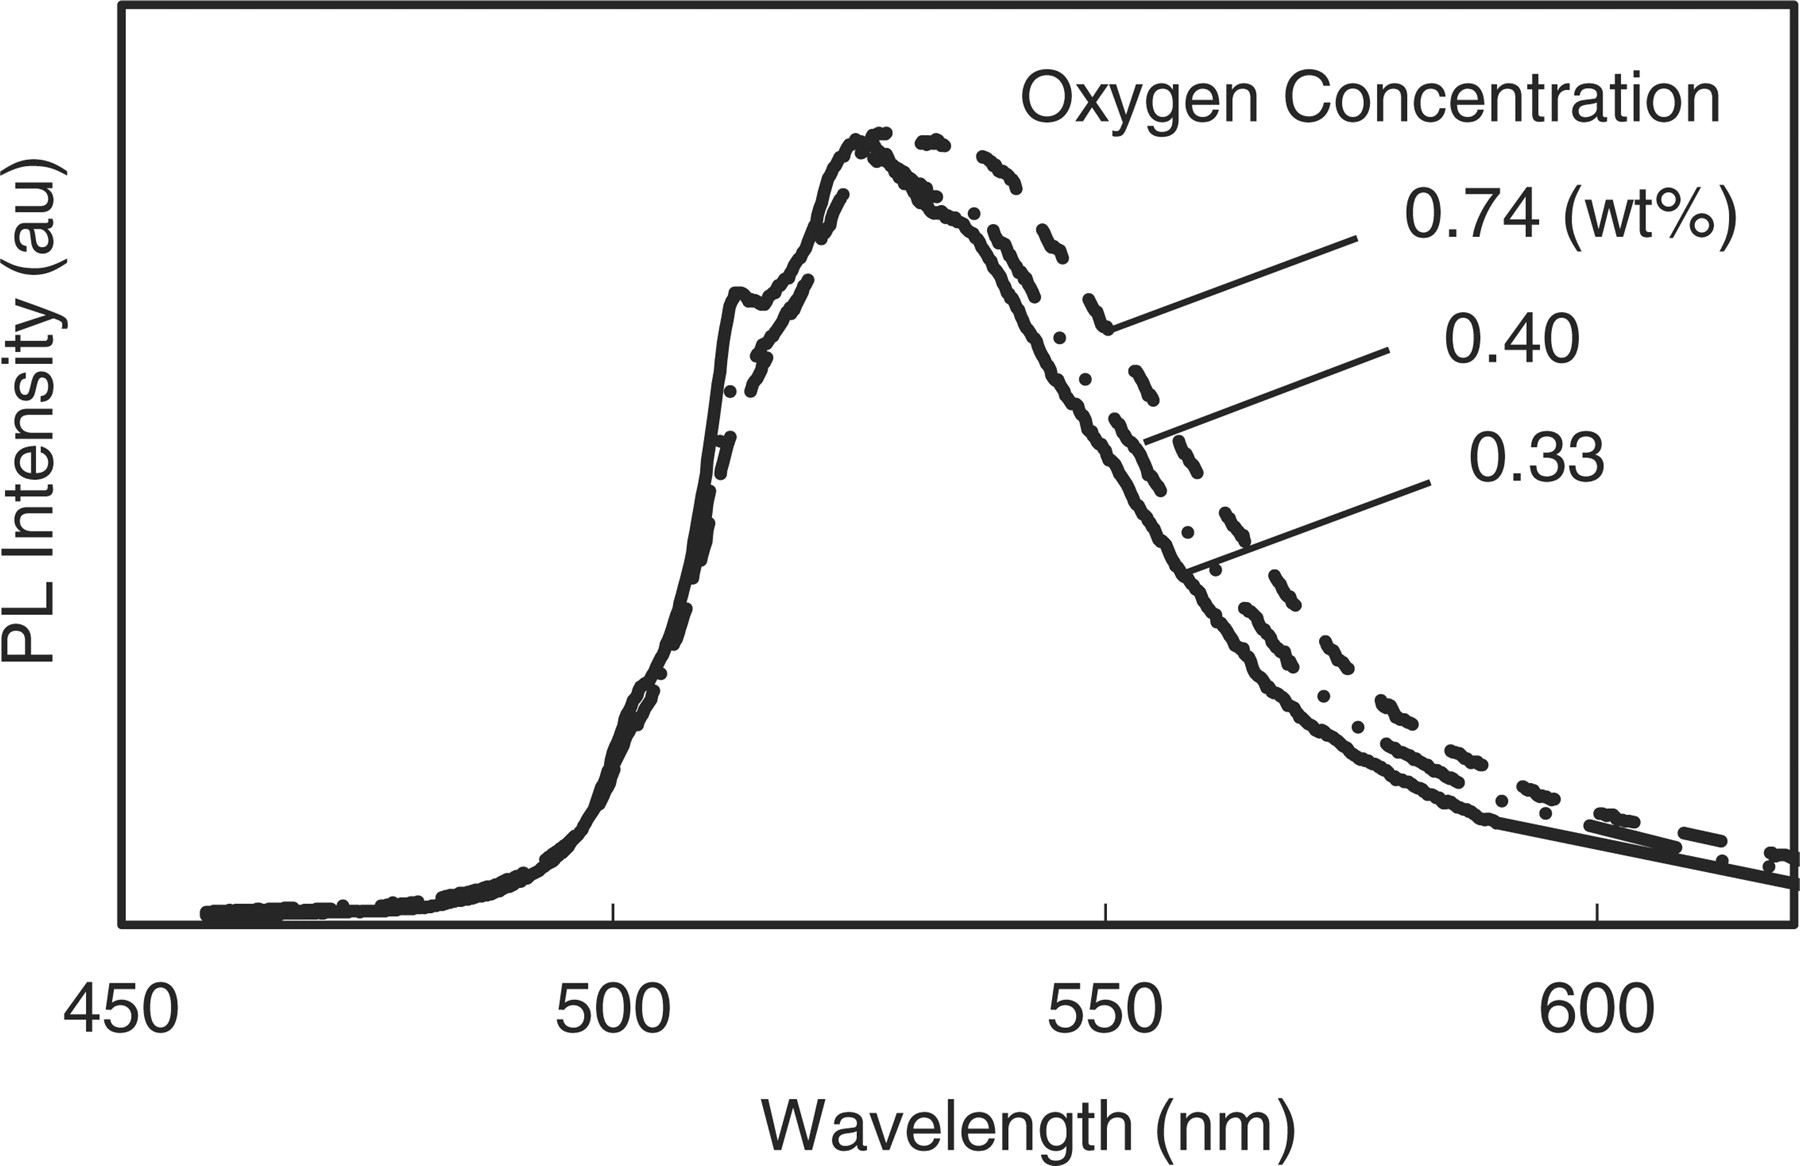
Figure 4. Photoluminescence spectra of β-sialon:Eu with varying oxygen concentrations.
The PL spectra were measured at the excitation maxima (∼300 nm). On accordance with the decrease of oxygen, the spectra move toward the short wavelength side and the line widths become small. The PL peak intensities from these samples were almost unchanged as shown. The dependence of the peak wavelength and the full width at half maximum (FWHM) on the oxygen concentration is plotted in Fig. 5 for all samples. The variation of the line width is much distinct. It changes from 53 nm to 47 nm by decreasing the oxygen concentrations. As seen in Fig. 4, the oxygen reduction scraped the longer wavelength side of the spectra. Although the peak wavelength change is rather vague, it shifts from 528 nm to 525 nm, which is thought to be consistent to the result extrapolated from the previous work mainly investigating the larger z value region. In these samples with small z values, however, it seems the change of shape near the spectral summit rather than a simple peak blue shift. The interesting fine structures with some shoulders and sub peak were observed. The above mentioned changes in PL are ascribable to the variation of the ligand field around Eu, in which oxygen may be the nearest neighbor. These changes of spectral shape will be investigated in detail in elsewhere.28

Figure 5. Dependence of the peak wavelength and the line width (FWHM) of β-sialon:Eu on oxygen concentrations.
The dependence of above mentioned PL character was kept similar for the case of 450 nm excitation which is useful for LED applications. Figure 6 shows the Commission International de l'Eclairage (CIE) chromaticity coordinates of the typical samples with 450 nm excitation. As seen, the coordinates move to x = 0.27 and y = 0.67, by decreasing the oxygen concentration. As a result, the blue-green color gamut can be extensively expanded to the outside of the triangle of the sRGB standard.
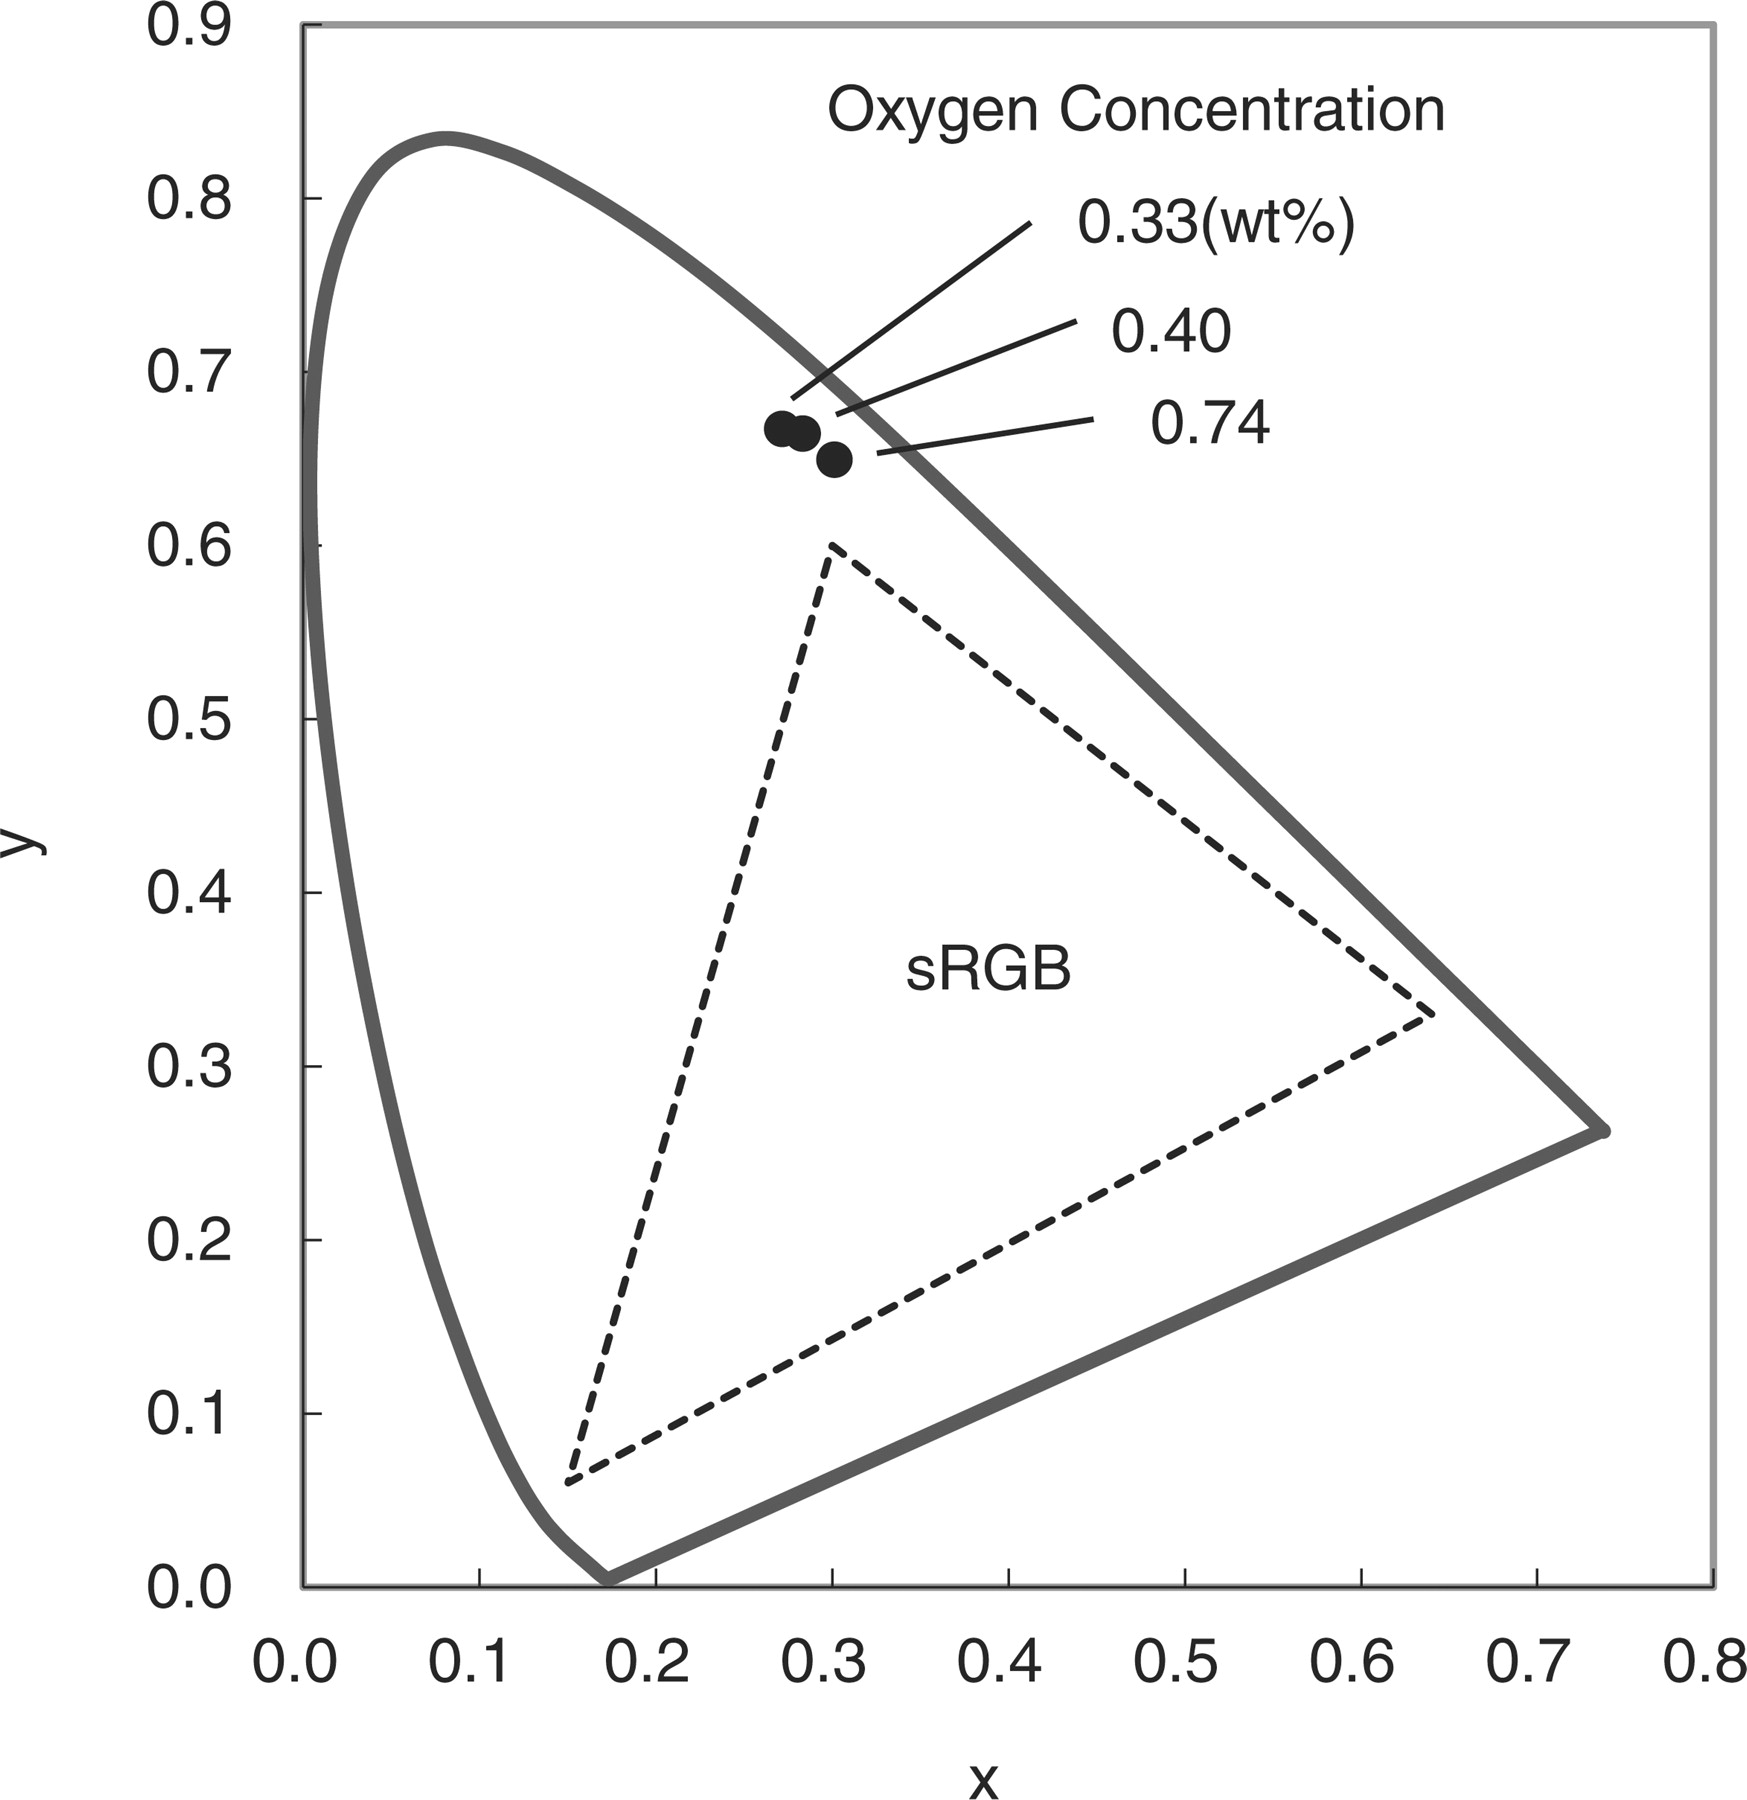
Figure 6. Chromaticity coordinates of β-sialon:Eu phosphors with low oxygen concentrations.
In conclusion, we have successfully synthesized β-sialon phosphors with low oxygen concentrations by using the high purity Si metal instead of the Si3N4 powder as the Si source. The oxygen concentration could be reduced down to 0.33 wt%, which corresponds the z value of 0.06. As a result, the distinct change of PL spectra was observed, which is desirable for the backlight application.