
Abstract
A one-dimensional computational framework is developed that can solve for the evolution of voltage and current in a lithium-ion battery electrode under different operating conditions. A reduced order model is specifically constructed to predict the growth of mechanical degradation within the active particles of the carbon anode as a function of particle size and C-rate. Using an effective diffusivity relation, the impact of microcracks on the diffusivity of the active particles has been captured. Reduction in capacity due to formation of microcracks within the negative electrode under different operating conditions (constant current discharge and constant current constant voltage charge) has been investigated. At the beginning of constant current discharge, mechanical damage to electrode particles predominantly occurs near the separator. As the reaction front shifts, mechanical damage spreads across the thickness of the negative electrode and becomes relatively uniform under multiple discharge/charge cycles. Mechanical degradation under different drive cycle conditions has been explored. It is observed that electrodes with larger particle sizes are prone to capacity fade due to microcrack formation. Under drive cycle conditions, small particles close to the separator and large particles close to the current collector can help in reducing the capacity fade due to mechanical degradation.
Export citation and abstract BibTeX RIS

This is an open access article distributed under the terms of the Creative Commons Attribution Non-Commercial No Derivatives 4.0 License (CC BY-NC-ND, http://creativecommons.org/licenses/by-nc-nd/4.0/), which permits non-commercial reuse, distribution, and reproduction in any medium, provided the original work is not changed in any way and is properly cited. For permission for commercial reuse, please email: oa@electrochem.org.
Due to their high energy and power density, lithium-ion batteries (LIBs) are being used extensively in the electrification of the automotive industry through the development of electric and hybrid electric vehicles (EVs and HEVs).1–3 Several mechanisms exist that can cause a reduction in the capacity of LIBs and subsequent loss of life.4–7 Growth of a solid electrolyte interface (SEI) layer on the carbon active particles of the anode is the major reason behind the loss of cyclable lithium ions.8–10 Lithium plating at low temperatures also results in loss of lithium and subsequent capacity fade.11 Delamination of the current collector from the electrode due to gas evolution in the electrolyte can significantly increase the internal resistance of the lithium-ion cell.12 Crack propagation, rupture, and isolation of portions of active particles can also cause loss of active sites where lithium atoms can intercalate, resulting in effective capacity fade.13 In the past two to three decades, capacity fade due to the formation of SEI8,10,14–17 and lithium plating18,19 have been investigated thoroughly. On the other hand, resistance growth and capacity fade due to delamination and site loss have not been explored extensively. In the recent past, some research initiatives have focused on characterizing the generation of diffusion-induced stress within the active particles.20 A computational methodology was developed to capture the formation of cracks based on the material heterogeneity of the anode active particles.21 In the present article, the authors have developed a comprehensive reduced order model (ROM) that can characterize the impact of microcrack formation (within anode active particles) on the electrode-level performance of LIBs.
The first effort towards development of computational models to characterize the behavior of porous battery electrodes was conducted by Newman,22,23 which is more commonly known as the "porous electrode theory." Several researchers have extended the pioneering work of Newman by incorporating the effect of transport limitations,24 electrode thickness25 and separator.17,24
The presence of two different porous electrodes (cathode and anode) was also taken into consideration while modeling LIBs.26 Experiments were also conducted to estimate different parameters and validate the "porous electrode theory".27 Transport of lithium ions through the electrolyte phase occurs via two mechanisms, diffusion (representative parameter being conductivity) and migration (represented by the transference number).28 Analysis of the competition between these two mechanisms on the cell performance was conducted to obtain optimum values for each of the parameters.29 Analytical expressions for maximum energy and power density obtainable from a LIB as a function of design parameters (such as, porosity, electrode, and/or separator thickness) were also developed.30 Relaxation phenomena inside dual lithium-ion insertion cells and their impact on the performance have also been studied.31 Impacts of ambient temperature and heat generation within the electrochemical cell on the overall performance of LIBs were investigated by modifying the "porous electrode theory" to incorporate the effect of temperature.32–35 A multi-scale multi-domain model has been developed by extending the "porous electrode theory" to capture the behavior of LIBs at different length scales (such as particle level, electrode level, and cell level).36 The effect of stress generation inside electrode active particles has been incorporated within the "porous electrode theory" to study its impact on cell performance.37,38 The "porous electrode theory" has also been extended to incorporate system-level parameters, such as, cost, life, and safety of the LIB.39
Generation of mechanical stress within LIB active particles has been investigated thoroughly in the last decade. The pioneering work along this direction was conducted by Christensen and Newman, who developed computational models to capture the stress generation inside lithium insertion materials.20 Later, this model was extended and applied to lithium-manganese-oxide cathode materials. It was observed that active particles with smaller size and larger aspect ratios experience reduced diffusion-induced stress, which can mitigate the chances of crack formation.40 Cohesive zone-based finite element models were developed to analyze fracture formation within thin film and cylindrical electrodes due to diffusion induced stress.41,42 Smaller preexisting crack fronts on the particle surface have the potential to propagate at a faster rate under high C-rate operations than its longer counterpart.43 For phase separating materials, crack propagation can happen even at extremely low rates of operation.44,45 However, explicit modeling of radial and non-radial crack propagation within circular cross section of spherical active particles was conducted much later.21,46 The effect of ambient temperature on the evolution of diffusion-induced stress revealed that mechanical degradation is prone to occur more in low temperature operations.47 Experimental characterization of microcrack evolution within active particles can be conducted using acoustic emission technique.48,49 Computational models, developed later, support the saturation in brittle fragmentation observed in both the experimental articles.50 Analysis of stress generation in a non-uniform electrode microstructure has also been incorporated within the "porous electrode theory".51 According to the knowledge of the authors, capacity-fade due to mechanical degradation within the active particles has not yet been modeled together with the "porous electrode theory."
Detailed modeling of a physical phenomenon requires solution of partial differential equations that derive from either mass conservation, momentum balance, and/or energy conservation principles. For complex geometry and variable physical parameters, these partial differential equations need to be discretized using some numerical technique (finite difference, finite volume, or finite element method), and a series of linear algebraic equations needs to be solved to obtain the correct solution.52 Reduced order modeling is a technique that gives reasonably good approximate solutions to these partial differential equations without using any numerical discretization technique.53,54 Reduced order solutions are also applicable only under certain operational constraints and may fail severely when applied to situations away from those constraints. Application of reduced order modeling significantly decreases the number of unknowns that need to be solved for. Development of ROMs for complicated physical systems significantly helps in the implementation of control-based theories.55 A ROM of diffusion within the solid active particles has already been incorporated within the "porous electrode theory".56,57 ROMs of the entire "porous electrode theory" have also been developed to capture the cell performance under high charge-discharge rates.53,54 From a phenomenological perspective, ROMs have been developed to capture the mechanical degradation of active materials.13 Coupling of mechanical and chemical degradation using ROMs has been conducted to investigate the enhancement in capacity fade due to SEI growth on microcracks located on active particle surfaces.58 ROMs for estimating cell life have been used extensively for EV and drive cycle applications.59 ROMs for capacity fade due to lithium loss and reduction of active sites have been developed and used to explain experimentally observed data under different operating conditions.5
In this article, a ROM will be developed that can predict the evolution of mechanical degradation within active particles under different operating conditions. The impact of microcrack formation on the effective diffusivity of the solid phase will also be elaborated. Finally, the ROM of mechanical damage will be associated with a "porous electrode theory", and capacity fade during single discharge as well as multiple charge-discharge cycles will be analyzed. Different drive cycle scenarios will also be studied using this computational technique. Possible design modifications will be suggested that can reduce the capacity fade due to mechanical degradation of the active particles.
Methodology
Commercially available lithium ion batteries (LIBs) involve two electrodes separated by a porous separator.60 The actual microstructure of the electrodes involves four different phases; active materials, binders, conductive additives, and electrolyte.61 The separator itself is a porous membrane through which electrolyte can flow. Detailed modeling of all these different phases accurately is a very complicated task and most of the time impossible to achieve due to the lack of computational resources. To capture all the relevant physics without modeling all the different phases, a homogenization technique has been developed to characterize the behavior of the electrodes as a bulk material. The different physical phenomena that go on inside the electrode (such as diffusion and migration of ions, maintaining electro-neutrality at each point throughout the cell) have been taken into consideration. This homogenized model is known as the "porous electrode theory." It was first developed by Newman and Tobias (see Ref. 22) and later updated by Newman and Tiedemann (see Ref. 23) for battery-specific applications. Figure 1 shows schematic diagram of a cell that is usually adopted in "porous electrode theory". Over the past few decades, this "porous electrode theory" has been implemented to several different electrode chemistries and battery systems. A brief overview of this "porous electrode theory" has been provided in Appendix
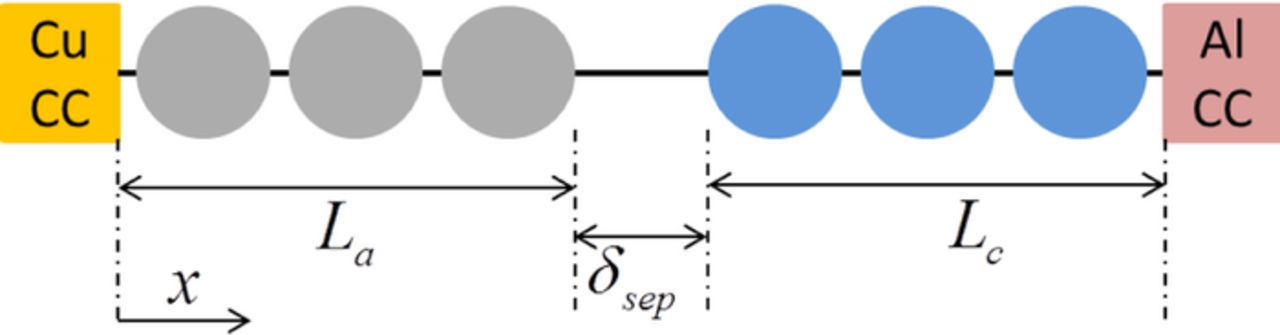
Figure 1. Schematic representation of the "porous electrode theory" for modeling of 1D+1D Li transport in a Li-ion cell.
Relation between microcrack density and diffusivity
If an active particle of fixed radius is delithiated and lithiated at a constant rate for multiple cycles, it will experience mechanical degradation due to diffusion induced stresses. Several acoustic emission based experiments have been conducted to understand how fracture evolves within solid active particles.48,49,62 In all the three research articles, it has been reported that mechanical degradation initiates at the first lithiation-delithiation cycle. Maximum amount of microcrack evolves in the first one or two cycles. After three to four cycles, damage evolution almost saturates. Insignificant amount of mechanical degradation occurs in subsequent lithiation-delithiation cycles. A similar behavior in terms of saturation in microcrack formation has been reported by the authors in an earlier article.50 How fast the damage grows, and at what magnitude it saturates, depends on the particle size and rate of operation. Since the evolution of microcrack initially increases and eventually saturates, the best numerical approximation of such a behavior will be provided by the increasing form of an exponential decay curve.
A reduced order model has been developed to estimate the amount of microcrack formation under certain C-rate operating conditions and for particular particle sizes (Rs). A simplified expression for microcrack density (or fraction of broken bonds, fbb) as a function of amp-hour-throughput (Ahtp) can be written as,
![Equation ([1a])](https://content.cld.iop.org/journals/1945-7111/162/9/A1751/revision1/jes_162_9_A1751eqn1.jpg)
![Equation ([1b])](https://content.cld.iop.org/journals/1945-7111/162/9/A1751/revision1/jes_162_9_A1751eqn2.jpg)
Here Amax signifies the maximum amount of damage that can occur in an active particle and mrate stands for the rate at which damage evolution occurs. Both the Amax and mrate parameters are functions of C-rate (Crate) and particle size (Rs). More detailed expressions of the maximum damage and rate of damage will be provided in sub-section Development of a reduced order model of the Results and discussion section. It has been argued in Barai and Mukherjee21 that formation of a microcrack increases the tortuosity of the diffusion pathway resulting in reduced diffusivity of the active particle. An expression for effective diffusivity has been developed to correlate the microcrack density with the diffusivity of the active particle, which is given as,
![Equation ([2])](https://content.cld.iop.org/journals/1945-7111/162/9/A1751/revision1/jes_162_9_A1751eqn3.jpg)
where Ds denotes the solid phase diffusivity in the anode active materials without any mechanical degradation. The solid phase diffusivity (Ds) (also used in Eqs. A1a and A1b) is replaced by the expression of effective diffusivity as obtained from Eq. 2. It has been demonstrated that reducing the local diffusivity of the active particle could capture the effect of mechanical degradation on the diffusion of lithium species.21 The simulation of diffusion inside active particles and mechanical degradation has been conducted in a circular 2D domain. For different particle sizes and different C-rates, certain values of surface concentration were obtained from the 2D simulations taking into account the effect of microcracks. For the same particle sizes and C-rates, 1D simulations were conducted with constant values of diffusivity that can generate the same surface concentration as that obtained from the 2D simulations. The diffusivity value for the 1D simulations has been obtained from Eq. 2. Estimation of the exponent γ has been conducted by comparing the surface concentrations from 1D and 2D analyses. More elaborate explanation behind the exact value of the exponent (γ) will be provided towards the end of sub-section Development of a reduced order model of the Results and discussion section.
In the computational analysis, fraction of broken bonds or microcrack density (fbb) is defined as the ratio of broken elements over total number of elements. Here elements refer to a computational entity and does not have any experimentally observable counterpart. Thus, the term fbb turns out to be a dimensionless number. Based on dimensional analysis, the term Amax turns out to be dimensionless. Whereas, the term mrate must maintain the dimension of (Ahtp)− 1 to achieve dimensional equality within the exponent. However, the two defining terms (Amax , mrate) used in the reduced order model does not have any direct experimentally measurable counterparts. Acoustic emission is a methodology to measure the extent of mechanical degradation in solid materials. Cumulative strain energy release measured form acoustic emission experiments is equivalent to the damage profile observed in the present context.48,62 Hence, an experimental counterpart of the maximum amount of mechanical degradation parameter (Amax ) is the maximum cumulative strain energy release observed from acoustic emission experiments. Saturation in the strain energy release has been reported in several experimental articles,48,49,62 which is equivalent to the saturation in evolution of microcrack density observed by the authors.50
Most of the reduced order models are derived from systematic reduction of governing differential equations. But if the phenomenon under consideration cannot be characterized by a governing differential equation, then based on the trend, phenomenological models can be developed to capture the variation.13 In the present context, evolution of microcrack density cannot be captured using any differential equation. It is possible to develop reduced order models for stress generation, but fracture formation is rather a stochastic process because material heterogeneity is also involved there.63 Due to the lack of governing equations, it is important to have phenomenological models for predicting damage evolution. Usually empirical models are mathematical expressions that are developed entirely based on data. No physical significance exists behind particular mathematical expressions. However, in the present context, the saturation phenomenon in mechanical degradation can be explained from the strain energy release perspective.21,47,50 Under externally applied load, evolution of mechanical degradation happens to release the excessive strain energy that the system cannot sustain. During lithiation – delithiation process, the same amount of diffusion induced load acts on the system. The strain energy release required for sustaining the concentration gradient induced load is achieved within the first few discharge – charge cycles. As a result, during subsequent lithiation – delithiation process, extra strain energy release is not required. This leads to saturation in the amount of mechanical degradation. Here, an inherent assumption is that the lithiation – delithiation process occurs at a constant rate. The maximum amount of mechanical degradation depends on the particle size and C-rate of operation, through the magnitude of concentration gradient term. Thus there exists some form of physical significance behind the equations adopted in this study. To calculate the amount of microcrack formation, the governing differential equations are not being solved in details. As a result, the physics based mathematical representation of damage evolution can be described as a reduced order model of a complicated phenomenon.
Numerical procedure
The entire computational methodology adopted in the present context can be divided into several smaller components. Firstly, diffusion of lithium inside a circular cross section of a spherical particle have been solved using the time dependent Fick's law. The concentration gradient inside the active particles give rise to diffusion induced stress (DIS). Secondly, generation of DIS can lead to formation of microcracks, which can be captured by solving the momentum balance equation. Nucleation and propagation of microcracks produce spanning cracks. Details of the computational methodology used to obtain the spanning cracks have been described by the authors in earlier articles.21,47 A brief description of the same computational technique will be provided below. Time dependent diffusion equation is solved using the finite volume method on a 2D square grid. Constant flux boundary condition is applied on the surface of the circular active particle. Two dimensional lattice spring methods have been used to capture the microcrack formation within the active particles. The main essence of this methodology is that the entire mass of the continuum can be assumed to be discretized within uniformly distributed nodes. Each of the nodes is connected by spring elements. This spring elements display axial as well as shear resistance. Under externally applied diffusion induced load, these lattice spring elements deform to maintain equilibrium within the structure. This gives rise to evolution of strain energy within each of the springs. If the energy stored in an element exceeds its fracture threshold, it is assumed to be broken and irreversibly removed from the network of lattice springs. Subsequent rupture of adjacent spring elements due to diffusion induced stress can give rise to formation of spanning cracks within the active particles. The variable "fraction of broken bonds" (fbb) is defined as the ratio of number of broken springs over the total number of springs that exist within the domain.
Formation of a microcrack hinders the diffusion pathway of active particles, and increases the tortuosity within the material.21 This is taken into account within the 2D diffusion solve by modifying the diffusivity parameter only at the point where mechanical degradation occurred. Such modification of the local diffusivity resulted in higher values of concentration gradient within the active particles. Surface concentration decreases much faster during the delithiation process due to formation of microcracks. Consequently, reduction in effective capacity is observed due to increased mass transport resistance.
To solve for this capacity fade due to mechanical degradation in the anode active particles, the effective solid phase diffusivity has been extracted from Eqs. 1a and 2. The values of diffusion coefficient in individual active particles under different amounts of microcrack density have been estimated. After that, it is implemented within the 1D computational framework for electrode level analysis (Eq. A1a). Because the evolution of voltage and capacity within an electrode is a transient process, the governing differential equations (Eqs. A1a, B4, B5 and B6) are solved in an incremental fashion by taking small steps over the time variable. At each time steps, the increment in microcrack density for every particle in the negative electrode is estimated according to the following rate equation:
![Equation ([3])](https://content.cld.iop.org/journals/1945-7111/162/9/A1751/revision1/jes_162_9_A1751eqn4.jpg)
Eq. 3 has been obtained by taking the first derivative of Eq. A1a with respect to the independent variable Ahtp. In a small time increment, the incremental amp-hour-throughput (Ahtp) is also small. Thus, the total amount of microcrack density after a small time increment can be obtained as:
![Equation ([4])](https://content.cld.iop.org/journals/1945-7111/162/9/A1751/revision1/jes_162_9_A1751eqn5.jpg)
Here, Ahtp is the amp-hour-throughput at the end of the present step, Ahtp0 is the amp-hour-throughput at the end of the previous step, and ΔAhtp is the incremental amp-hour-throughput. The effective diffusivity under this modified amount of microcrack density has been estimated from Eq. 2, and fed into Eq. A1a of the 1D coupled-electrode level model. Reduction in solid phase diffusivity increases the resistance due to mass transport and results in an effective capacity fade of the lithium ion cell. The capacity fade due to reduction in solid phase diffusivity becomes more prominent under high C-rate operating conditions.
For the single discharge simulations, the initial state of charge (SOC) is assumed to be 0.9 in the negative electrode and 0.35 in the positive electrode. These values of SOC resulted in an initial voltage of approximately 4.3 V. The lower cut-off voltage for lithium ion cells has been assumed to be 2.4 V for hard-carbon based anodes. For analyzing cycling performance, the lithium ion battery is assumed to be in a discharged state. It is charged to an upper voltage limit of 4.2 V at a very slow rate (0.05 C). Discharge-charge cycles are conducted on these electrodes to estimate the cycling performance of an LIB under different design (particle size) and operating conditions (C-rate). The parameters used in the simulations are listed in Table I. Evolution of mechanical degradation within single active particles as well as different particles located at different portions of the electrode are elaborated in the Results and discussion section.
Table I. List of parameters used to solve the one dimensional lithium-ion battery model. All the parameters shown below have been adopted from Gu and Wang (see Ref. 32) and Guo et al. (see Ref. 33).
| Name | Units | Anode | Separator | Cathode |
|---|---|---|---|---|
| Length (La, δsep, Lc) | m | 130e-6 | 26e-6 | 130e-6 |
| Porosity (ε) | – | 0.357 | 0.41 | 0.444 |
| Solid conductivity (σ) | S/m | 100 | – | 3.8 |
| Electrolyte diffusivity (De) | m2/s | 7.5e-11 | 7.5e-11 | 7.5e-11 |
| Solid diffusivity (Ds) | m2/s | 3.9e-14 | – | 1.0e-13 |
| Particle radius (Rs) | m | 12.5e-6 | – | 8.5e-6 |
| Temperature (T) | K | 298.15 | 298.15 | 298.15 |
| Initial electrolyte concentration (ce, init) | mol/m3 | 2000 | 2000 | 2000 |
| Transference number (t+) | – | 0.363 | – | 0.363 |
Results and Discussion
LIBs are manufactured in factories in a discharged state.64 They are then charged in a controlled environment and at a low C-rate (C/20). According to some of the previous works by the authors, no mechanical damage evolution occurs during lithiation or delithiation under low rate operations.21,47 Most of the microcrack evolution occurs during and after the first discharge process. Additionally, mechanical degradation has only been observed during high C-rate operations. The formation of microcracks along the radial direction plays a major role in determining its impact on cell performance. All the simulations and analysis that will be reported in the next four figures (Figures 2 to 5), have been conducted on a two-dimensional single active particle. The theory behind the 2D single particle simulations can be found in a previous article by the same authors.21 Figure 2 and Figure 3 discusses about the evolution of microcrack density in a 2D circular cross section of a spherical particle. Effect of mechanical degradation on diffusion process has been taken into account by decreasing the local effective diffusivity due to increased tortuosity of the diffusion pathway. This modification in diffusivity due to microcrack formation has been incorporated within the 2D model. The computational model adopted for this 2D analysis has been described in detail in a previous article (see Ref. 21). Diffusion process in a circular cross section can also be simulated in a simplified fashion by solving for concentration only along the radial direction. This will be referred to as 1D model in the following sub-section development of a reduced order model. Usage of a constant value of effective diffusivity can help us to capture the reduction in local diffusion coefficient due to microcrack formation. Diffusion of lithium species within the solid active particles is captured using this technique (also provided in Eq. A1a). Effect of mechanical degradation in solid phase is taken into account by expressing the value of effective diffusivity (Deffs) as a function of microcrack density (fbb) (see Eq. 2). Point to be noted, this analysis is not the 1D Newman type "porous electrode theory". Results of the 1D "porous electrode theory" will be discussed from sub-section Effect of coupling mechanical degradation into 1D electrode level model onwards.
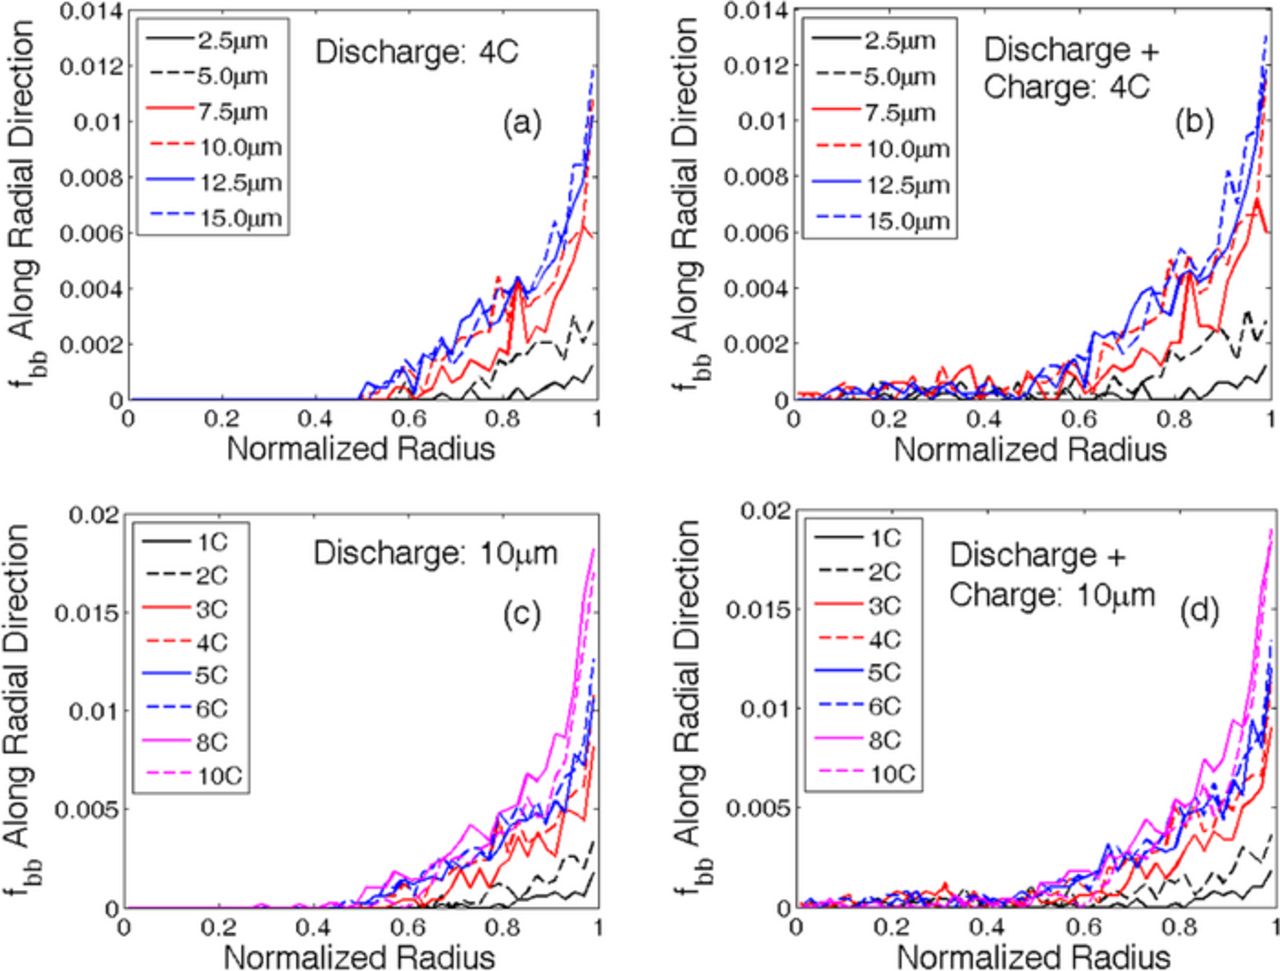
Figure 2. Fraction of broken bonds along the radial direction showing evolution of damage during discharge and charge processes. (a) After discharge at 4 C (delithiation), for all the particle sizes, microcracks predominantly develop near the particle surface. (b) Subsequent constant-current-constant-voltage charge process at 4 C (lithiation) creates some microcracks close to the center. (c) Discharge at multiple C-rates for a particle size of 10 μm, also shows damage predominantly located near particle surface. (d) CCCV charge after the discharge process causes some microcrack evolution close to the center, but compared to the peripheral region it is insignificant. Thus, majority of the damage evoltuion occurs close to the surface of the particle.
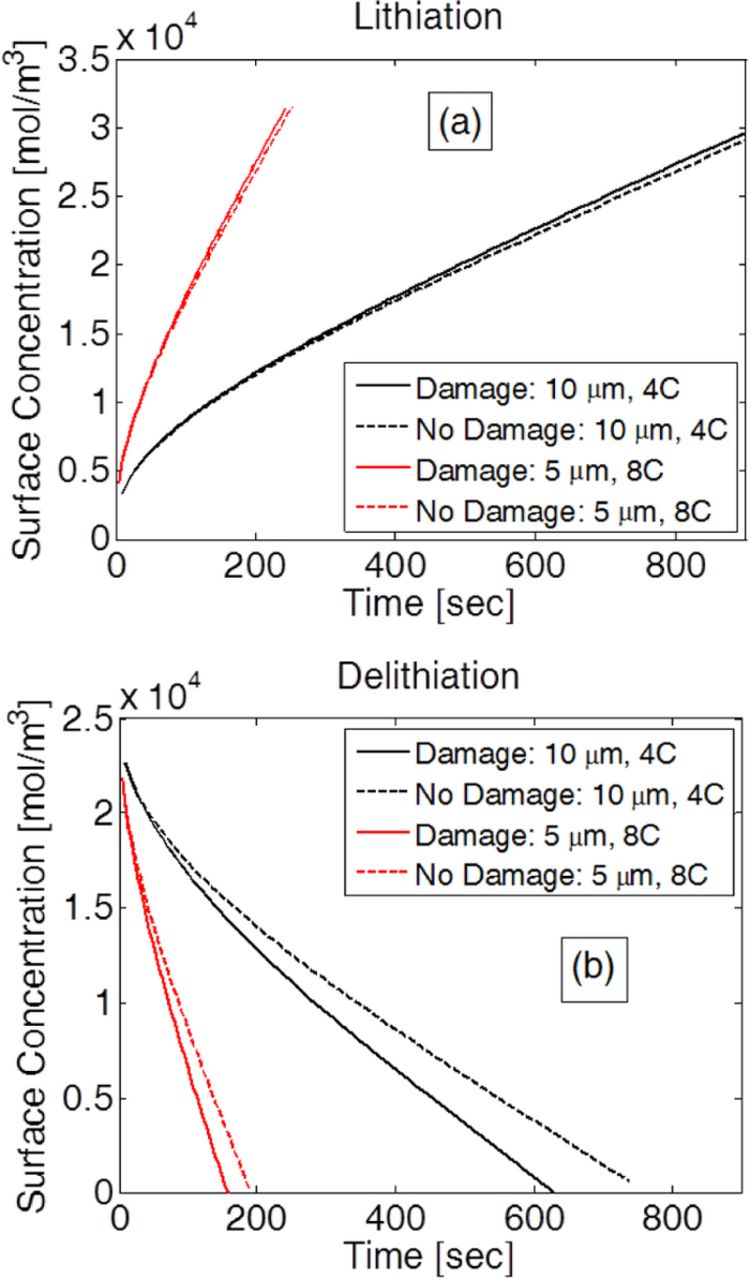
Figure 3. Variation in surace concentration due to the effect of damage during (a) Lithiation and (b) Delithiation. Two different design and operating conditions were considered: i) Particle size 10 μm and operation at 4 C, and ii) Particle size 5 μm and operation at 8 C. (a) For both the operating conditions, during lithiation, damage evolution occurs at the center. It does not affect the surface concentration significantly. (b) During delithiation, peripheral damage evolution affects the surface concentration more significantly. Most of the electrochemical reactions are governed by the surface concentration only. Damage evolution close to the surface during delithiation will be modeled.
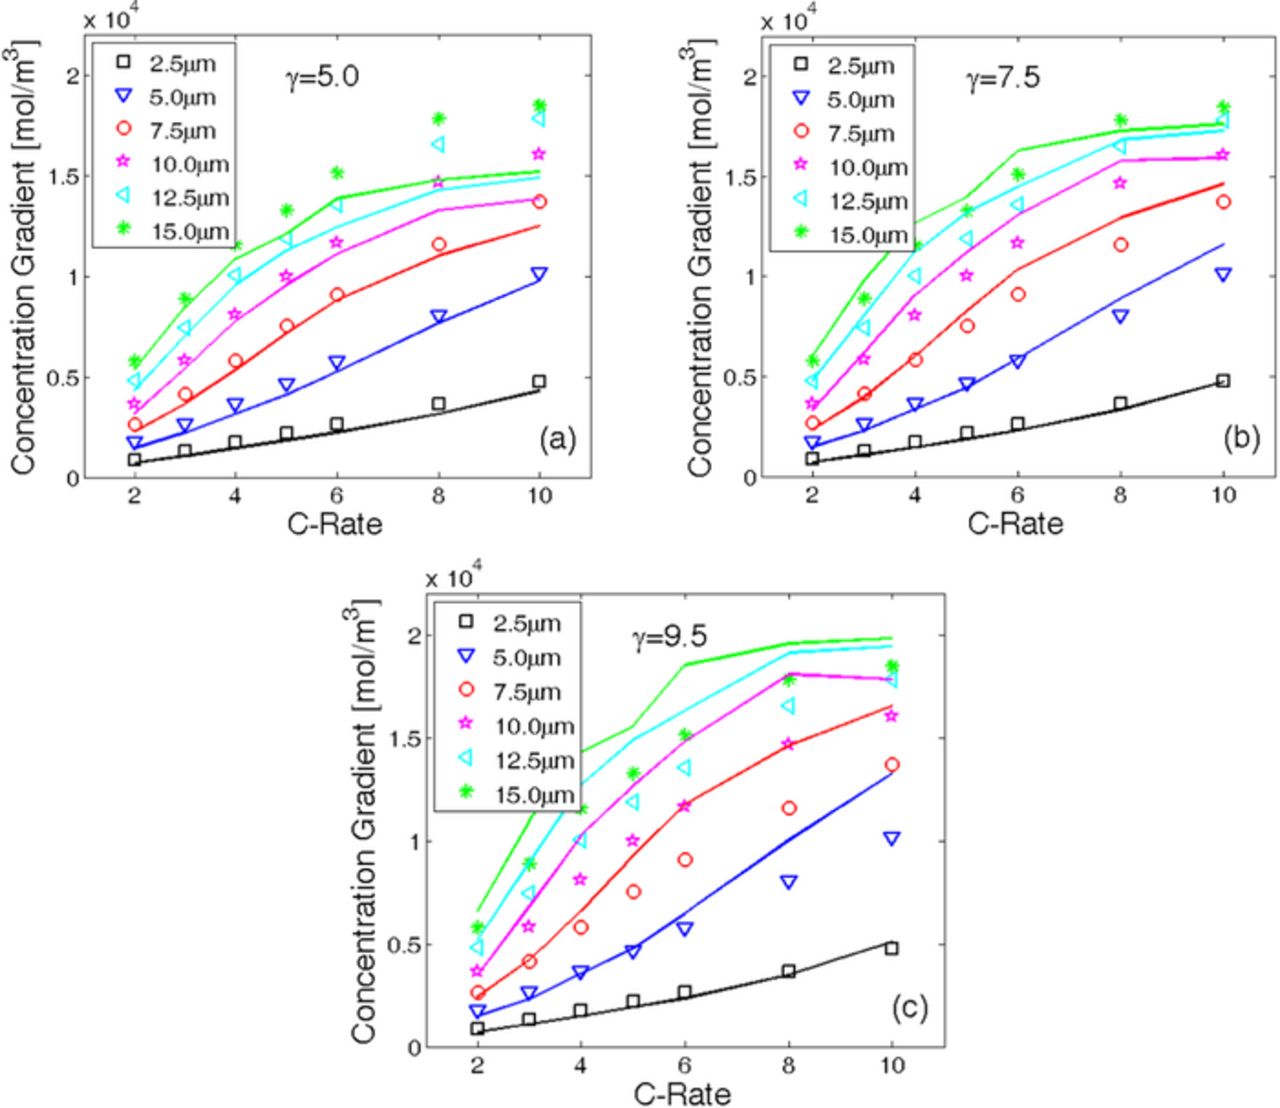
Figure 5. Estimation of the parameter γ in Eq. 2. For different C-rate and different particle size, the concentration gradient at the end of the simulation for 1D (lines) and 2D (symbols) analysis has been compared. (a) γ = 5.0 underestimates the concentration gradient for large particles under high C-rate operating conditions. (b) γ = 7.5 estimates the concentration gradient for all particle sizes at all C-rate in a relatively accurate fashion. (c) γ = 9.5 significantly overestimates the concentration gradient for most of the particle sizes at high C-rate operation. Thus γ = 7.5 is the most accurate approximation and will be adopted in the subsequent studies.
In Figure 2, microcrack density (fbb) along the radial direction of a graphite anode has been plotted with respect to the normalized radius after the first discharge and the subsequent charge process. Figure 2a demonstrates the distribution of fbb along the radial direction after constant current discharge at 4 C for different particle sizes (2.5 μm – 15.0 μm). Similarly, Figure 2c shows the microcrack density for a 10.0 μm particle after constant current discharge under a wide range of C-rates (1 C – 10 C). In both of the abovementioned cases, delithiation occurs during the discharge process. The first delithiation gives rise to significant amounts of damage evolution close to the periphery of the active particles. No damage is observed near the center of the active particles during the first discharge process.
Figure 2b demonstrates the microcrack density along the radial direction after constant current (CC) discharge and constant current constant voltage (CCCV) charge at 4 C for different graphite particle sizes (2.5 μm – 15.0 μm). Similarly, Figure 2d gives an example of microcrack density along the radial direction for a 10.0-μm graphite particle after CC discharge and CCCV charge at a wide range of C-rates (1 C – 10 C). During the charge process, lithiation occurs within the anode active particles. Formation of tensile stress close to the center of the particle gives rise to mechanical degradation at the center during the lithiation process. In Figures 2b and 2d, minor microcrack evolution can be observed close to the center of the graphite active particle after the charge process. However, microcrack density after the first discharge-charge process along the periphery of the graphite active particle is much greater than the mechanical damage at the center. Because the mechanical degradation at the central portion of the active particle during lithiation is minor, monitoring only the peripheral damage evolution during delithiation should be sufficient for successfully capturing the effect of microcrack density on the effective diffusivity of the anode active particles.
The results reported in Figure 3 show the extremely minor impact of central damage evolution on the surface concentration of the active particles as compared to that of the peripheral damage evolution. This supports the hypothesis made with regard to Figure 2, namely monitoring damage evolution along the periphery of the active particle should be sufficient to capture the impact of microcrack density on the diffusivity of the active particles. Two different particle sizes (5 μm and 10 μm) operating at two different C-rates (4 C and 8 C) are taken into consideration for analyzing the impact of microcrack density on surface concentration. In Figure 3a, surface concentrations during lithiation for a 10 μm particle operating under 4 C (black line) and another 5 μm particle operating at 8 C (red line) are reported. Surface concentrations with and without taking damage evolution into consideration are represented by the solid and dashed lines, respectively. During lithiation, damage evolution occurs at the center of the active particle. Extremely small differences between the surface concentration with and without damage evolution lead to the conclusion that microcrack formation at the center of the active particles does not impact the surface concentration significantly during the lithiation process.
However, during the delithiation process, damage evolution occurs close to the peripheral region of the active particles. In Figure 3b, for both the 10 μm particle operating at 4 C (black line) and the 5 μm particle operating at 8 C (red line), the surface concentrations without damage (dashed line) is significantly larger than the surface concentration with damage (solid line). Thus, microcrack evolution during delithiation has a significant impact on the surface concentrations of the active particles. To estimate the open-circuit-potential, only the surface concentrations of the solid active particles have been used. As a result, from the electrochemical perspective, only the surface concentration of the active particles has an impact on the behavior of the LIB. Microcrack formation at the center of the active particle during lithiation has an insignificant impact on the surface concentration. Thus, it is unnecessary to track the evolution of microcrack density during the lithiation process. Capturing the evolution of damage along the periphery of the active particles that occurs during the delithiation process is sufficient for tracking the change in surface concentration and, subsequently, the behavior of the LIB.
It should be noted that, the delithiation process, which corresponds to discharge, is conducted under constant current (CC) condition. However, the lithiation phenomena corresponding to the charge process, is conducted under constant current constant voltage (CCCV) condition. As a result, during operation at 4 C, it is possible to reach only 800 s during the delithiation process, whereas, simulation can be conducted till 900 s during the charge process.
Development of a reduced order model
According to the authors, evolution of microcrack density occurs toward the beginning of the delithiation process.21,47 Eventually, the amount of microcrack formation reaches a state of saturation, and no further increase in mechanical degradation is observed during subsequent discharge-charge cycles. Thus, an exponential increase in damage evolution followed by saturation can be successfully captured by Eq. 1a provided in the Methodology section. The maximum amount of damage (Amax ) and the rate of damage evolution (mrate) depend on the particle size (Rs) and the C-rate at which the simulation is being conducted. The purpose of reduced order modeling is to develop an analytical expression that can approximately predict the microcrack density (fbb) under certain particle size and C-rate operating condition. Following Eq. 1a and 1 a, the unfinished task is to estimate an analytical representation of Amax and mrate as a function of particle size and C-rate. Evolution of microcracks has been simulated for six different particle sizes, Rs = [2.5 μm, 5.0 μm, 7.5 μm, 10.0 μm, 12.5 μm, and 15.0 μm], and eight different C-rates [1 C, 2 C, 3 C, 4 C, 5 C, 6 C, 8 C and 10 C], for each of the particles. Damage evolution for each of these cases were estimated by solving the detailed 2D models developed by the authors in an earlier article.21 The damage evolution vs. amp-hour-throughput curve for each of the particle sizes at every C-rate has been plotted separately. The optimum values of Amax and mrate has been estimated using a least-square minimization based fitting technique. Different particle size operating at different rates produce different magnitudes of Amax and mrate. Two generalized analytical expressions have been developed that can capture the variation in Amax and mrate for various particle sizes and C-rates, which are also provided below,
![Equation ([5a])](https://content.cld.iop.org/journals/1945-7111/162/9/A1751/revision1/jes_162_9_A1751eqn6.jpg)
and
![Equation ([5b])](https://content.cld.iop.org/journals/1945-7111/162/9/A1751/revision1/jes_162_9_A1751eqn7.jpg)
where, Rs represents particle size and Crate signifies how fast the active particles are delithiated and lithiated. The two expressions provided in the Eqs. 5a and 5b have been estimated by using a least square fitting method. The general form of this expression has been obtained based on the physics of the problem. Figure 4a demonstrates that Eq. 5a can estimate the values of Amax with R2accuracy equal to 0.9066. Similarly, as depicted in Figure 4b, Eq. 5b can predict the values of mrate with R2accuracy equal to 0.8051. The different parameters used in Eqs. 5a and 5b are obtained using the "nlinfit" function embedded in MATLAB. These analytical expressions given in Eqs. 5a and 5b along with Eq. 1a constitute the reduced order model for predicting microcrack density inside active particles. The R2 value for Amax is 0.9, which is definitely good for prediction purposes. However the R2 value of mrate is only 0.8 that is not sufficiently good for prognosis purpose. Since the maximum value of mechanical degradation depends on Amax , and mrate just dictates how quickly/slowly the maximum value is reached, not very accurate prediction for mrate can still be applied for prediction purposes. The inaccuracy introduced by R2 value of 0.8 for the mrate parameter, will have minor impact on the final prognosis. This reduced order model is applicable to active particles of different size and operating at different C-rates but maintained at a fixed room temperature (T = 25°C) condition. Reduced order models of microcrack density applicable to different operating temperatures were not investigated in this study and will be reported as part of a separate article.
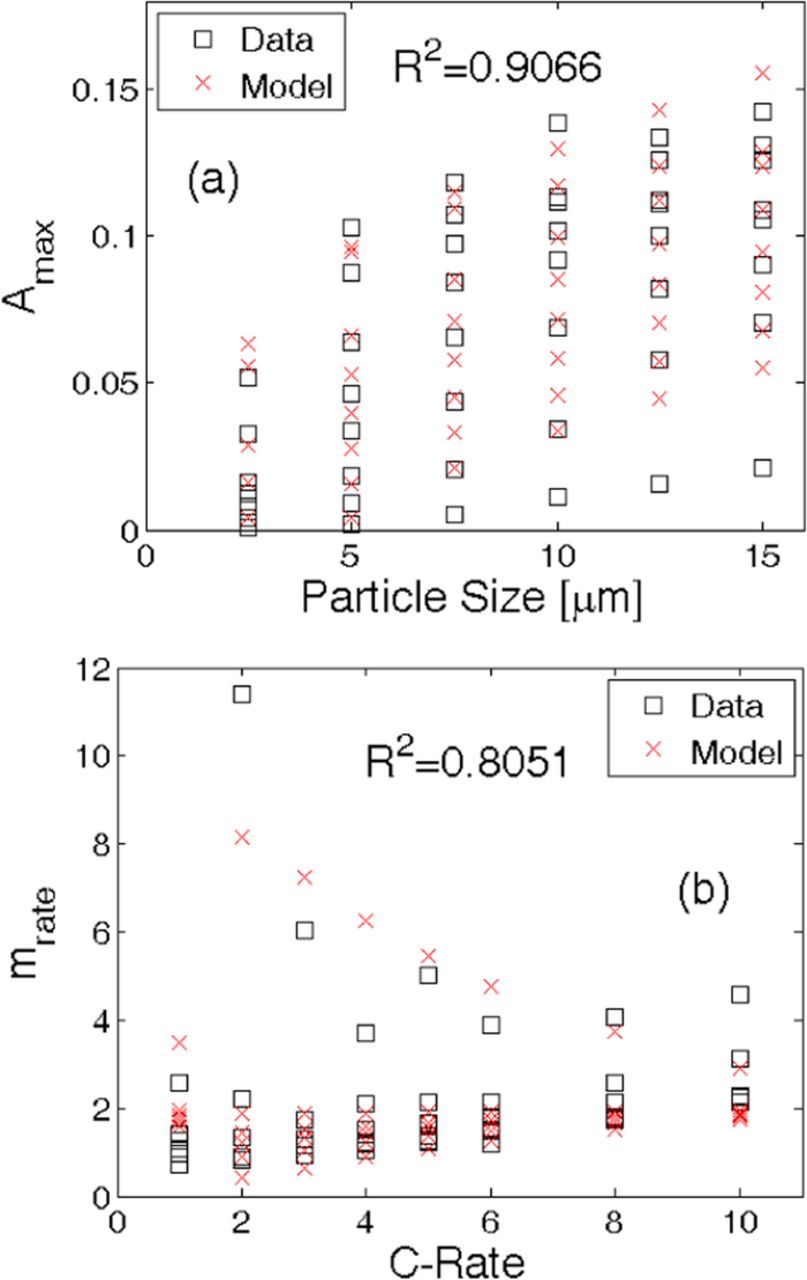
Figure 4. Reduced order model fits for Amax and mrate parameters in Eq. 5a and Eq. 5b as functions of C-rate and particle size. (a) The maximum amount of damage (Amax ) for different particle sizes and C-rates can be captured till an R2 value of 0.9066 using the analytical expression provided in Eq. 5a. (b) The rate of damage evolution (mrate) can be predicted by the analytical expression given in Eq. 5b with an accuracy of R2 equal to 0.8051. The "data" (given by black squares) were obtained from detailed 2D simulations developed in Barai and Mukherjee JES (2013).21 The model predictions (given by red crosses) are estimations from Eqs. 5a and 5b, which has been developed as a part of this manuscript.
Once an approximate expression for the evolution of microcrack density is established, it is important to characterize how the mechanical degradation affects the solid phase diffusivity of the active particles. In earlier articles, it was argued by the authors that formation of a microcrack hinders the diffusion pathway of lithium.21,47,50,65 In the presence of a microcrack, the ions take a more tortuous pathway to traverse from one point to another, which eventually results in reduction of the diffusivity of the active particles. To capture this deterioration in the diffusion coefficient due to evolution of microcracks, an analytical expression is suggested in Eq. 2. The only unknown term in the right hand side of that equation is the exponent γ. In the 2D simulations reported here, the impact of local microcrack formation on the diffusion of lithium species is taken into consideration by decreasing the local diffusivity. Thus, the effect of increased tortuosity is incorporated within the 2D simulations. The concentration gradient obtained from the 2D simulation incorporates the effect of microcrack formation within itself. Here concentration gradient refers to the difference between bulk concentration and the surface concentration. Hence, the variable concentration gradient has the units as mol/m3. In Figure 5, the symbols denote the concentration gradient at the end of single delithiation process for different particles operating at various C-rates obtained from the 2D simulations.
One-dimensional simulations are also conducted with different values of effective diffusivity that can predict the concentration gradient obtained from the 2D simulations. For the 1D model, the Fick's law has been solved along the radial direction of a cylindrical particle. The effective diffusivities used in the 1D simulations were evaluated using Eq. 2. The main purpose of this exercise is to estimate a value of the exponent γ that can most accurately predict the values of the concentration gradient obtained from the 2D simulations. The analysis is being conducted for a fixed particle size (Rs) and a particular rate of delithiation, denoted by Crate. Under these operating conditions, the magnitude of Amax and mrate are estimated from Eqs. 5a and 5b, respectively. Using the value of Amax and mrate, the amount of mechanical degradation (fbb) has been estimated from Eq. 1a). Using this amount of microcrack formation, the magnitude of diffusivity has been obtained from Eq. 2 (the parameter γ is used in this step). This updated diffusivity is used to conduct the 1D simulation. The concentration gradient extracted from these 1D simulations should correlate properly with the concentration gradients obtained from 2D simulations. Whichever value of the exponent γ provides the best comparison for a wide range of operating conditions, that value will be adopted in the remaining simulations of this article.
In Figure 5, the lines denote values of concentration gradients as estimated by the 1D simulation (the symbols correspond to results from 2D analysis). Figures 5a, 5b, and 5c report the comparison between the concentration gradients obtained from 2D and 1D simulations for γ = 5.0, γ = 7.5 and γ = 9.5, respectively. As can be observed in Figure 5a that the 1D simulation with γ = 5.0 significantly under-predicts the concentration gradient for large particles. On the contrary, Figure 5c clearly shows that γ = 9.5 over-predicts the concentration gradient for large particle sizes operating at high C-rate conditions. The best correlation between the concentration gradients from the 1D and 2D simulations can be obtained with γ = 7.5, also depicted in Figure 5b. Usage of least square based fitting methodology would definitely be mathematically more accurate. However, it does not render any physical understanding of how variation of the parameters changes the effective diffusivity value. As a result, relatively more brute force type methodology have been adopted to calculate the exact value of exponent γ. It can be concluded that, to correlate the effect of microcrack density between 2D and 1D simulations, an optimum estimate of the exponent γ is 7.5. However, the active particles observed inside the LIB electrodes are spherical in shape and definitely require 3D consideration. To extend the estimate of exponent γ from 2D to 3D applications, it is raised by a factor of 3/2. The magnitude of this factor 3/2 has been estimated from the experience that the concentration gradients observed in 3D spherical active particles are approximately 3/2 times larger in magnitude than the concentration gradients observed in 2D cylindrical particles. Thus, for 3D applications, the optimum value of the exponent will be γ3D = 3/2 · γ = 11.25. For all the subsequent applications, the optimum value of γ in 3D will be used (unless otherwise mentioned). Variation in exponent γ with changes in different physical properties, such as, diffusivity, elastic modulus or fracture threshold, has not been investigated yet. It will be considered as a future exercise.
Effect of coupling mechanical degradation into 1D electrode level model
All the simulations and analysis reported until now were conducted on a single active particle. The theory behind the 2D single particle simulations can be found in a previous article by the same authors.21 A realistic electrode consists of several spherical particles. The electrolyte concentration and electrolyte potential also change along the thickness of the electrode, which becomes more prominent under high C-rate conditions. As observed by the authors (see Refs. 21 and 50) as well as other researchers (see Refs. 66–68), larger diffusion-induced stress acts on the active particles under higher C-rates. Large diffusion-induced stress has the potential to induce enhanced amounts of mechanical degradation. Different C-rates affect the lithium flux within the active particles. Flux of lithium in or out of the active particle changes along the thickness of the electrode. To capture the variations in applied lithium flux, or in other words the C-rate, it is very important to solve the coupled 1D mass and charge transport equations (Eqs. A1a, A4a, A5a and A6a) provided in the Appendix
Performance of a lithium-ion cell depends on the open circuit potential of the active materials used in the electrode. Lithium nickel manganese cobalt oxide (LiNiMnCoO2), also known as NMC, has been used as the cathode material. The expression of open-circuit-potential (OCP) for NMC has been adopted from Awarke et al. Ref. 69 Because damage evolution inside anode is being analyzed here, two different OCP curves have been taken into consideration, which correspond to two different anode materials: (i) Hard carbon, and (ii) Graphite. The OCP of hard-carbon has been adopted from Gu and Wang (see Ref. 32), whereas the OCP for graphite has been adopted from Srinivasan and Newman (see Ref. 70). Comparative reproduction of the OCP profiles for hard-carbon and graphite has been reported in Figure C1. Graphite shows a much flatter open circuit potential than hard carbon. As a result, the reaction current density at the anode shows a much higher gradient for graphite as compared to hard-carbon. For computational simplicity, the OCP for hard carbon has been adopted for the full charge-discharge simulations. The drive cycle simulations are conducted using both the OCP profiles (graphite and hard carbon). A comparative analysis, of which material leads to reduced mechanical degradation under drive cycle conditions, is presented towards the end of this article.
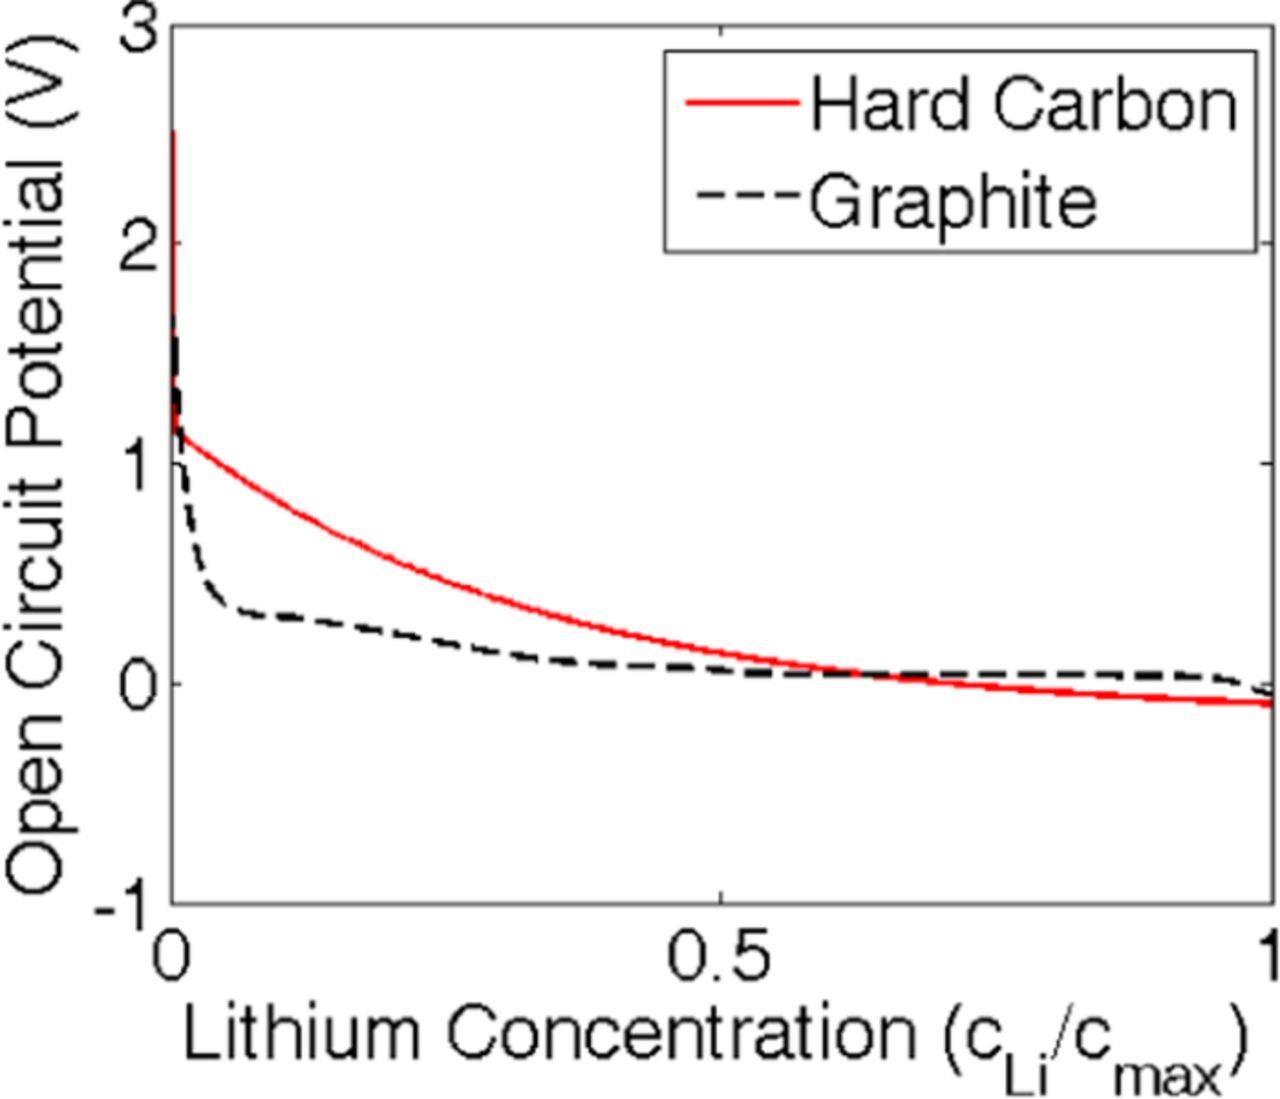
Figure C1. Comparison between the open circuit potential of hard carbon and graphite. The mathematical expression of OCP for hard carbon is taken from Gu and Wang (see Ref. 32), and the OCP for graphite is adopted from Srinivasan, 2004 (see Ref. 70). The OCP profile for hard carbon shows a higher slope. Whereas, the OCP profile for graphite is more flat in nature and gives rise to a relatively flat performance curve.
The linearized governing differential equations given in Eqs. A1a, B4, B5, and B6 have been discretized using the finite-difference method and solved by implementing it in MATLAB. Coupling between these governing differential equations has been conducted through the nonlinear Butler-Volmer equation provided in Eq. A2. The parameters used to solve these coupled differential equations are provided in Table I. The voltage vs. capacity performance curve during the first constant current discharge process obtained by solving the 1D electrode level model is demonstrated in Figure 6a. Here, hard-carbon has been used as the anode active material and NMC as the cathode active material. Four different C-rates are taken into consideration. Higher values of C-rate resulted in reduced capacity due to enhanced kinetic and mass transport limitations. The maximum amount of lithium flux observed in the anode and cathode during the first CC discharge at different C-rates is reported in Figure 6b. In the present analysis, during the discharge process, the migration current is assumed to be positive. Outflux of lithium is assumed to have a positive sign, and the influx is signified by a negative value of the flux variable. During the discharge process, lithium species move out of the negative graphite electrode and enter the cathode. According to the convention followed in this research, during the discharge process, the anode experiences a positive flux of lithium, and negative flux is observed inside the cathode. As depicted in Figure 6b, the lithium flux in both the anode and cathode increases with the increase in applied C-rate. It can also be concluded from Figure 6b that the magnitude of the maximum lithium flux in both the anode and cathode is highest at the beginning of the discharge process. It eventually reduces and saturates at a particular value. Towards the end of the discharge process, maximum flux at the cathode experiences some fluctuation. The maximum lithium flux traverses along the thickness of the electrode during the discharge process, which is not shown in Figure 6b.
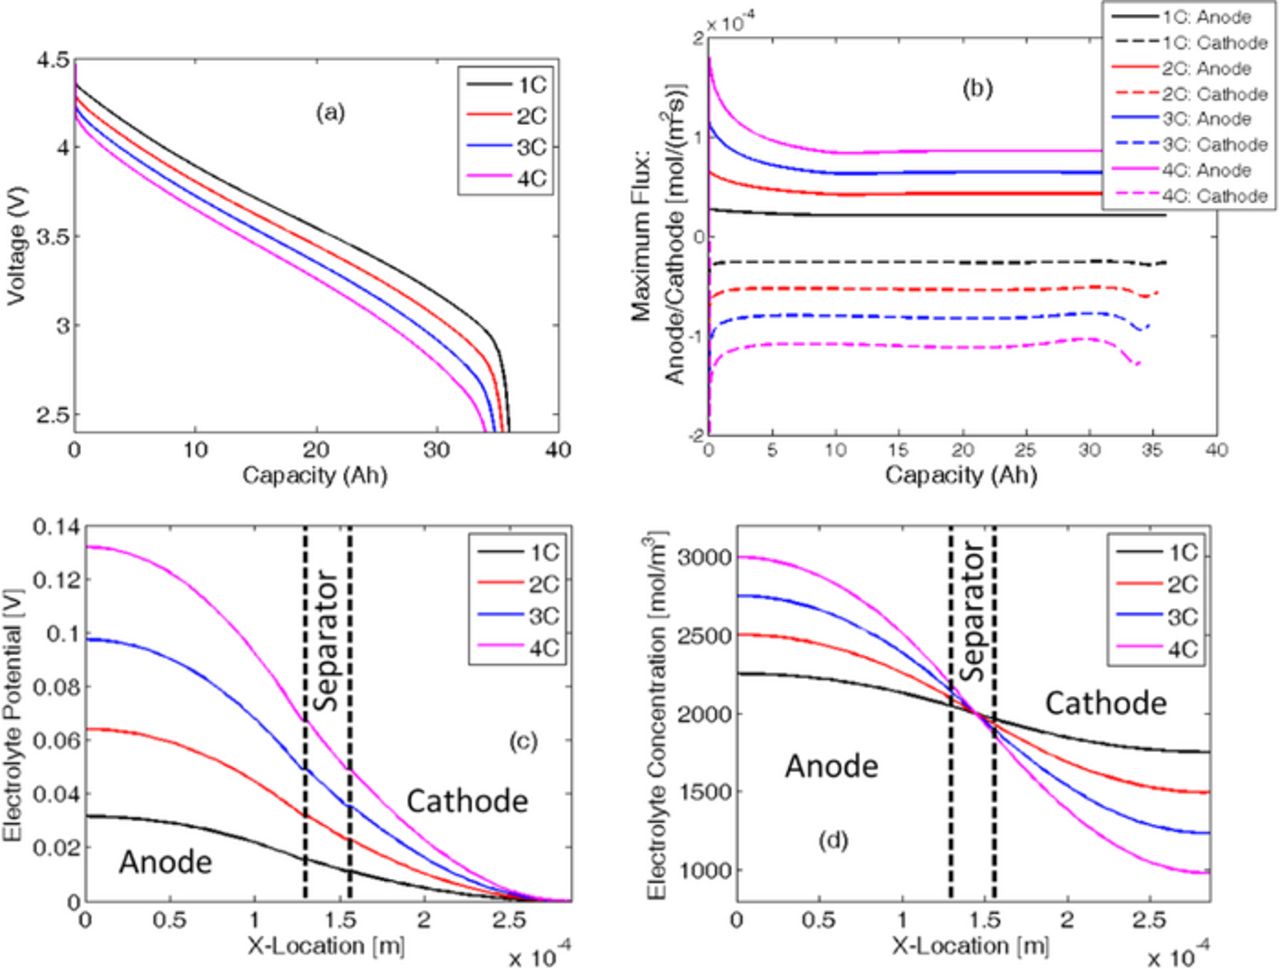
Figure 6. Variation in electrochemical quantities during the first discharge process for "NMC + Hard Carbon" under different C-rate operation. (a) Voltage vs. capacity plots at different C-rates reveals that increasing the C-rate results in reduction in effective capacity of the cell. (b) Maximum flux in anode and cathode with respect to the discharge capacity. Higher C-rate results in larger magnitude of ion flux. (c) Variation in electrolyte potential across the electrode at the end of the discharge process, (d) Variation in electrolyte concentration across the electrode at the end of the discharge process.
During the first discharge process, the variation in the electrolyte potential and the electrolyte concentration plays a major role in determining the performance of the LIB. Figure 6c demonstrates the distribution of the electrolyte potential at the end of the first discharge state along the thickness of the entire electrode. Increasing the C-rate at which the cell is being operated results in an increased electrolyte potential at the negative electrode. The electrolyte potential is kept fixed at zero at the positive electrode-current collector interface (see boundary condition Eq. A6b). Similarly, variations in the electrolyte concentration along the thickness of the electrode at the end of the discharge process are displayed in Figure 6d. The portion inside the vertical dashed line signifies the region that lies inside the separator. The initial concentration inside the electrolyte is assumed to be 2,000 mol/m3. During the discharge process, inside the anode the lithium atoms come out of the solid active particles and enter the electrolyte. Within the cathode, the lithium atoms travel from the electrolyte into the solid active particles. During discharge, transport of lithium ions from anode to cathode through the separator happens via the diffusion and migration process. Due to diffusion-induced limitations, at a high C-rate (4 C), a significant amount of lithium ions is depleted from the cathode electrolyte. It is important to note that, during discharge lithium ion concentration in the anode may reach values as high as 3 M. There are chances of salt precipitation within the electrolyte, which can lead to loss of cyclable lithium and subsequently capacity fade. Also variation in lithium ion concentration may impact the conductivity within the electrolyte. However, in the present simulations dependence of electrolyte conductivity on the lithium ion concentration has not been incorporated. During the charge process, depletion of lithium ion concentration would occur in the anode and large concentration may be observed in the cathode. Hence, an appropriate value of the initial concentration of lithium salt within the electrolyte should be considered. Proper care must be taken while charging or discharging an LIB at very high C-rates to prevent situations where lithium ions are completely deleted from the electrolyte. Mechanical degradation within the solid active particles is not taken into consideration in any of the simulation results reported in Figures 6a–6d.
To establish the validity of the developed computational model, voltage vs. capacity performance curves predicted by the simulation is compared with experimentally observed results. Such a comparison between the performance curves obtained at 1 C and 3 C are shown in Figure 7. The experimentally observed voltage vs. capacity plots have been adopted form Figure 2 in Ji et al. (JES 2013).34 Even though the comparison is not one on top of the other, they match quiet well in a qualitative sense. Graphite anode and NMC cathode has been used in both experiment and simulation. But the OCP curves for NMC and graphite used in computational analysis are not the same as reported in the experimental article. Isothermal condition has not been maintained in the experimentally observed result. Whereas, the simulations are conducted under isothermal operating conditions at T = 25°C. The change in temperature for 1 C is not significant, as reported in the experimental results. For operation at 3 C, almost 20°C increase in temperature is observed. The increased capacity for the cell at 3 C can be attributed to this increase in internal temperature. Difference in the overall voltage profile can be due to the mismatch in OCP curves for both the anode and cathode materials. Also in the present computational analysis, electrolyte conductivity (κ) has been assumed to be constant, and not dependent on lithium ion concentration. In a realistic electrolyte, conductivity changes strongly as a function of lithium ion content. The difference between the experimentally observed and simulated voltage curve can also be attributed to this parametric discrepancy.
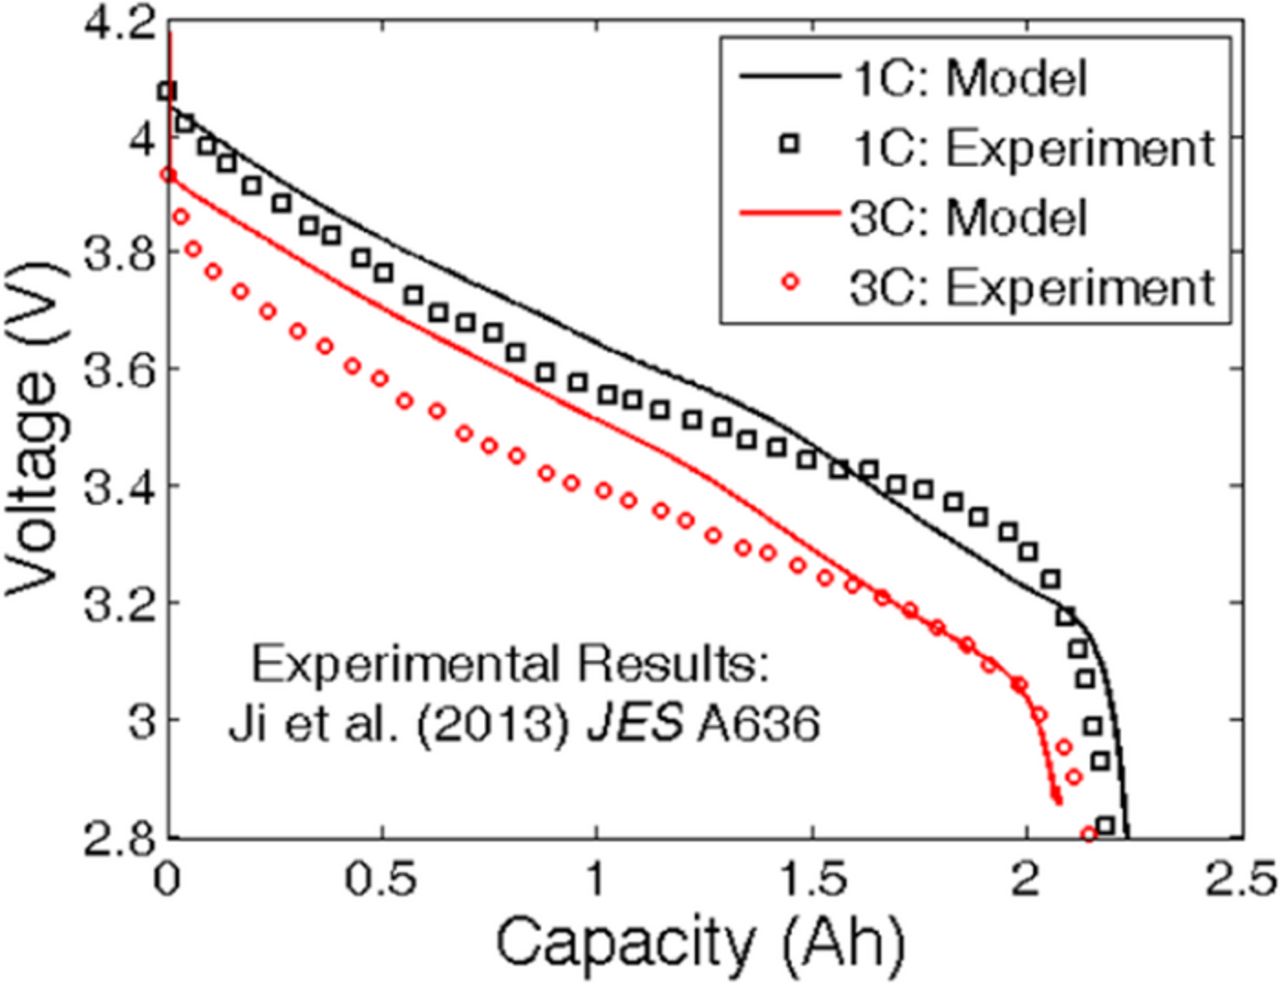
Figure 7. Comparison of performance curve obtained from computational model with experimental results. The experimental results were obtained from Ji et al. JES A636 (2013) (see Figure 2 in Ref. 34). Minor differences between the experimental result and the computational prediction can be attributed to the difference in the OCP curves. The computational predictions have been made using graphite as anode and NMC as cathode active material.
For solid active particles where transport of lithium species can be reasonably approximated by the diffusion process, delithiation gives rise to tensile stress and evolution of microcrack density along the peripheral region. During the lithiation process, microcrack evolution takes place close to the center of the active particles. The analytical expressions in Eqs. 1a, 5a, and 5b estimate the amount of microcrack density during delithiation for wide range of C-rates (1 C – 10 C) and particle sizes (2.5 μm – 15.0 μm). This relation is derived based on mechanical damage evolution only within the graphite active particles during the delithiation process. At the time of discharge, the graphite active particles within the anode experience delithiation. Hence, the analytical expression derived for microcrack evolution can be applicable to the anode active particles during the discharge process. For the present study, the cathode particles are assumed to be free of mechanical degradation. According to Eq. 2, diffusivity of the solid active phase decreases due to evolution of mechanical damage. Figure 8 demonstrates the distribution of mechanical degradation along the thickness of the negative electrode at the end of the first discharge process. Capacity fade due to increasing microcrack density has been analyzed in Figure 9. Strictly speaking, there should be a feedback of cell performance and capacity fade on the mechanical degradation. Based on some earlier investigations conducted by the authors, impact of capacity fade on further mechanical degradation is negligible (see Ref. 21). Because of this minor feedback effect, while deriving the reduced order model, only the impact of mechanical degradation on change in solid-state diffusivity has been taken into consideration. Point to be noted here is that, microcrack formation happens due to formation of concentration gradient within the active particles during operation. Effect of further microcrack formation due to performance decay has been neglected here.
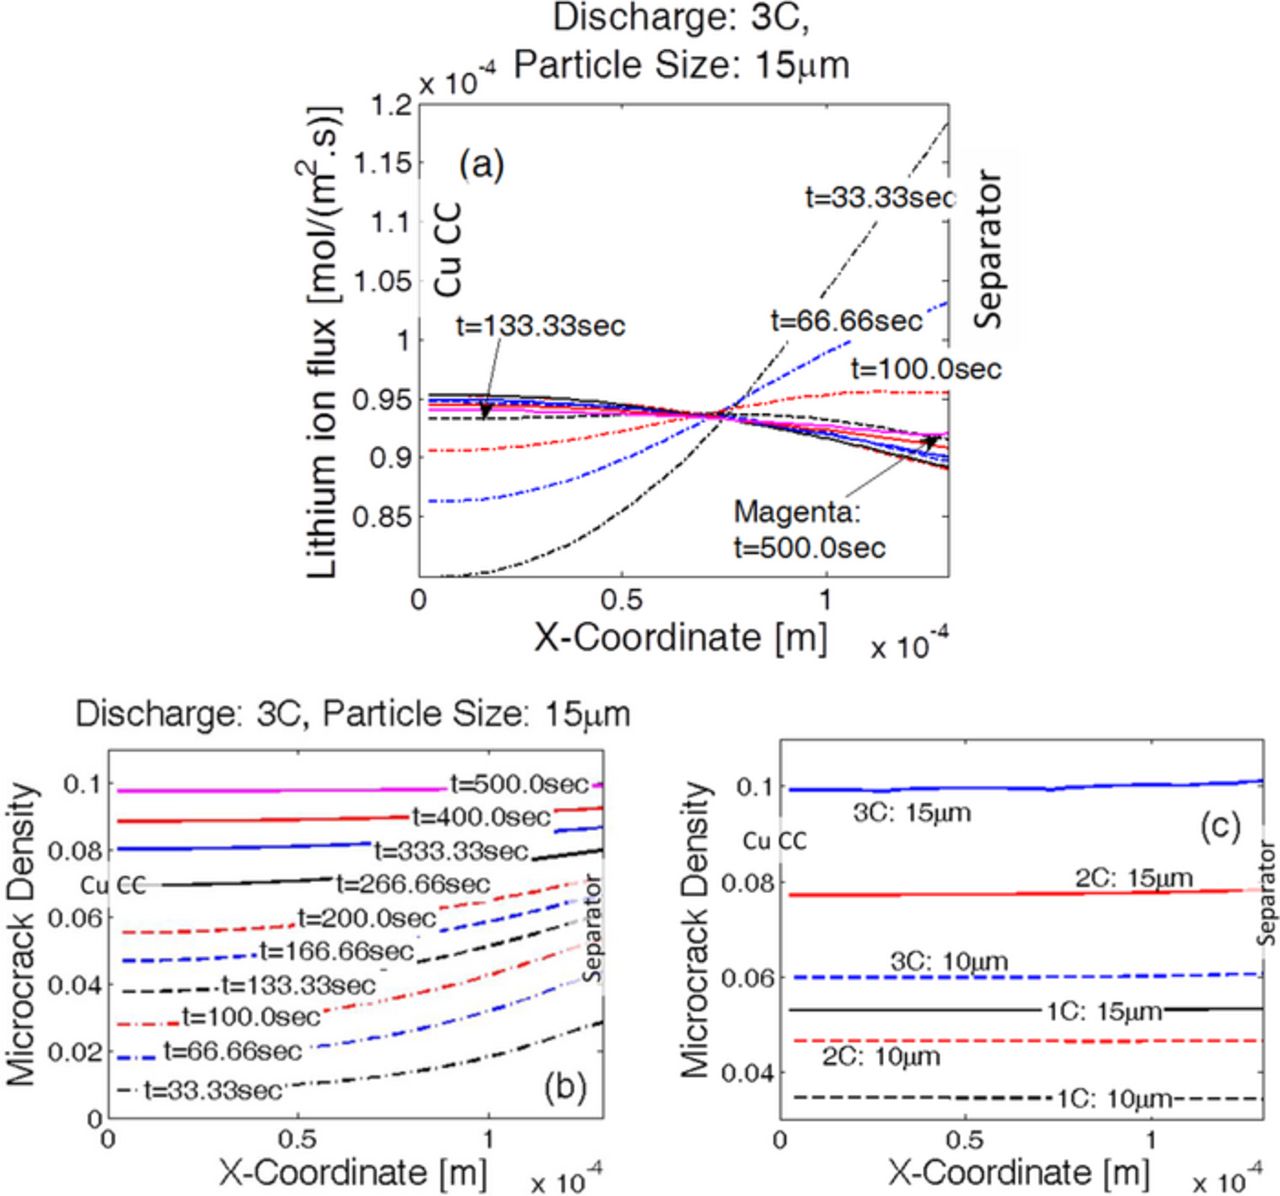
Figure 8. Evolution of damage along the thickness of the anode electrode, hard-carbon graphite active material. (a) For 15 μm sized anode active particles and discharge at 3 C, evolution of lithium flux along the thickness of the electrode over time. The location of maximum reaction current density shifts over time along the thickness direction. (b) For a particular discharge at 3 C and for particle size of 15 μm, damage evolution over time. Overall damage increases with time. Initially, microcracks evolve predominantly in particles near the separator. Towards the end more damage evolves at the current collector, and the final profile looks almost flat. (c) Uniform distribution of final damage profile for discharge at three different C-rates (1 C, 2 C and 3 C) and two different particle sizes (10 μm and 15 μm).
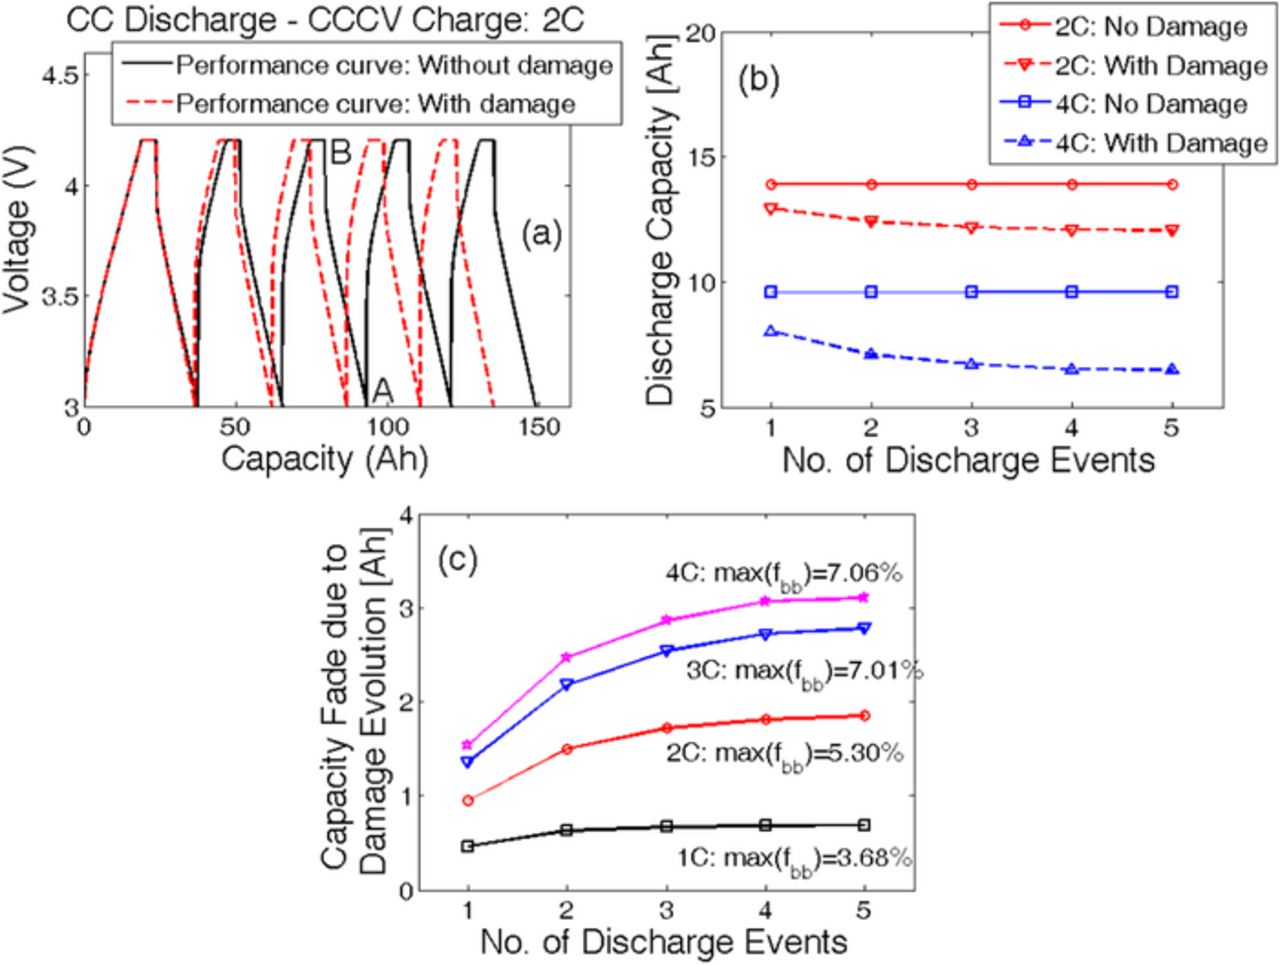
Figure 9. Capacity fade due to mechanical damage evolution over multiple cycles. (a) Evolution of voltage vs. capacity for five 2 C CC discharge and 2 C CCCV charge cycles, with and without damage evolution. (b) Discharge capacity at 2 C (red line) and 4 C (blue line). Difference between the capacity with (dotted line) and without (solid line) damage evolution is defined as the capacity fade. (c) Capacity fade over multiple cycles for different C-rates. Higher C-rates result in larger fraction of broken bonds and eventually more capacity fade.
Under uniform distribution of particle sizes, the flux of lithium atoms experienced by the active particles determines the amount of diffusion-induced stress and subsequently the evolution of mechanical degradation. The location where maximum lithium flux is observed, experiences the largest extent of microcrack density. Thus, it is very important to have a prior knowledge of the location of the maximum reaction current density to properly understand the evolution of microcrack density along the thickness of the electrode. Figure 8a demonstrates the variations in lithium flux along the thickness of anode during CC discharge at 3 C containing active particles with a radius of 15 μm. Towards the beginning of the discharge simulation, at time t = 33.33 sec, a significantly large reaction current density and lithium flux are observed close to the separator. The lithium flux observed close to the current collector is significantly smaller than the value observed at the separator. With increasing time, the lithium flux close to the separator decreases and the flux at the current collector increases. At around t = 133.0 sec, the lithium atom flux at the current collector and the separator becomes almost equal. Close to the end of the discharge process, at t = 500.0 sec, the active particles close to the current collector experience slightly higher lithium flux than the particles located close to the separator. Thus, during the discharge process, there is a shift in the maximum reaction front from the separator to the current collector over time.
Because of the variation in the reaction current density over time, mechanical degradation also evolves accordingly along the thickness of the electrode. Figure 8b depicts how the microcrack density increases during CC discharge process at 3 C in an anode containing uniformly distributed active particles with a radius of 15 μm. Initially, at t = 33.33 sec, active particles close to the separator experience the maximum amount of lithium flux, which results in enhanced damage evolution near the separator. A similar pattern of higher microcrack density close to the separator and less damage near the current collector are observed until t = 166.66 sec. Then, due to the shift of the reaction current front towards the current collector, enhanced mechanical degradation is observed inside the active particles close to the current collector. Finally, close to the end of the discharge process, at t = 500.0 sec, almost uniform microcrack density is observed from the separator to the current collector. Distribution of mechanical damage at the end of the first discharge process is reported along the thickness of the negative electrode in Figure 8c for two different particle sizes (10.0 μm and 15.0 μm) and three different C-rates (1 C, 2 C, and 3 C). Less damage evolution is observed for smaller particles operating under low C-rate conditions. Larger particles operating at high C-rates display enhanced microcrack density. However, for all the particle sizes and all the operating conditions, damage evolution is very much uniform along the thickness of the electrode (from separator to current collector). This uniformity in microcrack density appears due to shifting of the maximum reaction current front from the separator to the current collector during the constant current discharge process.
To analyze the impact of microcrack density on the overall performance of the LIB electrode, multiple charge discharge cycles were conducted taking into consideration the effect of mechanical degradation on diffusivity of anode active particles. A correlation between the solid phase diffusivity of the anode active particles and microcrack density can be obtained from Eq. 2. Figure 9a demonstrates five charge-discharge cycles with (red dashed line) and without (black solid line) taking the damage evolution in the anode active particles into consideration. To maintain consistency in the capacity values, the battery is charged first from a very low state-of-charge condition in a CCCV fashion until a maximum voltage of 4.2 V is reached. Incorporation of mechanical degradation of the anode active particles results in reduction of effective solid phase diffusivity, and subsequently the resistance due to ion transport increases. Hence, a reduction in effective capacity is observed due to the evolution of microcracks inside the active particles. Capacity during a discharge process is estimated by subtracting the Ahtp at the beginning of discharge from the Ahtp at the end of the discharge process. Referring to Figure 9a, to estimate the discharge capacity without damage during the third cycle, Ahtp at point B is subtracted from the Ahtp at point A.
Figure 9b demonstrates the discharge capacity while operating at 2 C and 4 C during five subsequent charge-discharge cycles. If the evolution of mechanical degradation in anode active particles is not taken into consideration, the capacity values during all five discharge phenomena are exactly the same. Capacity at 4 C discharge (blue solid line) is less than that observed at 2 C (red solid line) due to the rise in kinetic and transport resistance at higher rates of operation. If mechanical degradation is taken into account, the discharge capacity keeps decreasing as the battery is cycled more and more (dashed line). Capacity fade during operation at 4 C is much greater than that observed at 2 C because at higher rates enhanced mechanical degradation occurs. A higher fraction of microcrack density (fbb) results in smaller values of effective diffusivity of the anode active particles. Reduced diffusivity increases the transport resistance and subsequently enhances the capacity fade. Hence, the capacity fade due to mechanical degradation observed at higher rates of operation are much larger than that experienced at low C-rates.
Capacity fade due to only the mechanical degradation can be estimated by obtaining the difference between capacity without and with damage. The extent of capacity fade solely due to mechanical degradation is reported in Figure 9c. Maximum amount of damage at four different C-rates are also reported. Operation at lower values of C-rate (1 C or 2 C) gives rise to less damage and subsequently smaller capacity fade. However, a larger extent of damage and enhanced capacity fade are observed for high rate (3 C and 4 C) operations. Irrespective of the rate of operation, capacity fade tends to saturate at a certain limit. For smaller rates of operation, the capacity fade saturates much earlier than the batteries operating at higher C-rates. The maximum capacity fade also increases with an increasing rate of operation. All the simulations reported in Figure 9 used a particle radius of 10.0 μm in the anode. Extremely close values of microcrack density observed at 3 C and 4 C lead to the conclusion that the particle has almost reached the maximum amount of damage it will ever experience during CCCV charge–CC discharge cycles.
Instead of having a constant particle size along the thickness of the negative electrode, implementation of a gradient in particle size from the current collector to the separator (ascending or descending) may impact the evolution of microcrack density and subsequently capacity fade of the LIB. The two different particle size distributions taken into consideration are as follows: i) linearly increasing particle size from 5 μm at the current collector to 15 μm at the separator, and ii) linearly decreasing particle size from 15 μm at the current collector to 5 μm at the separator. While using different particle size distributions, the total volume of the electrode and the volume fraction of solid active material have been kept constant. For changing particle radius, the electroactive surface area changes accordingly, which is taken into account by modifying the specific surface area parameter (as). Since the total amount of active material dictates the overall capacity of the electrode, maintaining a fixed volume fraction of the solid phase ensures consistency of capacity. The cathode and anode parameters used in the simulations have been adopted from existing literature and listed in Tables I. Here, "N" refers to the variables/parameters corresponding to the negative electrode, "P" refers to those relevant to the positive electrode. Figure 10a depicts a comparative analysis of voltage vs. capacity performance curve for the two different particle size distributions. The solid line corresponds to the case where particle size decreases from current collector to separator. The dashed line signifies the other particle size distribution of smaller particles close to the current collector and larger particles close to the separator. The performance curves at lower C-rates (1 C and 2 C) show insignificant difference between the two particle size distributions. At higher values of the C-rate, the case with descending particle size from current collector to separator displays slightly larger capacity than its counterpart. For example, at 4 C the particle size distribution with 5.0-μm particles close to the current collector and 15.0 μm particles at separator [case (i)] shows 0.4-Ah lower capacity than the particle size distribution with 15.0 μm particles at the current collector and 5.0-μm particles near the separator [case (ii)].
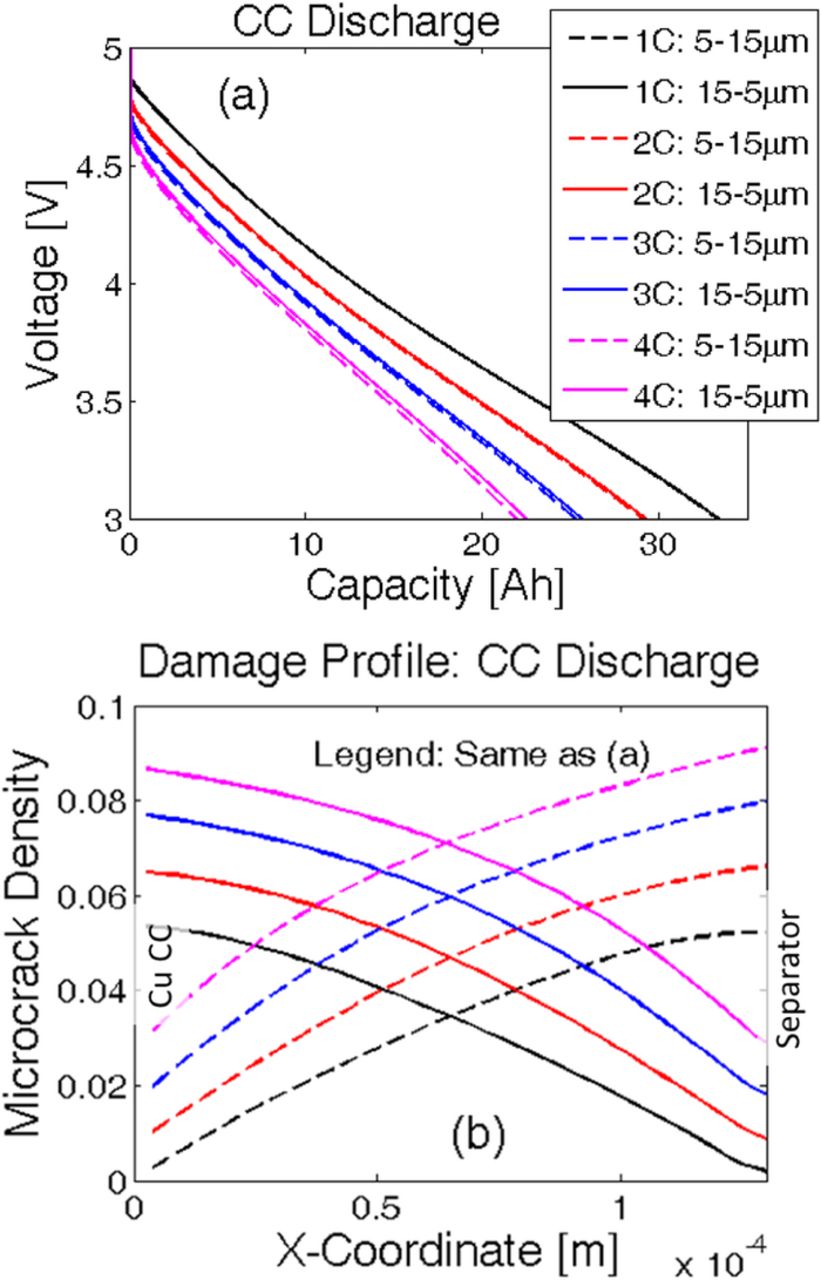
Figure 10. Instead of having a uniform particle size, a gradient in particle size distribution may have a different impact on the damage profile and capacity of the electrode. Two different particle size distributions have been investigated: i) Linearly increasing particle size from 5 μm at the current collector to 15 μm at the separator, and ii) Linearly decreasing particle size from 15 μm at the current collector to 5 μm at the separator. a) Voltage vs. capacity performance curves during the first discharge at four different C-rates. Capacity is same for both the particle size distributions at low C-rate operations (1 C and 2 C). For high C-rate operations (4 C), smaller particles close to the separator (case (ii)) leads to slightly larger capacity (around 0.54 Ah). (b) Damage profile for both the particle size distributions after the first discharge process.
When the variation in particle size in the negative electrode is taken into account, evolution of mechanical degradation inside the active particles of anode deserves investigation. Figure 10b demonstrates the damage profile after the first discharge for two different particle size distributions: i) 5.0-μm particles close to the current collector and 15.0-μm particles at the separator (denoted by dashed lines), and ii) 15.0-μm particles at current collector and 5.0-μm particles close to the separator (denoted by solid lines). Because larger particles experience enhanced mechanical degradation for both types of particle size distributions, a greater amount of microcrack density is observed wherever there exist large-sized particles. Thus, for case (i), enhanced mechanical damage occurs close to the separator. Similarly, for case (ii), evolution of higher amounts of microcrack density appears close to the current collector. It is evident from Figure 10b that the extent of damage evolution is independent of the location of the particle. For example, particles with a radius 15.0 μm experience around 9% microcrack densities at the end of the first discharge at 4 C, irrespective of whether it is located near the separator or the current collector. Similar behavior can be observed for other particle sizes operating at other C-rate conditions as well. This saturation in mechanical degradation happens because the maximum reaction front shifts from the separator to the current collector during the discharge process.
LIBs are usually operated in multiple charge-discharge cycles. Thus, it is important to investigate the evolution of microcrack density and capacity fade due to particle size distribution inside the anode. For the cycling analysis smaller magnitude of particle size distributions are taken into consideration: i) linearly increasing particle size from 2.5 μm at the current collector to 12.5 μm at the separator (denoted by black lines), and ii) linearly decreasing particle size from 12.5 μm at the current collector to 2.5 μm at the separator (denoted by red lines). For the cycling analysis, the cell is initially charged in a CCCV fashion from a very low SOC to 4.2 V. Then, the LIB is operated under CC discharge–CCCV charge conditions for five subsequent cycles. The voltage vs. capacity performance curve for operation at 3 C is shown in Figure 11a for both particle size distributions. The two curves almost overlap, indicating a minor difference in capacity fade observed by the two different particle size distributions. A closer look at the discharge curves for the fifth cycle shows that the particle size distribution with 2.5-μm particles close to the separator [case (ii)] leads to a capacity 0.23 Ah larger than case (i), which contains 12.5-μm particles close to the separator.
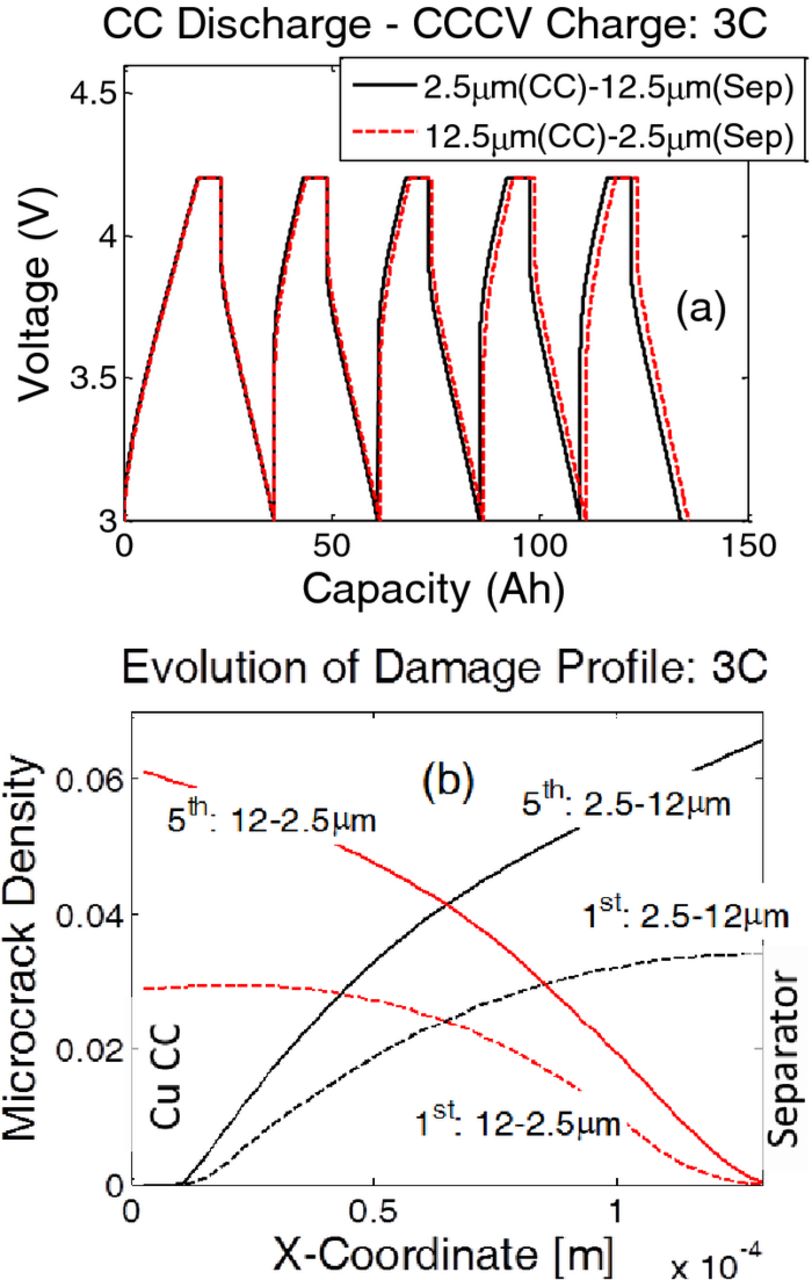
Figure 11. For cycling analysis, the two different ranges of particle sizes have been taken into consideration: i) Linearly increasing particle size from 2.5 μm at the current collector to 12.5 μm at the separator, and ii) Linearly decreasing particle size from 12.5 μm at the current collector to 2.5 μm at the separator. (a) Voltage vs. capacity curves for five CCCV charge – CC discharge cycles at 3 C. After the fifth discharge at 3 C, smaller particle sizes close to the separator (case (ii)) experience 0.23 Ah extra capacity than large particles close to the separator (case (i)). (b) Increase in damage after five cycles at 3 C. From the first to the fifth discharge cycle, the microcrack density almost doubled for large sized particles.
When a distribution of particle size is used, evolution of microcrack density inside the anode active particles during multiple cycles deserves investigation. Two different particle size distributions considered in this study are same as that reported in the previous paragraph; the first one involves 2.5 μm–12.5 μm particles with increasing size and the other one consists of 12.5 μm–2.5 μm particles with decreasing size from the current collector to the separator. Figure 11b demonstrates the extent of microcrack density at the end of the first and the fifth discharge process for both particle size distributions. Irrespective of the location of the particles, larger particles experience higher microcrack density. Equivalently, less mechanical degradation is observed in smaller particles. Damage observed in the active particles after the fifth discharge is almost double of what occurred in the first discharge process. The extent of microcrack density after the first discharge process reported in Figure 10b is much greater than that observed in Figure 11b. This difference appears because for the single discharge experiments, the lithium ion cells are discharged from a voltage of 4.75 V to a lower cutoff limit of 3.0 V. In contrast, during the charge-discharge cycles, at the time of the first discharge the lithium ion cells are discharged from 4.2 V to 3.0 V. Because the lithium ion cell operates in a smaller voltage range in the second case, the anode active particles experience the delithiation process for shorter amount of time. Thus, the extent of mechanical degradation is much smaller after the first discharge for multiple charge-discharge cycles.
Effect of mechanical degradation on drive cycles
Until now, all the simulations are conducted under the assumption that during operation the lithium ion cells experience complete discharge and then complete charge at a constant C-rate, and the discharge-charge cycle goes on. However, in a realistic drive cycle, the lithium ion cells rarely experience complete discharge at a constant rate. Under drive-cycle operation, discharge-charge pulses occur depending on the driving conditions. Figures F1a and F1b included in Appendix
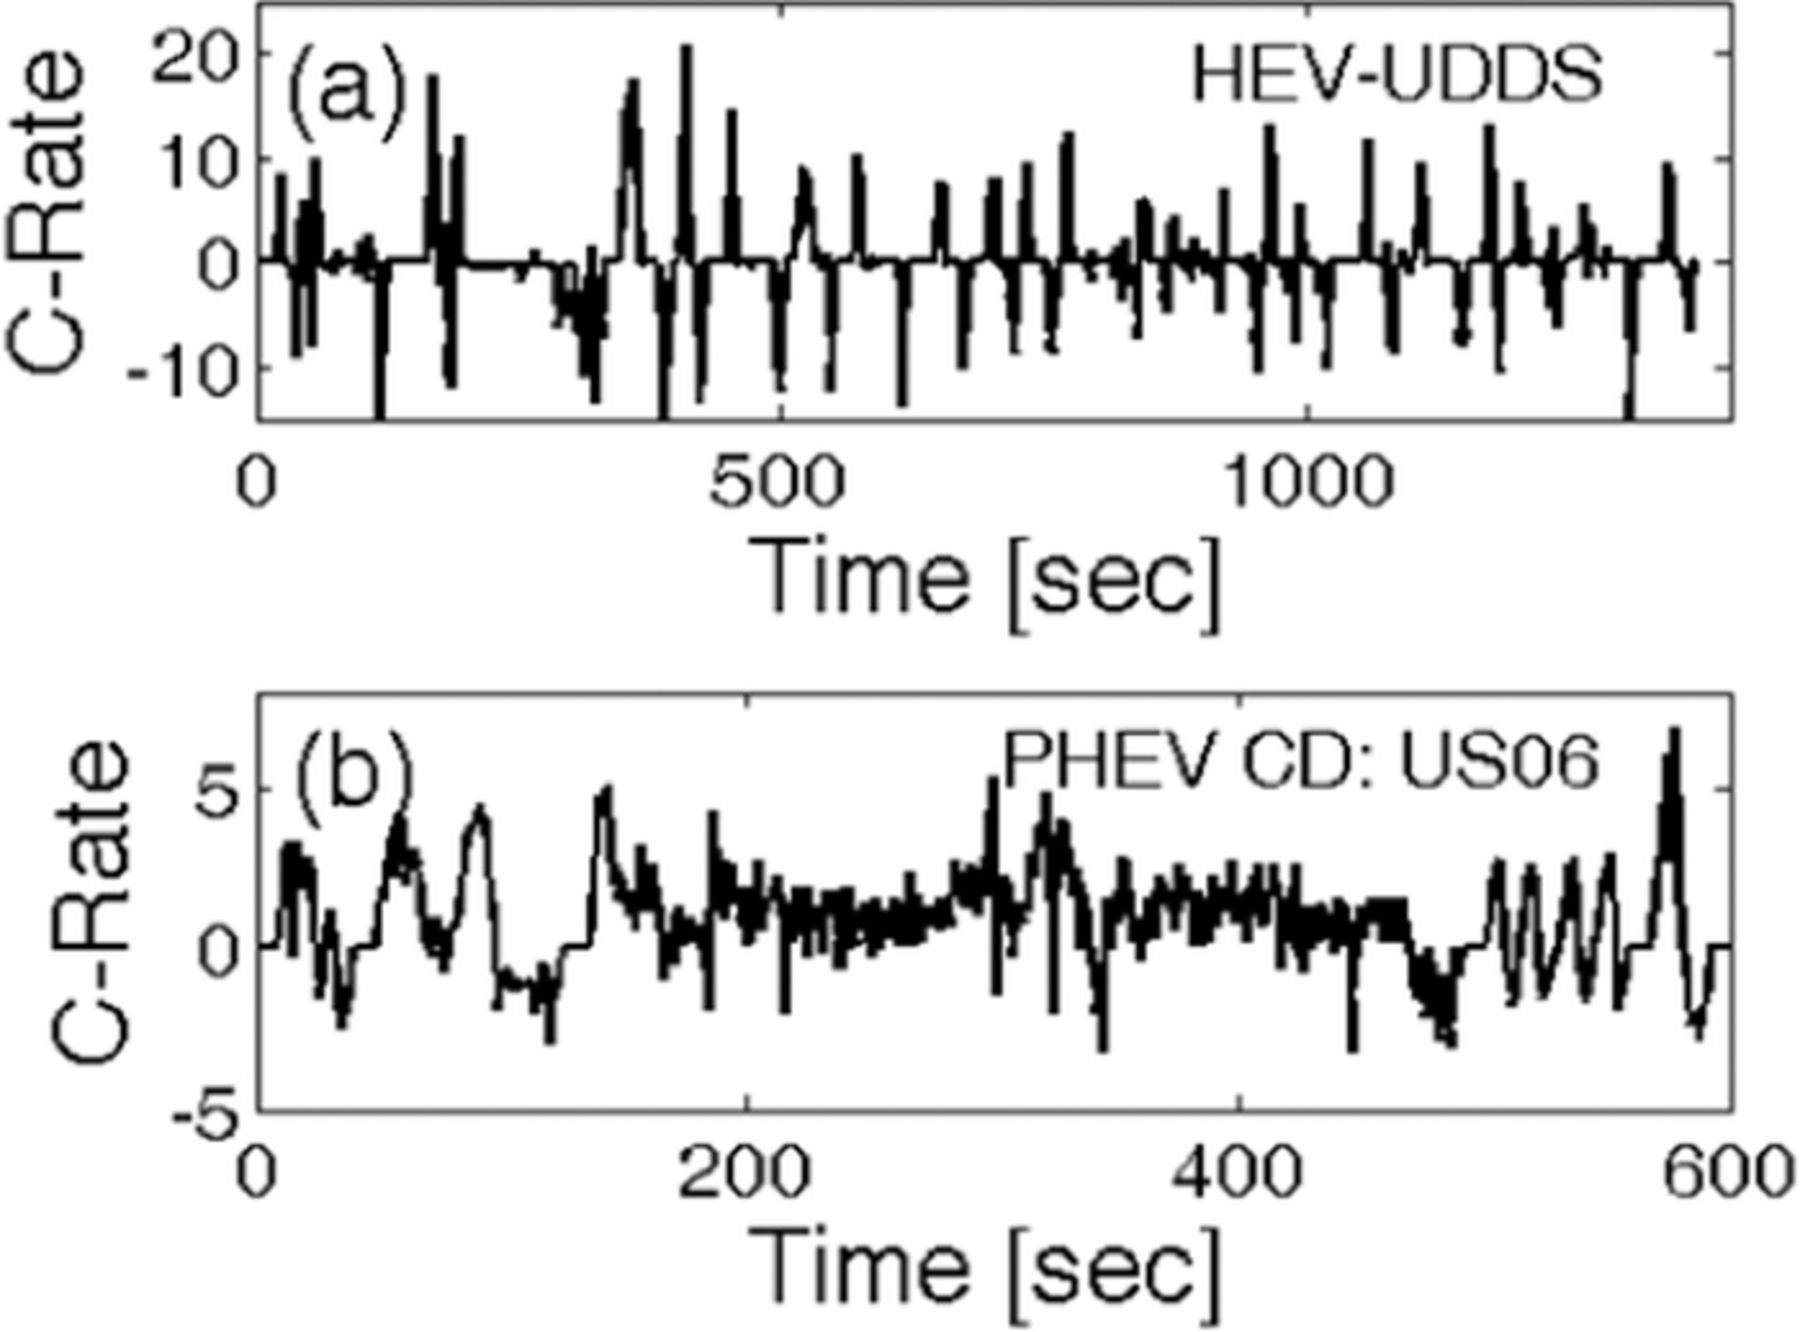
Figure F1. C-rate vs. time profiles for two different vehicles under different drive cycle conditions. (a) C-rate vs. time curve for a HEV under UDDS driving conditions. (b) C-rate vs. time curve for a PHEV operating under charge depleting (CD) US06 driving conditions.
Evolution of mechanical degradation under HEV and PHEV drive cycle conditions for different particle sizes is reported in Figure 12a and 12b, respectively. Two different open circuit potential (OCP) profiles are used inside the anode: i) hard-carbon, and ii) graphite. The OCP of a hard-carbon anode shows a steep profile (see Figure C1). Thus, the reaction current density within the negative electrode remains flatter during the discharge process. In contrast, graphite has an extremely flat OCP profile. This leads to a large gradient in the reaction current density inside the anode. In the graphite anode, the active particles close to the separator experience significantly large reaction current density than those located near the current collector. Thus, mechanical degradation should be much larger near the separator for graphite than for hard-carbon materials. This trend is more prominent in Figure 12b, where the hard-carbon chemistry shows a relatively flat damage profile (solid line) whereas under graphite chemistry, a steeper damage profile is observed (dashed line) while traveling from the current collector to the separator.
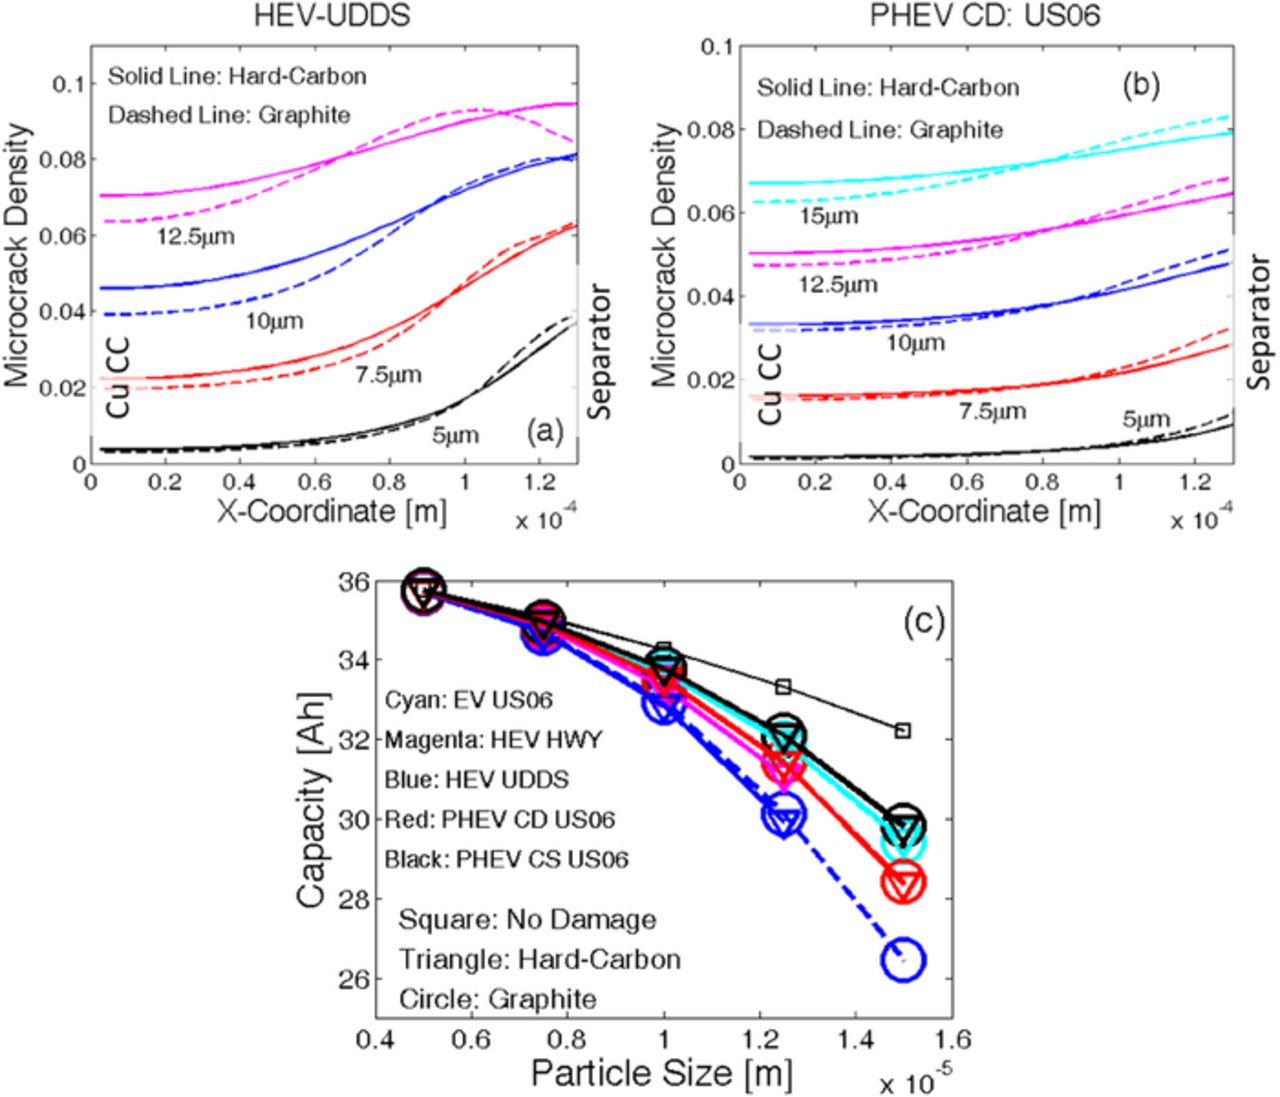
Figure 12. Investigation of damage evolution and capacity fade for different drive cycle operating conditions. Two representative drive cycle operating conditions are shown in Figures F1a and F1b. (a) Final damage profile at different particle sizes for the HEV subjected to driving conditions shown in Figure F1a. (b) Final damage profile at different particle sizes for the PHEV subjected to driving conditions shown in Figure F1b. In both (a) and (b), enhanced damage evolution is observed close to the separator (right side) as compared to the current collector (left side of the figure). (e) Capacity fade observed in various particle sizes after operating under different drive cycle conditions. Particle sizes less than 10 μm do not experience significant capacity fade due to damage evolution. Most severe capacity fade is observed for the largest particle size of 15 μm.
In both Figures 12a and 12b, a lower microcrack density is observed close to the current collector, and larger microcracks appear near the separator for all the different particle sizes considered. Under drive cycle operating conditions, the lithium ion cells experience high C-rates in multiple pulses. As shown in Figure 8a, at the beginning of the discharge process, a maximum reaction current is experienced close to the separator. As the discharge process continues the maximum reaction current front shifts towards the current collector. In drive cycles, because the C-rates act in pulses, the maximum reaction current only acts close to the separator; it never gets the opportunity to shift towards the current collector. As a result, in drive cycle scenarios, the maximum reaction current front confines itself near the separator only. Thus, a significant gradient in mechanical degradation is observed while between the current collector and the separator. This observation is applicable to both the hard-carbon and graphite chemistries. Because the HEV vehicles experience a much larger magnitude of C-rates [-10 C to 20 C, see Figure F1a], the mechanical degradation reported in Figure 12a shows a large gradient along the thickness of the electrode. For example, under HEV drive conditions, 7.5-μm particles experience only 2% microcrack density near the current collector whereas, near the separator, the mechanical degradation can be as high as 6%. The PHEVs operate under less severe C-rate conditions. Figure 12b demonstrates that for the same 7.5-μm particles, under PHEV driving conditions only 1.8% damage evolves close to the current collector, which increases to 3% microcrack density near the separator. Hence, HEV operating conditions are relatively more detrimental for the LIBs from a mechanical degradation perspective.
For 12.5-μm particles, some irregularity in the usual pattern of highest microcrack density close to the separator is observed in Figure 12a. The microcrack density drops below the maximum value for the active particles located extremely close to the separator. It was argued in earlier articles (see Refs. 47 and 50) that for extremely large active particles under very high C-rate operations, the concentration gradient confines itself very much close to the surface of the particles and cannot penetrate into the interior. Thus, the mechanical degradation is also observed close to the peripheral region only, which results in a reduction in microcrack density. Figure 12a reports the evolution of microcrack density under HEV drive cycles, where the C-rates can be as high as 20 C, being applied in multiple pulses of very short duration. Under such large magnitude of C-rates, the reaction current density close to the separator will be extremely high. For the 12.5-μm particles, the lithium concentration will mostly be confined extremely close to the surface of the particle. Due to a lack of penetration of the concentration gradient, reduced evolution of microcrack density is observed in 12.5-μm particles under HEV operating conditions at locations extremely close to the separator.
It has already been argued that the OCP profile for graphite is more flat than hard-carbon. This leads to formation of higher gradient in reaction current density along the thickness of the graphite anode. Also, as observed in Figure 12b, mechanical degradation for graphite is slightly larger than that observed for hard-carbon. According to the OCP profile, due to higher gradient in reaction current density, mechanical degradation in graphite should be significantly larger than hard-carbon. However, the small difference in microcrack formation can be attributed to the fact that the mechanical degradation reaches a peak value with increasing reaction current density. Further increase in reaction current density results in reduction of microcrack density. This maximum value of microcrack density is observed due to the fact that under extremely high reaction current density, the lithium concentration gradient cannot penetrate significantly within the solid active particles. Lithium concentration remains confined close to the particle surface, resulting in reduced mechanical degradation at extremely high rates of operation. Because of the existence of a maximum amount of microcrack formation, the difference in mechanical degradation is minimal for hard-carbon and graphite anode materials.
Evolution of microcrack density inside the active particles during the drive cycles is definitely not sufficient to characterize the impact of mechanical degradation on the performance of LIBs. Analysis of capacity fade due to the evolution of microcrack density deserves elaboration to complete the investigation process. A computational reference performance test (RPT) has been defined to characterize the amount of capacity fade under certain drive cycle conditions for different particle sizes. According to this computational RPT, the lithium ion cells are discharged at 1 C from a high SOC, xp = 0.2 and xn = 0.9, which corresponds to a voltage usually greater than 4.5 V. The CC discharge process is continued until the lower cutoff voltage limit of 3.0 V is reached. The Ahtp during the entire discharge process is reported as the capacity of the cell. Distribution of microcrack density that occurred during the drive cycle was kept constant while conducting the computational RPT test. Reduced diffusivity due to the formation of microcracks increases the resistance due to mass transport and eventually results in deterioration of the effective capacity. For different particle sizes, the net discharge capacities are reported in Figure 12c. The small squares signify the magnitude of the discharge capacity without the presence of any mechanical degradation. Five different drive cycles are considered: i) an EV under US06 driving conditions (denoted by cyan lines), ii) an HEV operating on highway (magenta lines), iii) an HEV operating under Urban Dynamometer Driving Schedule (UDDS) driving conditions (blue lines), iv) a PHEV operating in CD mode on US06 (denoted by red lines), and v) a PHEV operating in CS mode (denoted by the thick black line). Both the anode chemistries of hard carbon (denoted by triangles) and graphite (denoted by big circles) have been investigated. Among all the drive cycles, the HEVs operating in UDDS driving conditions experience the maximum amount of capacity fade, solely due to mechanical degradation. In contrast, EVs and PHEVs operate in a less severe fashion from the capacity fade perspective. Particle size also impacts the amount of capacity fade during drive cycle operations. As can be observed in Figure 12c, lithium ion cells with particles less than 10.0 μm do not experience any severe capacity fade even under the HEV driving conditions. However, particles larger than 10.0 μm indeed experience severe capacity fade under HEV operating conditions. For example, HEVs operating under UDDS driving conditions, experience 10% capacity fade for 12.5-μm particles and approximately 16% capacity fade for particles with radius around 15.0 μm. From this analysis, it is clearly evident that usage of particles smaller than 10.0 μm is beneficial for drive cycle applications.
Capacity fade due to mechanical degradation while using hard-carbon anode or graphite anode is approximately the same. But from their OCP curves, graphite is supposed to have significantly higher gradient in reaction current density along the thickness of the active particles, which would give rise to enhanced mechanical degradation. Slightly larger microcrack formation for graphite than hard-carbon anode material has already been demonstrated in Figures 12a and 12b. The capacity-fade reported in Figure 12c is estimated using the computational RPT technique, where the cell is discharged at a rate of 1C. At such low rates of operation, minor spatial variation in mechanical degradation along the thickness of the electrode, does not affect the overall cell resistance. As a result, capacity-fade for both graphite and hard-carbon is almost the same. However, the overall mechanical degradation has a significant impact on the effective capacity of the electrode. It has been demonstrated in Figure 12c that large particles experience more severe mechanical degradation and subsequently higher capacity fade. This conclusion is applicable to both the hard carbon and graphite anode chemistries.
Instead of using a constant particle size throughout the thickness of the negative electrode, the impact of a gradient in particle size from the current collector to the separator on the mechanical degradation and subsequently the capacity of the lithium ion cell are worth investigating. Two different particle size distributions have been considered here: i) linearly increasing particles size from 5.0 μm close to the current collector to 15.0 μm at the separator, and ii) linearly decreasing particle size from 15.0 μm at the current collector to 5.0 μm close to the separator. Damage profiles at the end of drive cycles observed in four different types of vehicles (EV, HEV, PHEV-CD and PHEV-CS) and for two different anode chemistries (hard-carbon and graphite) are shown in Figures 13a and 13b. The extent of microcrack density for increasing (5–15 μm) particle size [case (i)] is shown in Figure 13a. Larger particle sizes and higher reaction current densities close to the separator significantly enhanced mechanical degradation in the active particles that are located near the separator. The magnitude of the microcrack density close to the separator can be as high as 10% under the most severe HEV operating conditions. Smaller active particles located close to the current collector rarely experience high reaction current density, and the damage evolution within them is significantly low.
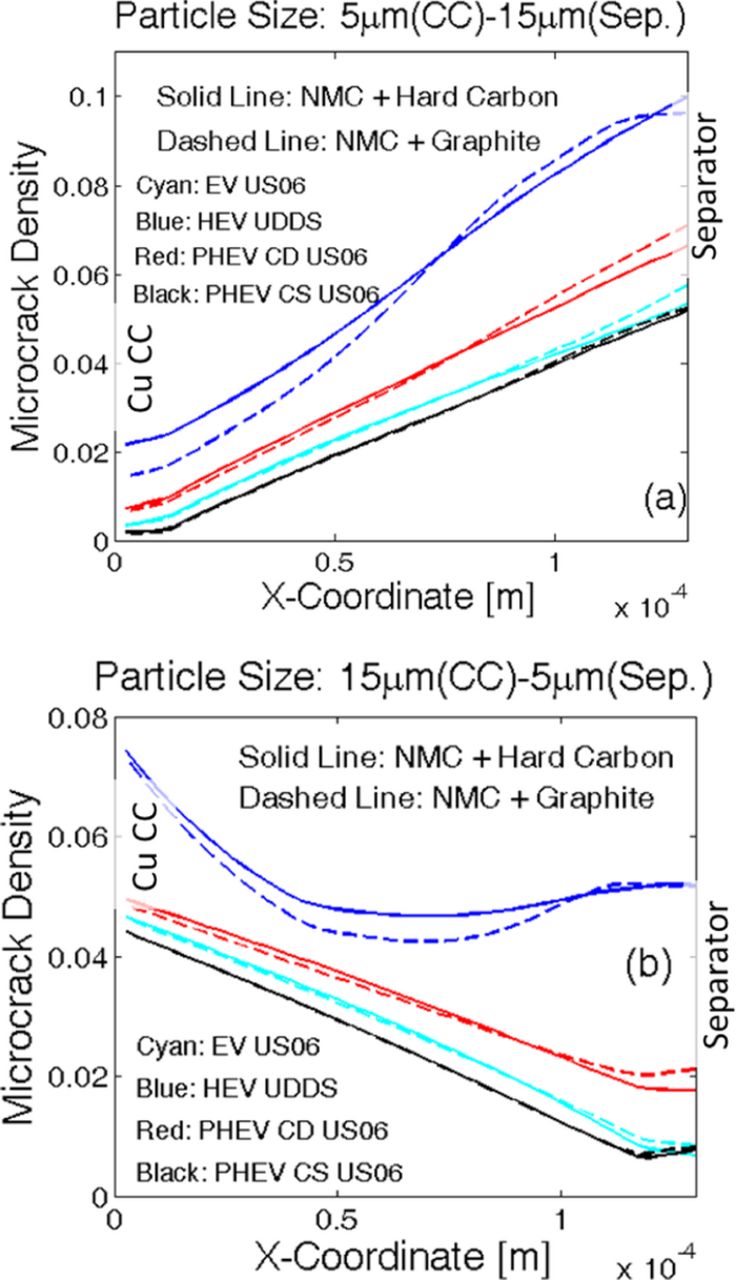
Figure 13. Instead of using uniform particle size, usage of a gradient in particle size would result in a different damage profile. Two different particle size distributions were considered: a) Linearly increasing particle size from 5 μm at the current collector to 15 μm at the separator, and b) Linearly decreasing particle size from 15 μm at the current collector to 5 μm at the separator. Four different drive cycles have been investigated for both the particle size distributions. For the drive cycles, larger rate of reaction is observed close to the separator. Thus, large particle size close to the separator leads to increased damage evolution as compared to the other case with small particle size close to the separator. Capacity analysis at 1 C rate of discharge revealed that the particle size distribution with smaller particles close to the separator is capable of retaining larger amount of capacity (see Table II).
Table II. (a). Capacity after different drive cycle operations for two particle size distributions with "NMC + Hard Carbon" chemistry. (b). Capacity after different drive cycle operations for two particle size distributions with "NMC + Graphite" chemistry.
| Name of Drive Cycle | 5 μm - 15 μm | 15 μm - 5 μm |
|---|---|---|
| No damage | 34.13 Ah | 34.18 Ah |
| Leaf, US06 | 33.33 Ah | 33.48 Ah |
| HEV, HWY | 32.86 Ah | 33.07 Ah |
| HEV, UDDS | 32.14 Ah | 32.9 Ah |
| PHEV, CD, US06 | 33.07 Ah | 33.36 Ah |
| PHEV, CS, US06 | 33.40 Ah | 33.56 Ah |
| Name of Drive Cycle | 5 μm - 15 μm | 15 μm - 5 μm |
| No damage | 34.13 Ah | 34.18 Ah |
| Leaf, US06 | 33.31 Ah | 33.49 Ah |
| HEV, HWY | - | 33.13 Ah |
| HEV, UDDS | 32.19 Ah | 32.98 Ah |
| PHEV, CD, US06 | 33.02 Ah | 33.39 Ah |
| PHEV, CS, US06 | 33.39 Ah | 33.56 Ah |
The damage profile for decreasing active particle sizes from 15 μm at the current collector to 5 μm at the separator is depicted in Figure 13b at the end of four different drive cycles. Evolution of microcrack density under both hard-carbon (denoted by a solid line) and graphite (denoted by a dashed line) chemistries of the anode was investigated, and the damage profiles for both of them are very close to each other. It was argued earlier that under drive cycle conditions, current is extracted in pulses, and the maximum reaction front is confined to the region very close to the separator. Thus, maximum damage should happen to the particles near the separator only. However, for the decreasing particle size distribution with the smallest particles located close to the separator, less damage should occur near the separator region. Thus, for this particular case of decreasing particle size operating under drive cycle conditions, there exist competitions with regard to where the minimum amount of damage should occur. Figure 13b clearly demonstrates that the amount of damage is not the minimum extremely close to the separator even though the smallest particles reside there. Due to the extremely high reaction current density, microcrack density evolves to a larger extent near the separator. Hence, the minimum amount of damage occurs somewhere at the interior of the negative electrode. The exact location of the minimum microcrack density depends on the drive cycle under which the battery is being operated. For example, HEVs operating under UDDS driving conditions (blue line) will experience the minimum damage somewhere close to the center of the electrode. However, for other PHEV and EV driving conditions, the minimum damage occurs near the separator somewhere at the interior of the electrode (see the red, cyan, and black lines). The active particles adjacent to the separator still experience higher microcrack density due to enhanced reaction current density. The maximum amount of damage is observed wherever the largest particles reside. For the particular case under investigation, the largest particles (15 μm) are located near the current collector. As a result, the maximum amount of damage is observed close to the current collector itself.
Some knowledge about the extent of mechanical degradation is important to estimate the durability of the active particles. However, the real impact of the mechanical degradation is reflected in analyzing the capacity fade after operation under different drive cycle conditions. Computational RPT tests were conducted on both distributions of particle sizes [linearly increasing from 5 μm to 15 μm (denoted as case (i)), and linearly decreasing from 15 μm to 5 μm (represented as case (ii))] after operating under five different drive cycles. The capacities obtained from the computational RPT are shown in Tables IIa and IIb for the two anode chemistries of hard-carbon and graphite, respectively. For case (ii), where 5-μm sized particles reside close to the separator, under no mechanical degradation, this distribution shows a higher magnitude of capacity (0.05 Ah larger) than its counterpart that contains 15-μm sized particles (case (i)) near the separator. Under the most severe HEV operating conditions, the particle size distribution with decreasing particle size (current collector to separator) shows 0.75 Ah larger capacity than its counterpart with increasing particle size. This difference in capacity fade will be even more under high C-rate operations. Utilization of graphite chemistry leads to more capacity fade than that observed for hard-carbon anodes. Thus, particle size distributions with large particles close to the separator should be avoided from the perspective of mechanical degradation. Similarly, capacity fade is less severe for those distributions that contain smaller particles close to the separator.
Conclusions
A reduced order model has been developed to characterize the amount of mechanical degradation in single active particles for different particle sizes during operation under different C-rates. The reduced order model involves two different parameters, a) maximum extent of damage evolution (denoted by Amax ), and b) rate of damage evolution (denoted as mrate). Evolution of microcrack density on the outer surface of the active particles impacts the surface concentration significantly. Mechanical degradation close to the center of the active particles shows a minor impact on the surface concentration. For electrochemical purposes, only the surface concentration of the active particles affects the other reactions. While developing the reduced order model, only the formation of microcracks near the particle surface during delithiation is taken into consideration. An expression of effective diffusivity has also been developed to incorporate the impact of microcrack density on the diffusivity of the active particles.
A 1D multiphysics computational framework has also been developed that can solve for the evolution of potential and concentration in a coupled fashion along the thickness of the electrodes and the separator. Coupling between the concentration and the potential terms have been accomplished via the extremely nonlinear Butler-Volmer equation. A Taylor-series expansion has been implemented to linearize the nonlinear terms. The impact of mechanical degradation in the anode has been incorporated within the 1D electrode-level model via reduction in effective diffusivity of the solid active particles. For uniform particle sizes along the thickness of the negative electrode, under CC discharge and CCCV charge conditions mechanical damage evolves in a uniform fashion throughout the thickness of the electrode. This happens because during the discharge process, the maximum reaction current front travels along the thickness of the electrode. At the beginning of the discharge process, the maximum reaction current density is observed close to the separator; with time it shifts towards the current collector, resulting in uniform evolution of microcrack density. Evolution of microcracks on the active particles does not result in lithium loss, but increases the resistance due to transport limitations. Capacity fade due to microcrack evolution is larger for high C-rate operations. If a particle size distribution is used within the electrode, it is beneficial to place the smaller particles close to the separator and larger particles near the current collector.
If a LIB is operating under drive cycle conditions, the discharge and charge currents act as strong pulses. Due to short duration of the pulse, the maximum reaction current density front cannot move along the thickness of the electrode and remains confined close to the separator only. Thus, significantly large mechanical degradation is observed within active particles close to the separator while operating under drive cycle conditions. Particles close to the current collector experience a smaller magnitude of reaction current density, and subsequently a reduced extent of mechanical degradation is observed there. As a result, it is always beneficial to use a distribution of particles with smaller particles close to the separator for drive cycle operations. However, for HEV applications with graphite anode active materials, due to excessively high reaction current density, maximum amount of mechanical degradation can occur somewhere in the middle of the electrode. Also, under drive cycle scenarios, the majority of the capacity fade due to microcrack formation is observed in particles greater than 10 μm in radius. Thus, it is also suggested to use anode active particles less than 10 μm in size for drive cycle applications. In this way, the impact of mechanical degradation of active particles on cell performance can be mitigated to a significant extent.
Acknowledgments
Financial support from National Renewable Energy Laboratory and National Science Foundation (NSF award no. 1438431) is gratefully acknowledged. K. Smith and G.-H. Kim acknowledge funding provided by the U.S. Department of Energy Vehicles Technology Office.
: Appendix A
Appendix. Summary of "Porous Electrode Theory"
Figure 1 shows schematic diagram of a cell that is usually adopted in "porous electrode theory". According to this homogenized model, two different phases are considered in each electrode, the active particles and the electrolyte. The separator acts as a medium through which only the electrolyte diffuses. The electrons cannot pass through the polymeric separator. The active particles are considered as spherical particles, and lithium diffusion within them are modeled using Fick's law of diffusion with a flux prescribed boundary condition on the surface.
![Equation ([A1a])](https://content.cld.iop.org/journals/1945-7111/162/9/A1751/revision1/jes_162_9_A1751eqn8.jpg)
![Equation ([A1b])](https://content.cld.iop.org/journals/1945-7111/162/9/A1751/revision1/jes_162_9_A1751eqn9.jpg)
Here, cs is the concentration of lithium atoms within the solid phase, Ds signifies the diffusivity of lithium within the solid, and j is the reaction current density that flows at the solid electrolyte interface. The expression for the reaction current density is obtained from the Butler- Volmer equation, which is also written as,
![Equation ([A2])](https://content.cld.iop.org/journals/1945-7111/162/9/A1751/revision1/jes_162_9_A1751eqn10.jpg)
Where j is the reaction current density, j0 signifies the exchange current density, αa and αc are the anodic and cathodic transfer coefficients of electrode reaction, respectively, F signifies the Faraday constant, R represents the universal gas constant, and T corresponds to the temperature at which the reaction occurs. For the simulations conducted in the present article, the temperature has been kept fixed at room temperature or 298 K. The overpotential in the anode and cathode are denoted by η and defined by the expression,
![Equation ([A3])](https://content.cld.iop.org/journals/1945-7111/162/9/A1751/revision1/jes_162_9_A1751eqn11.jpg)
Where ϕs signifies the solid phase potential, ϕe denotes the electrolyte phase potential, and finally, U signifies the open circuit potential within the electrodes.
Similar to the solid phase, diffusion of lithium ions also occurs within the electrolyte phase. Usually the diffusivity of lithium ions within the electrolyte is much faster than that observed within the solid phase. Accumulation of lithium ions within the electrolyte due to the reaction current acts as a source term.
![Equation ([A4a])](https://content.cld.iop.org/journals/1945-7111/162/9/A1751/revision1/jes_162_9_A1751eqn12.jpg)
![Equation ([A4b])](https://content.cld.iop.org/journals/1945-7111/162/9/A1751/revision1/jes_162_9_A1751eqn13.jpg)
Here, L = La + Lc + δsep and ε signifies the porosity. Also, ce represents the concentration of lithium ions within the electrolyte, Deffe( = Deε1.5) represents effective diffusivity of lithium ions within the electrolyte in terms of the actual diffusivity and the porosity of the medium, as is the active surface area per unit volume, and t+ represents the transference number corresponding to lithium ions. Transference number signifies the fraction of migration current that is carried by the lithium ions. That fraction of lithium ions within the electrolyte does not accumulate and simply migrate from one electrode to the other. As a result, that fraction is deducted from the total amount of lithium ions that gets released during the flow of reaction current.
Electro-neutrality is a necessary condition to be satisfied at every point within the electrochemical cell. Thus, quasistatic charge conservation must occur within both the solid phase as well as the electrolyte phase of the cell. Electric potential within the solid phase follows Ohm's law,
![Equation ([A5a])](https://content.cld.iop.org/journals/1945-7111/162/9/A1751/revision1/jes_162_9_A1751eqn14.jpg)
![Equation ([A5b])](https://content.cld.iop.org/journals/1945-7111/162/9/A1751/revision1/jes_162_9_A1751eqn15.jpg)
Here, σeff( = σ(1 − ε)1.5) is the effective conductivity written as a function of free conductivity and porosity, ϕs is the solid phase potential, I signifies the applied current, and A represents the area at the electrode current collector interface. Similarly charge conservation within the electrolyte gives,
![Equation ([A6a])](https://content.cld.iop.org/journals/1945-7111/162/9/A1751/revision1/jes_162_9_A1751eqn16.jpg)
![Equation ([A6b])](https://content.cld.iop.org/journals/1945-7111/162/9/A1751/revision1/jes_162_9_A1751eqn17.jpg)
Here, the electrolyte potential is denoted by ϕe. Also, La − ε denotes the left side of the anode-separator interface and La + ε represents the right side of the anode separator interface. Similarly, La + δsep − ε and La + δsep + ε corresponds to the left and right side of the separator-cathode interface, respectively. For reference purpose, the electrolyte potential is set to zero at the cathode/current-collector interface. The effective electrolyte conductivity written as κeff( = κε1.5) in terms of the free electrolyte conductivity (κ) and the porosity of the electrode (ε). The second term in left hand side of Eq. A6a signifies diffusion of the charged particles associated with concentration gradients. Also κeffd = κdε1.5, where κd is a constant. While calculating conservation of charge within the electrolyte, the contribution from both the charge transport via Ohm's law and the diffusion of charged particles must be taken into consideration. As a result, there exist two terms in the left hand side (LHS) of the governing equation provided in Eq. A6a. At the active particle-electrolyte interface, lithium ions are consumed as they react with the electron and diffuse inside the active particles as lithium atoms. Thus, the reaction current acts as a sink term at the electrode electrolyte interface. The conductivity of electrolyte (κ) and κd are not independent parameters. They depend on the diffusivity of the electrolyte phase (De) and the initial electrolyte concentration (ce, init).60
![Equation ([A7])](https://content.cld.iop.org/journals/1945-7111/162/9/A1751/revision1/jes_162_9_A1751eqn18.jpg)
The assumption that ionic conductivity (κ) is a function of initial electrolyte concentration (ce, init) is not fully correct. It should rather be a function of local electrolyte concentration (ce(x, t)). However, that modification would introduce another set of nonlinearity within the governing differential equations. The developed computational methodology is indeed capable of solving this type of nonlinear equations. The major purpose of this article is to analyze the capacity fade due to microcrack formation within the solid phase. As a result, some approximation regarding the actual magnitude of ionic conductivity is acceptable. Hence, estimation of κ has been conducted based on the initial electrolyte concentration (ce, init) is justified to some extent.
Cell voltage is determined by calculating the difference between the solid phase potential at the positive and the negative electrodes. The drop in cell voltage due to the internal resistance (Rcell) should also be incorporated.
![Equation ([A8])](https://content.cld.iop.org/journals/1945-7111/162/9/A1751/revision1/jes_162_9_A1751eqn19.jpg)
: Appendix B
Appendix. Numerical coupling
The governing differential equations described above have been discretized along the thickness direction of the electrode. All three different regions of the anode, separator, and cathode have been taken into consideration. There exist four unknown variables at each node of the computational domain, which are given as follows, (i) solid phase concentration on the surface of the active particles (cs, s = cs(r = R)), (ii) electrolyte phase concentration (ce), (iii) solid phase potential (ϕs), and (iv) electrolyte phase potential (ϕe). The electrolyte concentration, solid potential, and the electrolyte potential have been solved in a coupled fashion using the governing differential equations, Eqs. A4a, A5a, and A6a. Solution of the solid phase concentration was conducted separately (Eq. A1a). A spherical active particle is assumed to exist at each of the nodes. The solid phase concentration distribution has been obtained by solving the diffusion equation for spherical particles at each of the nodes individually. All the terms in Eqs. A4a, A5a, and A6a except the reaction current density (j) are linear in nature. A Taylor series expansion has been introduced to linearize the nonlinear component of the reaction current density (j), which is a function of solid phase potential (ϕs), electrolyte potential (ϕe), and solid phase surface concentration (cs, s). Because the solid phase concentration has been computed separately, the reaction current density has not been linearized with respect to the cs, s term. The Taylor series expansion of the reaction current density gives,
![Equation ([B1])](https://content.cld.iop.org/journals/1945-7111/162/9/A1751/revision1/jes_162_9_A1751eqn20.jpg)
Here, ϕs and ϕe are the values of solid and electrolyte potential, which are unknown and being solved for. ϕs, 0 and ϕe, 0 are the values of solid and electrolyte phase potential at the previous time step, which is known. Derivative of the reaction current density with respect to the solid and electrolyte phase potential can be written as,
![Equation ([B2])](https://content.cld.iop.org/journals/1945-7111/162/9/A1751/revision1/jes_162_9_A1751eqn21.jpg)
Please see Eq. A3 for an expression of η as a function of ϕs and ϕe. The derivative of reaction current density with respect to the overpotential is provided in Eq. B3:
![Equation ([B3])](https://content.cld.iop.org/journals/1945-7111/162/9/A1751/revision1/jes_162_9_A1751eqn22.jpg)
Substituting Eqs. B1, B2, and B3 into Eqs. A4a, A5a, and A6a, linearized versions of the governing differential equations have been obtained as follows:
![Equation ([B4])](https://content.cld.iop.org/journals/1945-7111/162/9/A1751/revision1/jes_162_9_A1751eqn23.jpg)
![Equation ([B5])](https://content.cld.iop.org/journals/1945-7111/162/9/A1751/revision1/jes_162_9_A1751eqn24.jpg)
![Equation ([B6])](https://content.cld.iop.org/journals/1945-7111/162/9/A1751/revision1/jes_162_9_A1751eqn25.jpg)
Discretizing the linear equations Eqs. B4, B5, and B6 by using a finite difference scheme, the coupled matrix for solid and electrolyte potential and electrolyte concentration are obtained.
: Appendix C
A comparison between the open circuit potential curves for graphite and hard carbon is shown in Figure C1. For hard carbon, the OCP decreases gradually with increasing lithium content. Whereas, for graphite the OCP curve remains more or less constant for a wide range of lithium concentration, and suddenly drops as the concentration reaches very close to the maximum value. This is reflected in the voltage profile as well, which is shown in Figure C2. Voltage profiles for hard-carbon anode and NMC cathode is shown in Figure C2a at multiple C-rates (solid line). Difference in performance curve due to mechanical degradation is also clearly demonstrated there (dashed line). Similar performance curves for graphite anode and NMC cathode at multiple C-rates have been demonstrated in Figure C2b. The solid line corresponds to the performance without mechanical degradation, whereas, the dashed line signifies the impact of mechanical degradation on cell performance. For both hard-carbon and graphite, enhanced mechanical degradation happens at high C-rate (3 C and 4 C). As a result, the impact of mechanical damage on performance curve is also more sever at high rate operating conditions. For graphite anode and NMC cathode, the voltage vs. capacity curve with mechanical damage at 4 C stops much earlier before reaching the lower cutoff voltage, which is set at 2.8 V for graphite (see Figure C2b). At 4 C, due to enhanced mechanical degradation, diffusivity of the solid active particles decreases rapidly. Reduction in diffusivity causes the surface concentration to decrease extremely quickly and it becomes zero at certain points within the anode. The present computational procedure is incapable of handling constant concentration boundary condition at the surface of the active particles. The simulation is stopped as soon as the surface concentration of the active particle becomes zero.
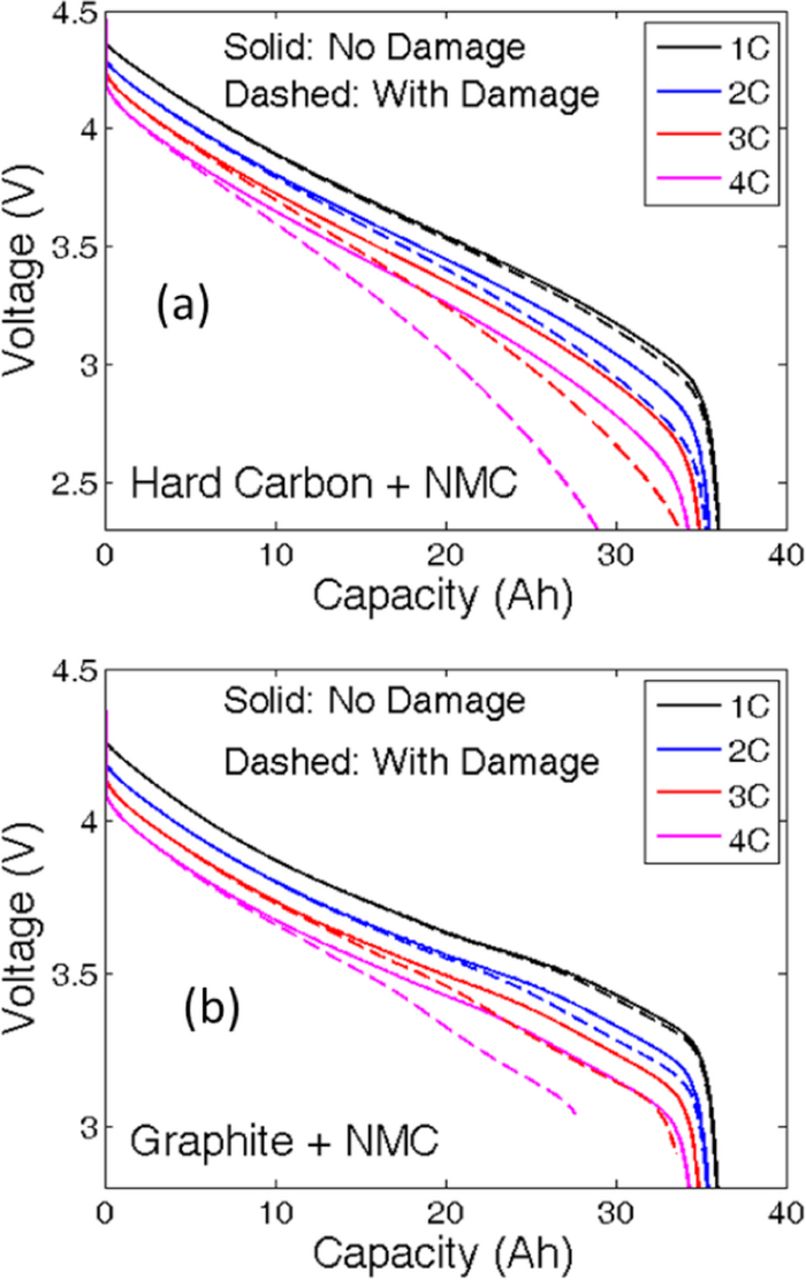
Figure C2. Comparison of the performance curves with and without mechanical degradation at different C-rate operation conditions. (a) "Hard carbon + NMC" chemistry have been used here. (b) "Graphite + NMC" chemistry have been used in these simulations. For both the chemistries, effect of mechanical degradation on cell performance is only significant for high C-rate operations. The performance curve for "Graphite + NMC" at 4 C with mechanical degradation (case (b)) stops abruptly, because of the fact that severe mechanical degradation causes the local concentration to become zero.
: Appendix D
Solid-state diffusivity depends on the local lithium concentration (i.e. SOC). In the present study, diffusivity is assumed to be a linear function of the local lithium concentration.
![Equation ([D1])](https://content.cld.iop.org/journals/1945-7111/162/9/A1751/revision1/jes_162_9_A1751eqn26.jpg)
Here, D(cs) is the concentration dependent diffusivity, D0 is the diffusivity under zero lithium concentration, kd is a parameter which controls how quickly the diffusivity drops with increasing concentration, cs and cs, max corresponds to the local and maximum lithium concentration, respectively. From physical considerations, for single phase materials, the value of diffusivity cannot be negative, which signifies that the magnitude of kd will always lie between zero and one (0 < kd < 1). For the present analysis kd = 0.5 has been assumed.
The effect of concentration dependent diffusivity on the performance curve has been demonstrated in Figure D1 for graphite anode material for two different C-rates (1 C and 3 C). At higher rates of operation concentration gradient within the active particle is much larger. As a result, at 3 C, concentration dependent diffusivity leads to enhanced mass transport resistance and subsequently smaller effective capacity of the cell. Addition of mechanical degradation on top of the concentration dependent diffusivity results in further increase of mass transport resistance (as shown in Figure D1). At low C-rate operation, small amount of microcrack formation shows little impact on the performance curve. However, at high C-rate enhanced mechanical degradation indeed affects the cell performance by increasing the mass transport resistance. Reduction in effective capacity at 3 C due to mechanical degradation is evident in the red dash-dot curve of Figure D1.
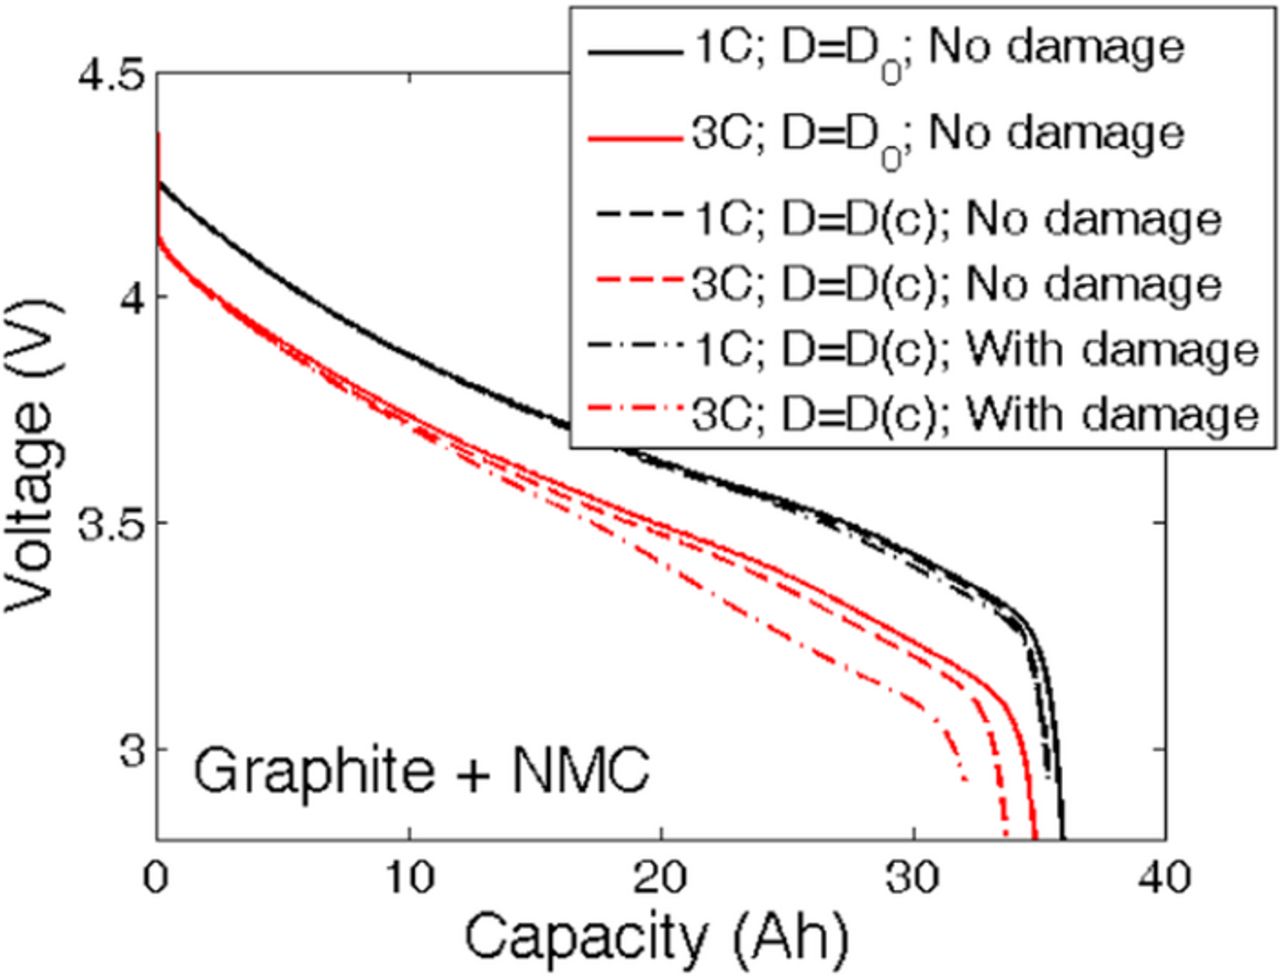
Figure D1. Performance curves for "Graphite + NMC" at two different C-rates. The solid line corresponds to the case where diffusivity is kept constant. The dash-dash line corresponds to the performance curve when diffusivity is a function of concentration. The dash-dot line signifies performance when mechanical degradation is taken into consideration. At low C-rate operation, mechanical degradation has minimal impact on overall cell performance. At high C-rate operations (3 C), enhanced microcrack formation impacts the performance curve significantly.
: Appendix E
Most of the electrode properties used in this analysis correspond to slightly old spinel type cathode chemistries. The electrodes are assumed to be thicker (La = Lc = 130 μm) with higher porosity (εa = 0.357, εc = 0.444) for electrolyte transport. At present, NMC or NCA based cathode chemistries are used under the condition of thinner electrode and smaller amounts of porosity for electrolyte movement. Mostly cells used in HEVs and PHEVs have a thinner electrode for high power requirements. Some simulations have been conducted to demonstrate the applicability of the developed method for thinner electrodes (La = Lc = 80 μm) with reduced porosity for electrolyte transport (εa = 0.264, εc = 0.281). The voltage vs. capacity plots for the first discharge are reported in Figure E1a. Damage profiles along the thickness of the negative electrode at the end of the discharge process are reported in Figure E1b. NMC and graphite have been used as the active cathode and anode materials, respectively. Two different particle size distributions have been considered: (i) Decreasing particle size of 15 μm close to the current collector to 5 μm at the separator, and (ii) Increasing particle size of 5 μm close to the current collector to 15 μm at the separator. At lower rates of operation, such as 1C, the maximum amount of mechanical degradation is around 6% observed within the largest particles of size 15 μm (see Figure E1b). Capacity for both the increasing and decreasing particle size distributions are almost the same at 1 C (see Figure E1a). However, at higher rates of operation, such as 3 C, two different particle size distribution leads to completely different damage profiles. For the increasing particle size distribution, microcrack density increases monotonically from the current collector to the separator (red solid line in Figure E1b). At 3 C for the decreasing particle size distributions, as depicted by the red dashed line in Figure E1b, microcrack density drops initially from the current collector towards the middle of the electrode. Extremely close to the separator, where 5 μm sized active particles reside, the density of microcracks increase. Thus, for the decreasing particle size distribution, there exist a minimum in microcrack density somewhere in the middle of the electrode. Effective capacity of the decreasing particle size distribution is marginally larger than its increasing counterpart at high C-rate operations (red dashed and solid lines in Figure E1a). Voltage vs. capacity curve at 3 C ends even before reaching the lower cutoff voltage of 3.0 V. This happens due to enhanced mechanical degradation within the anode active particles close to the separator, concentration profile reaches negative values much before discharging till 3.0 V. More detailed analysis of the 3D electrode microstructure must be conducted to fully understand the exact effect of thin electrodes with three or four particles along the thickness.
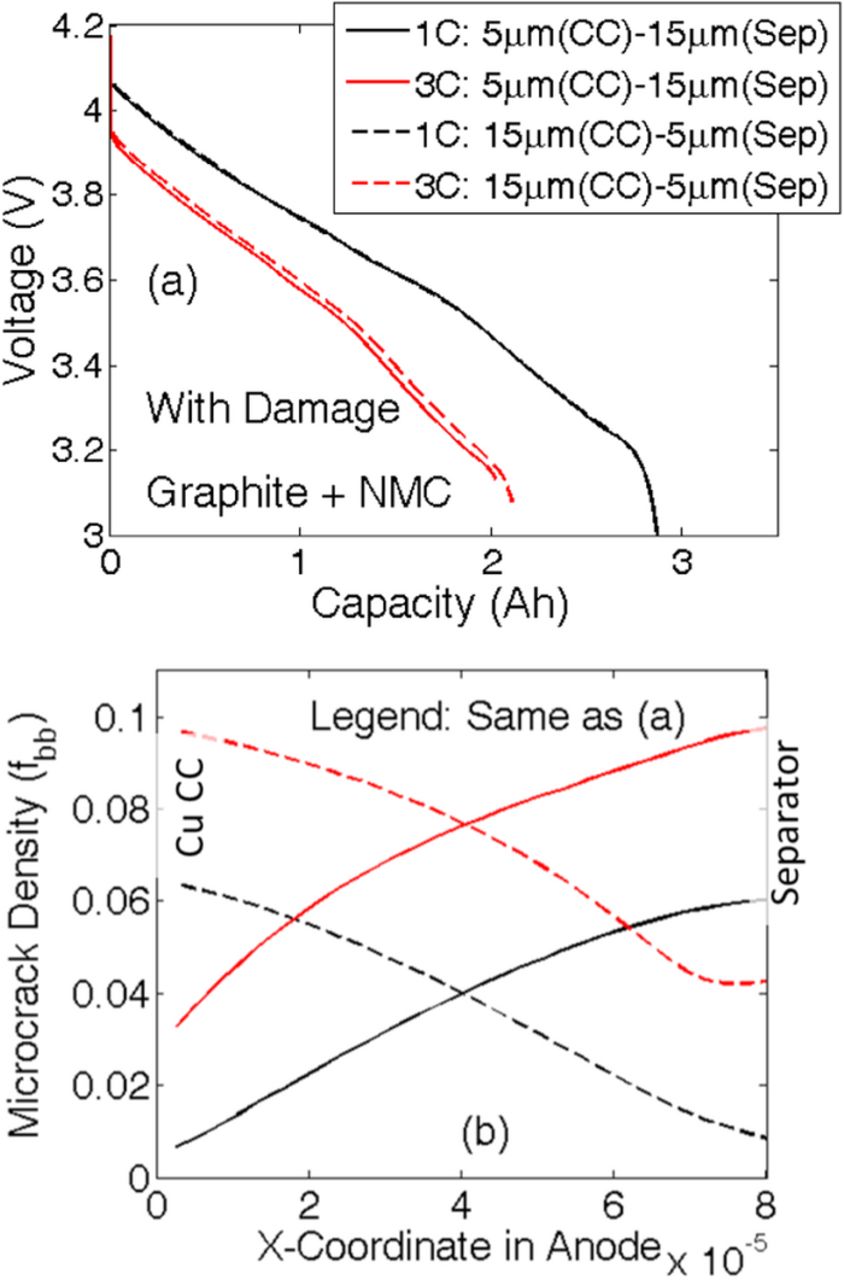
Figure E1. Analysis of performance curves and microcrack profiles for thin electrodes and small values of porosity. Two different particle size distributions are considered: (i) Increasing particle size of 5 μm close to the current collector to 15 μm at the separator. (ii) Decreasing particle size of 15 μm close to the current collector to 5 μm near the separator. (a) Voltage vs. capacity performance curves at two different C-rates (1 C and 3 C) and both the increasing and decreasing particle size distributions. (b) Profile of microcrack density for 1 C and 3 C under increasing and decreasing particle size distributions.
: Appendix F
During drive cycle operations, the lithium ion batteries never experience constant charge or discharge through constant current or constant voltage conditions. Constant current pulses of charge or discharge spanning over very small time intervals are applied to the lithium ion batteries. Two such drive cycle pulses are shown in Figures F1a and F1b, which corresponds to HEV under UDDS driving conditions and PHEV under charge depleting US06 driving conditions, respectively. The effect of these operating conditions on mechanical degradation and subsequent capacity fade is discussed in Figure 12.