Abstract
The aim of this work is to compare the corrosion resistance of nickel-base Alloy 625 (UNS N06625) produced by laser powder bed fusion with that obtained via conventional casting and hot working. Cyclic potentiodynamic polarization and potentiostatic tests were performed in order to evaluate the corrosion resistance of the differently manufactured alloys according to ASTM G5, and in NaCl 0.6 M solution at pH 7 and pH 3, at 40°C. The electrochemical characterization was carried out on the as-produced alloy and after annealing at 980°C for 32 minutes (according to ASTM B446). This heat treatment was also performed on the commercial hot worked alloy. Two surface conditions, namely as-built and polished surfaces, were investigated on the additive manufactured specimens. The alloy produced by laser powder bed fusion was not susceptible to pitting in the considered environments and had a good localized corrosion resistance, slightly higher than that of traditional wrought material. However, as predicted, the corrosion resistance of the as-built surfaces increased after mechanical polishing. The correlation between the corrosion performance and microstructure is also discussed.
Export citation and abstract BibTeX RIS

This is an open access article distributed under the terms of the Creative Commons Attribution 4.0 License (CC BY, http://creativecommons.org/licenses/by/4.0/), which permits unrestricted reuse of the work in any medium, provided the original work is properly cited.
Alloy 625 is widely used in aerospace applications,1 marine environments including the manufacture of heat exchangers,2 in the Oil and Gas industry3–5 and in nuclear plants6–8 thanks to its high mechanical properties, good corrosion resistance and great performance at high temperatures. However it can suffer from localized corrosion, such as crevice, pitting, intergranular corrosion and stress corrosion cracking (SCC) in very aggressive conditions.9–11 The manufacturing of complex shaped components out of Alloy 625 via traditional processing techniques is technically challenging and very expensive. For these reasons, additive manufacturing (AM), which is the processes for the fabrication of near net-shape components via the progressive addition of material, has been widely studied for this alloy in recent years.12 The advantages of AM include the possibility of creating components of complicated geometries thus avoiding complex mechanical machining as well as reducing the time-to-market and the machining wastage.13 Moreover, it is possible to obtain very fine microstructures with mechanical properties higher than those of traditional cast alloys.14–16 On the other hand, AM components are often associated with porosity and the high surface roughness, and these particular microstructures can be more susceptible to different forms of corrosion than those materials obtained with more traditional techniques.17–33 Amongst AM techniques, Laser Powder Bed Fusion (LPBF) is the most widespread technology for metals nowadays. In this process, a laser beam scans across a thin layer of metallic powder and locally melts its substrate.34 This process has higher accuracy and produces components with lower surface roughness than other AM techniques such as Electron Beam Melting (EBM).35,36 Some examples of the resistance to pitting of nickel base alloys obtained by selective laser melting (SLM) and tested in a highly corrosive environment (13 wt% NaCl solution at 80°C) are reported in literature for Alloy 718. Specifically, whist building orientations were not shown to play an important effect on the corrosion behavior,37 improved corrosion resistance with respect to conventionally produced components was reported.38 However, according to the authors' knowledge, in the literature there is no data about the corrosion resistance of Alloy 625 processed by LPBF or other additive manufacturing techniques. Therefore, the aim of this paper was to evaluate the localized corrosion (pitting and crevice) resistance of Alloy 625 samples manufactured via LPBF and compare it with the behavior of materials manufactured via conventional routes. This comparison was conducted using the methodology stated in the ASTM G5 standard, as well as in 0.6 M NaCl solution, and the results were correlated with their corresponding microstructure. Cyclic potentiodynamic were carried out on the Alloy 625 produced via LPBF before and after the annealing heat treatment suggested by the standard (ASTM B446).39 Since the LPBF technology produces a rough surface, for comparison purposes, two types of surface treatment, namely as built and polished surfaces, were investigated for LPBF specimens. In this way it was also possible to evaluate the protectiveness of the passive film formed during LPBF as well as its modification with the heat treatment. Finally, critical crevice temperatures of all the samples were evaluated using ASTM G48 Method D.
Materials and Methods
The electrochemical tests were carried out on LPBF disc samples which were 15 mm in diameter and 5 mm thick. These samples were fabricated using an EOSINT M270 Dual Mode version (EOS Gmbh, Germany) and oriented such that the tested surface was parallel to the building direction. The same sample geometry was also used to investigate the corrosion behavior of the alloy produced by hot worked (HW).
The 3D printing was obtained using a 200 W Yb-fiber laser with a spot diameter of 100 μm. The process was carried out in a protective argon atmosphere whilst the building platform was held at 80°C using the following parameters: laser power of 195 W, scan speed of 1200 mm/s, hatching distance of 0.09 mm and layer thickness of 0.02 mm.40 The chemical composition of the HW, the powder and the LPBF alloys were obtained via inductively coupled plasma (ICP) and infrared absorption IR analyses and are reported in Table I. The specimens manufactured via LPBF were tested in two conditions: without heat treatment (named LPBF-UT specimens) and after annealing at 980°C for 32 minutes followed by water quenching (named LPBF-HT specimens) as commonly used in the Oil and Gas industry. The hot worked specimens were also subjected to the same annealing treatment as the LPBF samples and are named HW-HT. The polished samples were firstly ground using SiC abrasive papers and subsequently polished to 1 μm finish using diamond paste impregnated cloths (labelled as "P"). Before the tests all the specimens were ultrasonically cleaned in acetone at room temperature and dried in a stream of hot air. The electrochemical tests were performed in a 1 liter standard three electrode cell (ASTM G5) using a PTFE sample holder with exposure area of 1 cm2, a Saturated Calomel Electrode (SCE) and two graphite counter electrodes. Before the test, the solution was de-oxygenated with nitrogen and the predicted value of oxygen in the solution for the tests was about 1 ppm. The cell was heated using a water bath and the temperature was monitored via a thermometer. Before the Cyclic Potentiodynamic tests, the corrosion potential (Ecorr) was monitored for 10 minutes. The potentiodynamic tests were carried out according to ASTM G5, although for certain experiments a 10 mV/min scan rate was used. The polarization tests were conducted from 10 mV below the Ecorr up to 1 V vs. SCE or until the anodic current density reached 10 mA/cm2, before reversing the sweeping direction and the test was concluded once the potential reached the initial open circuit potential value.
Table I. Chemical composition (%wt.) of the hot worked (HW) Alloy 625, the Alloy 625 LPBF powders and the massive Alloy 625.
| Element (%w) | HW Alloy 625 | LPBF Alloy 625 powder | LPBF Massive Alloy 625 |
|---|---|---|---|
| C | 0.036 | 0.013 | 0.01 |
| Si | 0.25 | 0.1 | 0.08 |
| Mn | 0.19 | 0.03 | 0.03 |
| P | 0.007 | <0.001 | <0.001 |
| S | 0.001 | 0.002 | 0.002 |
| Cr | 21.6 | 22.8 | 22.4 |
| Mo | 8.26 | 8.1 | 8.2 |
| Ni | 61.9 | Bal (64.37) | Bal (64.59) |
| Nb | 3.66 | 3.66 | 3.73 |
| Ti | 0.24 | 0.17 | 0.18 |
| Al | 0.2 | <0.01 | <0.01 |
| Co | 0.02 | 0.17 | 0.17 |
| Ta | 0.01 | 0.13 | 0.13 |
| Fe | 3.1 | 0.43 | 0.45 |
| Nb+Ta | 3.67 | 3.79 | 3.86 |
The potentiodynamic tests were conducted in three different environments:
- (1)0.5 M H2SO4 – according to ASTM G5 at 30°C
- (2)0.6 M NaCl + HCl (10−3 M), pH 3 at 40°C
- (3)0.6 M NaCl, pH 7 at 40°C
Potentiostatic tests were carried out in NaCl at pH 7 at +200 mV or +500 mV vs. SCE for 24 hours, with an acquisition rate of 1 Hz and were repeated twice. After the electrochemical tests every specimen was observed under a Scanning Electron Microscope (SEM) Zeiss EVO 50 equipped with Oxford Energy Dispersive X-ray Spectroscopy (EDS).
Critical Crevice Temperature (CCT) tests were performed according to the ASTM G48 – Method D using a customized Anderson device with elastic ties.41 The specimens with an exposed surface area of 13 cm2 were immersed in a solution containing 1% of HCl and 6% of FeCl3 for 72 hours. For these tests LPBF cubic specimens, with the faces parallel to building platform abraded with emery paper up to 180 grit, were used. The temperature was controlled with a thermostatic bath and maintained constant throughout each test. Several tests were conducted at different temperatures between 20°C and 40°C with a 5°C increase. Every specimen was weighed before and after the tests in order to measure their mass loss.
Results and Discussion
After the specimens were immersed in the solution they reached a steady state Ecorr within a few tens of seconds and their average values, calculated over 600 seconds, are reported in Table II. The Ecorr values were always higher than the equilibrium potentials of hydrogen (Figure 1), thus confirming that despite the nitrogen bubbling, oxygen was still present; this was confirmed by measurements using WTW FDO 925 optical oxygen sensor which indicated about 1 ppm present during the tests. Furthermore, as expected from the Pourbaix diagram of the chromium oxides42 and from the Nernst equation, the Ecorr decreased with increasing the pH. No differences in terms of Ecorr of LPBF-UT-P and HW-HT-P specimens were noticed, although the LPBF-HT-P samples had slightly lower Ecorr.
Table II. Ecorr values before potentiodynamic tests.
| Environment | Sample | Surface condition | Heat treatment condition | Average Ecorr (V vs. SCE) |
|---|---|---|---|---|
| 0.6 M NaCl pH 7 | LPBF | P | UT | −0.276 |
| −0.439 | ||||
| −0.303 | ||||
| AB | −0.368 | |||
| −0.443 | ||||
| −0.195 | ||||
| −0.491 | ||||
| −0.164 | ||||
| P | HT | −0.416 | ||
| −0.398 | ||||
| −0.377 | ||||
| AB | −0.373 | |||
| HW | P | −0.228 | ||
| −0.316 | ||||
| 0.6 M NaCl pH 3 | LPBF | P | UT | −0.211 |
| −0.212 | ||||
| HT | −0.249 | |||
| −0.273 | ||||
| −0.192 | ||||
| HW | P | HT | −0.203 | |
| −0.173 | ||||
| −0.222 | ||||
| 0.5 M H2SO4 | LPBF | P | UT | −0.103 |
| LPBF | P | HT | −0.122 | |
| HW | P | HT | −0.076 |
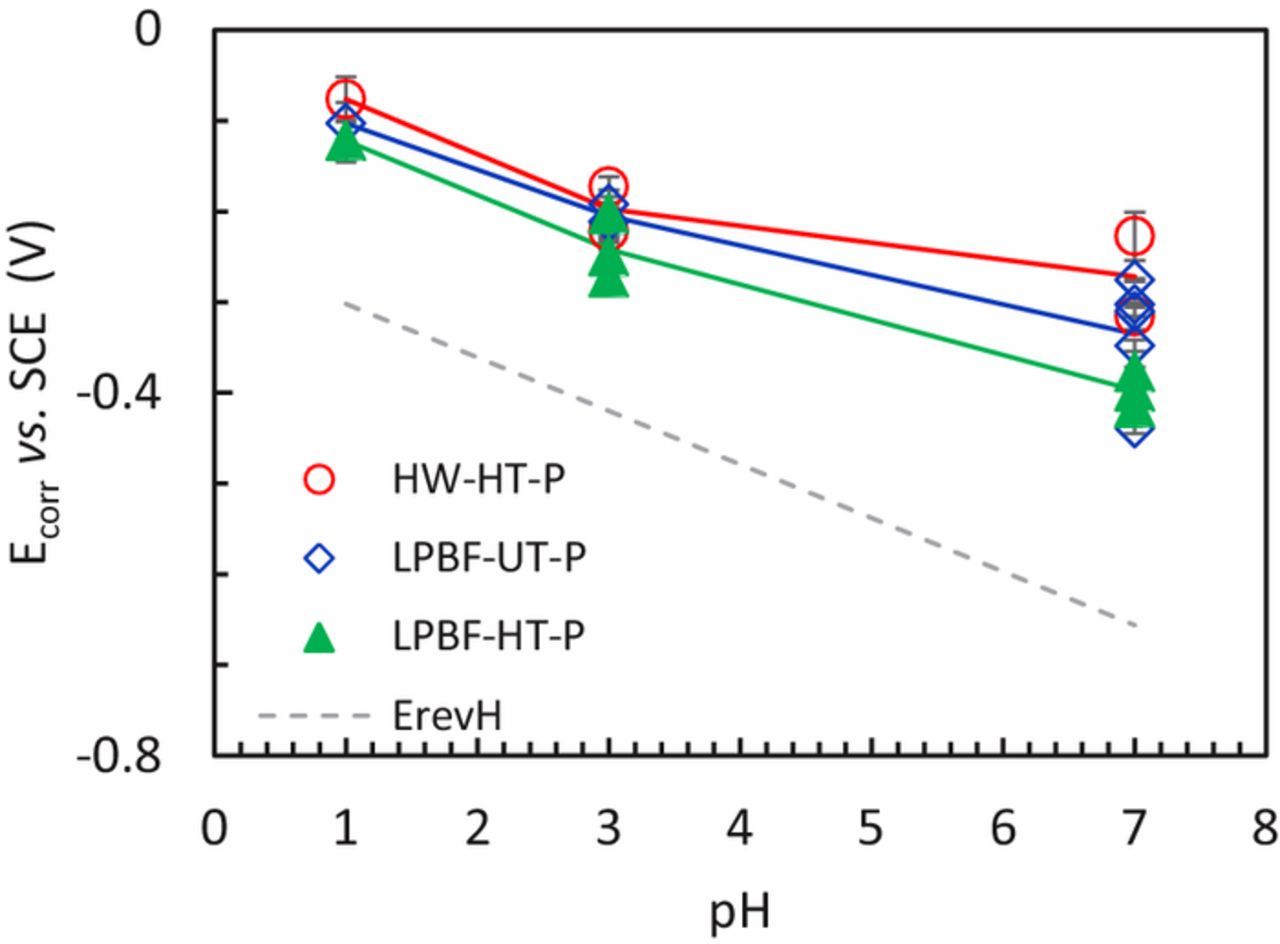
Figure 1. OCP (average values on 600 s) of the speciemens before the potentiodynamic tests in H2SO4 0.5 M solution at pH 1, in 0.6 M NaCl acidified at pH 3 solution and in neutral NaCl 0.6 M at pH 7.
Some examples of the cyclic potentiodynamic curves are shown in Figure 2. Figure 2a shows the potentiodynamic (PD) curves obtained in H2SO4 0.5 M solution for every condition. All the specimens presented a passive behavior over a wide range of potential thus confirming the very high corrosion resistance of the Alloy 625. A similar behavior was observed in NaCl 0.6 M solution acidified with HCl to pH 3 (Figure 2b). In these solutions, no localized attack (pitting or crevice) was observed on any of the specimens after the tests. Conversely, the presence of crevice attacks was detected on some specimens after the potentiodynamic test in neutral NaCl 0.6 M solution. Examples of the E vs. i curves are displayed in Figure 2c and the potential at which the current started rapidly increasing could be associated with crevice (Ec), transpassivity (Et) or oxygen evolution reaction (OER). These phenomena were discriminated depending on whether hysteresis occurred when the scan was reversed as expected for crevice corrosion. The distinction between transpassivity and oxygen evolution reaction was done on a thermodynamic basis, where the OER potential was calculated according to the Nernst equation. The results shown in Figure 3a indicate the potentials associated with OER (dotted line), crevice (empty symbols) and transpassivity (full symbols). It is worth noting that sometimes, the specimens showed a passive behavior until the OER, but during the reverse scan the presence of a hysteresis loop was detected (e.g. the blue curve in Figure 2c) and it is consistent with results reported in the literature.43,44 In this case, it is reasonable to assume that the crevice potential was close to the OER and that the local acidification associated with OER promoted the localized attack.45
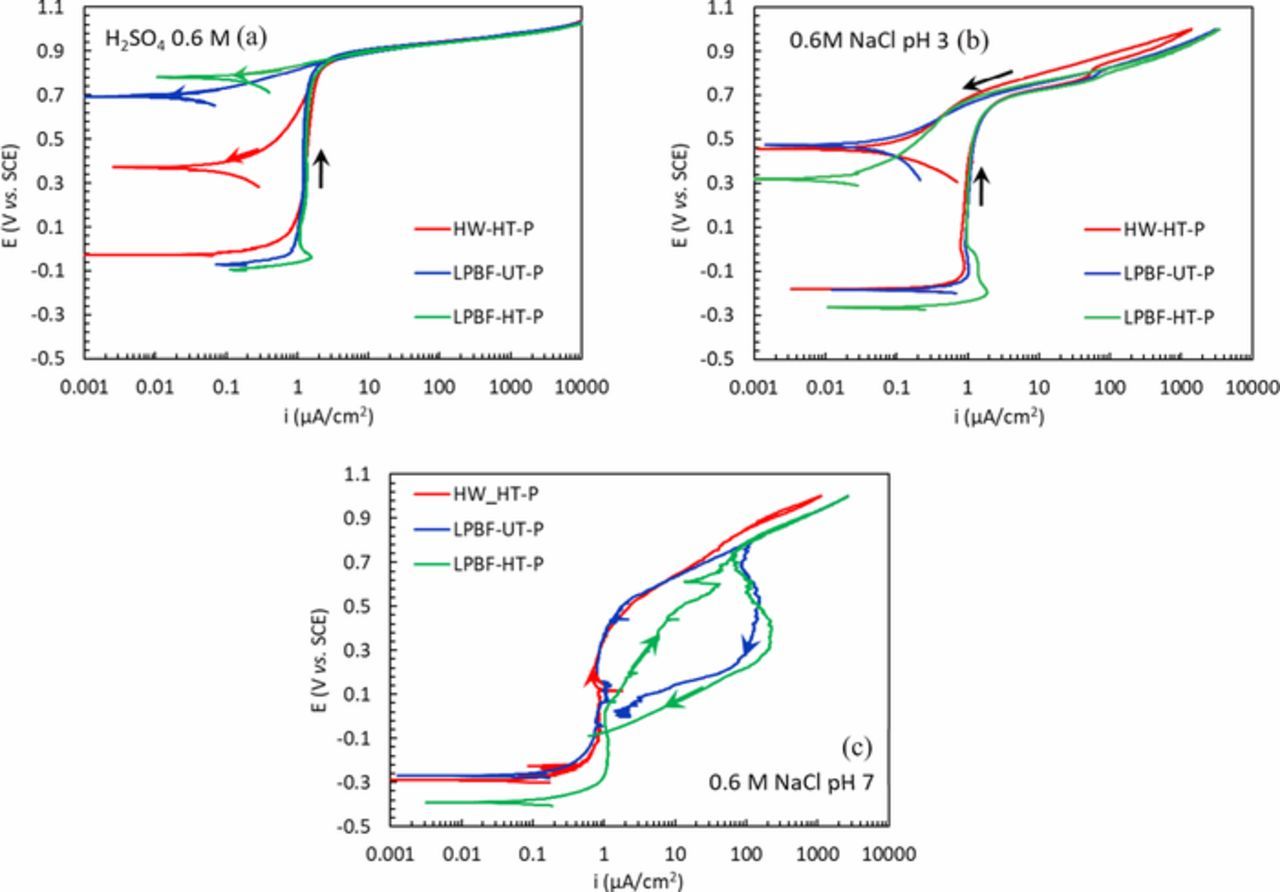
Figure 2. Potentiodynamic polarization curves of the HW and LPBF specimens (a) in H2SO4 0.5 M solution; (b) in 0.6 M NaCl acidified at pH 3 solution and (c) in neutral NaCl 0.6 M solution.
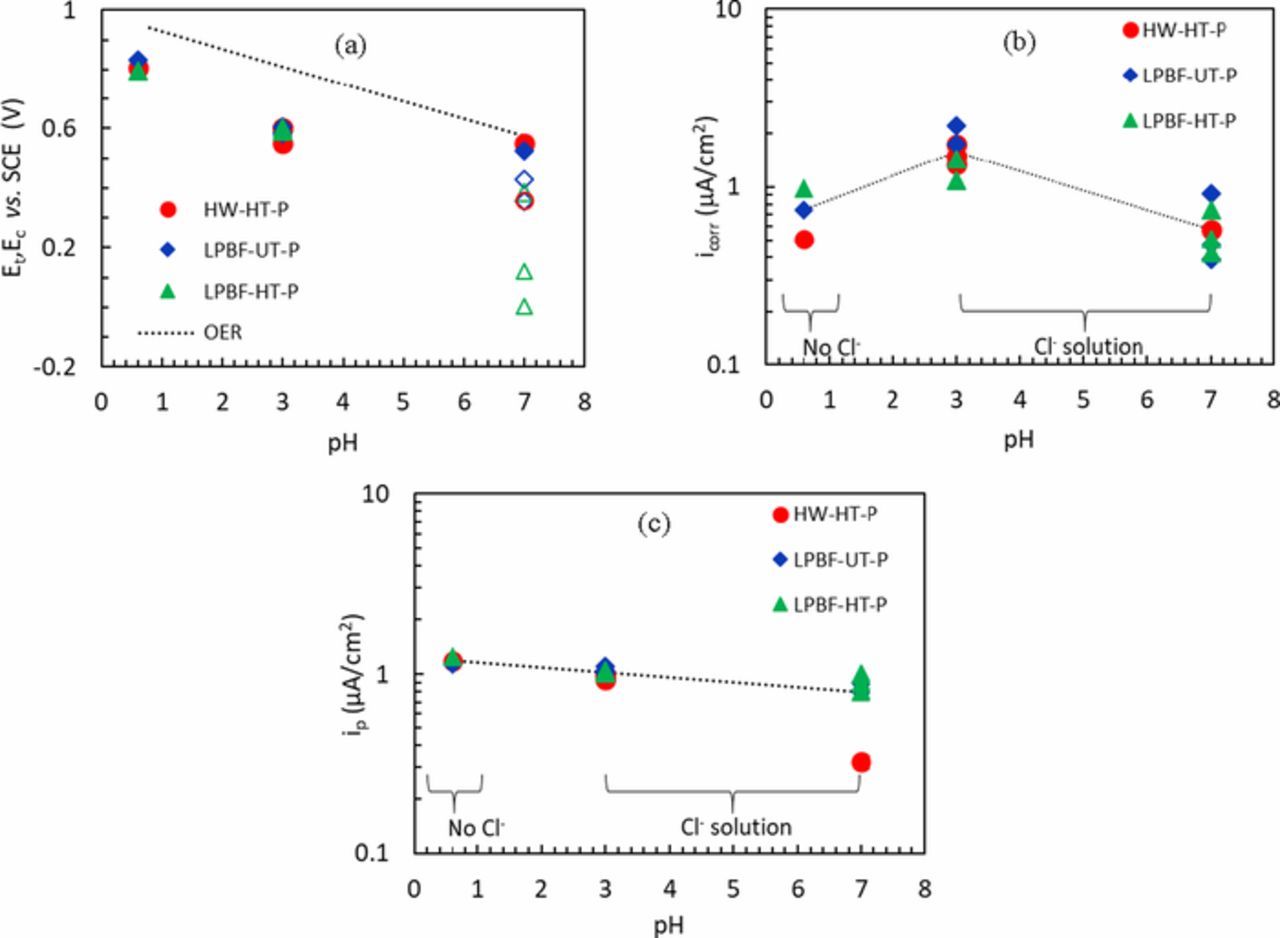
Figure 3. (a) Transpassive potentials (Et) (full symbols) and crevice potential (Ec) (empty symbols) as a function of pH for the HW and LPBF specimens; (b) Corrosion current density calculated from linear polarization resistance as a function of the pH of the solution; (c) Average passive current density a function of the pH of the solution.
The corrosion current densities icorr were also calculated by means of the Stern and Geary relation in the range of ± 10 mV vs. Ecorr using a typical value of 52 mV/decade for passive systems as the electrochemical constant B. The values of icorr, shown in Figure 3b, were slightly higher for all the samples tested in acidic and chloride containing solutions than for those tested in sulfuric acid or in neutral chloride solutions; however the difference between icorr of all the specimens (LPBF and HW) was negligible. Moreover, the value of the current densities in the passive range (ip) were calculated as an average over a potential range between −50 and 400 mV vs. SCE, or between -50 mV and Ec if the specimens presented localized corrosion, as shown in Figure 3c. The values of ip were very similar in all the solutions for all the specimens. All these results are summarized in Table III. However, noting that crevice corrosion was found in neutral condition but not in slightly acidic solution, further work is required to confirm this result.
Table III. Summary of the potentiodynamic tests data.
| icorr (μA/cm2) | ip (μA/cm2) | Et and Ec (V vs. SCE) | |||||||
|---|---|---|---|---|---|---|---|---|---|
| 0.6 M NaCl | 0.6 M NaCl | 0.5 M | 0.6 M | 0.6 M | 0.5 M | 0.6 M | 0.6 M | H2SO4 | |
| Sample | pH7 | pH3 | H2SO4 | NaCl pH7 | NaCl pH3 | H2SO4 | NaCl pH7 | NaCl pH3 | 0.5 M |
| HW-HT | 0.58 | 1.74 | 0.51 | 0.32 | 0.98 | 1.18 | 0.55 | 0.55 | 0.81 |
| Not determinable | 1.51 | 0.7 | 1.00 | 0.36* | 0.60 | ||||
| 1.35 | 0.94 | 0.60 | |||||||
| LPBF-UT-P | 0.47 | 0.74 | 0.80 | 1.01 | 1.14 | 0.35* | 0.61 | 0.83 | |
| 0.39 | 2.21 | 0.90 | 1.04 | 0.43* | 0.58 | ||||
| 0.91 | 1.75 | 0.90 | 1.10 | 0.52 | 0.58 | ||||
| LPBF-HT-P | 0.74 | 1.08 | 0.99 | 0.80 | 1.02 | 1.26 | 0.38* | 0.60 | 0.80 |
| 0.51 | 1.44 | 0.90 | 1.05 | 0.00* | 0.59 | ||||
| 0.43 | 1.00 | 0.12* | |||||||
| LPBF-UT-AB | Not determinable | 1.4 | 0.06* | ||||||
| 2.34 | −0.09* | ||||||||
| LPBF-HT-AB | 0.47 | 2.80 | 0.09* | ||||||
| 0.93 | 2.00 | 0.12* | |||||||
Even though the potentiodynamic tests did not highlight any significant differences between the corrosion resistance of the HW alloy and the LPBF-UT specimens, the evidence shows the possibility of crevice corrosion susceptibility in NaCl neutral solution, mainly for the LPBF-HT specimens. In order to study the crevice corrosion of the considered alloys, potentiostatic tests were carried out in solution of NaCl 0.6 M at pH 7. These tests were conducted at two potentials: one at +200 mV vs. SCE which corresponds to the passive range of all the specimens and the other at + 500 mV vs. SCE which is a few mV below the OER potential, therefore the potential is very anodic but there is no local acidification created by OER. At +200 mV vs. SCE, the LPBF specimens did not show any form of localized attack, whereas the HW-HT alloys showed crevice attack after less than one hour of immersion on two out of the three specimens tested. The passive current of the third HW-HT specimen that did not undergo crevice settled at about 0.07 μA/cm2. Conversely, the LPBF specimens showed lower passive current densities than the HW-HT specimens. In fact, the as-manufactured specimens had a passive current of about 0.05 μA/cm2, whilst the heat-treated sample had a passive current of about 0.025 μA/cm2 as summarized in Figure 4a. These values were less in comparison with ip because the potentiodynamic test is a non-stationary technique.
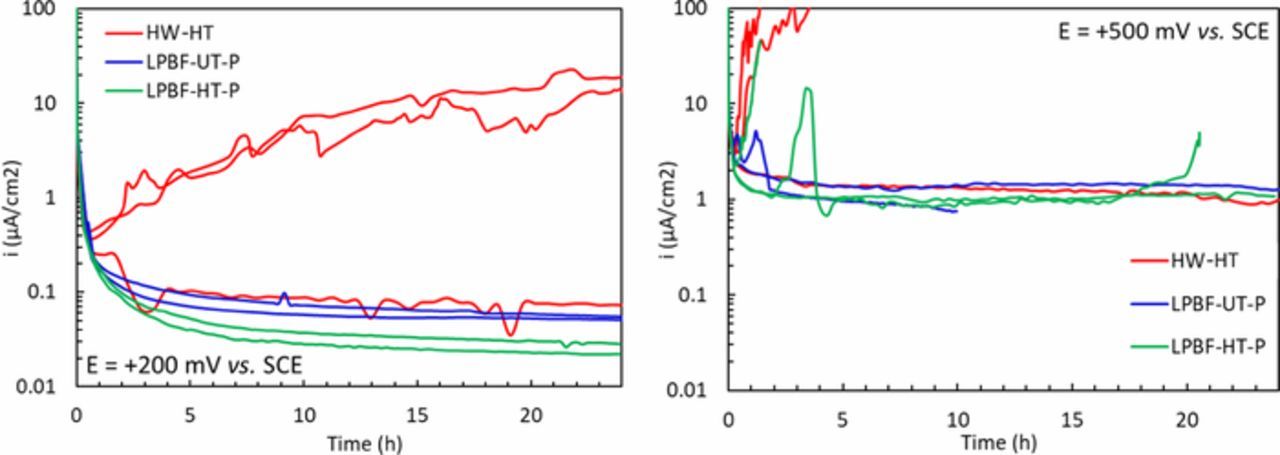
Figure 4. Current density vs. time during potentiostatic tests conducted (a) at + 200 mV vs. SCE and (b) at + 500 mV vs. SCE, in NaCl 0.6 M solution at pH 7.
During the potentiostatic test at +500 mV vs. SCE, it was possible to observe the rapid increase of the anodic current density due to the initiation of localized attacks. The attacks on the LPBF-UT specimens occurred at sites where porosity intersected the surface in the correspondence of the surface breaking pores and, although re-passivation occurred during the test, a stable value of the current density was reached. Conversely, both the HW-HT and the LPBF-HT specimens showed crevice attack that did not repassivate but propagated with a continuous increase in the anodic current (Figure 4b). Moreover, the stable value of passive current density obtained for the LPBF-UT and for one specimen of the LPBF-HT alloy was about 1 μA/cm2 which was two orders of magnitude higher than the values obtained at +200 mV vs. SCE. The results of the potentiostatic tests are summarized in Table IV and from these results it is evident that the LPBF Alloy 625 had a similar, if not higher, corrosion resistance than the HW alloy. None of the alloys displayed pitting initiation during the electrochemical tests, although in some cases crevice was observed; this is consistent with what is reported in the literature in chloride containing solutions on Alloy 625.43,46,47
Table IV. Summary of the types of corrosion observed following the potentiostatic tests for LPBF and HW Alloy 625.
| E = +200 mV vs. SCE | E = +500 mV vs. SCE | |||||
|---|---|---|---|---|---|---|
| Sample | Test 1 | Test 2 | Test 3 | Test 1 | Test 2 | Test 3 |
| HW-HT | Crevice | No attack | Crevice | Crevice | No attack | Crevice |
| LPBF-UT | No attack | No attack | - | Crevice + repassivation | No attack | - |
| LPBF-HT | No attack | No attack | Crevice | Crevice + repassivation | Crevice | |
The mass loss as a function of test temperature after the immersion tests is reported in Figure 5 and it was used to evaluate the CCT: according to ASTM G48, CCT is defined as the temperature above which the mass loss is greater than 0.0001 g/cm2. The HW-HT specimens showed the worst corrosion behavior with a critical crevice temperature equal to 25°C. The LPBF-UT had the same critical temperature, although it underwent lower loss. Conversely, the LPBF-HT specimens had a CCT equal to 30°C. Whilst it could be argued that a difference of 5°C in CCT is not statistically relevant, the mass loss as a function of temperature reported in Figure 5 provides a more comprehensive description of the crevice susceptibility of these samples. It is also worth noting that at 40°C, which is the same temperature used for the potentiostatic and potentiodynamic tests, the most corrosion resistant specimens were LPBF-UT ones, whilst the HW-HT specimens had the worst behavior with a mass loss five times greater than the LPBF specimens. Moreover, whilst CCT results appears to contradict the result from the potentiodynamic tests, they are in perfect agreement with the potentiostatic result.
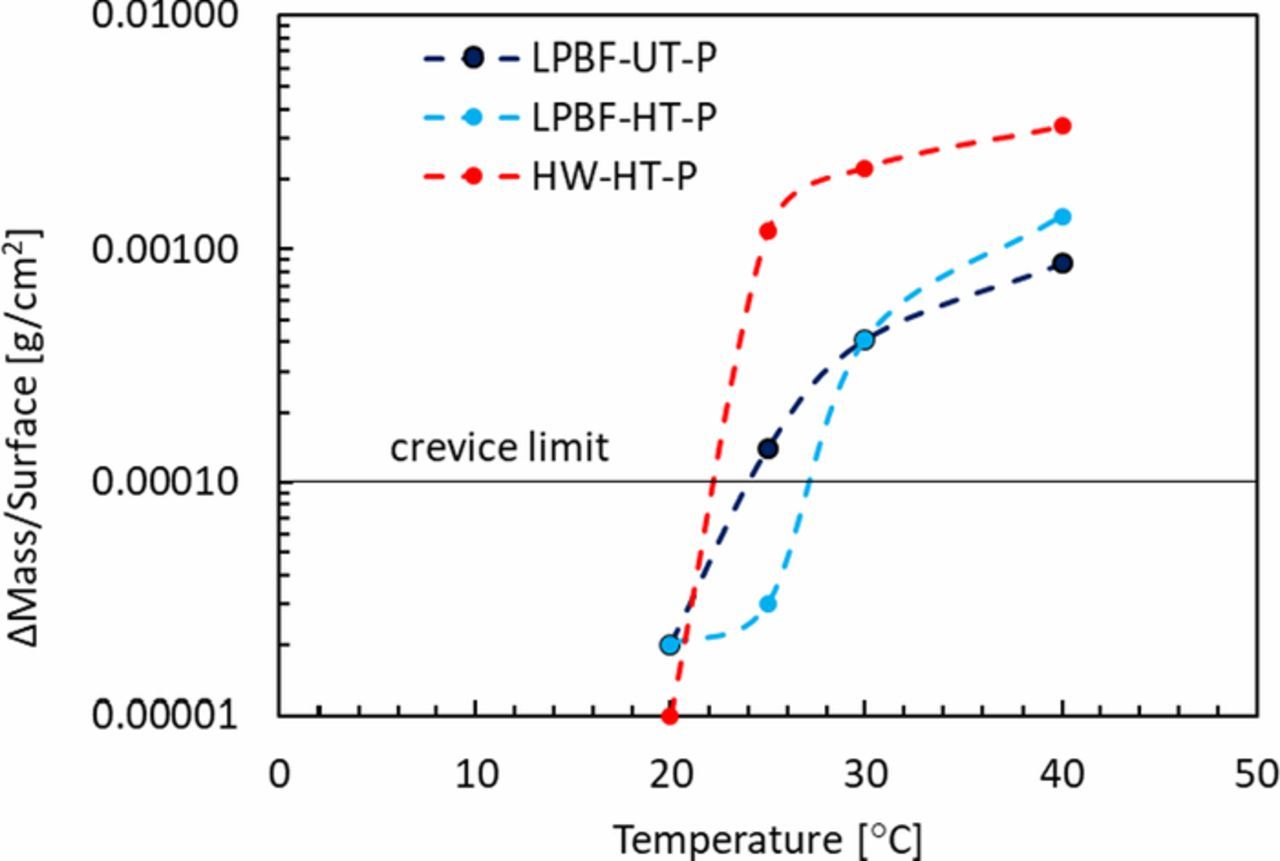
Figure 5. Mass loss a function of time according to the ASTM G48 used to calculate the critical crevice temperature.
Effect of microstructure
The difference in the corrosion behavior of all samples can be correlated with their microstructure. In fact, the HW-HT specimens had equiaxed grains, with average dimension equal to 20 μm (Figure 6a), with second phase precipitates along the grain boundaries. The EDS analysis of these precipitates highlighted the presence of niobium and molybdenum in the micro-precipitate at the grain boundaries which is consistent with the presence of carbides and Ni3Nb second phases at the grain boundaries. Titanium (black zone in Figure 7) and niobium (grey zone in Figure 7) second phases, probably Nb,Ti mixed carbides, were also identified.
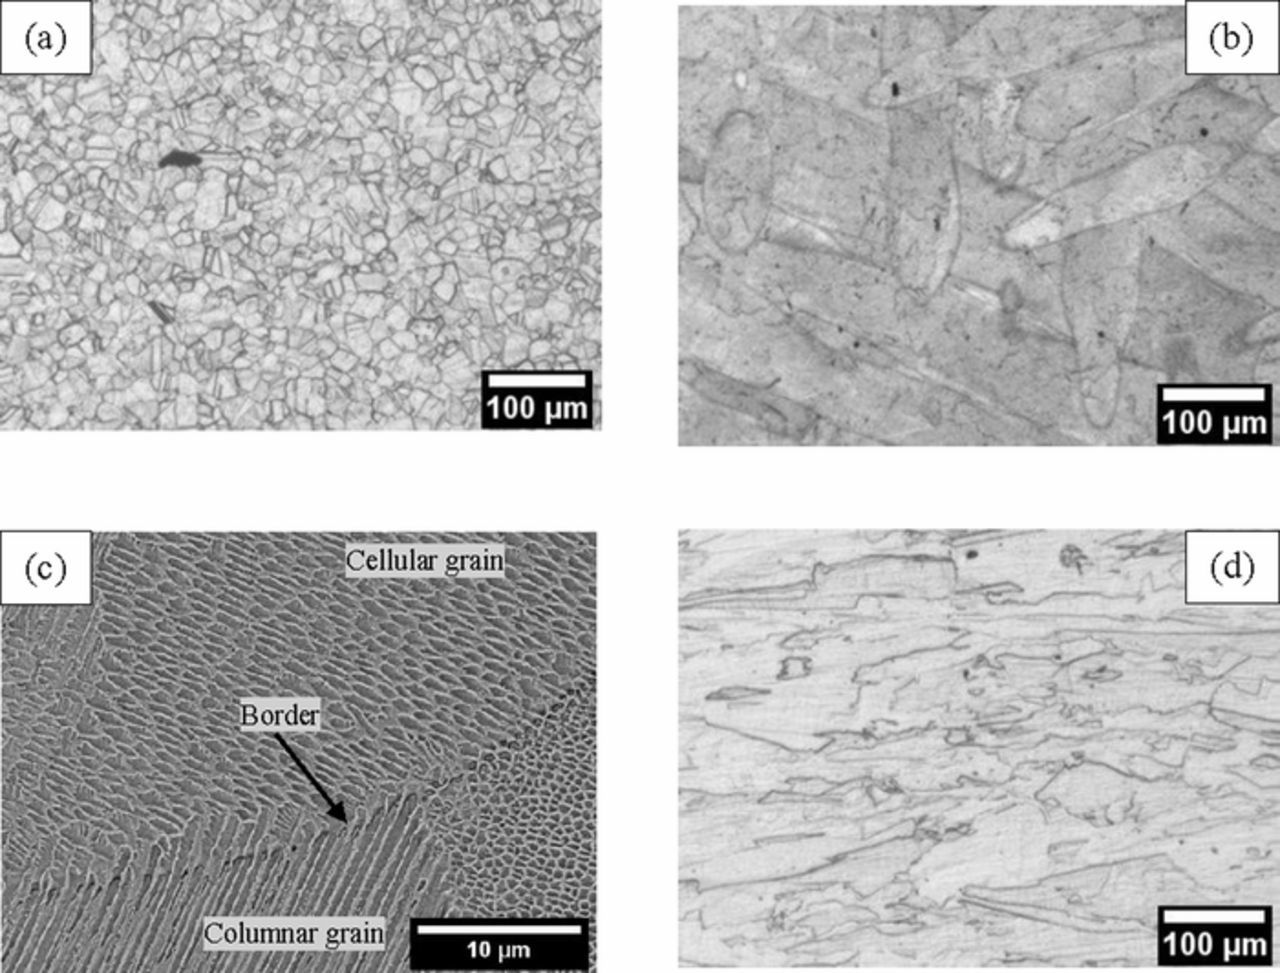
Figure 6. Secondary electron SEM images for (a) HW-HT specimen, (b) LPBF-UT specimen and (c) higher magnification of LPBF-UT at the border of melt pool indicated by the arrow, and (d) LPBF-HT specimens after metallographic etching.
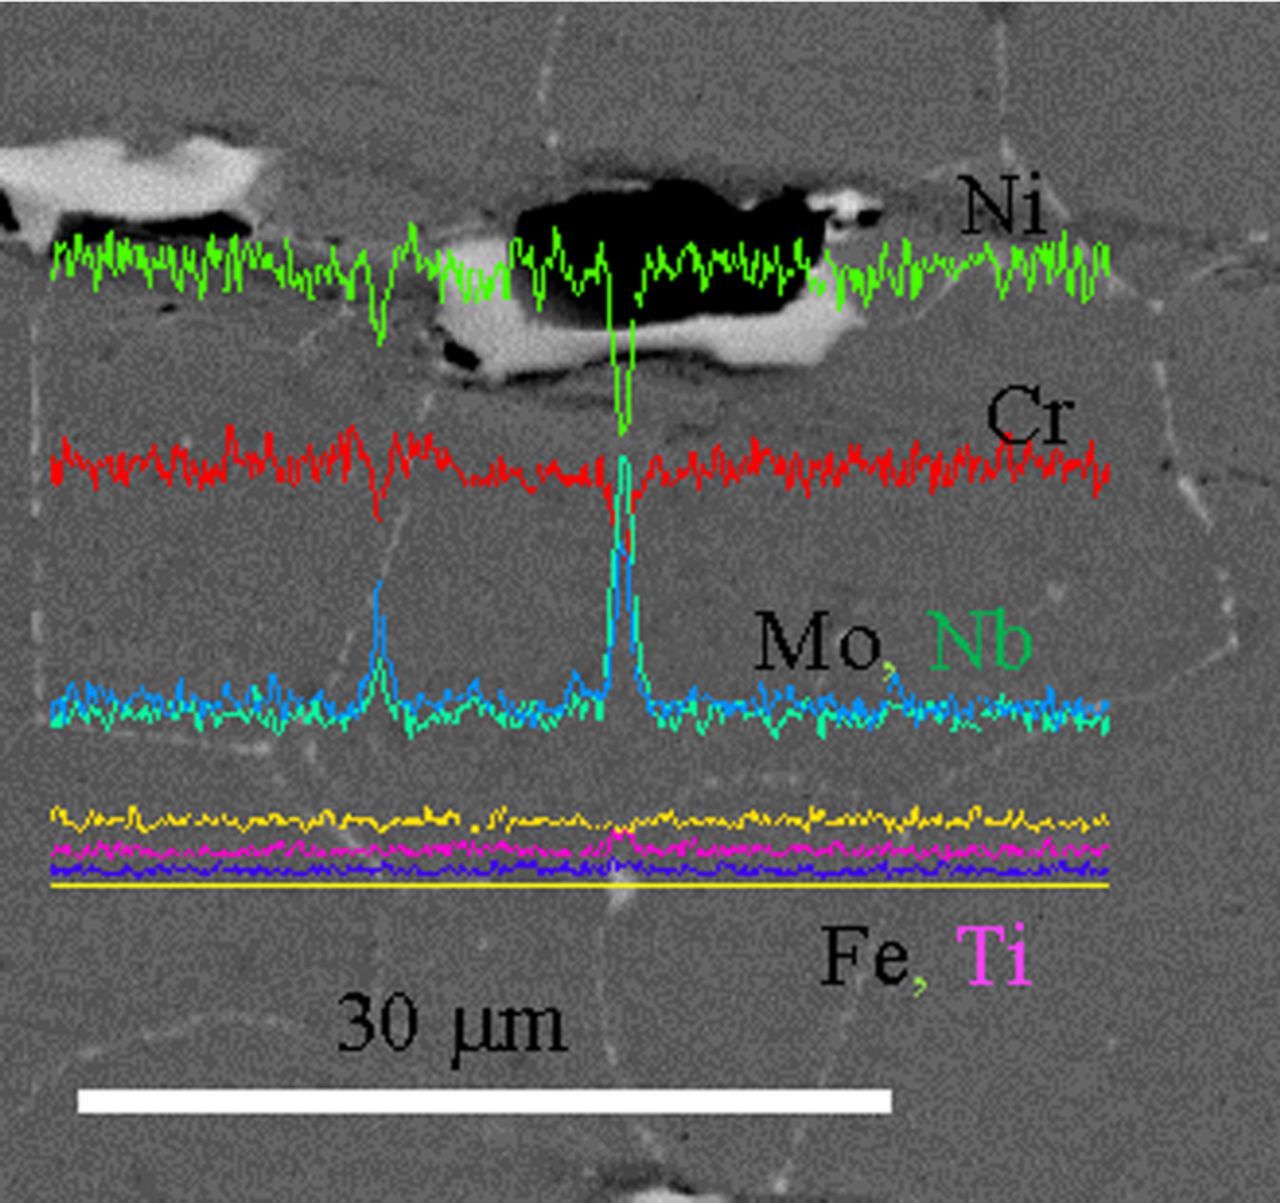
Figure 7. EDS line scan on second phase precipitates of HW-HT specimen.
The samples obtained by LPBF had very different macrostructures and microstructures compared with those specimens produced via conventional melting and hot working.12,48,49 In fact, the tracks of the laser during the manufacturing of the sample formed small melt pools which rapidly solidified (Figure 6b), thus leading to a microstructure with a unique and very directional features which are far from equilibrium.16 Cellular and columnar grains of austenitic matrix phase γ, with γ'-[Ni3TiAl], γ''-[Ni3Nb] and δ [Ni3Nb] phases, as well as dendrite formations can be found in the melt pool, while coarser cellular structures were observed in the border of the melt pool (Figure 6c).50–52 Previous work by some of the present authors40 provided evidence of the presence of nanometric sized Nb-rich MC carbides in the interdendritic regions inside the melt pool. In fact, the melt pool contours may present a high concentration of highly segregated elements (such as Nb and Mo) or the precipitation of second phases such as the intermetallic phases γ"-[Ni3Nb]. Since these phases have different chemical compositions, they are also expected to have a different electrochemical activity, thus explaining the different susceptibility to localized corrosion.
The heat treatment at 980°C of the LPBF specimens homogenized the microstructure, and the melt pools which were no longer detected, as well as macro precipitates of Nb and Mo (Figure 9d). Furthermore, the dendritic structures were not fully re-crystallized and the LPBF-HT had columnar grains which were aligned along the building direction. The morphology inside the crevice of the HW-HT specimens evidenced the austenitic grains and the preferential corrosion of the niobium rich precipitates on their borders (Figures 8a and 8b), which are likely to selectively dissolve due to their lower chromium content compared to the surrounding matrix.2 Conversely, the corrosion attack observed on the LPBF-UT after the potentiostatic tests at +500 mV vs. SCE took place preferentially along the edge of the melt pools (Figures 9a and 9b). It is therefore postulated that once this attack dissolved the active zones at the edge of the melt pool, the localized corrosion ceased and the current density decreases until it reached the value typical of a passive state (Figure 4b). Finally, LPBF-HT specimens showed an intermediate microstructure: the re-crystallized equiaxed grains showed a morphology of corrosion similar to HW-HT, but the absence of macro precipitates did not promote the occurrence of selective attack (Figures 10a and 10b). Ongoing research by the present authors is investigating the morphology of corrosion and the role of second phases on the intergranular attack, as a function of the heat treatment.
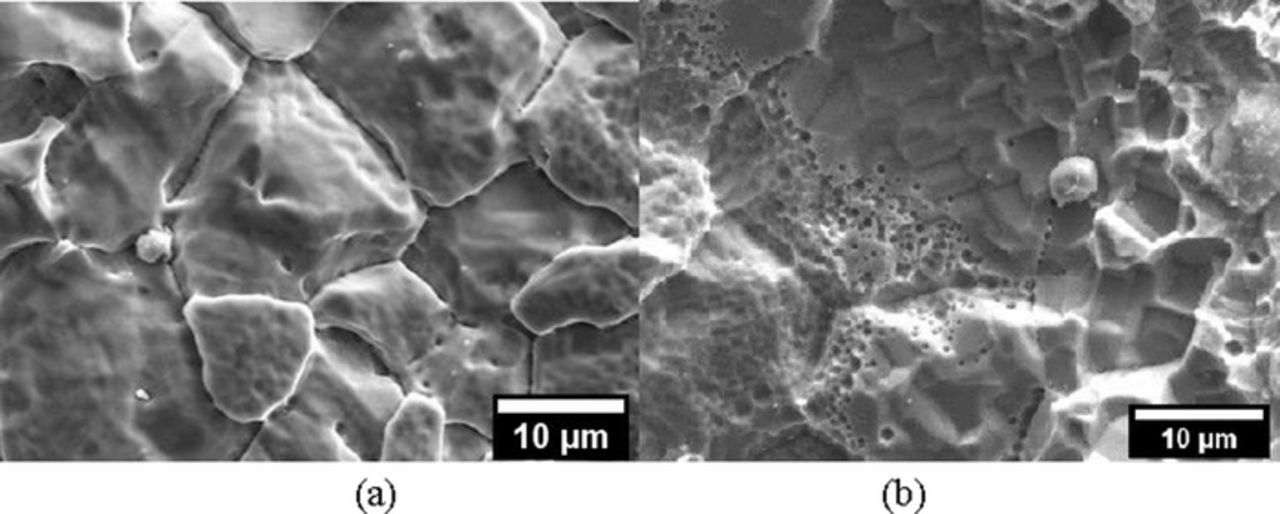
Figure 8. Secondary electron SEM images of the corrosion morphology inside the crevice of a HW-HT specimen after the potentiostatic tests in NaCl 0.6 M solution at a) E = +200 mV vs. SCE; b) + 500 mV vs. SCE.
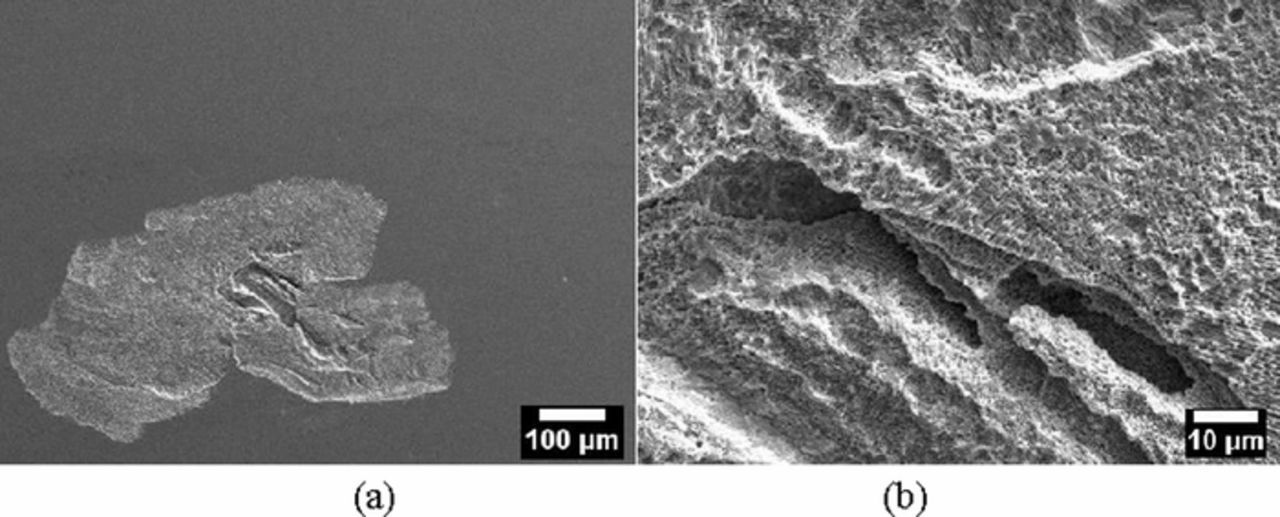
Figure 9. (a) Secondary electron SEM images of the morphology of corrosion inside a shallow attack of a LPBF-UT-P specimen after the potentiostatic tests in NaCl 0.6 M solution at + 500 mV vs. SCE; (b) close-up at higher magnifications.
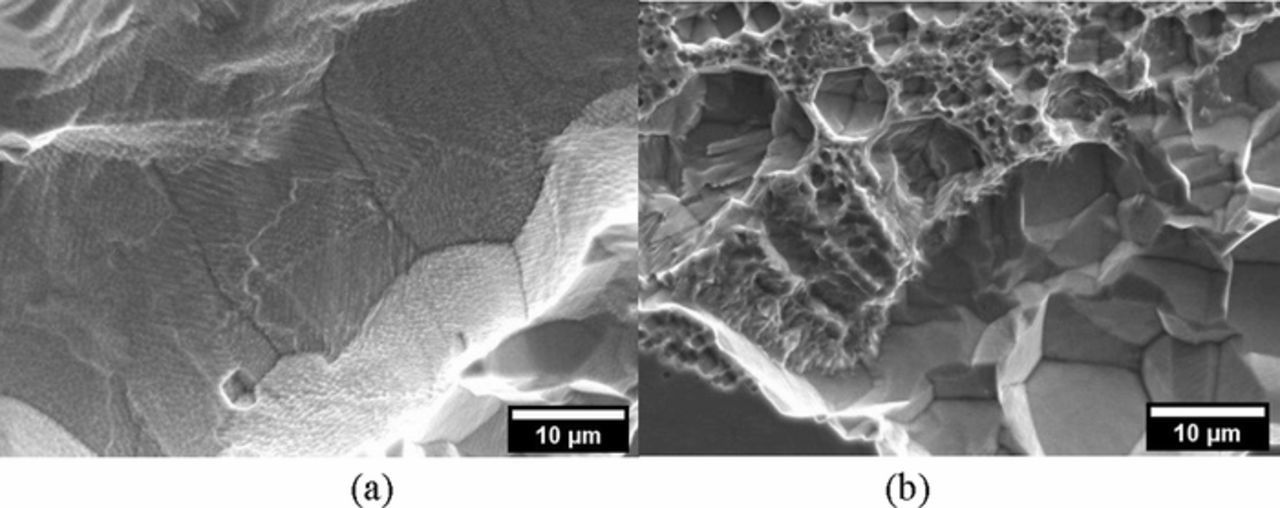
Figure 10. Secondary electron SEM images of the morphology inside the crevice of a LPBF-HT-P specimen after the potentiostatic tests in NaCl 0.6 M solution at + 500 mV vs. SCE; (a) intergranular attack in a zone fully re-crystalized of the specimen and (b) mixed morphology in a zone of the same specimen not fully re-crystalized.
To the knowledge of the authors, in literature there is no data on the corrosion behavior of the Alloy 625 obtained by additive manufacturing technique. For this reason, the results in this paper were compared with techniques such as, laser wire cladding and laser surface melting (LSM), that lead to columnar dendritic γ-Ni (FCC) microstructure with Mo and Nb rich interdendritic precipitates. Laser cladding Alloy 625 wire shows a corrosion performance very close to that of wrought Alloy 625.53,54 The LSM is also a well consolidated technique to improve the corrosion resistance of metallic alloys as a result of homogenization/refinement of microstructure, dissolution/redistribution of precipitates or inclusions, extended solubility and phase transformation.55 For instance, McCafferty and Moore demonstrated the beneficial effect of laser melting which was ascribed to the removal or redistribution of sulphur inclusions and re-homogenization of grain boundary Cr depletion in sensitized stainless steels;56 similar results were observed aluminum alloys.55 Conversely, other authors reported a decrease in the corrosion resistance of Alloy 625 due to several microstructural changes caused by laser processing. In fact, segregation, however fine, from re-solidification of the laser melted surface is a cause of corrosion.57 This explains why at the edge of the melt pool, where re-heat and re-melt occurred and Mo and Nb or Laves phases can be precipitated/segregated,58–60 underwent preferential attack (Figure 11).
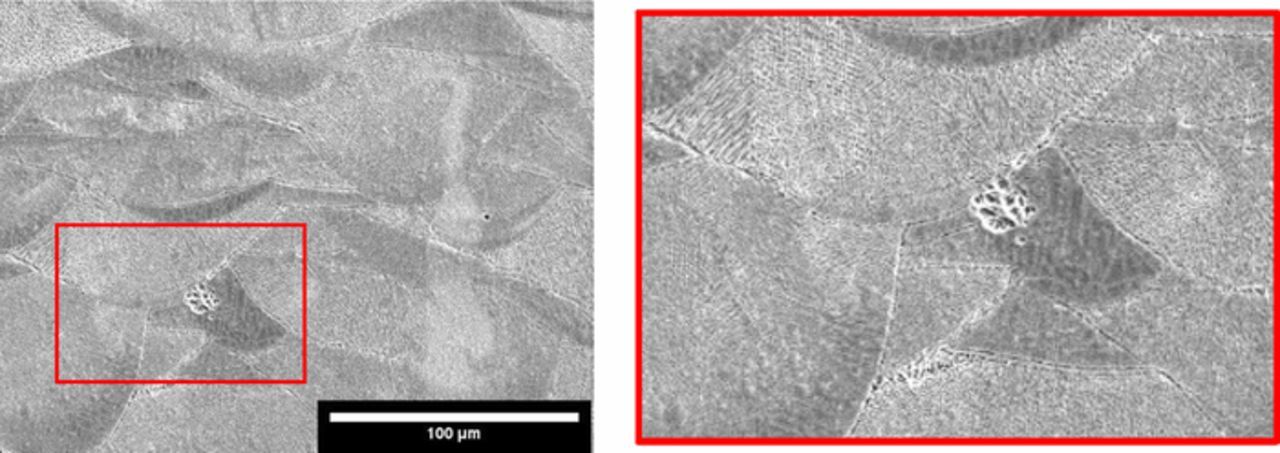
Figure 11. Secondary electron SEM image of the LPBF-UT-P specimen after the potentiodynamic test in 0.6 M NaCl at 40°C showing the slight preferential attack at the border of the melt pool.
Effect of as-built surface on crevice corrosion
The effect of the surface was also studied via potentiodynamic tests in 0.6 M NaCl at pH 7 on specimens with a rough surface. The values of Ecorr (Figure 12) had a relatively high scatter that prevented a meaningful comparison of the different samples. The potentiodynamic curves of LPBF-UT and LPBF-HT specimens with as-built surface (AB) showed numerous spikes of current and the crevice potential was slightly lower than that for the specimens with a polished surface (Figures 13a and 13b). The transpassive and crevice potentials shown in Figure 14 highlighted that the passive film on the AB specimens was less protective than the one formed on the polished samples. Moreover, the AB surface conditions lead to a slightly higher passive current density than for polished ones (Figure 15) due to the high roughness. The improved crevice resistance of polished surface is not unexpected61 and it can be explained considering that the oxide film that formed at high temperatures during process was removed. In fact, it is well known that the oxide tarnish that develops in the heat affected zones during welding decreases the localized corrosion resistance of stainless steels62 due to the depletion of Cr in the matrix underneath the film. Consequently, the removal of this oxide promotes the formation of a more protective passive film. The improved localized corrosion resistance is also associated with the decrease of the surface roughness, the decrease in the sites more prone to local attack such as occluded regions, as well as the promotion of a less defective passive film.63 However, a more exhaustive characterization of the passive film on these specimens is subject of future research.
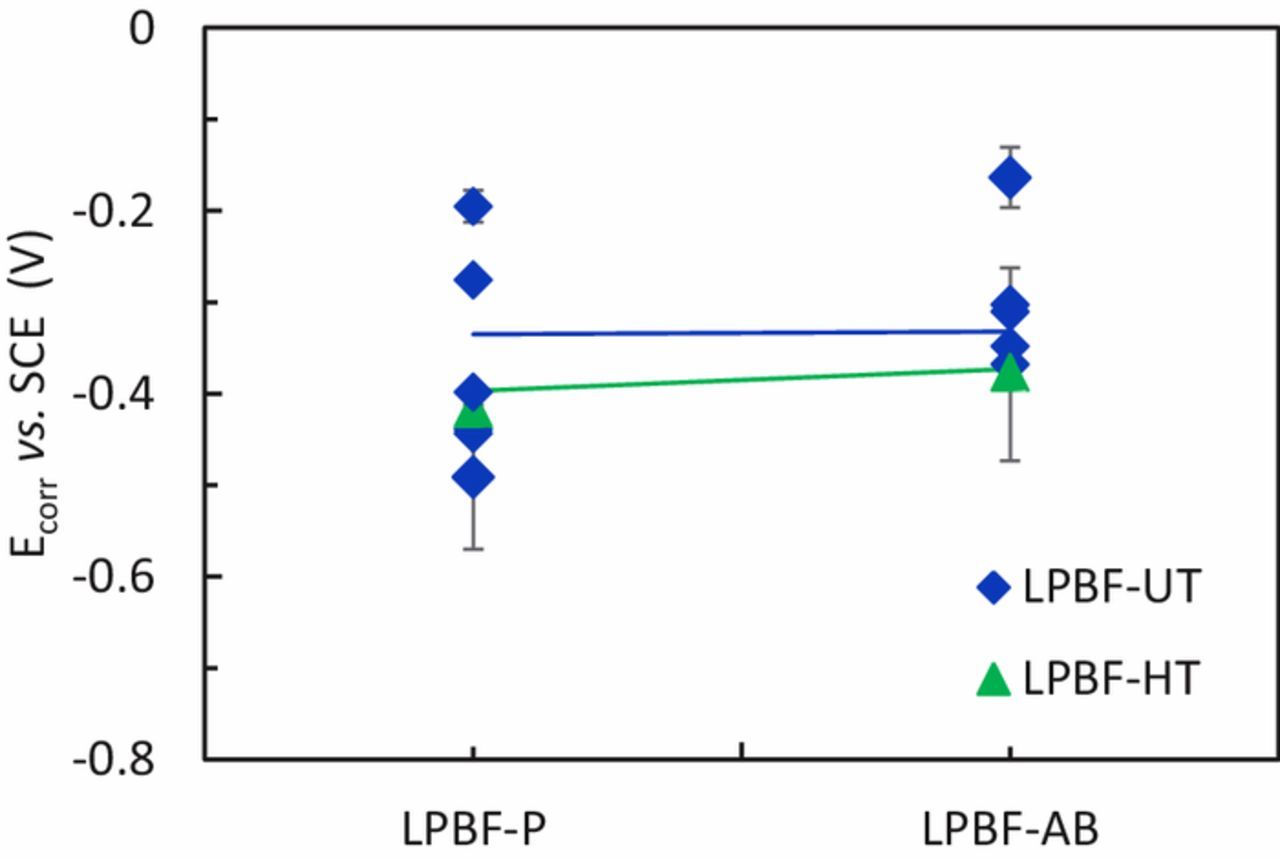
Figure 12. OCP of the LPBF specimens immersed in NaCl 0.6 M solution at pH 7 for polished (P) or as-built (AB) surfaces.
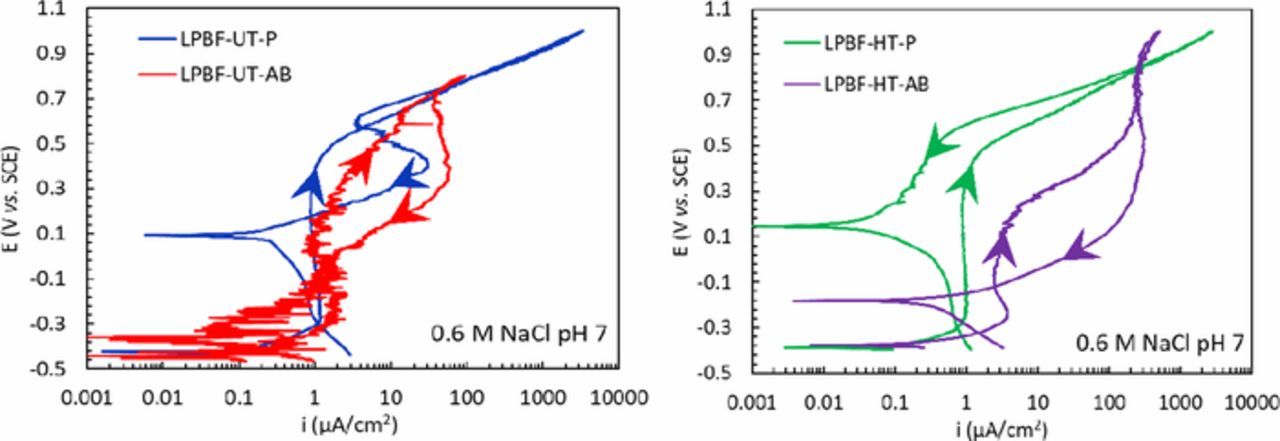
Figure 13. Potentiodynamic curves (a) of the LPBF-UT specimens and (b) LPBF-HT specimens, with polished (P) or as-built (AB) surfaces, in NaCl 0.6 M solution.
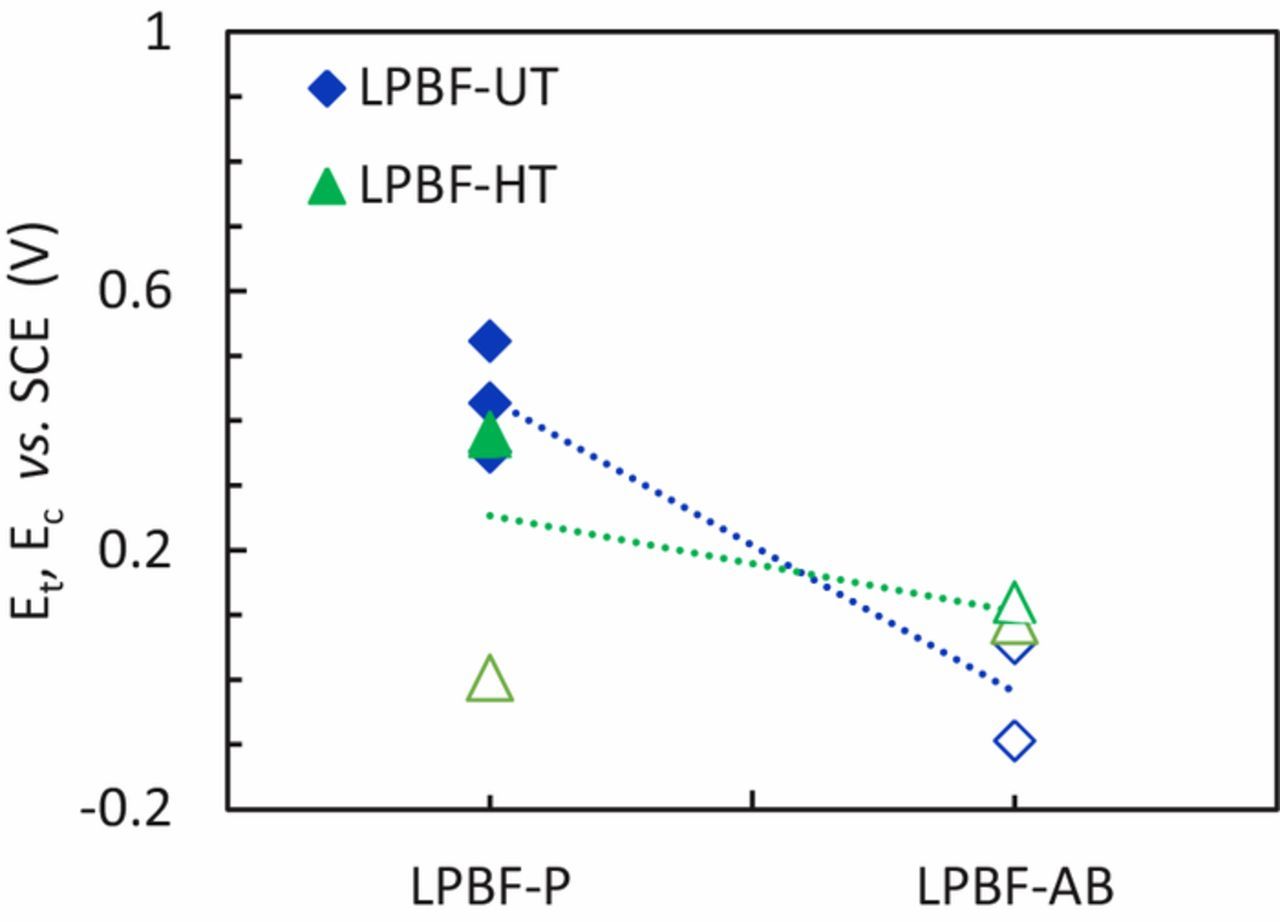
Figure 14. Transpassive potentials (Et) (full symbols) and crevice potential (Ec) (empty symbols) for LPBF specimens with polished (P) and as-built (AB) surfaces.
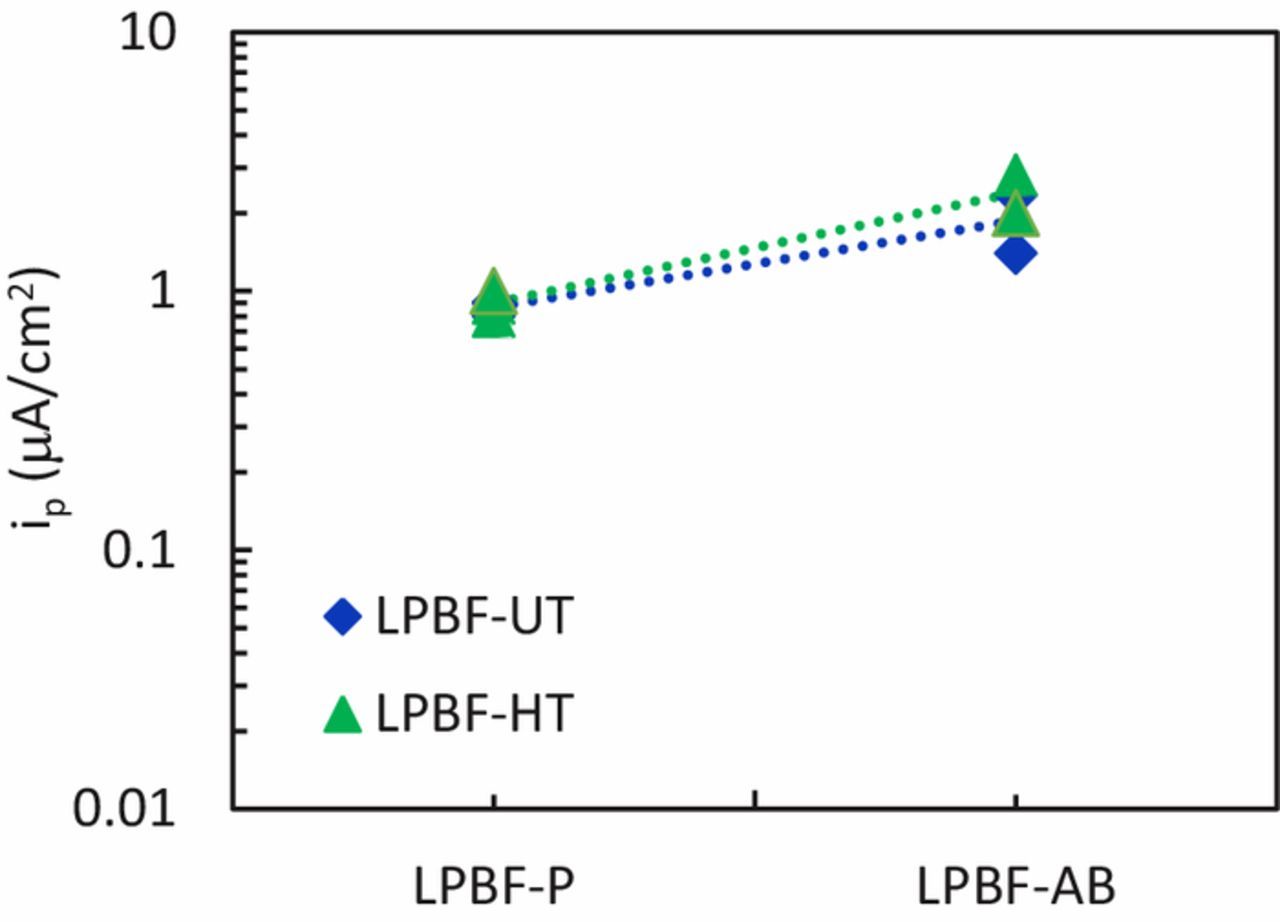
Figure 15. Passive current density (average value in the passive range of potential) for LPBF specimens with polished (P) or as-built (AB) surfaces.
Conclusions
The corrosion behavior Alloy 625 produced either via LPBF or via a conventional route was compared and the effect of annealing treatment on each manufacturing processes was also investigated. The results can be summarized as follow:
- ‐ The potentiodynamic tests did not show pitting initiation in any of the test solutions although crevice attack was sometimes observed in NaCl solution at neutral pH.
- ‐ The potentiostatic tests showed evidence of possible crevice corrosion in neutral 0.6 M NaCl solution at 40°C, mainly when the sample was polarized at high anodic potential (+500 mV vs. SCE).
- ‐ LPBF-UT specimens showed a high resistance to crevice corrosion during the potentiostatic tests, and the heat treatment on this specimen did not significantly change the corrosion resistance. The HW-HT showed the worst crevice corrosion resistance, as confirmed by the critical crevice temperature tests, and these results are related with the different microstructures.
- ‐ The LPBF specimens with as built surfaces, showed lower corrosion resistance compared with the polished ones.
- ‐ The higher resistance to crevice corrosion of the LPBF can be related to its very fine microstructure and different distribution of second phases that are small and homogeneously distributed. Further work will focus on the role of microstructure and heat treatment on the corrosion resistance.
Acknowledgments
The work was realized with the contribution and the Collaboration Agreement of INSTM and the Lombardy Region signed on 24th September 2015. FS would also like to acknowledge the financial support of the New Nuclear Manufacturing (NNUMAN grant EP/JO21172/1) program sponsored by EPSRC. All the data discussed are directly presented in the paper and therefore they are immediately accessible.