
Abstract
The thermal runaway of 20 Ah and 24 Ah LiFePO4 batteries under different stage of charge conditions is tested using the combustion chamber. Surface temperature, mass loss rate, flame temperature and flame height are analyzed in detail during thermal runaway. The temperature at the center of the battery surface and the negative electrode is relatively high. Thermal runaway can be divided into two phases when the battery is heated continuously. The temperature increases sharply in the second phase of thermal runaway, which presents a high risk. The rising rate of temperature and the maximum surface temperature increase with increasing state of charge and battery capacity. The mass loss rate is the largest for the batteries with high capacity and high stage of charge. The flame temperature at 50mm above the top of the battery is the highest, which can be up to 950°C. The maximum flame temperature is mainly affected by the battery capacity, regardless of the state of charge. The maximum flame height and maximum liftoff height of the jet flame can reach up to 90 cm and 14 cm, respectively. The battery capacity and state of charge have little effect on the flame height and the liftoff height. The state of charge is found to play an important role in the formation of jet flames and five cycles of jet flame can occur in the 100% state of charge. The research of temperature and flame characteristics can provide a theoretical basis for improving the safety of LiFePO4 batteries.
Export citation and abstract BibTeX RIS
Lithium-ion batteries have advantages such as high quality and volumetric energy density, high discharge rate, long cycle life, no memory effect, etc., which make them widely used in portable electronic devices, electric vehicles and other energy storage fields. In recent years, as the increase of the explosion of cell phone batteries and the electric vehicle fire accidents, the safety of lithium-ion batteries has become an important factor restricting its development prospects. It is necessary to improve the safety of lithium-ion batteries in various ways.1,2
When the heat production rate of lithium-ion batteries is greater than the cooling rate, the internal chemical reaction will accumulate a lot of heat to cause thermal runaway. Previous studies have systematically investigated the thermal runaway induced by heating, overcharging, short-circuit, etc. P. Ping et al.3 studied the fire behavior of 50 Ah LiFePO4 batteries through external heating and found that the central surface temperature of the battery, the number of jet flames, and the amount of heat increase as the state of charge (SOC) increases. Thermal runaway occurs when the anode temperature reaches 175–185°C, and the flame temperature measured by the thermocouple at the top 10 cm of the battery is the highest, which is about 1500°C. M.Y. Chen et al.4 showed that the SOC has significant effects on the burning behaviors of 1.3 Ah LiFePO4 batteries, the maximum surface temperature, mass loss rate and the number of jet flames increase with the ascending SOC. However, the ejection time and time gap between first and second ejection decrease with the increase of SOC. Other researchers have studied the combustion characteristics of small capacity LiFePO4 batteries, and analyzed the parameters such as surface temperature and mass loss. But they did not consider the effect of battery capacity on temperature characteristics.5–8 The temperature characteristics of the battery in thermal runaway are related to the composition of the electrolyte and the electrode material closely.9–12 The internal chemical reaction of the battery is very complicated during the thermal runaway. M. Parhizi et al.13 predicted the internal center temperature of a cylindrical battery in thermal runaway based on the battery surface temperature and chemical kinetics parameters. It turned out that the internal center temperature peak is about 400°C higher than the surface temperature peak. In addition, the related literature14,15 also reported the temperature characteristics of the electric vehicle during the combustion process. P.F. Huang et al.16 calculated the flame height and flame width of Li(NixCoyMnz)O2/Li4Ti5O12 batteries, but there is no calculation of the liftoff height, and did not analyze the influence of battery capacity and SOC on jet flame height and liftoff height. Although previous work have conducted on the fire behavior of lithium-ion batteries and concluded that multiple jet flames occur during the combustion process, there is still a blank in the description of jet flame height of LiFePO4 batteries. What's more, the measurement of the battery surface temperature and the mass loss is imprecise due to the radiant of the jet flame and the effect of thermocouples on the battery surface, respectively.
Currently, 20 Ah and 24 Ah LiFePO4 batteries is widely used in the field of electric buses in china because of its high safety and economy. But there is no literature to compare and analyze the differences in thermal runaway between 20 Ah and 24 Ah LiFePO4 batteries. In this paper, the temperature, mass loss rate and flame characteristics in thermal runaway of 20 Ah and 24 Ah LiFePO4 batteries under different SOC conditions were studied based on the combustion chamber. A series of experiments were carried out to investigate the effect of SOC and battery capacity on the temperature, mass loss rate and flame characteristics in thermal runaway. Flame temperature, mass loss and batteries surface temperature were obtained by two experiments, which can ensure the accuracy of measurement parameters. Specific experimental procedures are described in Experimental procedure section. There is lack of detailed analysis of jet flame height in the previous research. This study analyzed the influence of battery capacity and SOC on jet flame height and liftoff height in detail and fill the gap in jet flame height of commercialized LiFePO4 batteries. Finally, some suggestions on how to improve battery safety are put forward based on this work.
Experimental
Samples and apparatus
The commercialized LiFePO4 batteries used in this study are manufactured by Tianjin Lishen Battery Joint-Stock Co. LTD. The nominal capacity of the two batteries is 20 Ah and 24 Ah respectively with the same dimensions, which has a length of 70 mm, a width of 30 mm and a height of 130 mm. The assembly process is basically the same as that of cylindrical batteries. First, the coated positive sheets, negative electrode sheets and the separator are cut to the specified size then stacked into a whole in a certain order. Second, the whole are wound into a group, and the positive and negative electrode lugs are drawn at the same time. The five groups are connected in parallel and put into the battery shell. Finally, the shell is encapsulated after the lugs are welded to the electrode pole, meanwhile, electrolyte is injected into the battery shell. The main component of the electrolyte is a solution of LiPF6 in a mixture of ethylene carbonate (EC) and ethyl methyl carbonate (EMC). Batteries with various SOC are needed in the experiment. According to the relationship between SOC and Open circuit voltage (OCV), the batteries with SOC of 100%, 50% and 0% are respectively obtained by using the battery circulating charge-discharge tester.
Figure 1a presents a schematic diagram of the combustion chamber apparatus. The apparatus is made up of 2 mm width stainless steel plate and 10 mm width flameproof glass, the flameproof glass can be pulled to the left side to ensure that equipment installation and commissioning. In order to better observe the flame shape, put the camera 1500 mm in front of flameproof glass. A 1 kW heater band with a length of 100 mm and a width of 100 mm was used as an external radiant heat source to heat the batteries. The heater was placed at the same height as the battery, at a horizontal distance of 20 mm. When the batteries no longer releases thermal runaway products or the flame is extinguished, turn off the heater. To prevent the instability of the heater band, it needs to be placed on the holder in the apparatus. Electronic balance was placed in the middle of the apparatus to measure the mass loss of the battery. At the same time, a board fireproofing is placed between the electronic balance and the battery to protect the electronic balance. A 220 V electronic igniter was placed 150 mm directly above the battery to ignite the flammable substance that was ejected when thermal runaway occurred. Figure 1b shows schematic diagrams of the thermocouple arrangement. 14 K-type thermocouples with diameter 2 mm were employed to measure the temperature of the battery surface and flame. Among them, 6 thermocouples were located on the surface of battery and 8 thermocouples were placed above the battery.
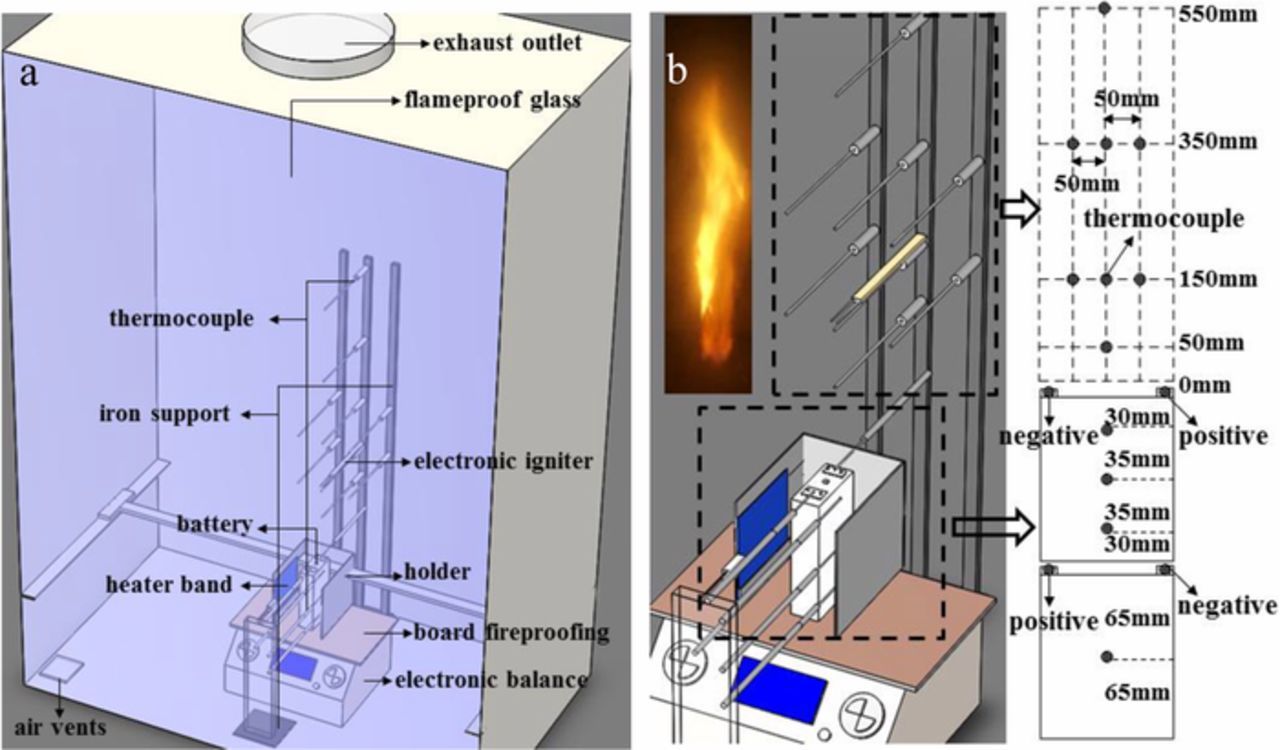
Figure 1. (a) Schematic diagram of combustion chamber. (b) Schematic diagram of thermocouple arrangement.
Experimental procedure
In the experiment, the thermocouple that is paste onto the surface of the battery and the flame above the battery will affect the weight of battery and the temperature of battery surface, respectively. In order to ensure the accuracy of battery surface temperature and the weight of battery, two types of experiments are carried out using the batteries with the same capacity and the same SOC in this study. First of all, when performing the first type of experiment, the electronic balance does not record the mass loss of the battery, and the electronic igniter above the battery is not energized after thermal runaway. Only the temperature data of the battery surface during the thermal runaway process is obtained. Secondly, when conducting the second type of experiment, no thermocouples are arranged on the surface of the battery, only thermocouples for measuring the flame temperature are arranged above the battery to obtain the data of flame temperature. Meanwhile, the electronic balance is turned on to record the mass loss of the battery. The flame shape can be obtained by the camera and the flame height can be acquired by the subsequent calculations processing with MATLAB software. In order to reduce the influence of the battery difference on the experimental results, this paper carried out three repeated experiments when measuring a certain parameter. Therefore, a total of 36 experiments were conducted in this study, as shown in Table I.
Table I. Information of experimental method.
| Type | Capacity (Ah) | SOC (%) | Repeat Times | The measurement parameters |
|---|---|---|---|---|
| No. 1 | 20 | 100 | 3 | Battery surface temperature |
| 50 | 3 | |||
| 0 | 3 | |||
| 24 | 100 | 3 | ||
| 50 | 3 | |||
| 0 | 3 | |||
| No. 2 | 20 | 100 | 3 | Flame temperature and the mass loss |
| 50 | 3 | of battery | ||
| 0 | 3 | |||
| 24 | 100 | 3 | ||
| 50 | 3 | |||
| 0 | 3 |
Results and Discussion
The process of temperature variation
In the experiment, the horizontal distance between the thermocouple at the center of the left surface of the battery and the heater is only 2 cm. The measured temperature data are mainly affected by the radiation of the heater and cannot reflect the battery surface temperature accurately. Therefore, the temperature data at the center of the left surface of the battery is not analyzed. The temperature-time curve of 24 Ah battery with 100% SOC is displayed in Figure 2a. From the figure we can see that the battery surface temperature experiences six stages during thermal runaway. At the stage a, surface temperature shows a rapid increase due to the radiation of the heater. Compared with stage a, the rising rate of temperature in stage b becomes slower. This is because the endothermic reaction inside the battery is excited and the surface temperature is affected by both the radiation of the heater and the internal chemical reaction. EMC will reach the boiling point at around 110°C and change into vapor state.17,18 When the internal temperature reaches 154°C, LiPF6 will undergo endothermic reaction with EMC and reach the first peak of endothermic at 191°C in stage b.19,20 With the progress of the chemical reaction, the internal pressure of the battery increased sharply which is due to the decomposition of the SEI film and the vaporization of the EMC. These reactions can produce gases such as O2, C2H4, and CO2.21 Around 1100 seconds, the internal pressure caused the battery safety valve rupture and sprayed a small amount of white smoke causing the first phase of thermal runaway to occur.
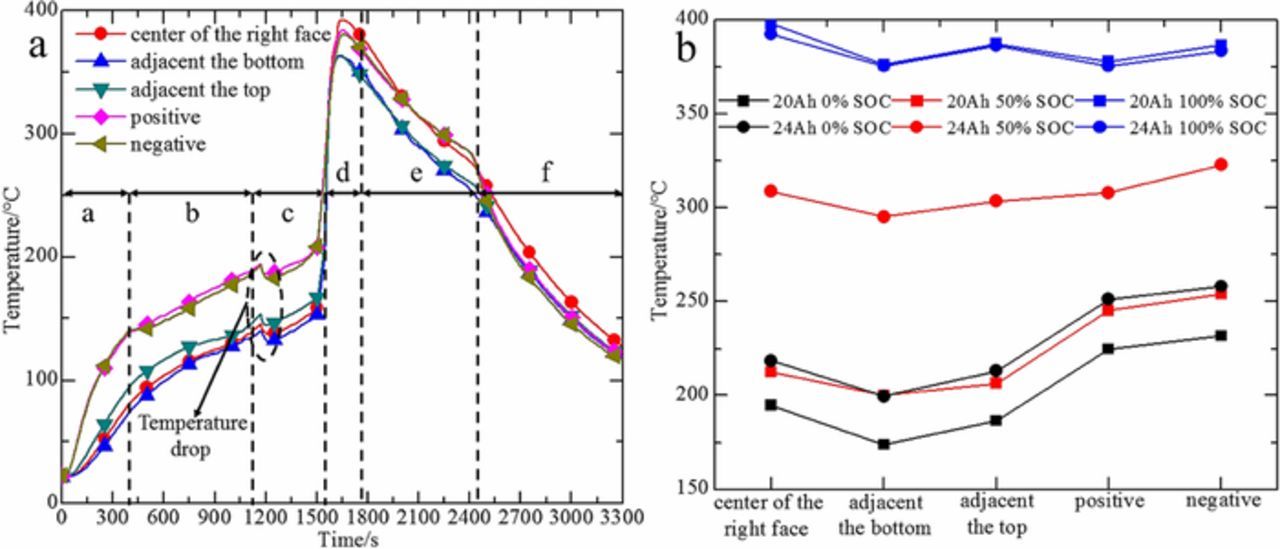
Figure 2. (a) The temperature-time curve of 24 Ah battery with 100% SOC. (b) The average of the maximum temperature at different positions on the battery surface.
Stage c is the transition from the first phase of thermal runaway to the second phase of thermal runaway. After the first phase of thermal runaway occurs, the surface temperature will drop. This is because the high-temperature gaseous products inside the battery are ejected to the outside and the heat accumulated in the battery is lost. With the accumulation of internal heat, the exothermic reaction of EC and LiPF6 occurred at 192°C and reached two exothermic peaks at 212°C and 253.7°C respectively.19,20 In addition, EC will reach its boiling point and become gaseous at 248°C.21,22 At the time of 1500 seconds, the second phase of thermal runaway occurs accompanied by a large amount of white smoke eruption. As the internal temperature increases, EC and fluorinated binders (PVDF) react with lithium (metallic or intercalated) to produce C2H4, CO2, and H2. At the same time, O2 is produced by decomposition of the positive material.3,23–26 The occurrence of severe exothermic reaction and the formation of flammable substances make the second phase of thermal runaway more dangerous, causing the surface temperature rise sharply in stage d.
Compared with the first phase of thermal runaway, the second has a longer duration and greater severity, which causes the electrolyte to be consumed completely in the second phase of thermal runaway. Therefore, after the second phase of thermal runaway, the internal chemical reaction stop and the surface temperature begins to drop rapidly, as shown in stage e. After 10 minutes of continuous temperature decrease, there is no sign of further thermal runaway, so when the time reaches 2400 seconds, stop heating the battery. At the stage f, cooling rate will accelerate without the radiation of the heater.
In order to analyze the battery surface temperature in thermal runaway in a more scientific way, the average value of three repeated experiments is taken to represent the change of the surface temperature. The average of the maximum temperature at different positions on the battery surface acquired from three repeated experiments is shown in Figure 2b. Experimental results show that the temperature at the center of the battery surface and at the negative electrode is relatively high, which is due to the poor heat dissipation condition at the center of the battery surface, and the copper current collector on the negative electrode has a large thermal conductivity coefficient. We may discover from the figure that the surface temperature is affected by both the battery capacity and the SOC. Since the temperature trends at different positions on the battery surface are the same, the effect of the battery capacity and SOC on the surface temperature will be specifically analyzed using the temperature of the right side center and the negative.
Effect of battery capacity on surface temperature
The difference between 20 Ah and 24 Ah LiFePO4 batteries is mainly reflected in electrolyte and electrode material. The mass of the positive material and the electrolyte of commercial LiFePO4 battery account for 25% and 15% of the battery total mass, respectively.3,27 In which the electrode material and electrolyte account for the largest proportion of the mass. Therefore, the heat generation during thermal runaway is mainly due to the chemical reaction of the electrolyte and the electrode material. The internal chemical reaction of lithium-ion batteries is very complex in the process of thermal runaway. Figure 3 summarizes the main chemical reaction of LiFePO4 batteries at different temperature ranges.23–29 The decomposition of electrolyte and the reaction between lithium-intercalated negative electrode (LixC6) and electrolyte accumulate energy for the decomposition of electrode materials.
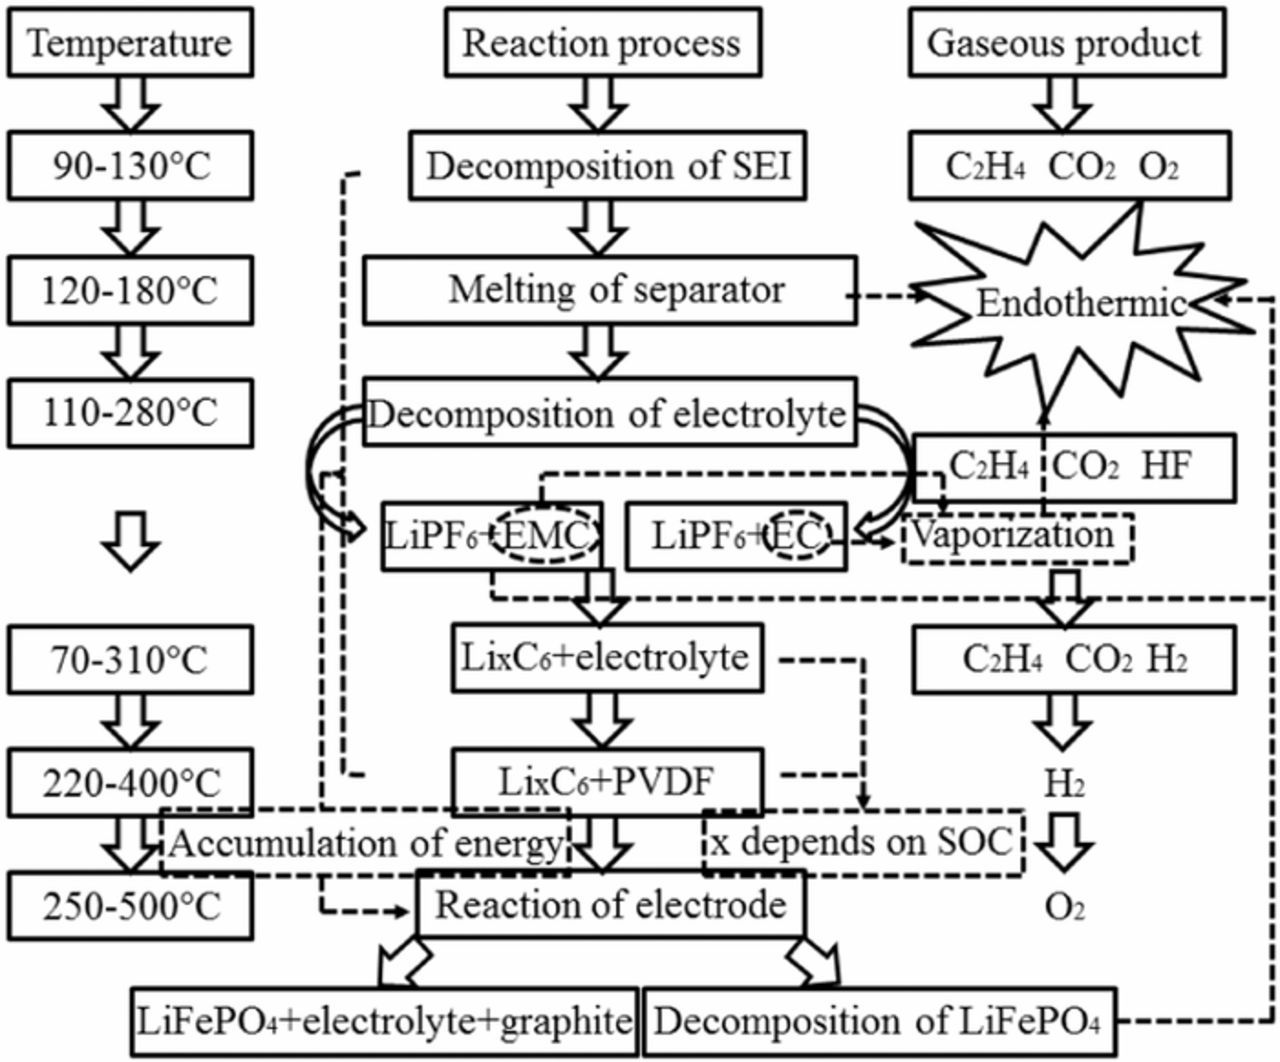
Figure 3. The main chemical reactions of LiFePO4 batteries at different temperature ranges.
Surface temperature curve of 20 Ah and 24 Ah LiFePO4 batteries in three repeated experiments is described in Figure 4. Regardless of the SOC, the moment of first phase of thermal runaway of the 24 Ah LiFePO4 battery is less than the corresponding moment of 20 Ah. This is because 24 Ah battery have more EMC organic solvents, which may produce more gas in the process of vaporization and reaction, resulting in a higher rising rate of internal pressure and more likely to break the battery safety valve. When the SOC is 0%, since the negative temperature range of the battery is 200–250°C after the first phase of thermal runaway, the heat accumulated inside is not enough to stimulate the violent reaction between LixC6 and the electrolyte. The reaction between the electrode materials will not release a large amount of heat, so as not to happen the second phase of thermal runaway. The reaction between EC and LiPF6 in the electrolyte of 24 Ah battery will release more heat, so the surface temperature of 24 Ah battery is higher.
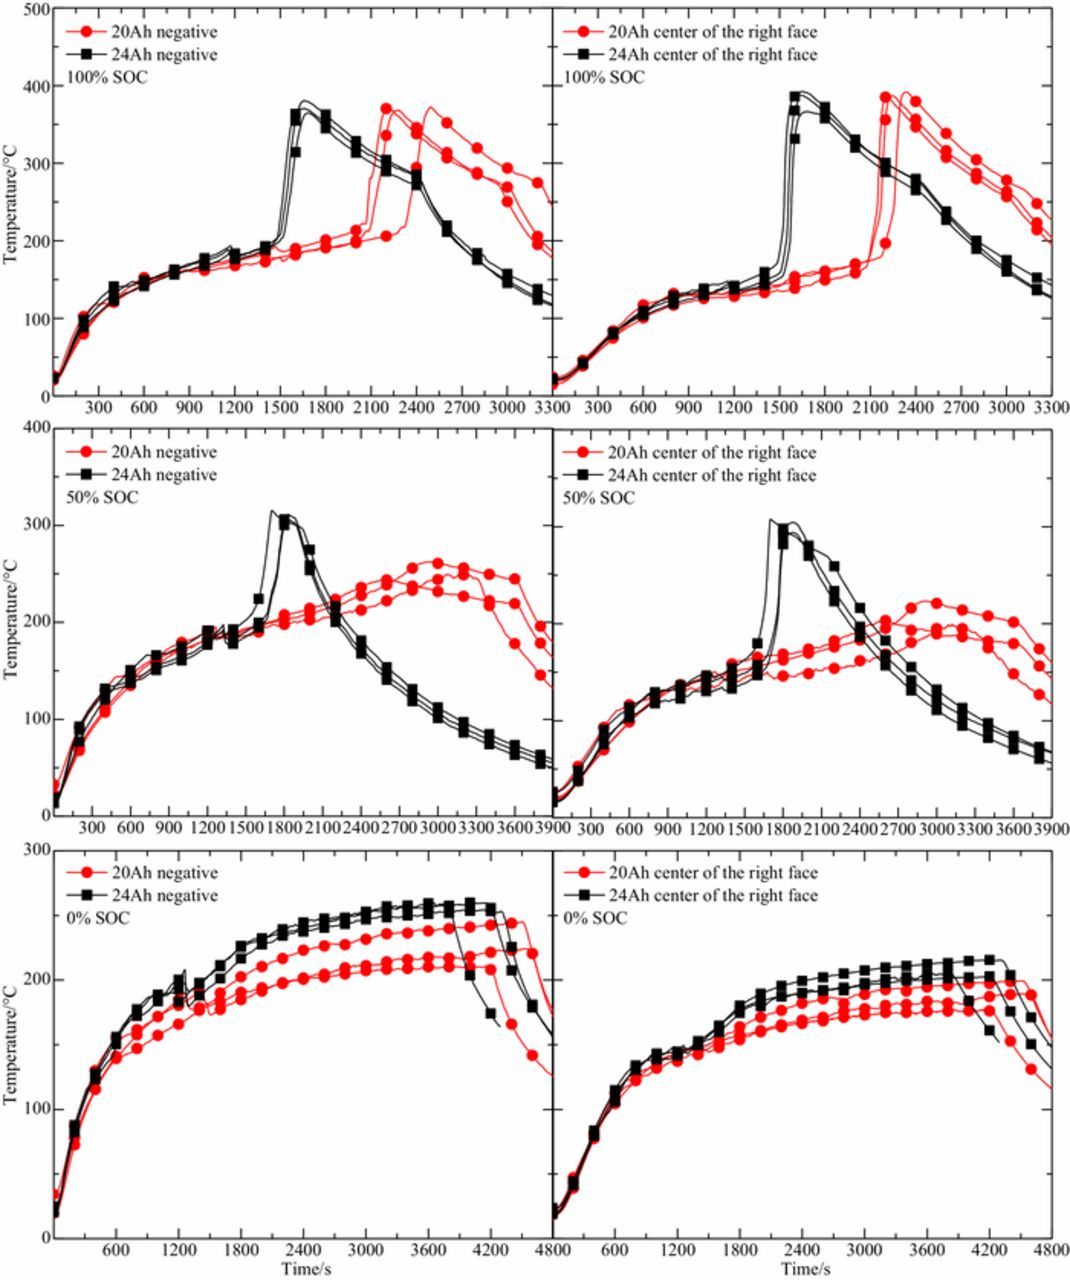
Figure 4. Comparison of surface temperature between 20 Ah and 24 Ah LiFePO4 batteries during thermal runaway in three repeated experiments.
When the SOC is 50%, both capacities of the battery have experienced two phases of thermal runaway, but the second phase of thermal runaway of 24 Ah battery becomes more severe. The time required to reach the second phase of thermal runaway is shorter and the rising rate of temperature is faster, the maximum temperature of the battery surface is higher. Figure 5 shows the mass distribution of commercial LiFePO4 batteries materials. The weight of 24 Ah and 20 Ah LiFePO4 batteries was 550 g and 510 g, respectively. The mass of electrode material and electrolyte of the 24 Ah battery is more than that of the 20 Ah battery. For 24 Ah battery, the amount of electrode materials and electrolyte involved in the reaction is relatively large. After the first phase of thermal runaway occurs, the reaction of the EC and the LiPF6 will going on. As the temperature rises, decomposition of the electrolyte and reaction of the LixC6 with the electrolyte and PVDF will accumulate a large amount of heat, which lead to a violent reaction between the electrode materials and a sharp rise in temperature. For 20 Ah battery, the amount of LixC6 and electrolyte involved in the reaction is relatively small. Compared with the 24 Ah battery, the 20 Ah battery in the 50% SOC state generates less heat inside, which makes the reaction between electrode materials less exothermic and the temperature curve changes smoothly. The above analysis shows that the exothermic reaction between electrode materials and electrolyte is the key to the second phase of thermal runaway. At the same time, decomposition of the electrolyte and reaction of the LixC6 with the electrolyte and PVDF played an important role in the occurrence of the rapid temperature elevation in second phase of thermal runaway. The difference between 50% SOC and 100% SOC is that when the SOC is 100%, the rise of temperature for the second phase of thermal runaway of the two capacity batteries is very high, and the maximum temperature of battery surface is not much different. Heat production from the decomposition of the electrolyte and the reaction between the electrode material and the electrolyte is large in the state of 100% SOC. Therefore, the reaction among electrode materials was more sufficient in 100% SOC battery. The chemical reaction inside the battery during thermal runaway is very complicated. The difference between maximum temperature is related to the reactivity of reactants, and the overall extent of reactions. Since the electrode material and electrolyte of the LiFePO4 battery account for 52% of the total weight, the diaphragm and fluorinated binder account for only 12%, the rest is mainly the battery shell, aluminum foil and copper foil. Therefore, the maximum temperature difference is affected by the reaction between electrode materials and electrolyte, and the decomposition of electrode materials. Compared with the 20 Ah battery, the decomposition of LiFePO4 in the 24 Ah battery absorbs more heat. This may lead to the maximum surface temperature of the two capacity batteries is similar in the state of 100% SOC.
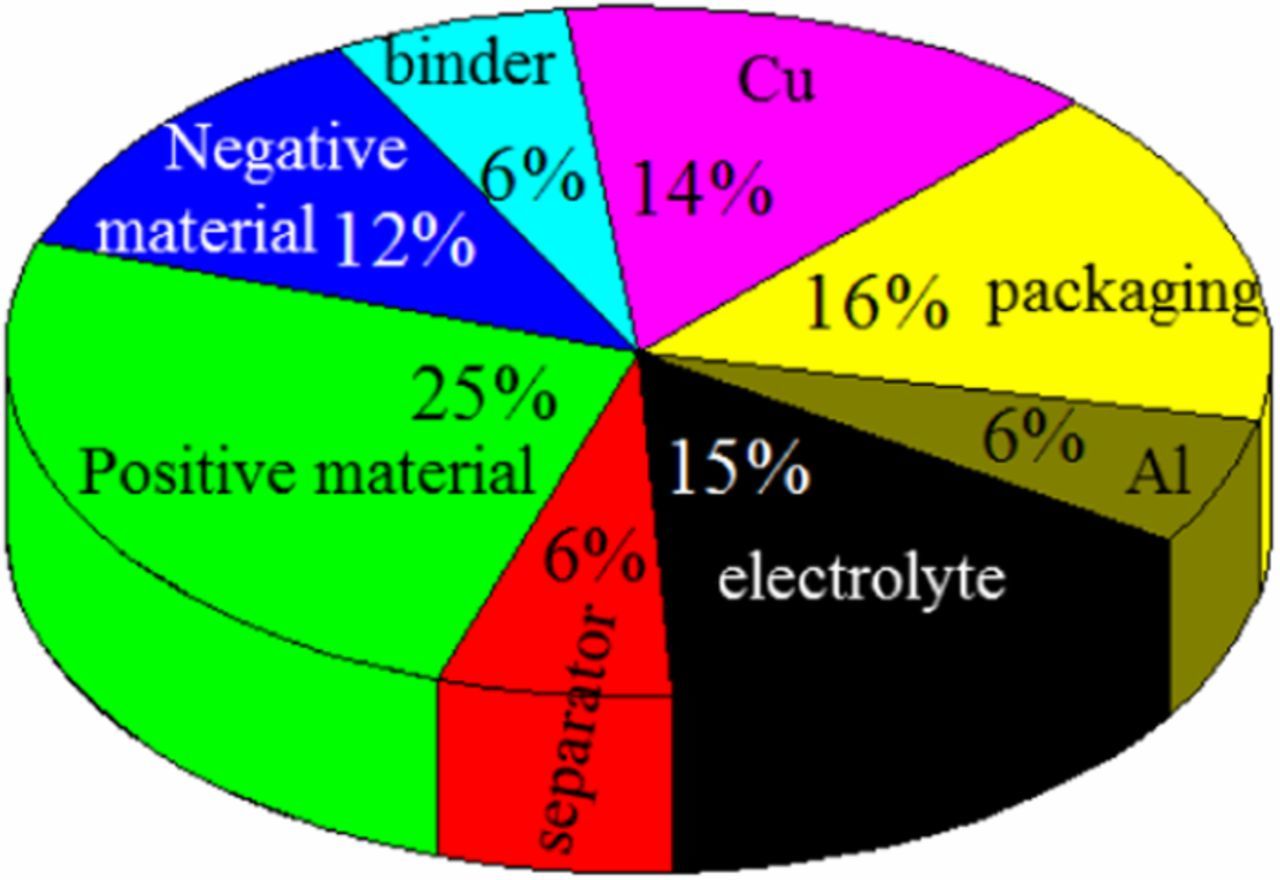
Figure 5. Mass distribution of commercial LiFePO4 batteries materials.
Effect of SOC on surface temperature
The LiFePO4 batteries suffered two phase of thermal runaway in the conditions of 50% SOC and 100% SOC, while only one phase of thermal runaway occurred in the 0% SOC. Figure 6 presents the change in surface temperature during thermal runaway under different SOC conditions for two capacity batteries in three repeated experiments. It can be seen from the figure that the rising rate of temperature and the maximum temperature increase as the SOC increases. The SOC value mainly affects the value of x in LixC6, in other words, the value of x increases as the SOC value increases. Q.S. Wang et al.30,31 founded that with the intercalated lithium increasing, the onset temperature of the LixC6 reaction decreases and the total heat production increases. When the x values are 0.18 and 0.92, the total heat release is 265.3 J/g and 1341.6 J/g respectively. In addition, when the LixC6 reacts with the electrolyte, the total heat release are 1603.8 J/g and 2253.5 J/g when the values of x are 0.19 and 0.92, respectively. With the increase of SOC, the heat released by the reaction between LiFePO4 and electrolyte is also increasing.32 Therefore, the greater the SOC, the more heat is generated in the thermal runaway of the battery, and the higher the maximum surface temperature.
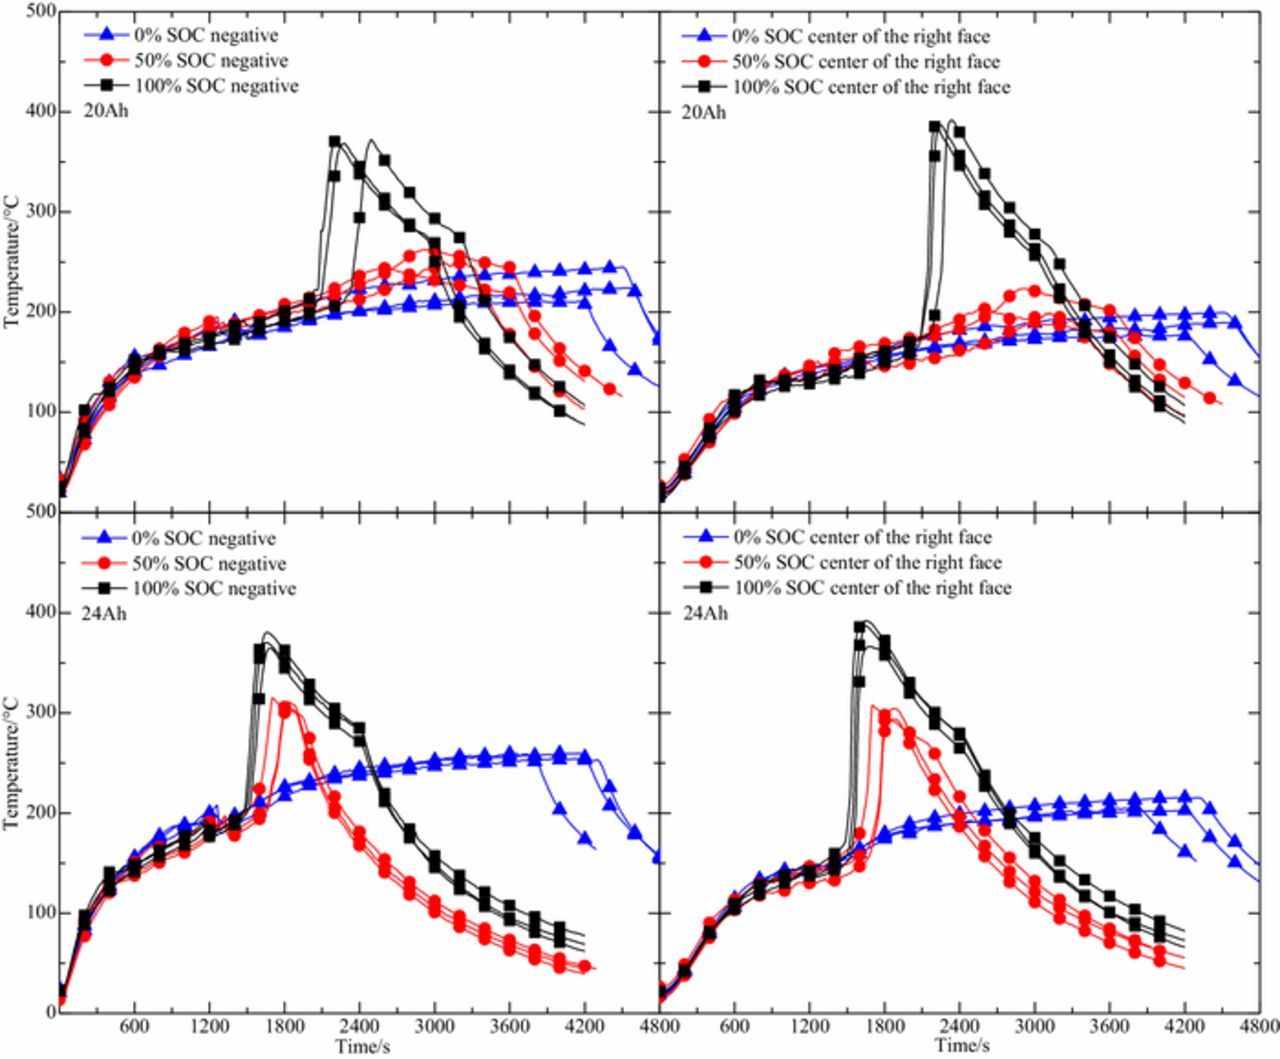
Figure 6. Surface temperature-time curve of two capacity batteries under different SOC condition in three repeated experiments.
Mass loss rate
The trend of mass loss is the same during thermal runaway of two capacity batteries. For batteries with 50% SOC and 100% SOC, the mass loss rate is calculated based on the mass data during the second phase of thermal runaway. The process of mass loss can be divided into five stages. First of all, mass will fluctuate slightly due to the melting of the plastic packaging on the surface of the battery during heating. When the first phase of thermal runaway occurred, the mass data to rise sharply and then fall because of the counterforce that formed by the rupture of the safety valve. In the transition phase, the mass data changes more gently. The mass data decreased rapidly in the second phase of thermal runaway on account of violent chemical reactions inside battery, which consumed a large amount of electrolyte and electrode materials. Finally, the mass data will keep in constant when the reactants are used up.
Table II summarizes the average value data of three repeated experiments for the moment of thermal runaway (T) and corresponding mass loss (Δm). The mass loss rate and mass loss of first phase of thermal runaway increases with the increase of SOC and capacity. On the contrary, the moment of thermal runaway and time of duration (ΔT) decreases with the increase of SOC and capacity. From this, it can be seen that the batteries with large capacity and high SOC state have more severe internal chemical reactions and are more prone to thermal runaway.
Table II. Summary of results related to average value of mass loss data.
| First phase of | Second phase of | ||||||||
|---|---|---|---|---|---|---|---|---|---|
| thermal runaway | Transition phase | thermal runaway | |||||||
| SOC | Capacity (Ah) | T (s) | Δm (g) | Δm (g) | ΔT (s) | T (s) | Δm (g) | ΔT (s) | MLR (g s−1) |
| 100% | 20 | 1282.7 | 33.2 | 17.4 | 495 | 1777.7 | 55.8 | 88.7 | 0.618 |
| 24 | 1166 | 47.6 | 13.1 | 314.3 | 1480.3 | 48 | 68.7 | 0.738 | |
| 50% | 20 | 1352 | 31.5 | 17.7 | 1097.7 | 2416.3 | 34 | 308.7 | 0.114 |
| 24 | 1263.7 | 46.2 | 14.3 | 343.7 | 1540.3 | 35.8 | 109.7 | 0.326 | |
| 0% | 20 | 1386.7 | 31.3 | 43.3 | 2755.3 | No second thermal runaway | 0.014 | ||
| 24 | 1281 | 43.5 | 42.3 | 2774.3 | 0.015 | ||||
Flame phenomenon
The flammable substance ejected is ignited in thermal runaway and forms a continuous burning process. When thermal runaway occurs, a certain pressure will accumulate inside the battery, which cause the reaction product to be ejected to the outside of the battery at a certain flow rate, thereby forming a jet flame phenomenon. Figure 7 reveals the evolution of flame morphology in two capacity batteries under different SOC conditions. The moment of jet flame formation corresponds to the time of thermal runaway. The batteries with 20 Ah 100% SOC and 24 Ah 100% SOC respectively form the first jet flame at 1283 seconds and 1187 seconds. With the release of internal pressure, the flame will develop into a stable combustion state, accompanied by a drop in flame height. After that, the flame showed an increasing trend under the function of internal reaction, and the second jet flame appeared when the second phase of thermal runaway occurred. The more severe the reaction, the faster the flow rate, and the greater the flame liftoff height. The flame liftoff is very obvious at 1785 seconds and 1518 seconds for the batteries with 100% SOC. Both capacity batteries of 100% SOC can form 5 times of jet flame during the thermal runaway, and it takes a shorter time for a large capacity battery to evolve into jet flame. Finally, the jet flame will develop into a turbulent flame that burns steadily until it is extinguished. The flow rate of jet flame formed during the second phase of thermal runaway in the state of 50% SOC is slower than that of 100% SOC. The phenomenon of flame liftoff is not obvious in the state of 50% SOC. The combustion of the second jet flame formed by the battery of 24 Ah 50% SOC is more intense compared with the battery of 20 Ah 50% SOC. The battery in the state of 0% SOC only formed one jet flame.
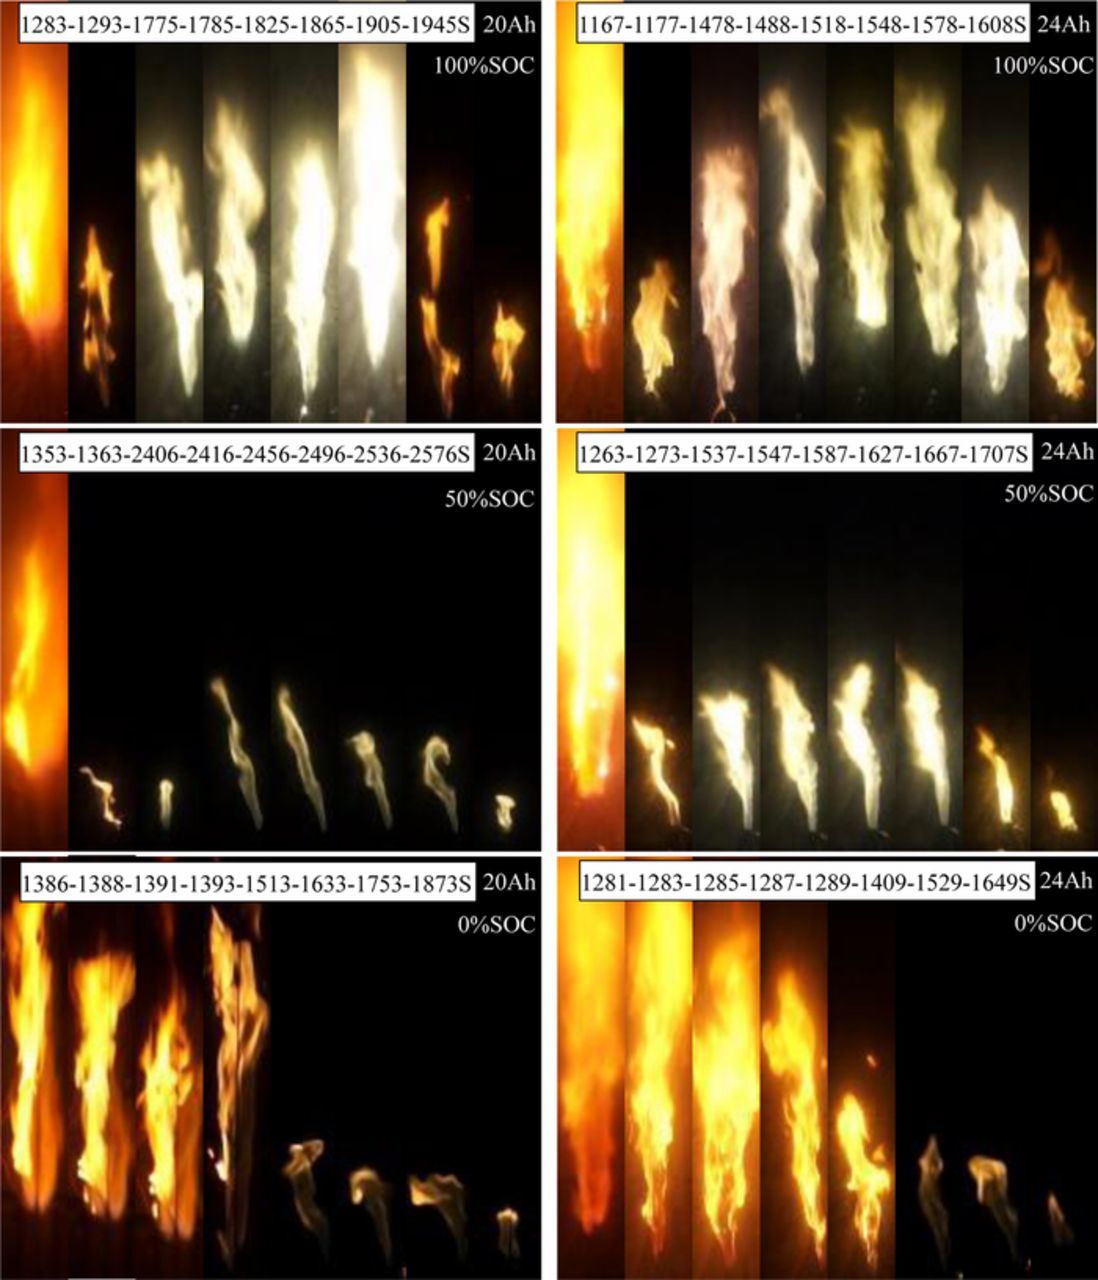
Figure 7. Flame morphology evolution process of two capacity batteries.
Flame temperature
Figure 8a shows the curve of flame temperature of 24 Ah 100% SOC battery in thermal runaway. It's very clear that the flame temperature is highest at 50 mm above battery top. The trends of flame temperature are consistent in different capacities and SOC. The maximum flame temperature of two capacity batteries in different SOC states are shown in Figure 8b. It can be seen from the picture that SOC has little effect on the maximum flame temperature, and the maximum flame temperature increases with the increase of battery capacity.
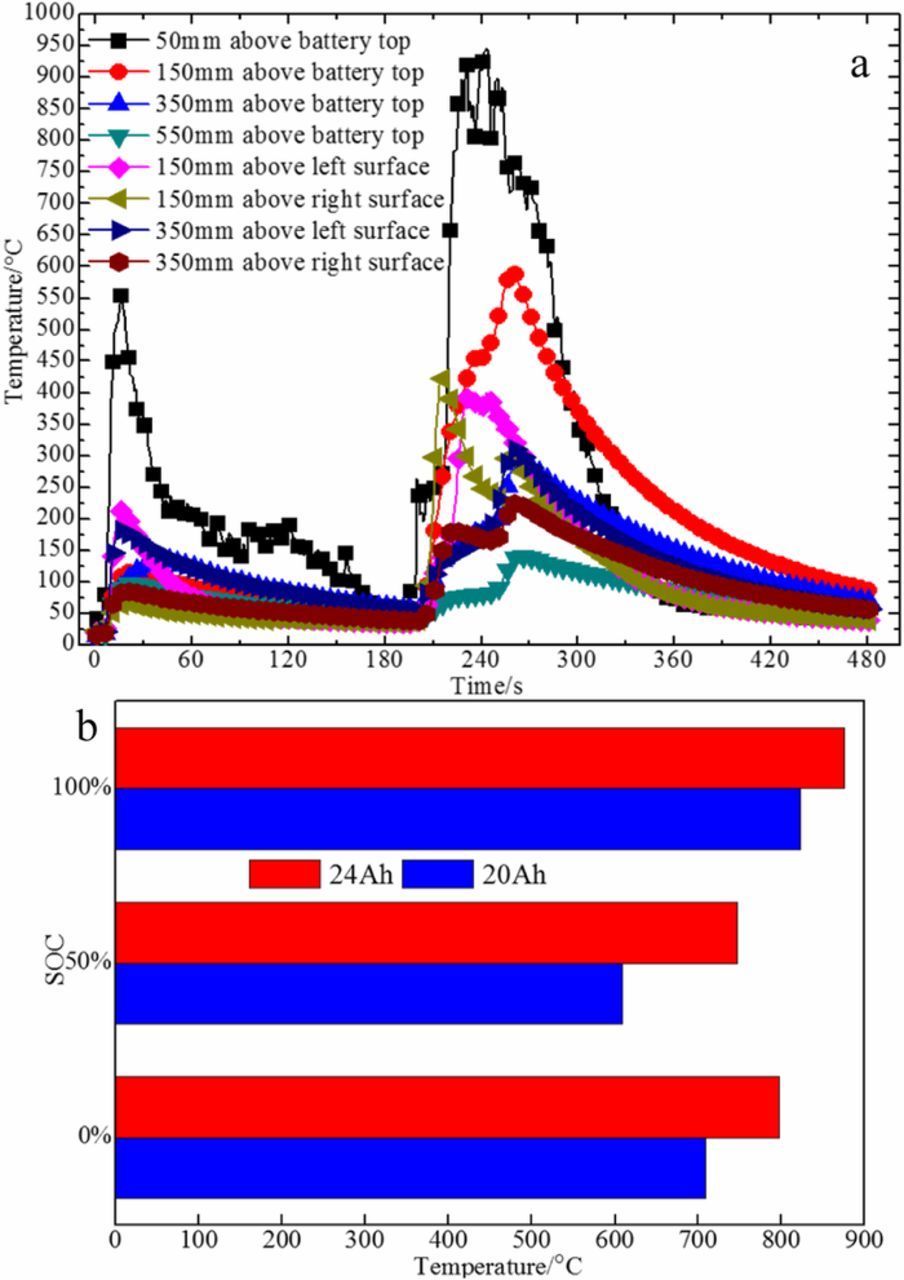
Figure 8. (a) Flame temperature curve of 24 Ah battery under 100% SOC conditions. (b) The average value of maximum flame temperature of two capacity batteries in different SOC states.
Flame height
The kmplayer software was used to take a screenshot of the flame video at a frame rate of 24 frames per second. After the flame boundary is determined, relevant parameters are input into MATLAB to obtain a probability cloud image of the flame area. The average flame height of the jet flame was taken as the corresponding flame height when the flame distribution probability was 0.5.33 Figure 9a presents a probability cloud image of the jet flame, where the distance from the top of the battery to the bottom of the flame is the liftoff height. The region from the bottom of the flame to the distribution probability of 0.95 is the continuous flame region. Intermittent flame region is the area with the distribution probability from 0.95 to 0.05. An area with a distribution probability less than 0.05 is defined as the buoyancy plume area.
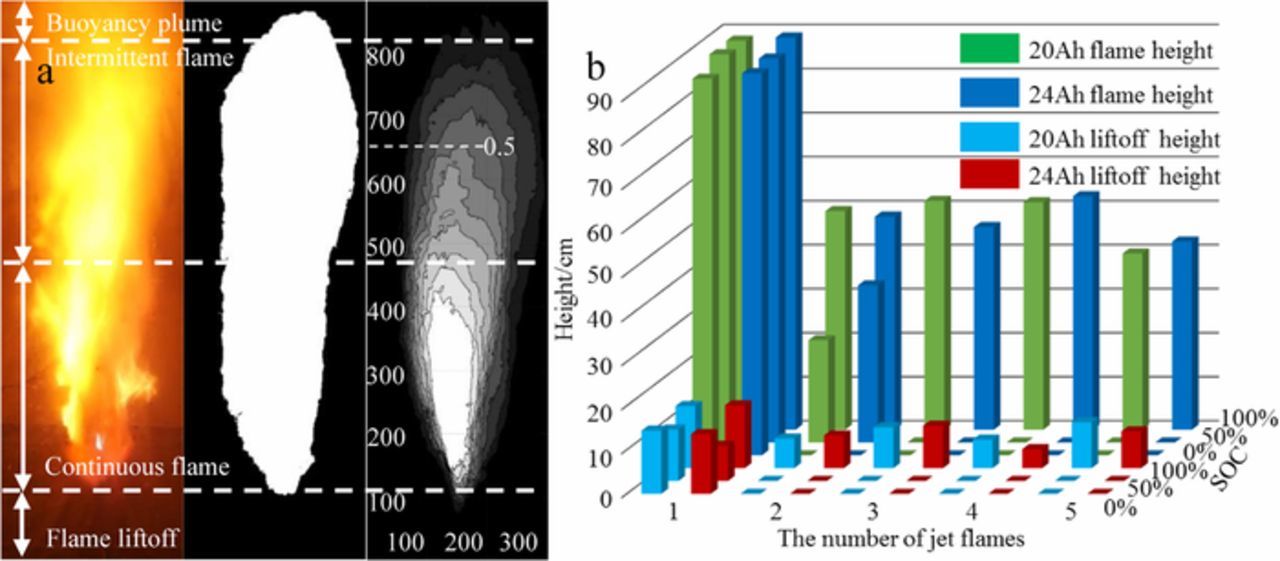
Figure 9. (a) Probability cloud image of the jet flame. (b) Jet flame height and liftoff height of two capacity batteries under different SOC conditions.
Table III summarizes the average value data of three repeated experiments for jet flame height and liftoff height of two capacity batteries in different SOC states. Figure 9b shows the variation of jet flame height and liftoff height under different SOC conditions for two capacity batteries more intuitively. In general, the flame height and liftoff height of the first jet flame are the highest in the 5 times of jet flame height data. This is mainly due to the instantaneous release of the accumulated pressure inside the battery during the first phase of thermal runaway, that result in a faster flow rate of flammable substance and a longer distance of jet. The number of jet flames formation is mainly affected by SOC, and the number of jet flames increases with the increase of SOC. When the SOC is 0%, 50% and 100%, the number of jet flames formed is 1, 2 and 5 respectively. For 20 Ah and 24 Ah batteries, the effect of battery capacity and SOC on the flame height and liftoff height of the first jet flame is not significant. In the 50% SOC state, the flame height of second jet flame formed by the 24 Ah battery is larger than that of 20 Ah battery due to the 24 Ah battery burns more violently. Under the influence of the flow rate of flammable substance, the flame height and the liftoff height formed from the second jet flame to the fifth jet flame are always fluctuating in the 100% SOC state. In conclusion, SOC dominates the formation of jet flames and the jet flame is more severe under high SOC conditions. Therefore, once the electric vehicle burns, it will bring a great threat to the surrounding vehicles and people.
Table III. The data of jet flame height and liftoff height for two capacity batteries in different SOC states.
| 100% SOC | 50% SOC | 0% SOC | |||||
|---|---|---|---|---|---|---|---|
| The number of jet flames | Height (cm) | 20 Ah | 24 Ah | 20 Ah | 24 Ah | 20 Ah | 24 Ah |
| 1 | Flame height | 88.33 | 89.10 | 88.18 | 87.22 | 85.53 | 86.76 |
| 2 | 49.64 | 48.40 | 23.23 | 35.70 | |||
| 3 | 51.96 | 46.04 | |||||
| 4 | 51.67 | 53.03 | |||||
| 5 | 40.03 | 42.74 | |||||
| 1 | Lift off height | 14.10 | 14.29 | 11.66 | 8.01 | 14.37 | 13.58 |
| 2 | 6.75 | 7.44 | |||||
| 3 | 9.26 | 9.66 | |||||
| 4 | 6.48 | 4.33 | |||||
| 5 | 10.41 | 8.36 | |||||
Conclusions
This study has investigated the thermal runaway of 20 Ah and 24 Ah LiFePO4 batteries under different SOC conditions using the combustion chamber. The curve of battery surface temperature can be divided into six stages, in which the temperature at the center of the battery surface and the negative electrode is relatively high. Surface temperature is mainly affected by battery capacity and SOC. In the 0% SOC and 50% SOC states, the maximum surface temperature increases as the battery capacity increases. But in the 100% SOC state, the maximum surface temperature of 20 Ah and 24 Ah batteries is not much different. Two phase of thermal runaway occurred under 50% SOC and 100% SOC conditions, while only one phase of thermal runaway occurred under 0% SOC conditions. At the same time, the risk of a second phase of thermal runaway is much higher than that of the first phase of thermal runaway. The rising rate of temperature and maximum surface temperature increase with the increase of SOC. This is because in the high SOC state, the heat production of the reaction between LixC6, LiFePO4 and the electrolyte are more. The MLR increases with the increase of SOC and battery capacity. The high capacity and high SOC state of the battery takes less time to form the first phase of thermal runaway, and it is easier to evolve into second phase of thermal runaway. The flame temperature at 50 mm above the top of the battery is the highest, which can be up to 950°C. The average value of the maximum flame temperature increases as the battery capacity increases. When the SOC is 0%, 50% and 100%, the number of jet flames formed is 1, 2 and 5 respectively. The greater the jet flame height, the greater the security threat to the surroundings. This paper finds that the battery capacity and SOC have little effect on the flame height and the liftoff height. But the SOC was found to play an important role in the formation of jet flames and the spray of jet flame is more severe under high SOC conditions.
The research in this paper show that the safety is not optimistic of the commercialized batteries with large capacity and high SOC state. The key to improving the safety of batteries is to reduce the temperature during thermal runaway by adding flame retardants, improving battery materials and setting external protective measures. After the first phase of thermal runaway, the fire extinguishing agent with better cooling effect is continuously applied for a long time to prevent the battery temperature from being too high, which can effectively prevent the occurrence of the second phase of thermal runaway, thereby facilitating the escape of persons and minimizing the loss. Store and transport battery in a low SOC state can avoid the occurrence of multiple jet flames and improve the safety of the battery.
List of Symbols
| T | Thermal runaway moment |
| Δm | Mass loss |
| ΔT | Time of duration |
Acknowledgments
This study was supported by State Key Laboratory of Explosion Science and Technology, Beijing Institute of Technology (grant no. ZDKT17-03), the National Key R&D Program of China (grant no. 2018YFB0104000), and the Key Laboratory of Firefighting and Rescue Technology, the Ministry of Public Security. Shuang Wang and Zhiming Du are co-first authors.
ORCID
ZhiYue Han 0000-0002-8517-5760