Abstract
The study observes thermal behavior of six Lithium-ion batteries with different cell designs. In operando temperature measurements are conducted using a thermographic camera as well as internal and external temperature sensors. The investigated cell designs include pouch cells as well as two high-power and two high-energy 18650 battery types. It is found for all cells that maximum temperatures of the cells correlate linearly with the discharge current. This trend is explained by basic physical laws. High-power and high-energy cells show significant differences, which correlate with electrode thickness and cell resistance. Furthermore, the influence of heat transport at different ambient conditions (climate chambers and use of heat sink) is discussed. A general difference is found for the temperature gradients inside pouch and cylindrical cells.
Export citation and abstract BibTeX RIS
Lithium-ion batteries tend to heat up during charging and discharging.1–3 Tests at different ambient temperatures have revealed that the aging rate is strongly dependent on the temperature, following an Arrhenius-like behavior.4–7 Furthermore, temperature gradients develop inside Lithium-ion batteries during charging and discharging,1,2,8–13 which are expected to be stronger with cell size and discharge current. Consequently, aging gradients inside cells can also be expected.8,13 Temperature gradients in Lithium-ion batteries have also been subject to modelling1,8,9 and experiments with thermographic cameras.10,11 We have recently shown that strong temperature gradients can induce deformations of the jelly roll in cylindrical cells.2,14
Only few studies exist involving internal temperature sensors in Lithium ion cells.13,15–17 A 3Ah pouch cell with embedded sensor was developed by Mutyala et al.15 In their cell design, the sensor was positioned between the electrode stack and the pouch foil.15 Therefore, the authors were able to measure the temperature increase during discharge and charge inside this cell.15 However, the temperature rise inside the electrode stack was not measured.15 An 18650-type cell with multiple embedded temperature sensors was recently built by Zhang et al.16 The authors were able to measure radial temperature distributions during discharge at rates up to 3C.16 We have recently shown that it is possible as well to build a thermocouple inside the jelly roll of commercial 18650-type cells and measure the temperatures inside the jelly roll during discharge at rates as large as 16C.2,13 Veth et al. indicated a linear dependency of maximum temperatures on the surface of large pouch cells with discharge current.18 In a more quantitative evaluation, we recently found similar results for temperatures inside the jelly roll of 18650 cells and on the cell surface in the range of 1C to 12C.13 A similar behavior was found for the maximum radial temperature gradients in 18650-type cells.13
In the present paper, in operando temperature measurements are carried out with commercial large scale pouch cells, model pouch cells with embedded sensors inside the stack and commercial high-power and high-energy 18650-type cells with temperature sensors on the cell surface. General rules are derived for the thermal behavior of the different cell designs.
Experimental
Table I gives details on the different cells used in the present study. Cell A is a large commercial pouch cell including a stack of graphite anodes and NMC cathodes. Cell type B was built for this study and contains two 0.75 Ah stacks with the internal temperature sensor in between. Each stack consists of 7 graphite anodes and 8 NMC cathodes. Figure 4a shows the design of cell type B.
Table I. Overview on cells and conducted tests in the current study.
| Battery type | Cell design | Chemistry | Nominal capacity [Ah] | Voltage range [V] | Conducted tests |
|---|---|---|---|---|---|
| A | pouch | NMC/graphite | 16 | 2.7–4.2 | thermographic imaging |
| B | pouch | NMC/graphite | 1.5 | 3.0–4.2 | internal + external temperature sensors |
| C | 18650 (high-power) | NMC+LMO/graphite | 1.5 | 2.0–4.2 | thermographic imaging + external temperature sensor |
| D | 18650 (high-power) | LMO/graphite | 1.2 | 2.5–4.2 | external temperature sensor |
| E | 18650 (high-energy) | NMC/graphite | 2.2 | 2.8–4.2 | external temperature sensor |
| F | 18650 (high-energy) | NCA/graphite | 3.25 | 2.5–4.2 | external temperature sensor |

Figure 4. a) Positions of temperature sensors in cell type B. b) Temperature rise during discharge at different C-rates. c) Maximum temperatures on the surface Tmax,surf and in the middle of the stack Tmax,stack of cell type B as a function of discharge C-rate. For each C-rate, the maximum temperature was measured five times.
Cell types C-F are commercial 18650 cells. Cell types C and D were chosen for their high-power design, whereas cells E and F are high-energy types. However, the cell chemistry is different for cell types C-F, as shown in Table I. Thicknesses of anode, cathode, and separator (see Figure 8a) for cells C-F were measured by a micrometer gauge after discharging the cells to their respective end-of-discharge voltages (see Table I) and subsequent disassembly of the cells. Thicknesses d in Figure 8 are mean values of four measurements per anode, cathode, and separator for each tested battery type. The internal resistances of cells C-F were measured at 1 kHz after the cells were equilibrated to 25°C.
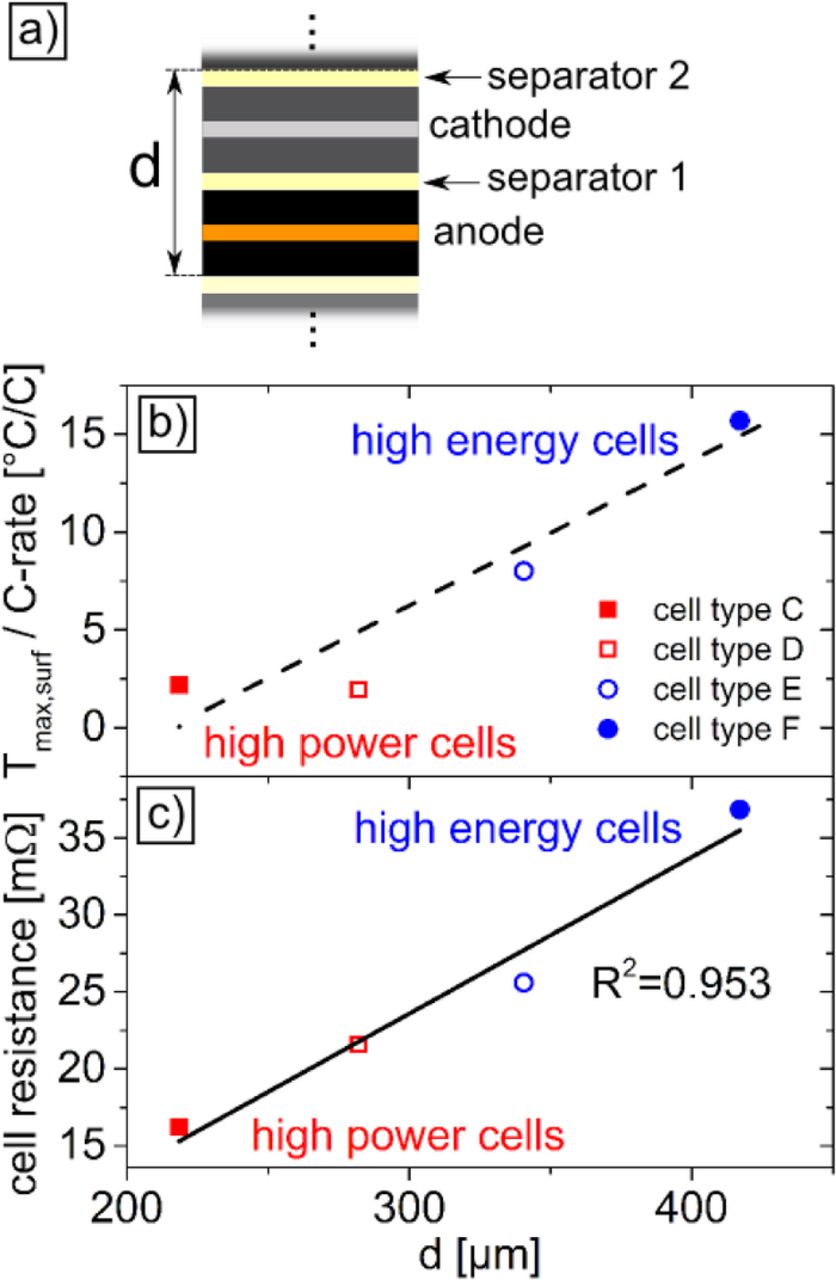
Figure 8. a) Illustration of the sum of the thicknesses d of anode, separator, cathode and a second separator in the jelly roll of cylindrical cells. b) Correlation between d and the ratio Tmax,surf/C-rate for the 18650 cell types C-F. The line is drawn to guide the eye. c) Correlation between d and the cell resistance at SOC = 50% and 25°C. The R2-value corresponds to a linear fit of the data points.
All electrochemical tests were conducted with Basytec CTS, XCTS and HPS systems at an ambient temperature of 25 ± 2°C. It is to note that there is a significant effect on the temperature measurements, whether a climate chamber is used or not. This is discussed in the section below. In order to get comparable results, in the present study similar test surroundings without climate chambers were used for all tests. An additional test with a heat sink was conducted on cell type C. The heat sink was built from an aluminum block with a cylindrical hole with 18 mm in diameter in which cell type C was introduced. Two dissipaters with fans (∼100 W each) were mounted on the aluminum block.
Cell type A was charged with a rate of 1C to 4.2 V using a standard CC/CV protocol until the current dropped below C/10. After relaxation for 12 h, the cell was discharged. This procedure was applied for discharge at 1C, 3C, and 8C. The temperature of the cell surface was recorded by a thermographic camera (InfraTec VarioCAM hr research 780S) at a rate of 2 frames per second. The relative error of the resolution in thermographic images was equal or smaller than ±0.1°C for other temperatures. The absolute error was ±1.5°C. The temperature measurement by the camera was referenced to measurement of the ambient temperature via a PT100 sensor.
Cell type B was charged with a rate of C/5 by a CC protocol before each discharge. The cell was then discharged with 1C, 2C, 3C, 4C, and 5C, respectively. Each C-rate was tested 5 times, showing no significant differences in temperature and voltage profiles. For cell type B, temperatures were acquired via type K thermocouples and a data logger with a rate of 0.5 Hz. The thermocouple error is ±1°C.
In the case of 18650 cells (type C-F), the temperatures on the surfaces of the cell housings were recorded using NTC thermo sensors. The sensors were placed at mid-height of the 18650 cylinders and had an error range of ±1°C.
Results and Discussion
Pouch cells
In-plane temperature gradients on the surface of pouch cells
The voltage profiles for the discharge of cell type A are shown in Figure 1. As expected, the voltage levels get lower with higher discharge rates. Therefore, the withdrawn power also gets lower. The capacity is highest for discharge at 1C and gets lower for 3C and 8C. However, for all three C-rates, the capacity is similar.
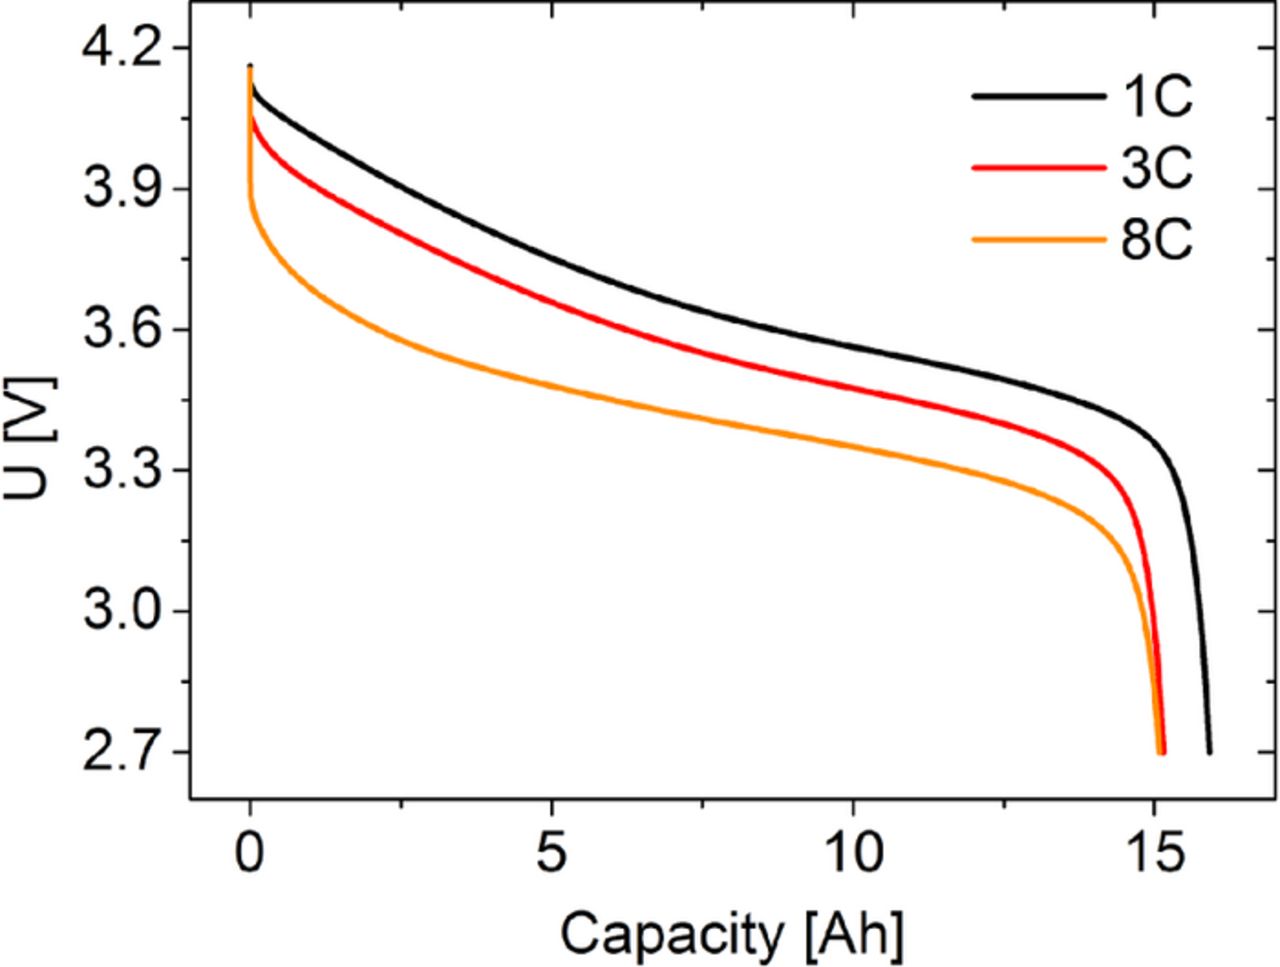
Figure 1. Voltage profiles for discharge of cell type A.
The measurement of the in-plane temperature distribution Tsurf(x,y) the surface of the pouch cell of type A is illustrated in Figure 2a. The in-plane temperature distribution is changing during discharge. A maximum temperature is reached on the cell surface at a certain time during discharge. Figure 2b–2d show the thermographic images of the surface of cell A at an ambient temperature of 25°C, when the maximum temperatures Tmax,surf occurred during discharge at 1C, 3C and 8C, respectively. As expected, Tmax,surf rises with increasing current. In Figure 2e, this is evaluated quantitatively. The high R2-value of 0.994 for a linear fit indicates that Tmax,surf correlates linearly to the discharge C-rate. The slope of the line fitted to the Tmax,surf data points in Figure 2e is 3.81 ± 0.20°C/C. Veth et al. published a comparable dataset using 50 Ah pouch cells,18 however, the authors did not provide slope values. Therefore, we extracted data from their plot18 and fitted lines to it. The corresponding R2-value is 0.999 showing the clear linear dependency mentioned by the authors.18 The extracted slope is 5.62 ± 0.07°C/C18 and therefore in the same range as the result from the present study (3.81 ± 0.20°C/C). However, a direct comparison is difficult since the authors conducted their tests in a cooling chamber,18 in contrast with our experiments which were conducted under convection conditions. Use of a temperature chamber can have significant influence on thermal behavior of cells (see cylindrical cells section). We would expect that using a temperature chamber would decrease the slope in the Tmax/C-rate plot. In contrast, the cell tested by Veth et al. has a higher slope compared to cell type A, which can be explained by its different cell geometry (see discussion on volume/surface ratio below).

Figure 2. a) Schematic of pouch cell type A (front view). Tsurf(x,y) is the temperature distribution on the cell surface (in-plane) as determined by thermographic imaging. b)-d) Thermographic images of the surface of commercial pouch cells (cell type A) for discharge at 1C, 3C and 8C, respectively. Tmax,surf is the maximum temperature on the cell surface, whereas ΔTmax,surf corresponds to the maximum temperature difference on the cell surface. e) Correlation of maximum temperatures on the cell surface with discharge C-rate.
A similar behavior is observed for the maximum temperature difference on the cell surface, ΔTmax,surf. As shown in Figure 2b–2d, at a discharge C-rate of 1C, 3C and 8C, the maximum temperature gradient on the cell surface gets as high as 2°C, 4°C and 10.5°C, respectively. A similar range of values for temperature differences was recently reported for a 40 Ah pouch cell system.18 The observed trend of higher temperature gradients in the cell caused by higher C-rates is also consistent with literature.13,18,19
The quantitative evaluation in Figure 2e shows that ΔTmax,surf is linearly correlated to the discharge C-rate (R2 = 0.994) with a slope of 1.23 ± 0.07°C/C. This value is smaller than the Tmax,surf/C-rate ratio (3.81 ± 0.20°C/C) for the same cell. The reason is that higher discharge C-rates have a stronger influence on the maximum temperature on the cell surface compared to the influence on the temperature differences.
Through-plane temperature gradients in pouch cells
In order to measure the temperatures inside the stack of cells with pouch design, we built cell type B. Cell types A and B both have a stacked geometry of the electrodes and a similar total thickness (7.5 mm and 7.0 mm for cell types A and B respectively). The positions of the temperature sensors in type B are shown in Figure 4a. One temperature sensor is positioned in the middle of the electrode stack (Tstack), whereas the other sensor is located on the cell surface (Tsurf). Both sensors are separated by one half of the electrode stack and one layer of pouch foil.
Figure 3 shows voltage profiles of cell B. The discharge capacity decreases strongly with increasing C-rate, e.g. at a discharge rate of 5C, the capacity is about half of that at 1C.

Figure 3. Voltage profiles for cell type B.
The temperature curves of cell B are plotted in Figure 4b. There is no significant difference between Tstack and Tsurf within the error range of the measurement (±1°C), indicating that there is no significant through-plane temperature gradient in the stack of pouch cell B. We note that there is a rise in temperature at the end of discharge for 1C, 2C, and 3C. A similar behavior was also reported by others.20,21 Xiao and Choe assigned the temperature rise at the end of discharge to a rise of enthalpy heating.20
The maximum temperatures Tmax,stack and Tmax,surf are plotted against the discharge C-rate in Figure 4c. The data points in Figure 4c are in good agreement with a linear fit as can be seen from the high R2-values (>0.980). The slopes of the fits are 3.87 ± 0.10°C/C and 4.31 ± 0.13°C/C for Tmax,stack and Tmax,surf, respectively. Both slope values are similar, reflecting the similarity of the Tstack and Tsurf in Figure 4c. This is also expressed in the corresponding ΔTmax/C-rate ratio of 0.35°C/C, which is not significant due to the measurement error of ±1°C.
We note that the linear fit to the data points in Figure 4c is improved, if the data point at 5C discharge is neglected. The reason is most likely that there is a strong drop in discharge capacity at 5C discharge. In particular, the fits for 1C–4C yield slopes of 4.26 ± 0.04°C/C (R2 = 0.998) and 4.78 ± 0.10°C/C (R2 = 0.996) for Tmax,stack and Tmax,surf, respectively. In the case of this fit both slopes increase, however, the order of magnitude remains the same. If the Tmax,surf/C-rate ratio of the pouch cells A and B is compared, it turns out that both values are in the same order of magnitude, supporting their comparability.
In conclusion, it is a general trend for pouch cells that the in-plane temperature gradients on the cell surface are about one order of magnitude stronger than the through-plane temperature gradients inside the stack. This is surely related to the length scale of a pouch cell in comparison to its thickness, where the latter is usually about one order of magnitude lower.
Cylindrical cells
Axial temperature gradients on the cell surface of cylindrical cells
Thermographic imaging is carried out on cylindrical cells similarly to how it was performed on the pouch cell (type A, see previous section). Figure 5 shows the temperature difference on the surface of cell type C. During discharge at 1C, the maximum temperature difference on the cell surface is 0.8 ± 0.1°C. The reason for the small temperature gradient on the cell surface is the high heat conductivity of the cell housing material (steel). In contrast, if the same cell is discharged at a rate of 16C, the maximum temperature difference on the cell surface is 6.5 ± 0.1°C. This value is one order of magnitude lower than the radial temperature difference of 36 ± 1°C during 16C discharge which we have measured recently.2 This behavior is in agreement with simulations by Xu et al., who modeled cylindrical LFP cells.22 The authors explained these results by the faster heat dissipation near the battery tabs compared to the radial heat transport.22

Figure 5. Maximum temperature difference on the surface of cell type C during discharge at 1C and 16C. The curves correspond to the temperature profiles along the dashed lines in the thermographic images.
Differences between cylindrical high-power and high-energy cells
For 18650 batteries of different type, the cell housings are quite similar. However, there can be significant differences inside the cells. These differences are especially the case if high-power and high-energy 18650-type cells are compared. The differences are loading, density, porosity, and thickness of the electrodes, resulting in a different thermal behavior. In the following, we investigate the thermal behavior of high-power cells (type C and D) and high-energy cells (type E and F).
The voltage profiles of cell types C-F are shown in Figure 6. As can be seen, the discharge capacities of all cells are very similar for all applied discharge C-rates within the specification of the respective cells. Like for the pouch cells of type A and B, a power loss is found for higher C-rates, as indicated by the lower voltage curves. It is noted that this loss correlates linearly with maximum temperatures on the cell surfaces.

Figure 6. Voltage profiles for discharge of cell types C-F.
In Figure 6, the voltages decrease monotonically for cell types C, E, and F for all tested discharge currents. In contrast, for cell type D the voltage decrease is non-monotonically for discharge rates of 10C and 13C. Due to a monotonic dependency of concentration and a small influence of temperature on electrode and cell potential,23 the origin of a non-monotonic cell potential is mainly attributed to limited transport and electrode kinetics. For cell type C, a flattening of the voltage profile is observed with increasing current, indicating a similar trend as for cell type D. The difference between cell type C and D can be related to the different anodes. The results can be explained with the higher anode thickness, which is in accordance with higher cell resistance and slower transport in case of cell type D.
The observed increase in cell temperature leads to higher values of transport parameters24 as well as improved electrode kinetics25 during discharge. Moreover high current loads enforce large concentration gradients, which could approach the limiting current where the concentration of lithium ions vanishes25 followed by a maximum surface overpotential. During on-going discharge of the cell, the rising temperature improves transport, kinetics and mitigates limiting conditions, resulting in a decrease of a large valued overpotential and the observed non-monotonic cell voltage for cell type D.
During discharge, the temperature on the surfaces of the cylindrical cells rises continuously, similar to the data in Figure 4b. E.g. a temperature rise of ∼8°C is found for cell type E for 1C discharge. For comparison, Zhang calculated a temperature rise on the surface of 26650-cells during discharge at a rate of 1C of 7.36°C.1 For discharge at 1.7C, the author found a temperature rise of 14.43°C.1 Zhang et al. reported a temperature rise of ∼10°C on the cell surface of 18650-type cells during discharge at 1C at 100% DOD.16
Evaluation of the maximum temperatures Tsurf,max on the surface of cell types C-F is shown in Figure 7. The results of the present study and data extracted from literature are summarized in Table II. Like for the pouch cells (see above), we find a very good agreement with a linear correlation of the discharge C-rate with Tsurf,max, as indicated by the R2-values larger than 0.963.
Table II. Comparison of Tsurf,max/C-rate for different cells at an ambient temperature of 25 ± 2°C.
| Cell type | Tmax,surf/C-rate [°C/C] | Ambient conditions |
|---|---|---|
| A | 3.80 ± 0.07 | no climate chamber |
| B | 4.31 ± 0.13 | no climate chamber |
| C | 2.19 ± 0.07 | no climate chamber |
| D | 1.94 ± 0.10 | no climate chamber |
| E | 8.01 ± 0.10 | no climate chamber |
| F | 15.71 ± 0.28 | no climate chamber |
| C | 1.36 ± 0.06 | climate chamber13 |
| C | 0.18 ± 0.01 | heat sink |
| 50 Ah pouch | 5.62 ± 0.07 | climate chamber18 |
| 26650 | 9.68 ± 0.30 | simulation1 |

Figure 7. a) Maximum temperatures on the surface of high-power (type C and D) and high-energy (type E and F) 18650 cells without heat sink. An additional test with heat sink was performed for cell type C. The solid lines are linear fits to the data points. b) Data from (a) normalized to cell capacity. The dashed line is drawn to guide the eye. All high-energy and high-power cells are indicated in blue and red, respectively.
The Tmax,surf/C-rate ratio for the high-power cells are 2.19 ± 0.07°C/C and 1.94 ± 0.10°C/C for cell types C and D, respectively. Although cell type C was also used in ref. 13, we found a higher value of 1.36 ± 0.06°C/C for the Tmax,surf/C-rate ratio. The reason is that no climate chamber was used in the current study, whereas in the former study the ambient temperature was held constant13 leading to a faster heat transport. The faster heat transport leads to a slower temperature rise at a certain C-rate and therefore to a lower Tmax,surf/C-rate ratio.
An even lower Tmax,surf/C-rate ratio can be achieved if a heat sink is used. As can be seen from Figure 7a, the slope in the Tmax,surf/C-rate graph for a cell of type C with heat sink is significantly lower than that of cell C without heat sink. More quantitatively, the Tmax,surf/C-rate ratio is only 0.18 ± 0.01°C/C. Furthermore, this measurement shows that the heat transport with heat sink is even stronger than for the use of a climate chamber without heat sink. The reason is that the heat is dissipated by thermic conduction instead of convection. We note that use of a heat sink is likely to increase the radial temperature gradients in cylindrical cells.
In contrast to the high-power cells C and D, the Tmax,surf/C-rate ratio is higher for the high-energy cells E and F. The reason for the higher temperature rise at low C-rates for the high-energy cells is the higher thickness of their electrodes. A measure for electrode thickness is the sum of the thicknesses of anode, cathode and two separators d, as illustrated in the inset of Figure 8a. The thickness d was determined for cell types C-F after disassembly. Figure 8b shows that there is a correlation between the ratio Tmax,surf/C-rate and d.
Additionally, there is a linear correlation between the cell resistance and d, as can be seen in Figure 8c. We note that a linear fit to the data points from the four different cell types C-F has a coefficient of determination of 0.953. This high R2-value indicates that the correlation between the thickness d and the cell resistance is a general trend.
We note, that if the Tmax,surf/C-rate ratio is normalized to cell capacity (Figure 7b), high-energy and high-power cells show a similar behavior. This graph reflects the higher effective currents in high-energy cells and shows a similarity in the behavior of high-energy and high-power cells. We suspect that the reason for this similarity is the fact that cell types C-F are produced in 18650 design.
From the simulated data of a 26650-cell, we extracted a Tmax,surf/C-rate ratio of 9.68 ± 0.30.1 This value is in the same order of magnitude as our measurements for high-energy cells. However, the thickness d of that 26650 cell was given as 193.5 μm which is in the order of high-power cells.1 The reason for the higher Tmax,surf/C-rate ratio is the larger cell diameter of 26 mm compared to 18 mm for 18650-type cells. In a cell with larger diameter, more electrode layers are present that lower the radial heat conductivity.
In conclusion, the combination of higher resistance and higher effective currents in high-energy cells contributes to the stronger dependency of temperature rise compared to high-power cells. This stronger dependency, as expressed in the Tmax,surf/C-rate ratio leads to a technical limitation of discharge C-rates for high-energy cells, since the maximum cell temperatures of 60°C often given by cell manufacturers are reached at lower C-rates compared to high-power cells.
Comparison of cylindrical and pouch cells
Comparing the Tmax,surf/C-rate ratio of 18650 and pouch cells, all values are in the same order of magnitude (see Table II). The sensitivity of the surface temperature to C-rate for pouch cells is in between that of high-power and high-energy 18650-type cells.
As shown in Figure 9, pouch cells have generally higher in-plane temperature differences in the cell surface and only very small through-plane temperature differences perpendicular to the electrode layers. In contrast, the radial temperature gradients in cylindrical cells are about one order of magnitude larger than the axial temperature gradients on the cell surface of cylindrical cells with metal housing.
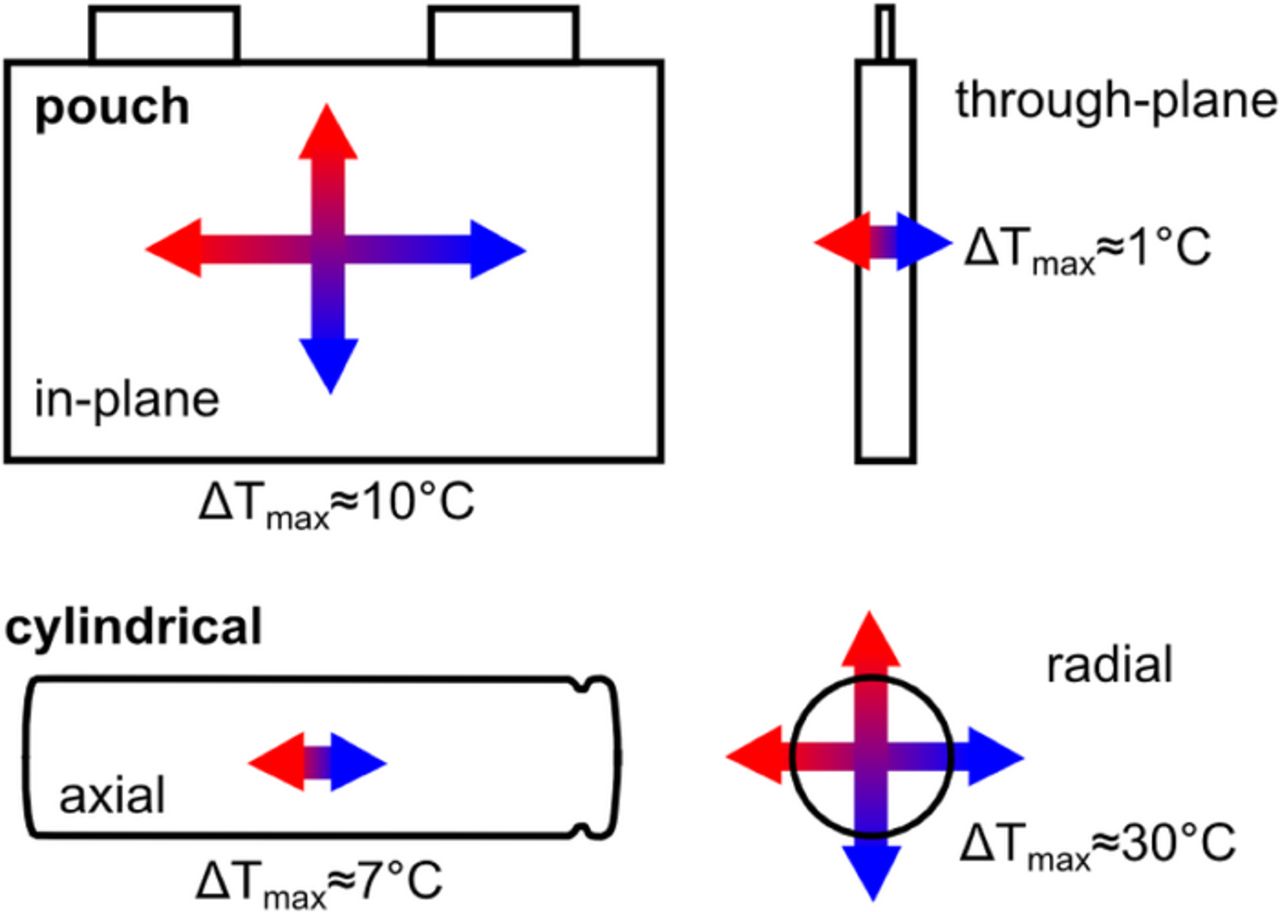
Figure 9. General trends for temperature gradients in Lithium-ion batteries with pouch and cylindrical cell design. The given numbers are rough values for maximum temperature gradients at the highest specified C-rates.
If we compare the radial temperature gradients of 18650 cells with the in-plane temperature gradients of pouch cells, it turns out that the gradients in the cylindrical cells are higher in general (see Table III).
Table III. Comparison of maximum temperature gradients as a function of C-rate for different cell designs at an ambient temperature of 25°C.
| Cell type | ΔTmax/C-rate [°C/C] | Type of temperature gradient |
|---|---|---|
| A | 1.23 ± 0.07 | on cell surface |
| B | 0.35 ± 0.02 | middle of stack/cell surface |
| 26650 | 9.68 ± 0.29 | radial1 |
| 18650 | 3.19 ± 0.06 | radial13 |
The same trend can be observed for the ΔTmax/C-rate ratio. More specifically, we measured a value of 1.23 ± 0.07°C/C for pouch cell A. For comparison, 3.19 ± 0.06°C/C was found for cell type C, even though a climate chamber was used in the latter case.13 For a 26650 cell, a value of 9.68 ± 0.29°C/C could be extracted from the data given in ref. 1.
The main difference in the thermal behavior of cells is due to differences in their volume/surface ratio. In particular, the pouch-type cells type A and B have a volume/surface ratio of 3.4 and 2.1, respectively. In contrast, the volume/surface ratio of 18650 and 26650-type cells is 4.5 and 6.5, respectively. Therefore, the pouch cell of type A has about the double cell surface area compared to cylindrical cells, improving its heat transport properties under convection conditions. Comparing pouch cell type A and the 40 Ah cell tested by Veth et al.,18 the volume/surface ratios are 3.4 and 5.8, respectively. Therefore the 40 Ah cell has a higher Tmax/C-rate ratio even though it was tested in a temperature chamber.
Explanation of the linearity of maximum cell temperature and C-rate
Veth et al. pointed out that the linear correlation of Tmax,surf with the discharge C-rate is due to compensating of two effects.18 According to the authors, these effects are higher power loss with increasing C-rate and corresponding higher temperatures lowering the cell resistance.18 Furthermore, they argumented with quadratic and exponential functions18 that do not necessarily lead to a linear function, if they are combined. However, for cell type C we found a very low temperature dependency of the cell resistance in the range of 25–60°C.
Therefore, we have to describe the linear correlation of Tmax with the discharge C-rate in a different way. According to Ohm's law
![Equation ([1])](https://content.cld.iop.org/journals/1945-7111/162/6/A921/revision1/jes_162_6_A921eqn1.jpg)
the power loss is linearly correlated to the discharge current (C-rate). The produced heat is
![Equation ([2])](https://content.cld.iop.org/journals/1945-7111/162/6/A921/revision1/jes_162_6_A921eqn2.jpg)
and therefore
![Equation ([3])](https://content.cld.iop.org/journals/1945-7111/162/6/A921/revision1/jes_162_6_A921eqn3.jpg)
Since the time of discharge is proportional to 1/I, one can derive
![Equation ([4])](https://content.cld.iop.org/journals/1945-7111/162/6/A921/revision1/jes_162_6_A921eqn4.jpg)
where c is a constant.
Under adiabatic conditions, the relation of temperature change ΔT to heat Q is given by heat capacity C
![Equation ([5])](https://content.cld.iop.org/journals/1945-7111/162/6/A921/revision1/jes_162_6_A921eqn5.jpg)
and therefore
![Equation ([6])](https://content.cld.iop.org/journals/1945-7111/162/6/A921/revision1/jes_162_6_A921eqn6.jpg)
Our setup is not adiabatic since a part of the generated heat is transferred to the environment e.g. via radiation and via the attached cables. However, the heat transfer from the batteries to the environment is approximately constant. Therefore, in our experiments the equal sign in equation 6 must be exchanged by a proportional sign. This can also be described by replacing the constant c with c' in equation 6, where c'<c. In case of stronger heat transfer away from the cell, e.g. by using a heat sink, c' gets lower resulting in a smaller temperature rise (see Figure 7a). ΔT corresponds to the increase of mean cell temperature and therefore leads to a higher maximum temperature on the cell surface (Tmax,surf) which has experimentally been found to correlate linearly to the C-rate. For low temperatures this may be different, since e.g. for cell type C we found a doubling of the cell resistance for −20°C compared to 25°C.
If ΔT measured on the cell surface after a constant time is plotted against C-rate, a quadratic function correlation is found, according to equation 3. This is exemplarily shown in Figure 10, where fits to quadratic functions show high coefficients of determination for cell types C-F.

Figure 10. Temperature on the surface of cell types C-F after a discharge time of 240s without heat sink. The data were fit to quadratic functions.
Conclusions
The present study shows that temperature gradients develop during discharge in pouch and cylindrical battery designs.
We found the following general trends for both, pouch and cylindrical cells:
- The temperatures inside the cells and on their surface rise continuously during discharge at a constant C-rate.
- The maximum temperatures depend linearly on the discharge C-rate for a full discharge. This correlation can be understood by a straightforward combination of Ohm's law and the proportionality of the reciprocal of the discharge time to the C-rate. In case of cells with a weak rate capability, this linearity can be slightly disturbed at high currents. If the temperature rises on the cell surfaces at a constant time are compared, a quadratic correlation according to Ohm's law is found.
- The ratio of Tmax,surf/C-rate can be used to quantify the sensitivity of the temperature rise on the surface of cells to a corresponding discharge C-rate. Typical values for the Tmax,surf/C-rate ratio are 1.3–15.7°C/C.
- The Tmax,surf/C-rate ratio can be different for a certain cell design and depends on the ambient conditions. We found the following trend for the Tmax,surf/C-rate ratio: convection conditions > climate chamber > heat sink
The cell design has a significant influence on temperatures and temperature gradients inside cells. The following trends were found:
- Pouch cells have larger in-plane temperature gradients on the cell surface. The through-plane temperature gradients inside the stack are about one order or magnitude smaller.
- For cylindrical cells, the axial temperature differences on the cylinder surface are about one order of magnitude lower than the radial temperature gradients.
- The Tmax,surf/C-rate ratio for pouch cells is in between that of high-energy and high-power 18650-type cells.
- Comparing cylindrical high-energy and high-power cells, the temperatures of the former are stronger influenced by the C-rate. The reasons are higher effective currents and the higher thickness of the electrodes of high-energy cells leading to smaller radial heat conductivity and higher cell resistances.
Temperature differences in a Lithium-ion battery can exceed 10°C for C-rates specified for commercial cells. From this result, aging gradients can be expected to develop inside Lithium-ion batteries during long-term usage. In particular, a thicker SEI can be expected in areas with higher local temperature. For pouch cells, it can be expected that there is a stronger in-plane aging gradient. In contrast, for cylindrical cells, a stronger radial aging gradient is anticipated.
The results of the present study show general trends for the temperature behavior of Lithium-ion cells as a function of discharge C-rate. They may be useful, e.g. for the development of cooling and BMS systems as well as for validation of simulations.
Acknowledgment
The authors gratefully acknowledge funding of the ReLiOn project by the German Federal Ministry of Education and Research (BMBF) under contract number 03X4619C. Part of the research leading to these results has been performed within the MAT4BAT project (http://www.mat4bat.eu) and received funding from the European Community's Seventh Framework Programme (FP7/2007-2013) under grant agreement n° 608931. We thank S. Krug and D. Waldenmaier for performing part of the thermographic imaging tests and G. Zettisch for building part of the heat sink.