Abstract
The electrodeposition of Cu-Ag alloys was studied as a possible application for interconnect technology, where Cu-Ag alloys may be less susceptible to electromigration than Cu alone. The presence of chloride in state-of-the-art copper plating electrolytes limited the solubility of Ag. However, pulse-plating approach enabled a wide range of Cu-Ag alloy compositions at substantial chloride concentration levels. The deposition of Ag was driven by the displacement reactions between the metallic copper and ionic silver during the off-time. Measured alloy compositions were consistent with theoretical estimates at various electrolyte concentrations, electrode rotation speeds, pulse frequencies and duty cycles. However, organic additives decreased incorporation of Ag into the alloy. It was also discovered that CuSO4·5H2O from a number of major chemical suppliers contained Ag as an impurity. The roughness of the films was significant when produced by pulsed plating, but was shown to be substantially reduced in the presence of a leveling agent. Additionally, the concentration of chloride in the electrolyte was shown to significantly affect surface quality of the deposited Cu-Ag thin films.
Export citation and abstract BibTeX RIS
With the continuing miniaturization of microelectronics, electromigration effects in copper interconnect systems are becoming a major factor in determining device lifetime and reliability.1–3 Accordingly, there is a need for interconnect materials with improved electromigration resistance, while maintaining adequate electrical resistivity. It has been shown that co-deposits of Cu with small amount of other metals (such as Ag, Sn, Co, and Mg) can potentially mitigate both electro- and stress-migration.4–8 However, the resistivity of the interconnect increases with the addition of foreign metals. The International Technology Roadmap of Semiconductors (ITRS) has set the resistivity criterion at ρ < 2.2 μΩ·cm,9 only slightly above the bulk resistivity of pure copper at 1.68 μΩ·cm. Alloying copper with silver (ρAg = 1.59 μΩ·cm) was shown to increase the resistivity of electrochemically deposited Cu-Ag films the least when compared to other copper alloys.10 For Ag content between 0.17 and 3.2 wt% the resistivity ranges 1.8 to 3.1 μΩ·cm.10 For this reason Cu-Ag alloys, especially at the lower Ag weight percentages, are potential candidates for the fabrication of interconnects in microelectronic devices.
Acidic copper-sulfate electrolytes containing chloride have been successfully applied for many years to the electrochemical fabrication of copper interconnects.11–13 Chloride in these electrolytes is known to be one of the critical constituents enabling defect-free filling of surface features.14–20 The main challenge for depositing silver from copper-plating electrolytes, which contain about 50 ppm of chloride, is the low solubility of silver in the presence of chloride ions (the solubility product of AgCl in water at 25°C is 1.8×10⁻¹⁰ M2).21 While Strehle et al. demonstrated a controlled electrodeposition of Cu-Ag alloys from chloride-free acidic copper sulfate electrolytes,22 the deposition in the presence of chloride is probably necessary.
We demonstrate that the application of a pulsating current instead of a direct current permits the use of chloride at a substantial concentration, while also allowing a wide range of Cu-Ag alloy compositions. The literature contains numerous descriptions of pulse-plating of different binary and ternary metal alloys with copper from a variety of electrolytes: Cu-Co from citrate and boric acid electrolyte,23 Cu-Ni from trisodium citrate electrolyte,24 Cu-Sn from Lucent's SnTech line of electroplating baths,25 Cu-Mg from ammonium sulfate electrolyte,26 Ni-Cu-Mo from ammonia citrate electrolyte,27 etc. However, this is the first investigation to look at the pulse-plating approach for the electrochemical deposition of Cu-Ag thin films from the conventional copper plating electrolytes containing chloride and organic additives.
The aim of the present study is to investigate the composition of Cu-Ag alloys at various plating conditions, electrolyte concentrations, and applied pulse parameters. We show the role of the displacement reactions in pulse-plating of Cu-Ag by comparing measured alloy compositions with those predicted by theoretical estimates. Additionally, the film microstructure and film quality of the deposited alloys was also examined.
Experimental
Electrochemistry on rotating disk electrode
For the electrochemical investigation, a three-electrode cell was employed. The working electrode was a platinum rotating disk electrode (RDE) with 4 mm diameter (Pine Corporation). The counter electrode was a gold wire. A double junction reference electrode Hg|Hg2SO4 (Pine RREF0026) was chosen to avoid problems associated with leakage from such reference electrodes as Ag|AgCl. Prior to each experiment, the platinum surface of the RDE was electrochemically treated in 0.5 M H2SO4 solution by cycling the electrode potential repeatedly from −0.66 V to 8.5 V at 1 V s−1 until a characteristic cyclic voltammogram developed. Then, the working electrode was modified by plating about 1.8 μm layer of copper from a copper sulfate electrolyte without additives at −40 mA cm−2.
Copper oxidation was found to be an important parameter during pulse-plating. The measurement of the oxidation rate of copper was conducted in 0.63 M CuSO4·5H2O and 0.3 M H2SO4 electrolyte. First, a copper film was electrochemically plated at −10 mA cm−2 onto platinum RDE for 271.5 s at 400 rpm. According to Faraday's law, this corresponds to a film thickness of about 1 μm. Then, current was switched to zero and, depending on the desired experiment, the electrode was either immediately rinsed with DI water or allowed to stay in the electrolyte for 15 min at 400 rpm. Afterwards, the RDE was transferred to a concentrated phosphoric acid; there copper was stripped from RDE at 10 mA cm−2 and the stripping time was recorded (it was previously demonstrated that stripping of Cu in H3PO4 occurs nearly at 100% current efficiency).28 The time required to dissolve copper was determined by observing a sharp potential increase at the completion of the dissolution process, when the potential reached 1.39 V vs. Hg|Hg2SO4 up from a dissolution potential of −0.325 V. Comparing the time of deposition to the time of stripping allowed for the determination of the oxidation rate of copper.
Electroplating of alloy films
Coupon squares were used for the electrochemical deposition of thin films. Coupons were cleaved from 300 mm silicon wafer that had Ta/TaN barrier layer and PVD plated copper-seed layer (thickness of 50 nm) on the surface. After cleaving the wafer, the coupon was cleared of dust by blowing pre-purified compressed nitrogen to the surface. Then, the coupon was attached to the coupon holder, designed by Atotech USA, Inc., to approximate an RDE. The electrical contact to the wafer segments was achieved by applying Cu adhesive tape to all four sides of the square coupon, and then Kapton tape was applied to define a circular surface area of deposition. A hole in the Kapton tape was cut using a craft punch (Marvy Uchida), with 5/8 inch hole diameter (surface area 1.98 cm2).
After attaching the coupon, the holder was mounted on a rotatory shaft at the RDE stand (Pine), rinsed in deionized (DI) water (18.2 MΩ·cm), and immersed in a 200 mL of electrolyte contained in a 325 mL Pyrex crystallizing dish for the deposition experiment. The counter electrode for the preparation of thin films was a gold wire. The entire stand was inclined 5 degrees to prevent the entrapment of air bubbles on the coupon surface during the immersion of coupon into solution. A pulse current was controlled through Nova 1.5 electrochemical software (Metrohm Autolab B.V.), by FRA2 μAutolab Type III potentiostat/galvanostat (Metrohm Autolab B.V.). After the deposition experiment, the coupon was rinsed with DI water and blown dry with compressed nitrogen. Composition of the alloy was examined by inductively coupled plasma – atomic emission spectroscopy (ICP-AES). For this analysis, the whole deposit (including the seed layer) was dissolved in 1 mL of 35% concentrated nitric acid, and afterwards diluted in DI water to make 10 mL of volume for analysis by ICP-AES.
Electrolytes for all plating experiments were prepared using the following materials: CuSO4·5H2O, 99+% (Fisher Scientific, Acros Organics), H2SO4, 95–98% (EMD Chemicals, Inc.), AgNO3, 99.9+% (Alfa Aesar), PEG 3350 g/mol (Sigma-Aldrich), HCl, 12.1 M (VWR, BDH Aristar), SPS, 96% mass fraction29 (Raschig GmbH), Polyvinylpyrrolidone 29,000 g/mol (Sigma-Aldrich). For all experiments conducted in this study, the concentration of PEG was 300 ppm (8.95×10⁻⁵ M), the concentration of SPS was 30 ppm (8.46×10⁻⁴ M), and the concentration of PVP was 200 ppm (6.9×10⁻⁶ M). The organic additives, silver, and chloride were individually added to the plating bath through dilution from concentrated solutions made with DI water.
Metrology
ICP-AES tool (Horiba Jobin Yvon) controlled by ACTIVAnalyst 5.4 software was used to determine the total amount of silver in the electroplated films. The quantification of the silver concentration was done through the calibration of the signal intensities with known amounts of silver. Calibration standards were prepared using 1000 ppm silver ICP standard, silver nitrate in 3% nitric acid (Ricca Chemical Company). The emission wavelength for silver analysis was chosen to be 328.068 nm.
The surface quality and thickness of plated films were examined by plan view and cross-sectional imaging in an FEI Nova NanoLab 600 Dual Beam Focused Ion Beam-Scanning Electron Microscope (FIB-SEM). The SEM column was operated at 5 kV for imaging while the FIB column was operated at 30 kV for cross sectioning. Depth profiling of the film composition was determined by IonTOF 5-300 Time-of-flight Secondary Ion Mass spectrometry (ToF-SIMS). The analysis beam was pulsed 1nA Bi+ at 25 keV and 45 degrees incidence across a 50 μm area. The sputtering beam was 100 nA Cs+ at 2 keV and 45 degrees incidence. The analysis and sputtering beams were used in interlace mode. Negative secondary ions were monitored with a mass resolution of about 4000. Calibration of the depth scales and conversion of ion counts to concentrations were made using an ion implanted Cu standard. Calculated concentrations should be accurate to within 15% and depth scales should be accurate to within 5%.
Results and Discussion
Rationale for choosing pulse-plating approach
The electrochemical deposition of Ag from copper electrolytes that contain chloride ions as a critical component is made difficult by the low solubility of silver ions with chloride (Ksp of AgCl in water is 1.8×10⁻¹⁰ M2 at room temperature21). One possible way to avoid the issue of AgCl solubility is to find a substitute for chloride. Bromide has been reported to have a similar effect as chloride when used with organic additives,30 however AgBr is even less soluble (Ksp = 5×10⁻¹³ M2) than AgCl. Another halogen, fluoride was tested by linear sweep voltametry technique to observe whether it exerts any effect on organic additives. The critical suppression of copper deposition by PEG was not achieved in the presence of fluoride ions. The solubility of AgCl can be improved by complexing or chelating Ag+ ions. However, known chelating agents for Ag+ (such as ammonia, thiosulfate, and EDTA) adversely affect and/or complex cupric ions, which are present in much larger concentration levels than silver ions. Yet another way to avoid the problem of low solubility of AgCl, is to find organic additives that enable feature filling without chloride. However, most reported organic additives are used in the presence of chloride.31 Suppressors, such as PEG, PPG, EPE, PEP,32,33 were tested by linear sweep voltammetry to evaluate their behavior in the absence of chloride during the electrodeposition of Cu. The experimental results showed that all these substances do not to provide an adequate suppression without chloride.
In order to deposit Cu-Ag alloys, the approach taken in the present study is to maintain a silver concentration below the solubility limit of AgCl, while keeping the concentration of chloride,  (2.82×10⁻⁴ M). The surface quality of the plated films was found to be adversely affected at lower chloride concentration levels (discussed below). Additionally, Dow et al. has shown that in order to obtain good filling of fine features a
  must be maintained.34
Electroanalytical investigation was carried out to observe how the suppression of copper deposition by PEG is affected by the concentration of chloride, and more importantly to determine if adequate suppression can be obtained at  = 10 ppm. Polarization curves in Figure 1 show the effect of chloride at different potentials. Until the potential reached about 0.67 V vs. Hg|Hg2SO4, the suppression of copper deposition at
  = 10 ppm (2.82×10⁻⁴ M) and the conventionally used
  = 50 ppm (1.41×10⁻³ M) was almost unchanged.
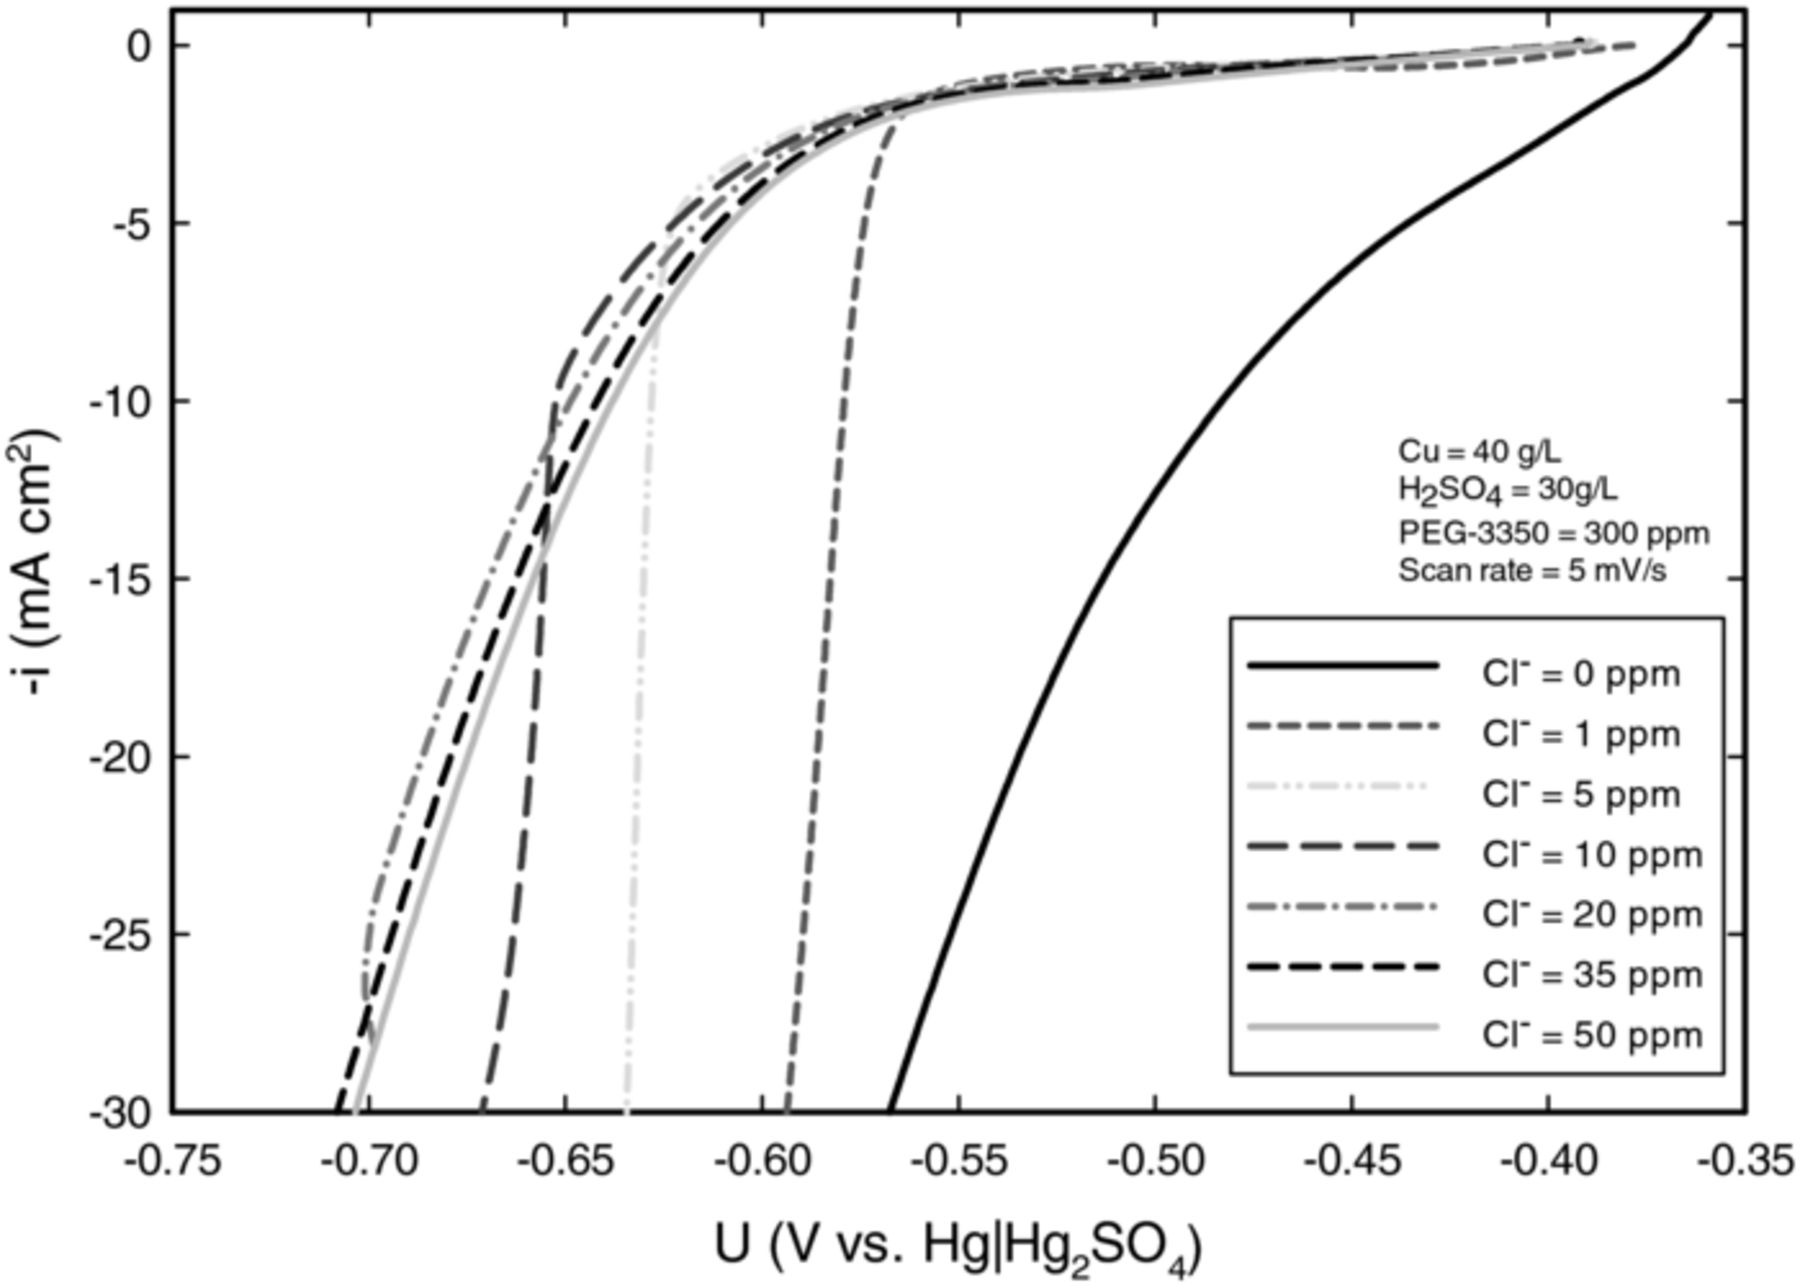
Figure 1. Linear sweep voltammetry results obtained at a sweep rate of 5 mV s−1; the potential was swept from less to more negative. Data were obtained on a preplated with copper, platinum RDE at 100 rpm. Results illustrate the effect of PEG on the suppression of copper deposition at various concentrations of chloride.
According to Ksp value of AgCl in water at 10 ppm of Cl−, the concentration of silver ions ( ) at saturation is 9.87×10⁻⁷ M. However, in higher ionic strength solutions, such as sulfuric acid based copper electrolytes, solubility of Ag+ may be somewhat higher. To determine the effect of copper electrolyte on the solubility of AgCl, 4.63×10⁻⁴ M of Ag+ and 4.63×10⁻⁴ of Cl− were combined in 0.63 M CuSO4·5H2O and 0.3 M H2SO4 solution. Silver chloride precipitate began forming almost instantaneously upon the contact. After several days, about 10 mL of solution at the top was withdrawn and filtered through Steriflip-GV, 0.22 μm (Millipore) to ensure that no precipitate was left in the saturated solution. From the measured silver concentration, Ksp value of AgCl in the specified copper electrolyte was 5.4×10⁻¹⁰ M2. Based on this solubility product,
  cannot exceed 1.9 μM before AgCl would precipitate.
Since the concentrations of copper and silver have to be so different, the plating mode required careful consideration. The direct-current (DC) deposition would limit the possible fraction of Ag in a Cu-Ag alloy. For example, based on Faraday's law, the mass fraction of Ag in a 100 nm film would be limited to 0.26 wt% if the deposition were to be carried at the saturation concentration of Ag+ ( = 1.9 μM) and a typical applied current density of −10 mA cm−2 and 400 rpm.
Description of the pulse-plating method
We thus investigated pulse-plating as a more promising option. Figure 2 shows an example of the unipolar pulse-plating waveform that was chosen for the deposition of Cu-Ag alloys. The current is pulsed between ioff = 0 mA cm−2 (i.e. off-time) and ion = −10 mA cm−2 (i.e. on-time). During the off-time, metallic copper on the surface is expected to be spontaneously replaced by silver (reaction 1), driven by the difference of standard reduction potentials between silver (Uθ = 0.799 V vs. SHE) and copper (Uθ = 0.337 V vs. SHE) reactions. During the on-time, both Cu2+ and Ag+ ions are electrolytically plated on the cathode surface. Based on reaction 1, during the off-time, for every one atom of Cu leaving the surface two atoms of Ag are deposited.
![Equation ([1])](https://content.cld.iop.org/journals/1945-7111/159/11/D677/revision1/jes_159_11_D677eqn1.jpg)
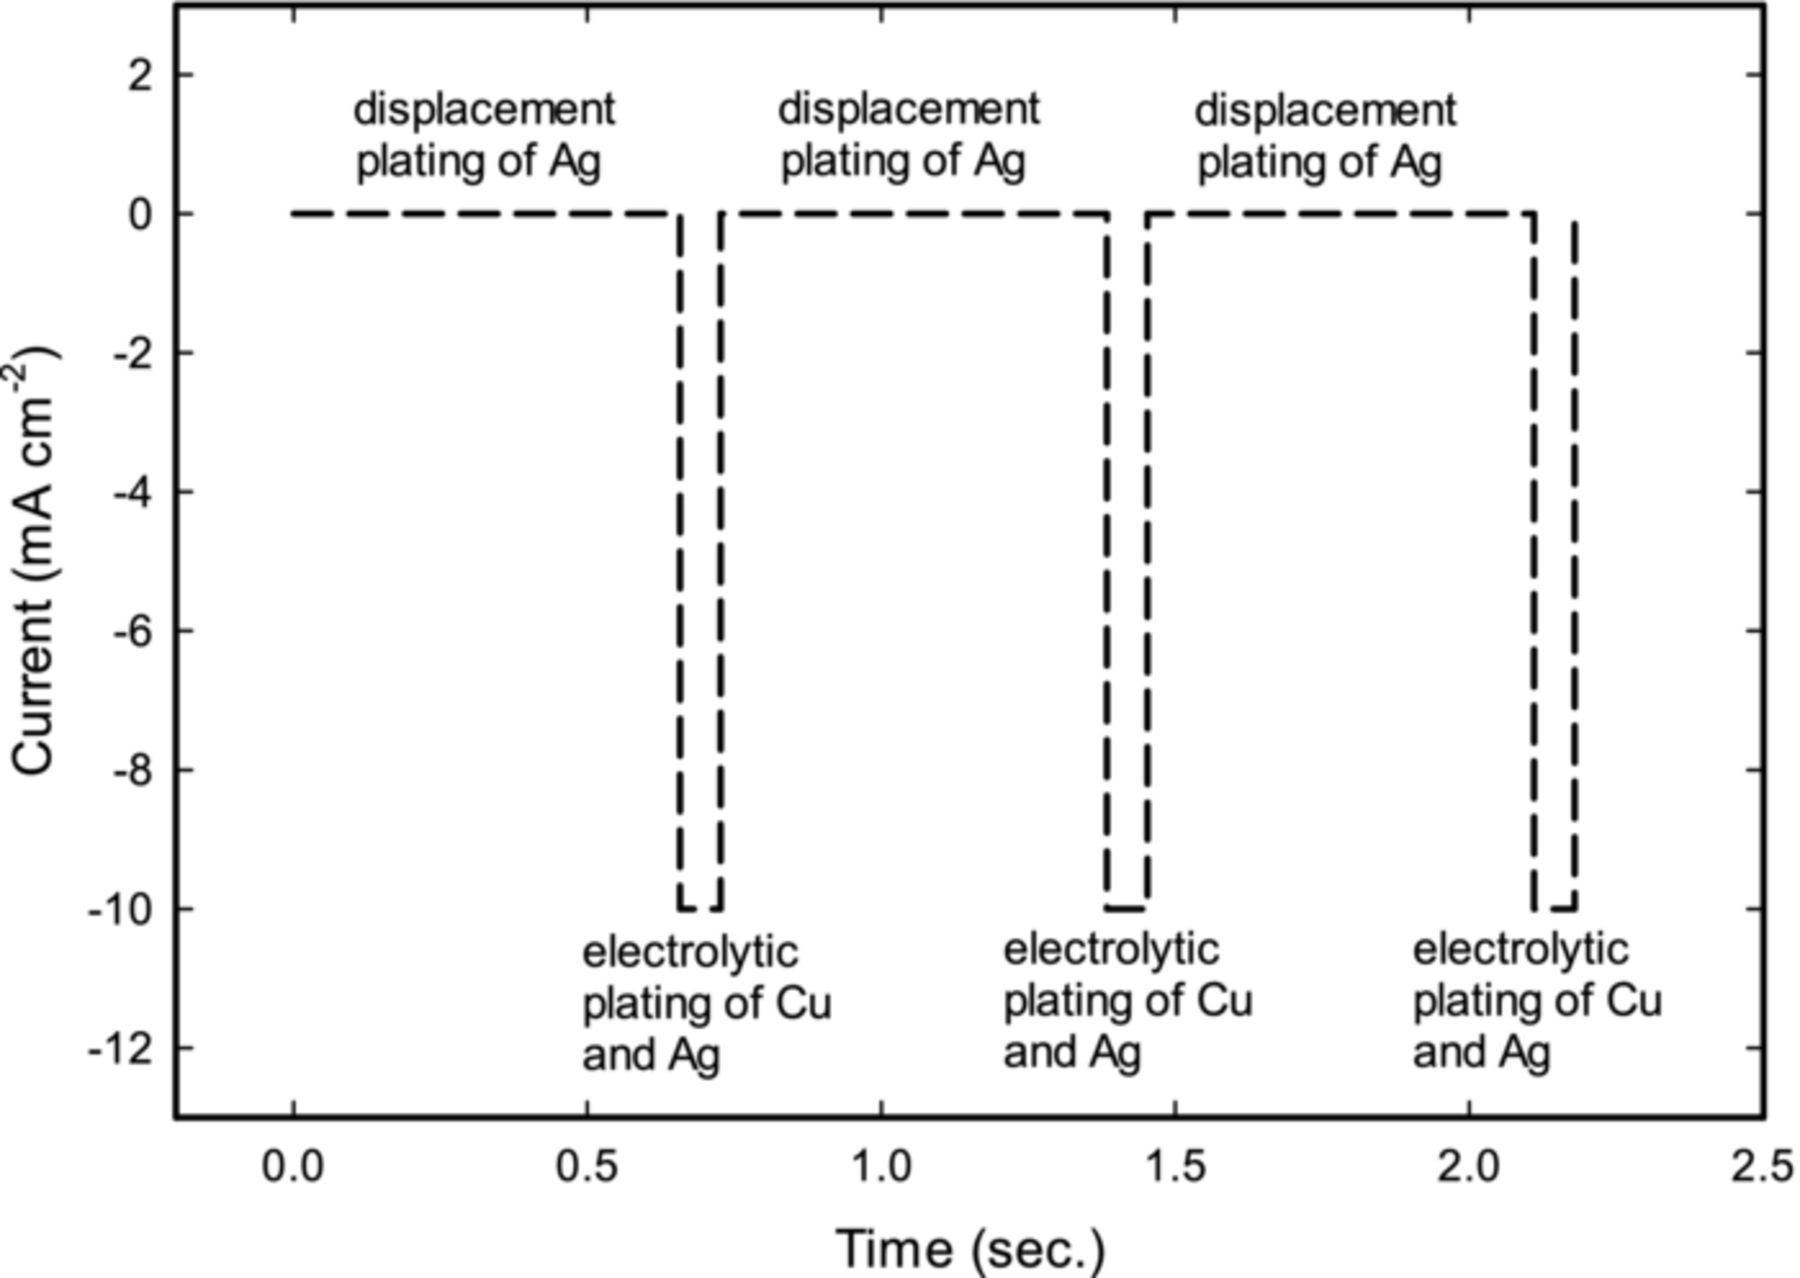
Figure 2. An example of the unipolar pulse-plating waveform that was employed for the deposition of Cu-Ag alloys. At zero current, Cu on the surface is replaced by silver; at negative current both Cu and Ag are galvanostatically plated. Duty cycle for the shown pulse is equal to 9.47% and frequency is 1.38 Hz.
The amount of Ag versus Cu in the alloy can be controlled by varying the duty cycle of the pulse (equation 2) and by regulating the pulse amplitude. However, to allow for the adequate deposition of Ag, duty cycle needs to be low (e.g. below 15%). The distribution of silver in the alloy can possibly be controlled by changing frequency of the pulse (equation 3), as was demonstrated by other researchers for similar systems.23,35 In the present study, due to the self-limiting nature of the displacement reactions and to ensure uniform metal distribution between Ag and Cu, the frequency was chosen as to deposit less than a monolayer of silver during a single pulse cycle based on Faraday's law.
![Equation ([2])](https://content.cld.iop.org/journals/1945-7111/159/11/D677/revision1/jes_159_11_D677eqn2.jpg)
![Equation ([3])](https://content.cld.iop.org/journals/1945-7111/159/11/D677/revision1/jes_159_11_D677eqn3.jpg)
To gain insight about the surface composition during deposition of Ag, the potential of the working electrode was measured at zero current. The measurements of the open-circuit potential (OCP) were performed at different concentrations of silver after an initial 30 seconds of plating at −10 mA cm−2. The thermodynamic difference between the reversible potentials of Cu and Ag is 0.46 V. However, the difference between the OCP of copper in the presence of a copper sulfate electrolyte without silver and the electrolyte with various amounts of silver (0.01 M, 0.0001 M, and 0.00001 M) was only about 7 mV. This behavior probably indicates that Ag does not form a complete monolayer on the Cu surface.
Estimation of the Cu-Ag alloy composition
The transport of silver ions to the surface can be well understood theoretically since the deposition of Cu-Ag films was conducted in a rotating disk electrode configuration. Based on the concentration of silver used, the flux of silver ions to the surface is mass-transport-limited and can be calculated using the Levich equation for a given  and rotation speed. In calculating the flux of ions, the kinematic viscosity was taken to be that of water, ν = 0.01 cm2 s−1. The diffusion coefficient of silver ion
  in various supporting electrolytes, such as KNO3 and HClO4, ranges from 1.53×10⁻⁵ to 1.62×10⁻⁵ cm2 s−1 at 25°C.36 Hotlos et al. measured diffusion coefficients of silver ion at various concentrations of CuSO4 and H2SO4.37 For the calculations of the limiting current of silver ions,
  = 1.03×10⁻⁵ cm2 s−1 was used, which was determined by Hotlos et al. in the electrolyte of similar composition to that used in this study.
During both on- and off- times silver ions discharge on the cathode at its limiting current. Accordingly, the rate of silver incorporation into the alloy can be directly calculated based on Faraday's law. For example, starting with  = 3.0 μM and rotation of 400 rpm, the limiting current is −1.18 μA cm−2 and the plating rate of Ag is then 2.62 ng s−1. Thus, to achieve an appreciable Ag content, the time-average Cu deposition rate must be substantially lowered. At such a slow deposition rate, one may worry about the practicality of the present deposition scheme. However, the rate is not unreasonable if one-wt% alloys are to be deposited in the narrow geometries of microelectronic devices where feature sizes may be less than 20 nm.9 For the subsequent deposition of the overburden where the Ag incorporation rate is not important, a DC plating protocol could be adopted to increase the deposition rate.
The weight percent of Ag in the Cu-Ag alloy was predicted by accounting for the mass-transfer-controlled deposition of Ag during both the off- and on-times, the galvanostatic deposition of Cu based on 100% current efficiency, and the oxidation of Cu during the off-times as shown in equation 4 (where w corresponds to the weight of species).
![Equation ([4])](https://content.cld.iop.org/journals/1945-7111/159/11/D677/revision1/jes_159_11_D677eqn4.jpg)
It was important to account for the loss of Cu by oxidation due to the long periods of off-time. The oxidation of the metallic copper can possibly happen both due to oxidation by the dissolved oxygen (reaction 5) and the comproportionation reaction between cupric ions and copper (reaction 6), which is driven by a difference in cuprous ion concentration between the surface and the bulk electrolyte.
![Equation ([5])](https://content.cld.iop.org/journals/1945-7111/159/11/D677/revision1/jes_159_11_D677eqn5.jpg)
![Equation ([6])](https://content.cld.iop.org/journals/1945-7111/159/11/D677/revision1/jes_159_11_D677eqn6.jpg)
Both reactions 5 and 6 can be anticipated to proceed in the forward direction since ΔUθ is positive. Based on thermodynamics, Cu should be oxidized by cupric ions until the surface concentration reaches a value at which overall reaction is not possible. Using the Nernst equation the equilibrium surface concentration of Cu+ can be estimated by setting ΔU = 0, which gives, according to equation 7,  = 6.13×10⁻⁴ M.
![Equation ([7])](https://content.cld.iop.org/journals/1945-7111/159/11/D677/revision1/jes_159_11_D677eqn7.jpg)
The oxidation rate of Cu can then be approximated by equation 8, where  is the cuprous-ion flux across the diffusion layer. The diffusion layer thickness δdiff can be defined by equation 9, where ν is a kinematic viscosity, Ω is a rotation rate, and
  = 0.43×10⁻⁵ cm2 s−1 (
 was assumed to be equal to the
  reported by Noulty et al.).38
![Equation ([8])](https://content.cld.iop.org/journals/1945-7111/159/11/D677/revision1/jes_159_11_D677eqn8.jpg)
![Equation ([9])](https://content.cld.iop.org/journals/1945-7111/159/11/D677/revision1/jes_159_11_D677eqn9.jpg)
The rate of oxidation of Cu due to etching by cupric-ions at 400 rpm is then predicted as 2.9 nm min−1.
The oxidation rate of Cu by dissolved oxygen is more difficult to predict because the dissolved oxygen concentration is not known with precision, and large discrepancies between the measured rate and that expected from the oxygen reduction current were reported.39 Therefore, the oxidation rate of Cu by O2 was instead estimated by experiment. When 1 μm of copper film was plated and directly removed from the electrolyte (0.63 M CuSO4·5H2O and 0.3 M H2SO4) and rinsed immediately after the deposition, the measured film amount was 99% of the expectation, indicating a near 100% current efficiency of copper plating. However, when plated copper film was left in the electrolyte for 15 minutes at 400 rpm, only 89.9% of copper remained on the electrode due to oxidation. Then, the oxidation rate of copper at 400 rpm due to both reactions 5 and 6 was determined from equation 10.
![Equation ([10])](https://content.cld.iop.org/journals/1945-7111/159/11/D677/revision1/jes_159_11_D677eqn10.jpg)
When copper film was left in 0.3 M H2SO4, 95% of the film remained. The oxidation rate of copper in sulfuric acid solution at 400 rpm was then equal to 2.7 nm min−1. Since Cu is not susceptible to corrosion by H2SO4, the oxidation in 0.3 M H2SO4 was probably due to the presence of dissolved O2. The measured oxidation rate was assumed to be constant and applied in the prediction of the weight percent of Ag in the alloy (see equation 4).
Measurement of the Cu-Ag alloy composition under various conditions
In the process of measuring silver concentrations with ICP-AES, it was discovered that the source of cupric ions (CuSO4·5H2O) contained trace silver impurity. As shown in Figure 3, the concentration of silver impurity in CuSO4·5H2O was in the range of our operating concentrations (non-linearity in the data was probably due to experimental uncertainty). After contacting several major chemical suppliers (such as Sigma-Aldrich, Fisher Scientific, and Alfa Aesar), it was found that CuSO4·5H2O is not tested for trace silver metal impurity and cannot be guaranteed as silver-free. Therefore, even the 99.995% trace metal basis CuSO4·5H2O contained silver impurity, as was revealed in our experiments and then confirmed by a representative from Sigma-Aldrich.40 Also, silver concentration was found to vary across different lots of CuSO4·5H2O. Therefore care was to be taken to account for Ag already present in CuSO4·5H2O.
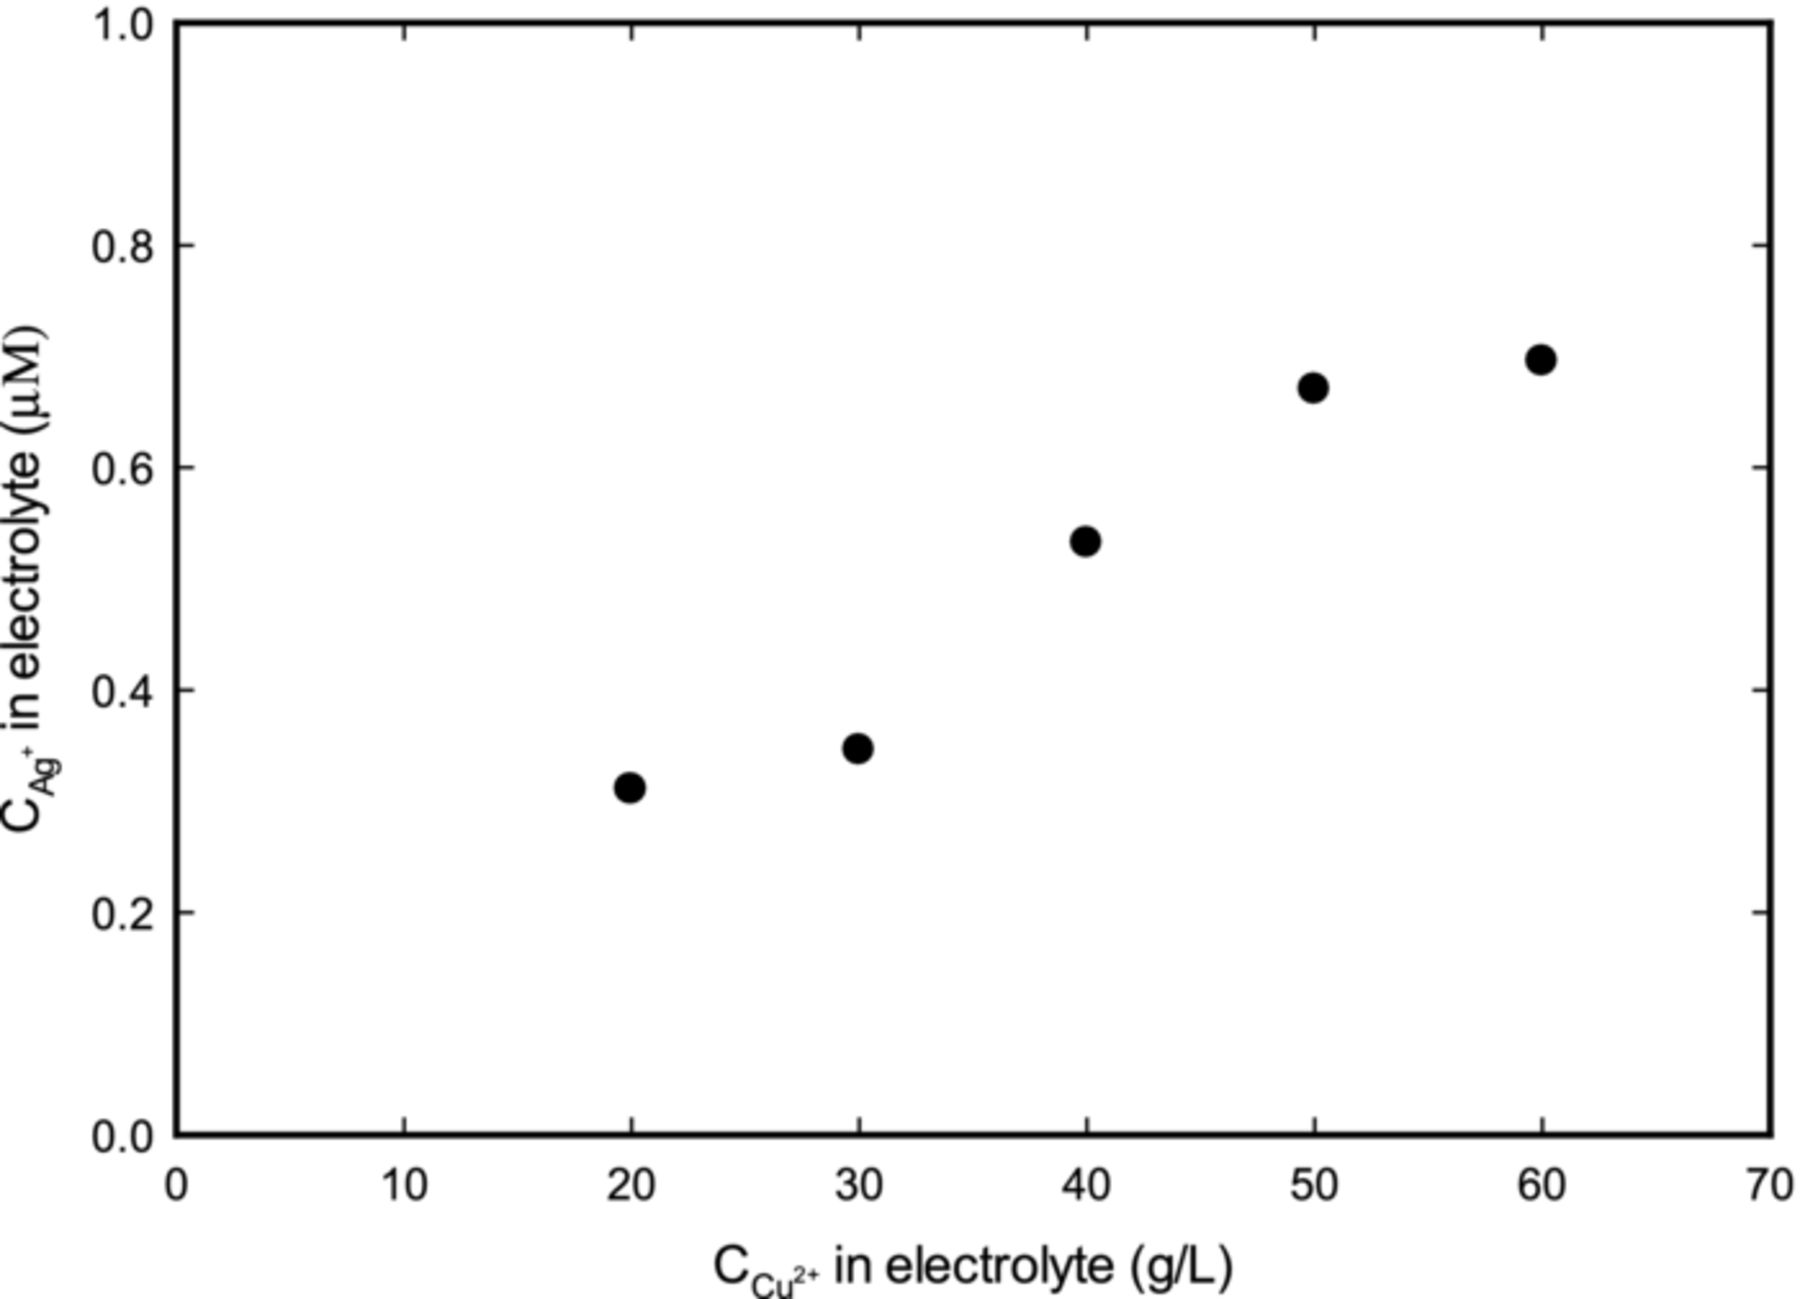
Figure 3. Concentration of Ag as a function of ionic copper from a specific lot of CuSO4·5H2O. Figure shows the presence of Ag, even though Ag was not added to solution. This is because CuSO4·5H2O already contains Ag as an impurity.
The control of silver content in the alloy was established under various conditions. Figure 4 demonstrates how the presence of chloride and organic additives (namely PEG and SPS) affected the incorporation of Ag in the film at various concentrations of silver in the electrolyte. In the absence of chloride and organic additives, experimental results agree with the theoretical estimates, shown by a straight line in Figure 4. In the presence of PEG and SPS, however, the incorporation of Ag was about 20% less than expected. The lower deposition rate of Ag in the presence of additives was possibly due to a chelating action of additives to Ag+ ions. A similar impact of additives on a plating rate of Ag was also observed by Strehle et al.22 The incorporation of Ag into the alloy was unaffected by the presence of 1 ppm (2.82×10⁻⁵ M) of chloride. However, when Cl concentration was 10 ppm, silver incorporation into the alloy leveled at around  = 2 μM. This behavior was consistent with measurements of Ag+ solubility described above, where the saturation concentration of Ag was 1.9 μM at
  = 10 ppm
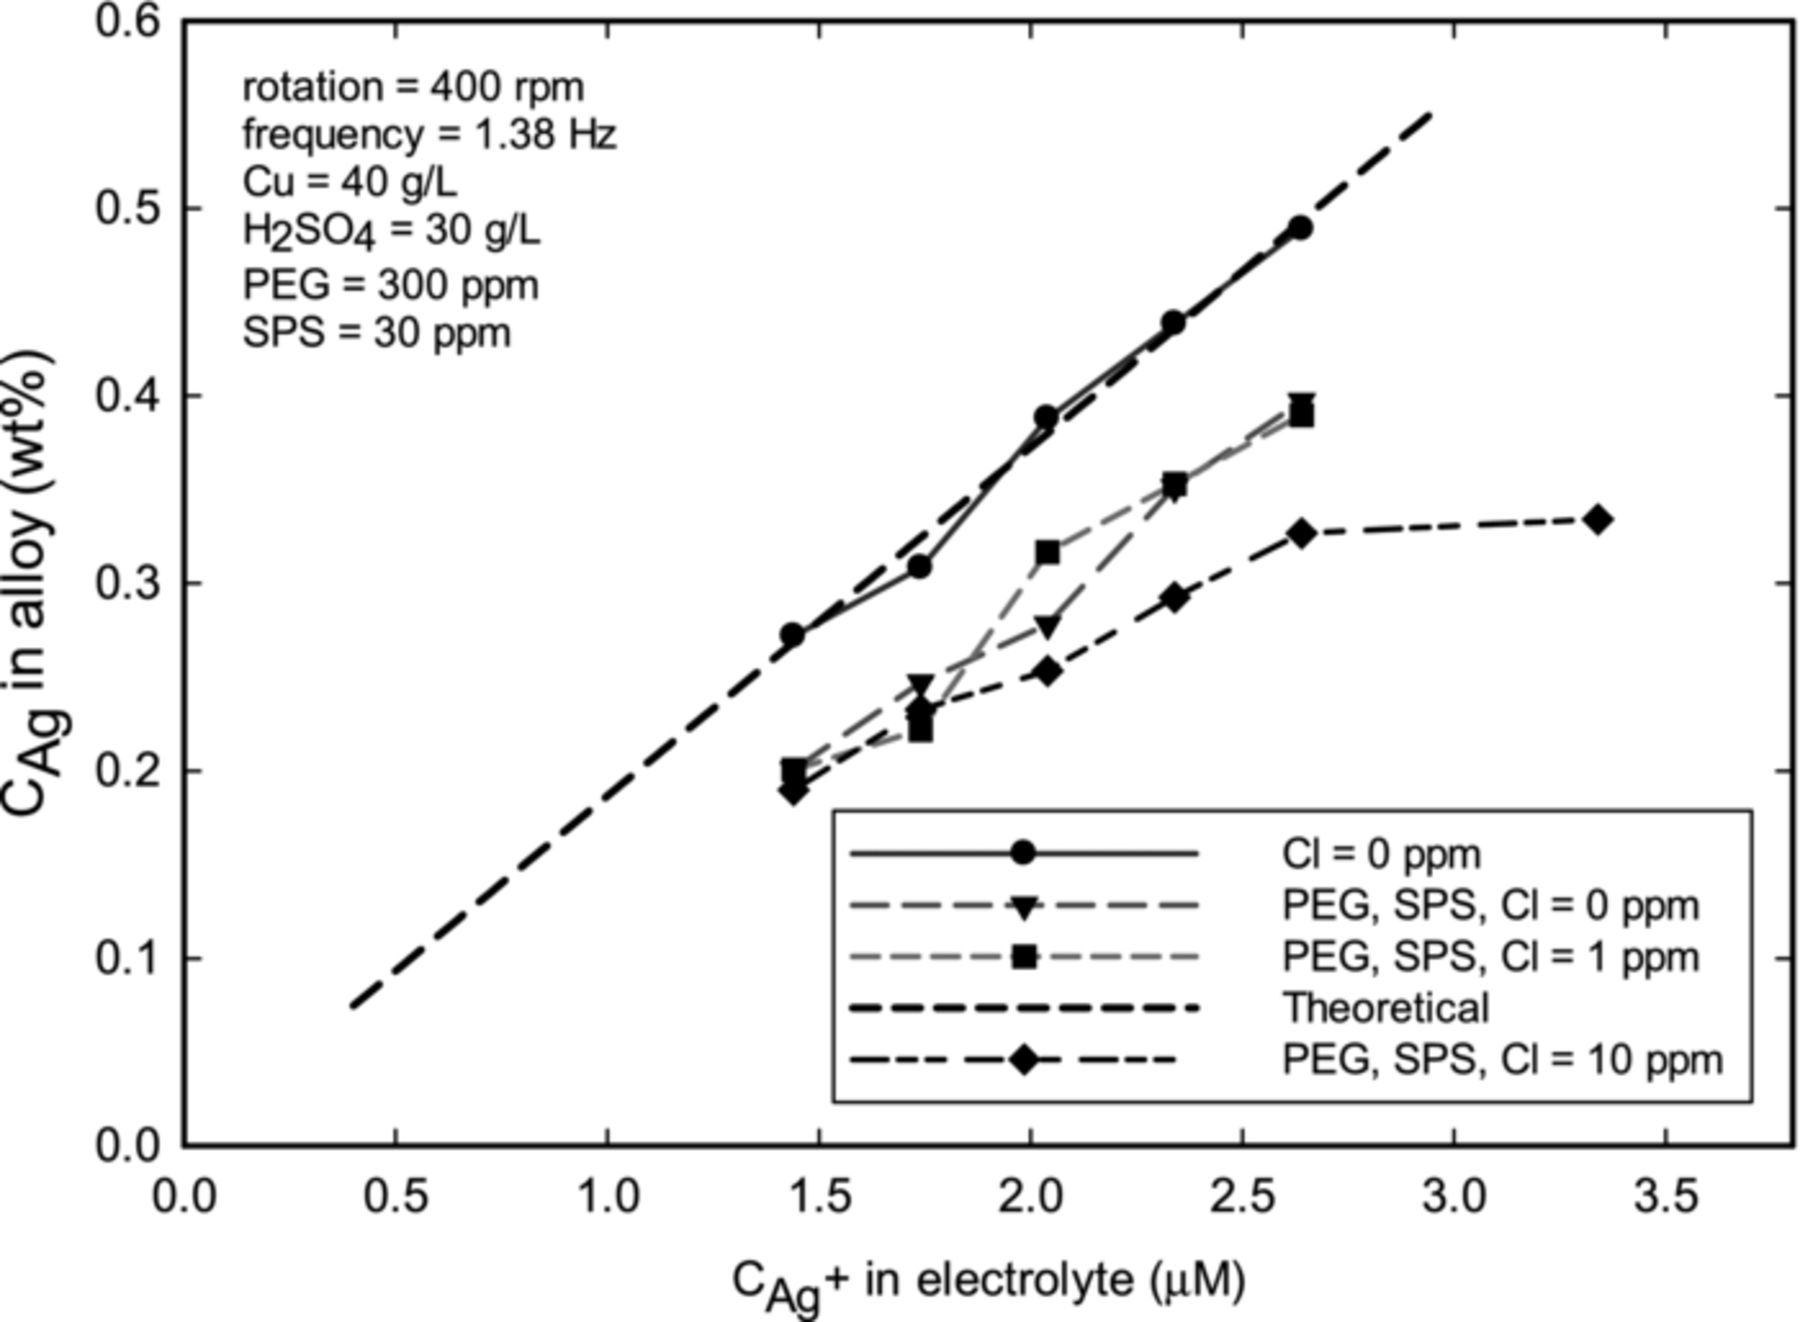
Figure 4. Composition of Ag in the alloy as a function of ionic Ag in the electrolyte, obtained at 400 rpm, 9.47% duty cycle, 1.38 Hz frequency, and ion = −10 mA cm−2 (the nominal thickness is 226 nm). Straight line shows the theoretical values (assuming mass transfer controlled Ag deposition). The data demonstrates lower plating rate of Ag in the presence of PEG and SPS, and also how the solubility AgCl affects silver content in the film.
It was hypothesized that frequency of the current pulse would not to affect composition of the alloy, because frequency does not alter total off- and on-times. Electroplating of film alloys at various frequencies was performed to confirm this hypothesis. Results showed little variation of Ag content at frequencies ranging from 0.5–5 Hz (not shown).
The impact of rotation speed on the weight percent of Ag in the alloy was investigated, and results are shown in Figure 5. Rotation of an RDE controls the flux of ions to the electrode's surface, and therefore enables to determine the effect of flow on the film composition. According to Levich equation, during mass-transfer-controlled deposition of silver, the reaction rate should be directly proportional of the square root of the rotation speed. This behavior was confirmed experimentally, as shown by Figure 5. Again, a decrease in measured silver content from estimated values (shown by the straight line) were attributed to the presence of organic additives in the electrolyte. A similar impact of additives on plating rate of Ag was demonstrated in Figures 4 as well.

Figure 5. Composition of Ag in alloy as a function of rotation speed. The electrodeposition was performed at 1.38 Hz, 9.47% duty cycle, and ion = −10 mA cm−2. The straight line shows theoretical estimates assuming mass transfer controlled Ag deposition. The nominal thickness was kept at 226 nm.
Decreasing the duty cycle of the square pulse was anticipated to increase the Ag incorporation. Indeed, as shown in Figure 6, the amount of Ag increased at lower values of duty cycle and decreased at higher values. Although it was possible to increase the weight percent of Ag above 1 wt% of by lowering the duty cycle, there was a practical limit driven by the oxidation of Cu at long off-times (i.e. low duty cycles). The amount of Ag in the alloy was then limited practically, since it took increasingly longer times to deposit a certain film thickness. The experimental values again are lower than theoretical estimates due to the presence of organic additives in the electrolyte, as discussed above.
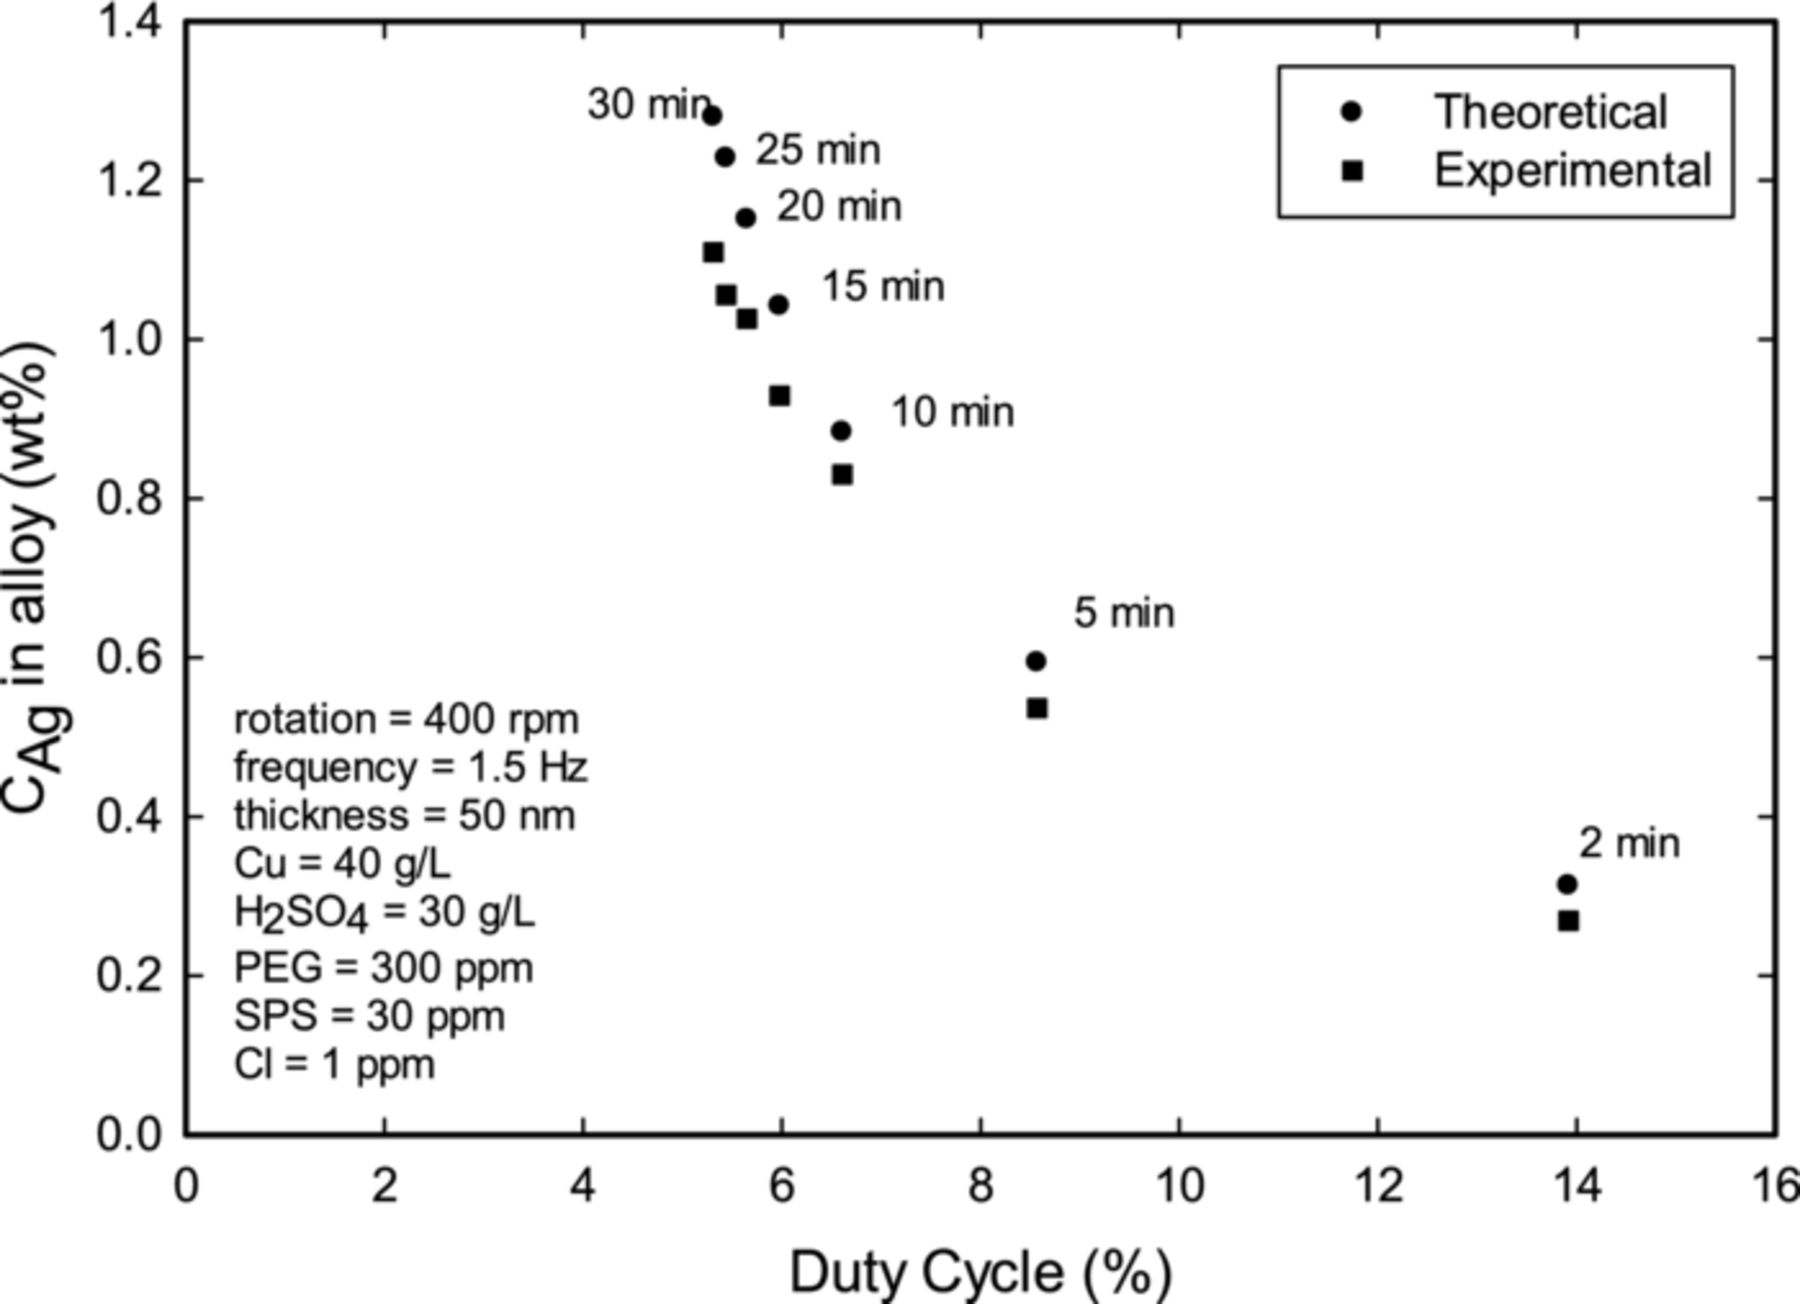
Figure 6. Effect of duty cycle on the variation of Ag in the alloy. The electrodeposition was performed at 400 rpm, 1.38 Hz, and ion = −10 mA cm−2, while keeping the nominal thickness at 50 nm. The times labeled above the data points indicate the off-time required to reach an estimated thickness of 50 nm.
Measurement of surface quality and compositional depth profile
Cu-Ag films prepared by pulse-plating were found to exhibit significant roughness. The roughness of a pulse-plated sample from a bath containing PEG, SPS, and 10 ppm of Cl− (Figure 7a) was about ten times more than DC-plated sample from the same bath (Figure 7b). It was found that adding a leveling agent, such as polyvinylpyrrolidone (PVP),41 to the electrolyte could substantially reduce film roughness to the levels seen in Figure 7b. The electrodeposition of Cu-Ag alloys showed that PVP had minimal or no effect on the incorporation of Ag into the film.
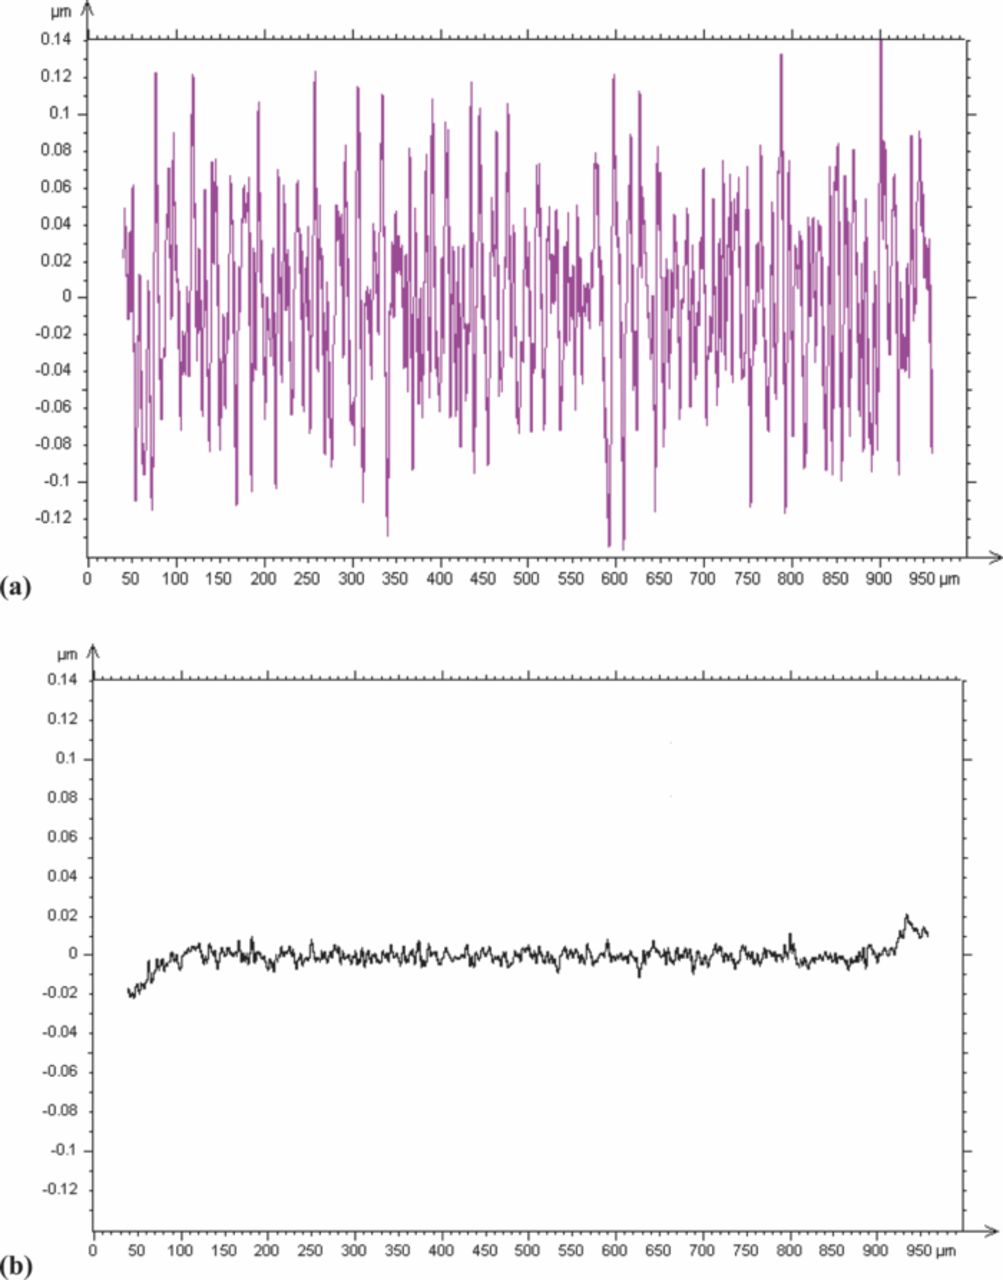
Figure 7. Roughness profile of the thin films plated at 400 rpm by (a) pulse-plating from bath with PEG, SPS, and Cl (10 ppm); (b) DC plating with PEG, SPS, and Cl (10 ppm). Pulse plating was done at duty cycle of 9.47% and frequency of 1.38 Hz.
The concentration of Cl in the electrolyte had a significant impact on the quality of the plated Cu-Ag films. Figure 8 shows SEM images of the Cu-Ag deposits with 0.3 wt% Ag plated at two different chloride concentrations: 1 ppm and 10 ppm. At  (Figure 8a), deposits were discontinuous and contained voids; while, at
  (Figure 8b), films showed relatively uniform surface coverage with large grains. The discontinuous films likely have decreased trench filling ability. Annealing is usually used to obtain better material properties of deposits. Therefore, sample shown in Figures 8a was annealed at 250°C for 30 minutes with a continuous Ar gas flow to investigate the effect of heat-treatment. However, annealing this sample had almost no effect on the final quality of the film.
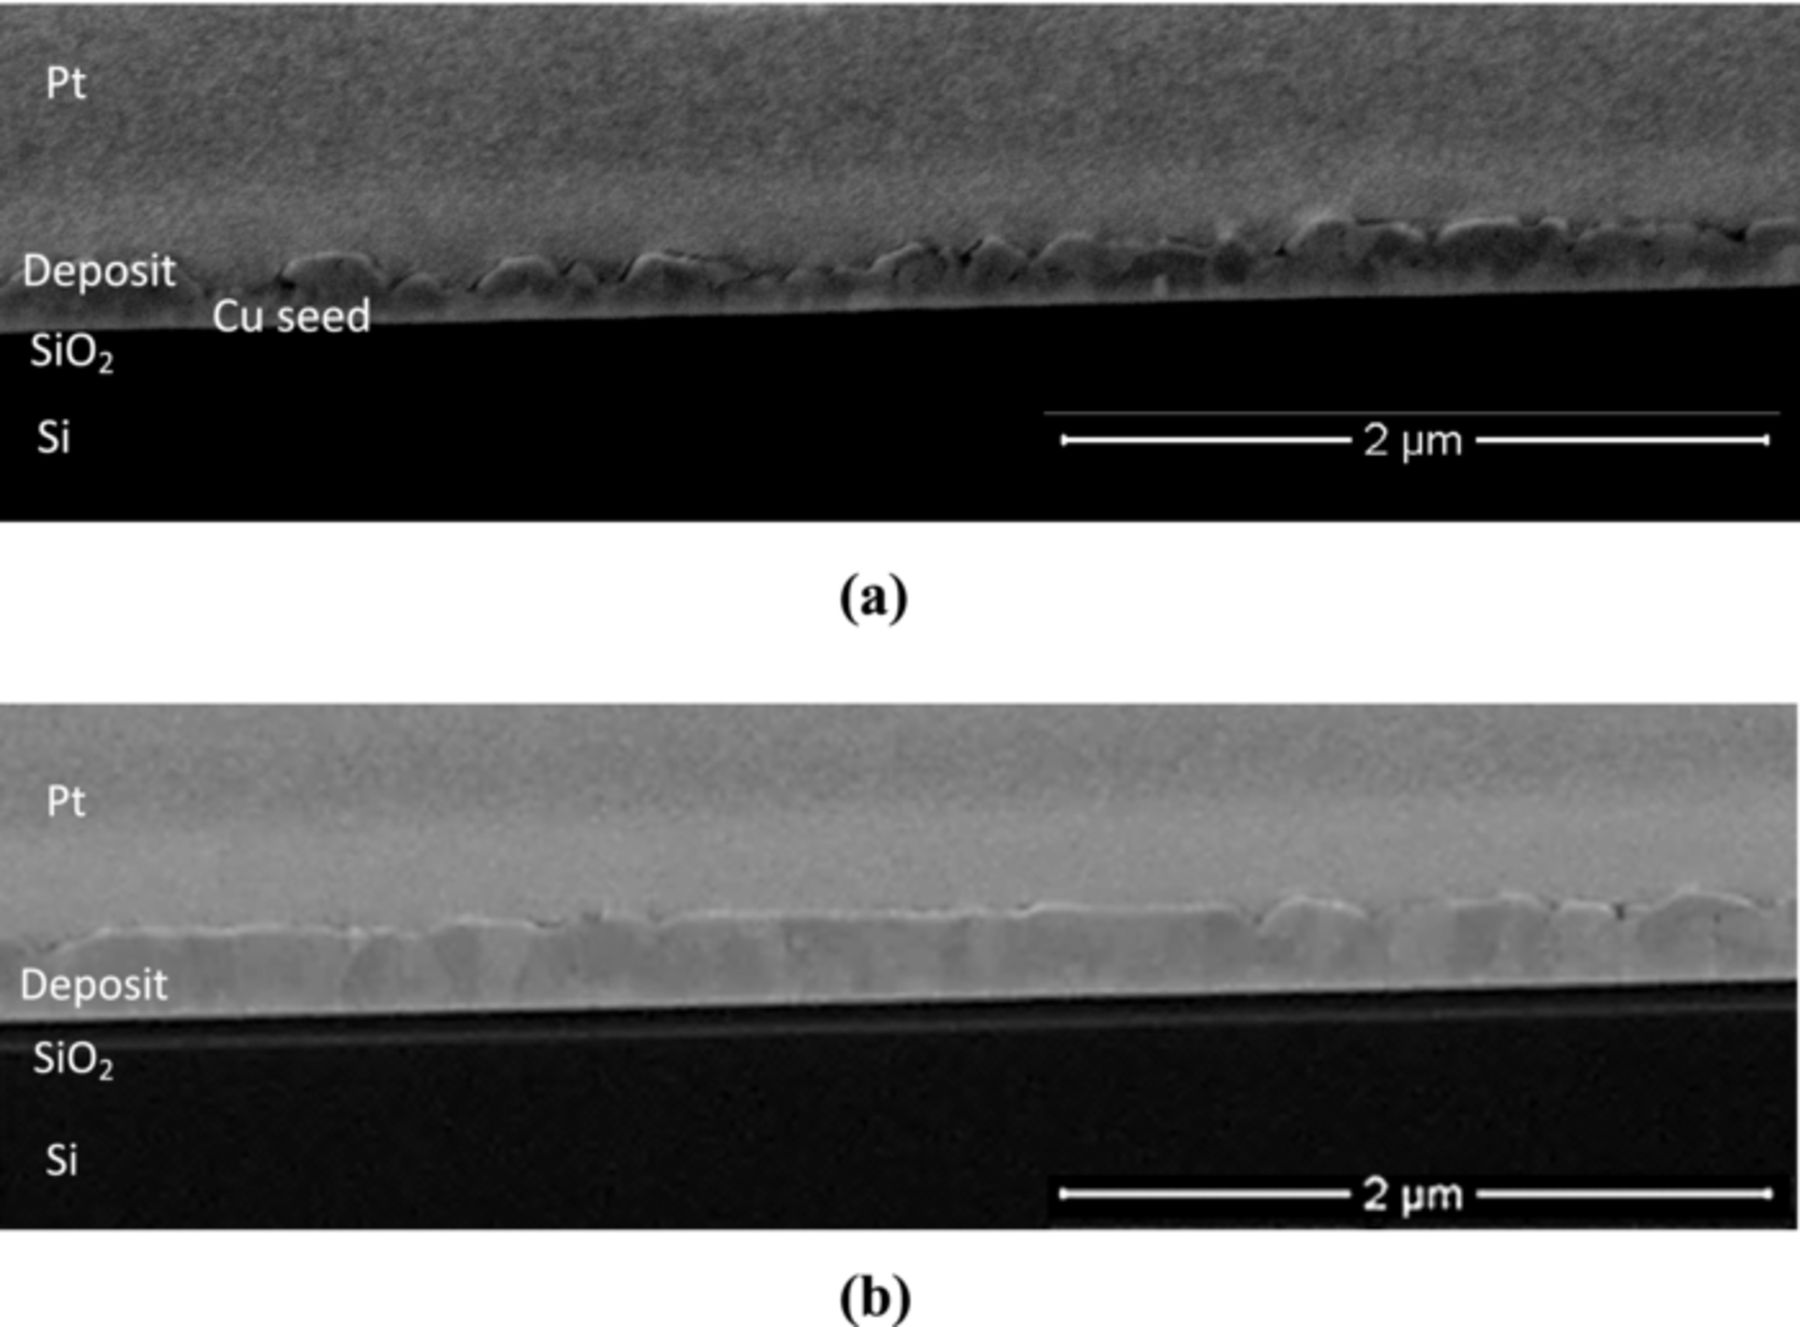
Figure 8. Scanning electron images taken at the center of the Cu-Ag alloy thin films before heat-treatment. Samples were plated at 400 rpm and 9.47% duty cycle from the electrolyte containing PEG, SPS, PVP,  = 1.7 μM, at two different chloride concentrations. (a) cross-section view, at
  , nominal thickness 120 nm, 0.3 wt% Ag; (b) cross-section view,
  , nominal thickness 230 nm, 0.3 wt% Ag.
Furthermore, cross-sectional views showed that the deposits were about 33% thicker at the edges than at the center (not shown). This variation was consistent with the analysis of current distribution profile on an RDE. At the studied conditions the Tafel Wagner number (WaT) for an RDE can be defined by equation 11.42 Hence, the Wagner number is equal to 0.73, for ac = 0.5, iavg = 10 mA cm−2, and k = 113.22 mS cm−1. According to Newman's treatment of secondary current distribution42 this Wagner number in fact predicts 33% thickness increase at the edge of a disk electrode.
![Equation ([11])](https://content.cld.iop.org/journals/1945-7111/159/11/D677/revision1/jes_159_11_D677eqn11.jpg)
The compositional depth profiles of the Cu-Ag films were examined by ToF-SIMS. Figure 9 shows a profile of the Cu-Ag film plated from an electrolyte with PEG, SPS, PVP,  , and
, and  . Initially, there was a surface oxidation peak which decreased until the native oxide was sputtered away and the non-oxidized Cu-Ag alloy was reached. This surface oxide enhanced ionization efficiency of all trace elements, and did not indicate higher concentrations near the surface.43 The disappearance of the oxide could be taken as where the oxygen peak plateaued, which also matched with where the Cu signal stabilized (not shown). The SIMS profile in figure 9 shows that the Ag as well as other impurities were uniformly distributed throughout the thickness of the film, probably implying no interface segregation. Annealing the samples slightly increased the thickness of the surface oxide, but the effect was minor. From the ToF-SIMS profile, the silver content was measured at about 0.3 wt%, which matches well with ICP-AES measurements.
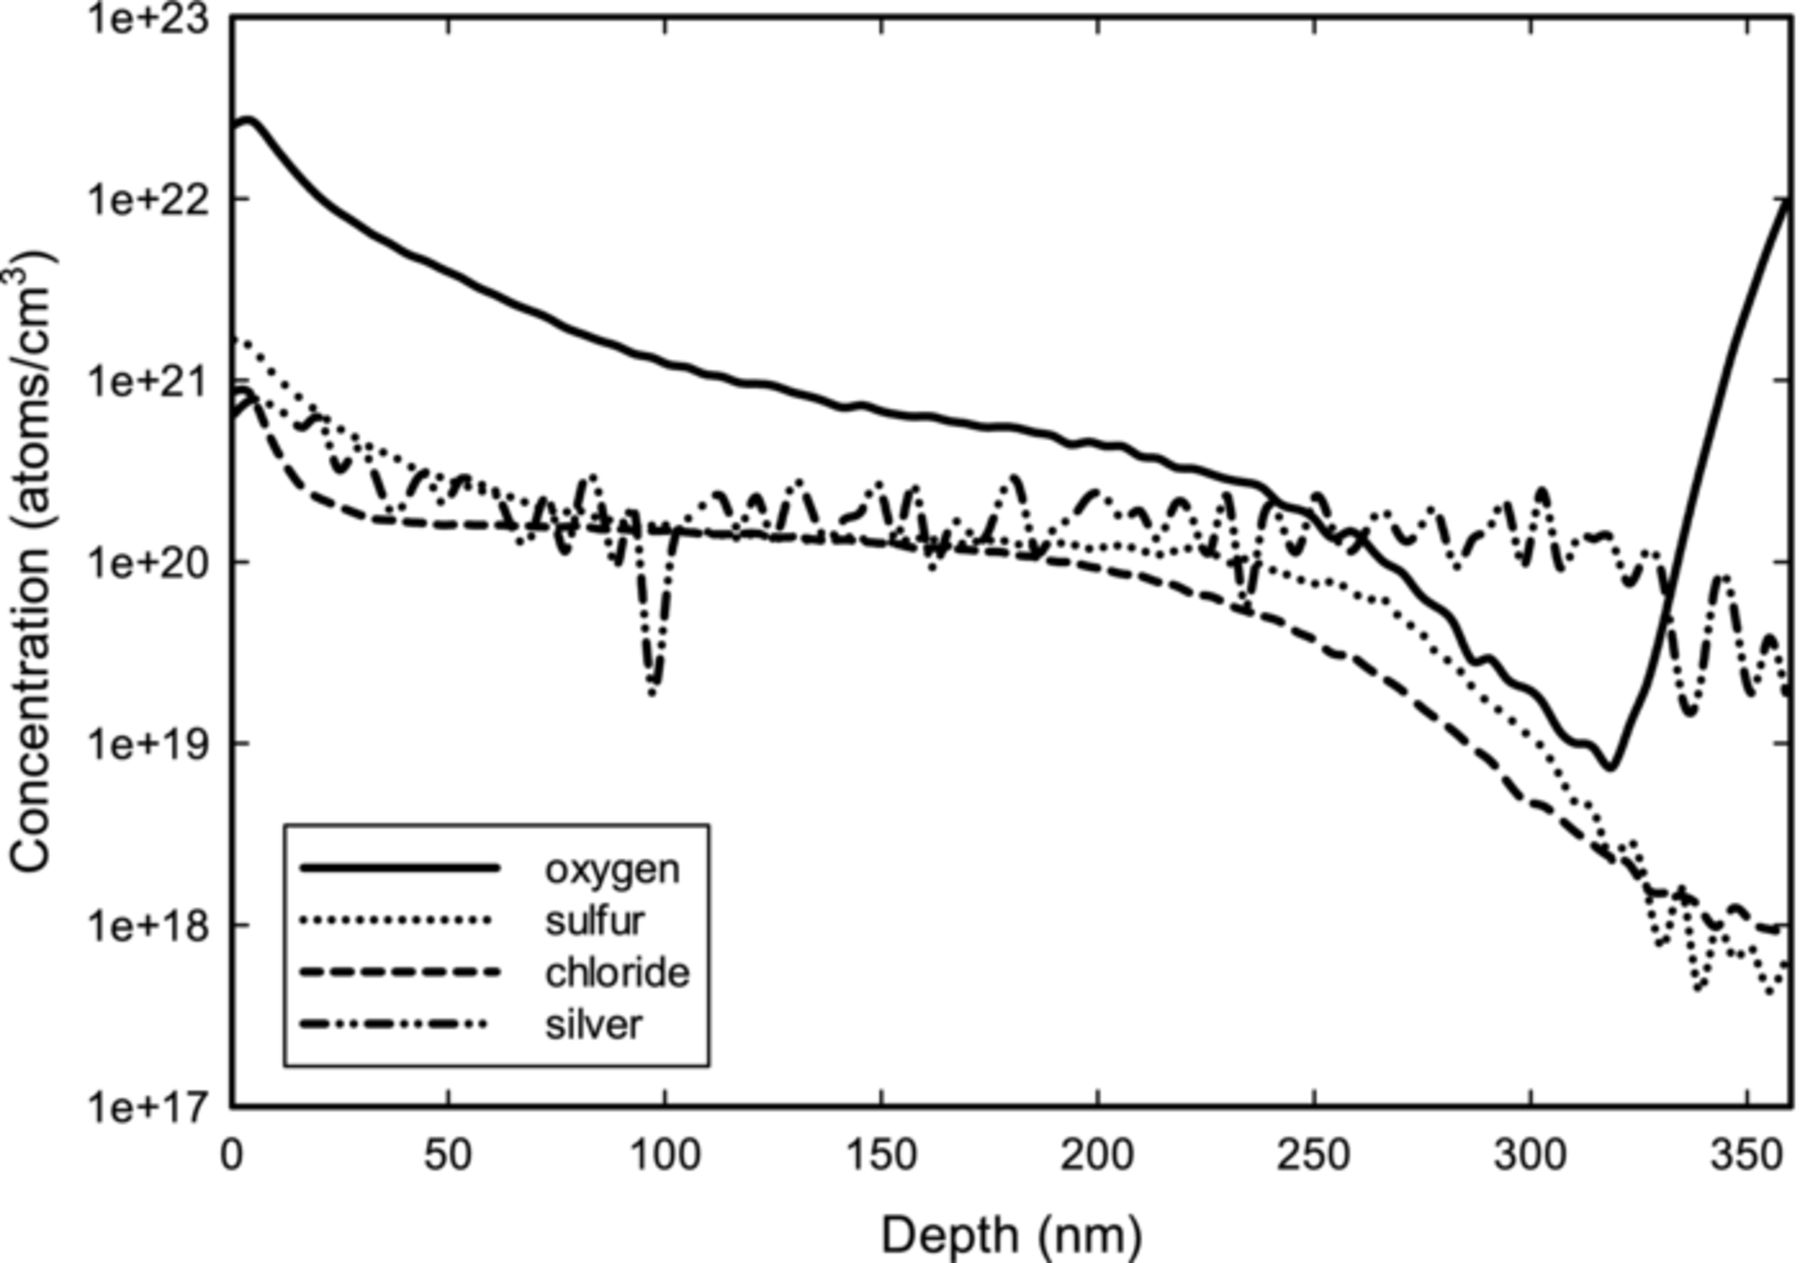
Figure 9. ToF-SIMS depth profile of the Cu-Ag film plated from an electrolyte with PEG, SPS, PVP,  , and
, and  . Film was deposited at 400 rpm and 9.47% duty cycle for a nominal thickness of 230 nm. Silver content shown in the figure is about 0.3 wt%.
Conclusions
The present study examined electrodeposition of Cu-Ag alloys at a substantial chloride concentration by the application of pulsed plating. It was demonstrated that Ag incorporation into the alloy can be controlled by changing concentration of Ag+, rotation speed, and duty cycle. The organic additives were found to decrease the deposition rate of Ag by about 20%. It was also discovered that CuSO4·5H2O from a number of major chemical suppliers contained Ag as impurity. The loss of Cu due to oxidation during off-time considerably influenced the fraction of Ag in the alloy. The pulse-plating conditions created significant film roughness. However, addition of a leveling agent helped to reduce roughness of the plated Cu-Ag films. The chloride concentration was shown to have a critical impact on the behavior of a leveling agent. At 1 ppm of chloride, films contained voids and were discontinuous, while at 10 ppm of chloride continuous deposits with large grains were obtained.
Acknowledgments
The authors thank Greeshma Gadikota of Columbia University for assistance in using ICP-AES. They would also like to thank Atotech USA Inc. for financial support of this work.