Abstract
The performance degradation of graphite/LiNi1/3Mn1/3Co1/3O2 (NMC) lithium ion cells, charged and discharged up to 300 cycles at different operating conditions of temperature and upper cutoff potential (4.2V/25°C, 4.2V/60°C, 4.6V/25°C) was investigated. A combination of electrochemical methods with X-ray diffraction (XRD) both in situ and ex situ as well as neutron induced Prompt-Gamma-Activation-Analysis (PGAA) allowed us to elucidate the main failure mechanisms of the investigated lithium ion cells. In situ XRD investigations of the NMC material revealed that the first cycle irreversible capacity is the cause of slow lithium diffusion kinetics. In full-cells, however, this "lost" lithium ions can be used to build up the SEI of the graphite electrode during the initial formation cycle. A new systematic approach to correlate the lithium content in NMC with its lattice parameters (c, a) allows a convenient quantification of the loss of active lithium in aged cells by determining the c/a ratio of harvested NMC cathodes in the discharged state using ex situ XRD. Besides loss of active lithium, transition metal dissolution/deposition on graphite and growth of cell impedance strongly effect cell aging, especially at elevated temperatures and high upper cutoff potentials.
Export citation and abstract BibTeX RIS

This is an open access article distributed under the terms of the Creative Commons Attribution Non-Commercial No Derivatives 4.0 License (CC BY-NC-ND, http://creativecommons.org/licenses/by-nc-nd/4.0/), which permits non-commercial reuse, distribution, and reproduction in any medium, provided the original work is not changed in any way and is properly cited. For permission for commercial reuse, please email: oa@electrochem.org.
Besides their current use in portable power electronics, lithium ion batteries have recently been used for battery electric vehicles (BEV) and are envisioned for large-scale energy storage. For the latter applications, life times of >10 years are required so that it is essential to understand and quantify the mechanisms that contribute to battery failure. Among the commercially available lithium-ion battery chemistries,1,2 the graphite/LiNi1/3Mn1/3Co1/3O2 (NMC) system is one of the materials currently envisioned for automotive applications.3 This cathode material demonstrates high capacity, good structural stability due to its small volume changes (<2%) during Li insertion and extraction, and high thermal stability in the charged state.4–6 In addition, this material could theoretically be operated with high charge cutoff potentials up to 5.0 V, as its bulk structure is claimed to be stabilized by the presence of Mn4+,7 even though other authors suggest that irreversible structural changes occur at these very high potentials and at high temperature.8 Due to its sloped potential profile, the capacity and also the average cell voltage increase with increasing charging potential.7,9
Despite the improved safety and cycling performance of NMC material, operating NMC based cells (full-cells or half-cells) at elevated temperatures or at high charge potential leads to poor cycle life.10–13 During cycling of graphite/NMC full-cells, transition metal dissolution from the NMC material is found to be a crucial factor controlling capacity fade.11,12 In one of these studies, Zheng et al. demonstrated that upper cutoff potentials of >4.3 V lead to transition metal dissolution from NMC and thus compromise cycling performance.12 Based on half-cell experiments, Gallus et al. proposed that transition metal dissolution is promoted by an acidic corrosion reaction due to the presence of HF,13 suggested to be produced by the reaction of LiPF6 salt with trace water in standard electrolytes.14 Removal of transition metals from the NMC structure not only affects cathode performance (loss of active material and/or structural changes of the particle surface), but also strongly influences the anode through the deposition of dissolved transition metals on the graphite surface. Already small amounts of Ni, Mn, and Co on the anode can result in enhanced electrolyte decomposition and impedance rise of the cell.15–18
In addition to increased anode impedance, it is also hypothesized that part of the capacity loss observed in full-cells in the presence of dissolved manganese is due to the continuous loss of active lithium.19,20 This is explained by the incorporation of manganese into the solid electrolyte interface (SEI) of the anode (see, e.g., Xiao et al.21), where it is believed to catalyze solvent reduction with a concomitant loss of active lithium.22 The latter is confirmed by model experiments with a copper electrode,17 demonstrating an increase in electrolyte reduction charge with increasing manganese content of the SEI layer on the copper anode. It is hypothesized by Burns et al.20 that these two different capacity fading phenomena can be discerned in the capacity versus cycle life features in graphite/NMC full-cells: a gradual capacity loss caused predominantly by active lithium loss, and a more sudden capacity loss (referred to by the authors as "rapid rollover capacity loss") caused predominantly by anode impedance growth. While the latter can be reasonably well quantified by AC impedance in full-cells, quantification of active lithium loss currently cannot be done without cell disassembly followed by building half-cells with the harvested electrodes.
In this study, we examine the cycling stability of graphite/NMC full-cells at different operating temperatures (25°C, 60°C) and with different positive cutoff potentials (4.2 V, 4.6 V), seeking to deconvolute the above discussed aging mechanisms, viz., transition metal dissolution, active lithium loss, and impedance growth. The main diagnostic focus is put on structural analysis via X-ray diffraction (XRD), which will be used to quantify both the irreversible capacity loss (ICL) of NMC during the first cycle and the active lithium loss over extended charge/discharge cycling: first, in situ XRD measurements are used to establish a correlation between lithium content in NMC; subsequently, post-mortem ex situ XRD of aged NMC cathodes is used to quantify the active lithium loss. The latter will be confirmed by half-cell measurements on harvested aged NMC cathodes. AC impedance on full-cells and rate capability curves of half-cells built with harvested aged graphite and NMC electrodes are used to examine the impedance buildup during aging, which is most pronounced for cycling at high positive cutoff potential. Neutron based Prompt Gamma Activation Analysis (PGAA) of harvested graphite electrodes is used to quantify the amount of deposited transition metals. Our study confirms that the gradual capacity loss at low positive cutoff potentials both at 25 and 60°C is indeed caused by active lithium loss while the "rapid rollover capacity loss" is caused mostly by an increase in anode and cathode impedance.
Experimental
Electrode preparation
Cathodes based on commercial LiNi1/3Mn1/3Co1/3O2 (NMC) active material were prepared by dispersing NMC (96 wt%), polyvinylidene difluoride (PVdF, Kynar HSV 900, Arkema, France) (2 wt%), and carbon black (Super C65, TIMCAL, Switzerland) (2 wt%) in N-methyl-2-pyrrolidone (NMP, Sigma Aldrich, Germany) and mixing them altogether in a planetary centrifugal vacuum mixer (Thinky, USA) at 2000 rpm for 10 min. The resulting viscous slurry with a solids content of 1.9 g/ml was cast onto a thin aluminum foil (thickness 18 μm, MTI corporation, USA) using the doctor blade method (RK Print Coat Instruments, UK). After drying at room temperature, electrodes with 10 mm diameter were punched and then dried at 120°C for 3 h under dynamic vacuum in a glass oven (Büchi oven, Switzerland). The NMC loading of all tested electrodes was 15.0 ± 0.2 mgNMC/cm2 with an electrode thickness of ≈90 μm. For the in situ XRD measurements, NMC cathodes with 18.4 ± 1.1 mgNMC/cm2 (thickness of ≈110 μm) were prepared by applying the slurry through a mask (12 mm diameter circle) onto an aluminum foil with a diameter of 42 mm, whereby the aluminum foil serves both as current collector and X-ray window.
Graphite electrodes were produced analogously, using a mixture of 95 wt% graphite (SGL Carbon, Germany) and 5 wt% PVdF binder in NMP (solids content of 0.88 g/ml). Copper foil was used as a current collector (10 μm, MTI corporation, USA) from which electrodes with a diameter of 11 mm diameter were punched out. For graphite/NMC cells cycled between 3.0 and 4.2 Vcell, the graphite loading was 7.4 ± 0.2 mggraphite/cm2 (thickness of ≈90 μm), while it was 9.3 ± 0.2 mggraphite/cm2 (thickness of ≈100 μm) for cells cycled between 3.0 and 4.6 Vcell. The different graphite loadings were necessary to adjust the areal capacity of the graphite anodes to the voltage dependent areal capacity of the NMC cathodes, so that a constant capacity balancing factor of 1.2 (mAh/cm2anode)/(mAh/cm2cathode) could be achieved (assuming capacities of 150 and 190 mAh/gNMC at 4.2 and 4.6 Vcell, respectively).
Electrochemical characterization
For the graphite/NMC full-cell cycling studies, Swagelok T-cells were assembled in an argon filled glove-box (H2O and O2 content < 0.1 ppm, MBraun, Germany) using two glass fiber separators (glass microfiber filter, 691, VWR, Germany; 11 mm diameter). For three-electrode measurements (e.g., in Figure 7a), a 450 μm thick lithium foil (Rockwood Lithium) was used as reference electrode. The cells were filled with 80 μl LP57 electrolyte (1 M LiPF6 dissolved in EC:EMC 3:7 wt% <20 ppm H2O, BASF, Germany). Electrochemical tests were carried out in a climatic chamber (Binder, Germany) using a battery cycler (Series 4000, Maccor, USA). Two formation cycles between 3.0 and 4.2 V were performed at C/10 at 25°C to produce a stable SEI on the graphite electrode. To study the effect of temperature and upper cutoff voltage during long-term cycling at 1C for both charge and discharge, cells were cycled under three conditions: between 3.0 V and 4.2V at 25°C (referred to as 4.2V/25°C), between 3.0 V and 4.6 V at 25°C (referred to as 4.6V/25°C), and between 3.0 and 4.2 V at 60°C (referred to as 4.2V/60°C). The charging process is always accompanied by a constant voltage step with current limitation at C/20. Under each condition, two cells were tested for up to 300 cycles.
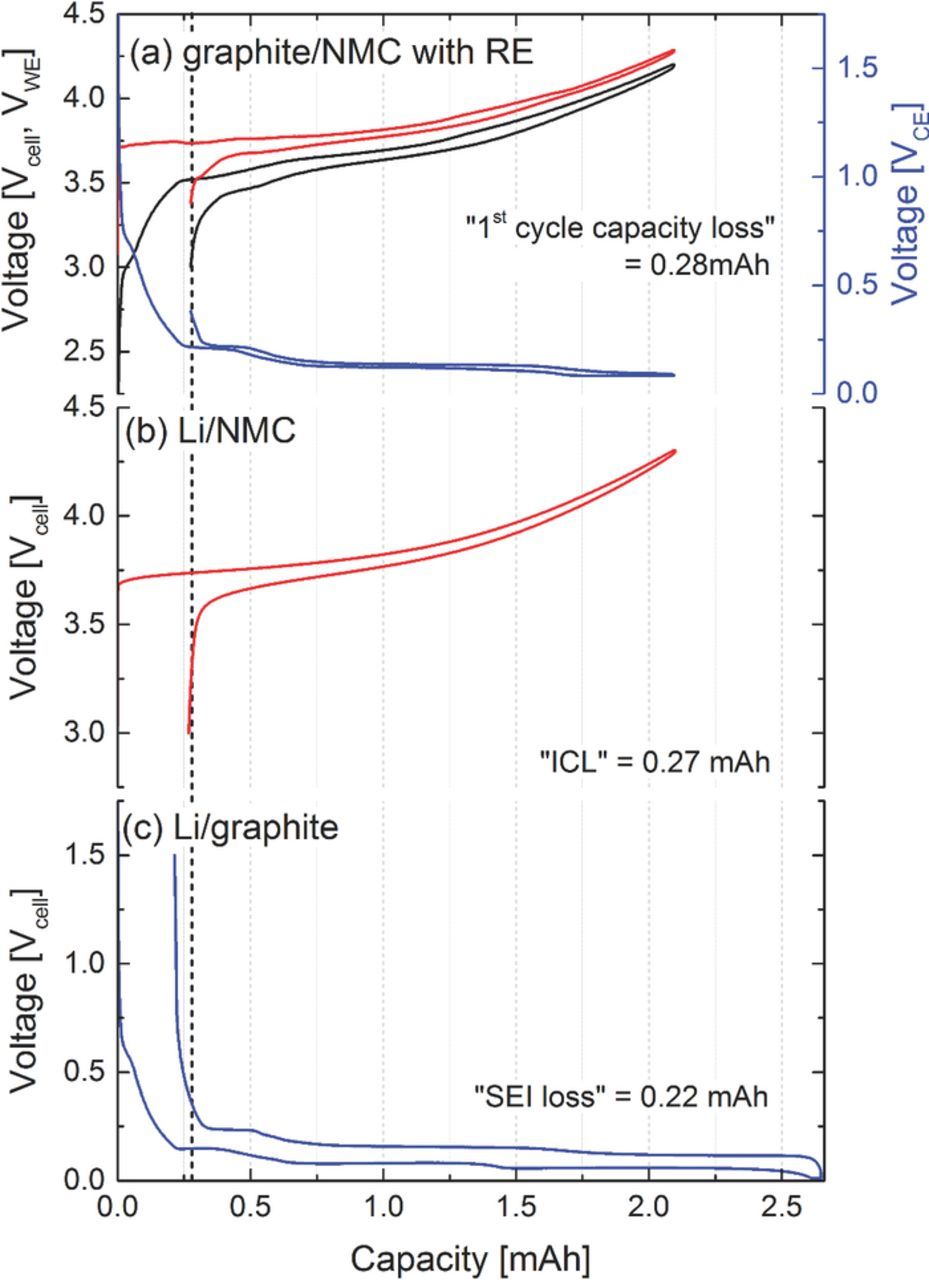
Figure 7. Initial charge/discharge cycle at 0.1C of (a) graphite/NMC full-cell with lithium reference electrode (RE) cycled between 3.0 V and 4.2 V (note that the NMC (WE) and the graphite (CE) potential are referenced to the lithium reference electrode potential). (b) Cell potential of a Li/NMC half-cell cycled between 3.0 V and 4.3 V. (c) Cell potential of a Li/graphite half-cell cycled between 0.01 V and 1.5 V. NMC loadings in the full- and the half-cell are 15.45 and 15.29 mgNMC/cm2, respectively; graphite loadings in the full- and the half-cell are 7.26 and 7.37 mgC/cm2, respectively.
Electrochemical Impedance Spectroscopy (EIS) experiments were conducted after the formation cycle and at the end of the cycling experiment in the discharged state after an OCV period of 3h at 25°C. Impedance spectra (500 kHz to 10 mHz, 5 mV perturbation) were recorded using a VMP-3 potentiostat (Biologic, France).
At the end of the cycling tests, the cells were dissembled in a glove box and both anode and cathode were harvested. In one set of experiments, anodes and cathodes (without washing step) were assembled in half-cells to evaluate their electrochemical performance. These experiments were carried out in two-electrode Swagelok cells with lithium foil as counter electrode (11 mm diameter) and new glass fiber separators wetted with 80 μl fresh LP57 electrolyte. The rate performance test for both electrodes consists of an intercalation step at a maximum rate of C/2 followed by a constant voltage step with current limitation (C/20) and a deintercalation step at rates of C/10, C/2, 1C, 2C, 3C, 5C, and 10C, respectively. Each rate setting was conducted three times. For NMC half-cells, a voltage window of 3.0–4.3 V was applied; for graphite half-cells, the voltage window was 0.01–1.5 V.
Prompt Gamma Activation Analysis (PGAA)
PGAA was performed at the neutron source FRM II of the Heinz Maier-Leibnitz Zentrum (MLZ) in Garching.23 Harvested graphite electrodes before and after the long-term cycling test were analyzed to get information about the amount of deposited transition metals. Prior to the PGAA analysis, the electrodes were rinsed with dimethyl carbonate (DMC, Sigma Aldrich, Germany), which was dried and stored at room temperature over a molecular sieve. The samples were then placed into an evacuated chamber and irradiated with cold neutrons at the NL4b beam guide for about 6 h each at a neutron flux of 4 × 10¹⁰ neutrons/(cm2·s) thermal equivalent (equivalent to a defined thermal neutron flux with 25 meV energy). The whole sample was immersed into the neutron beam and the copper signal coming from the copper current collector of the graphite electrodes (exactly known mass) was used as an internal standard for the determination of transition metal concentrations.
X-ray diffraction (XRD) Studies
The ex situ XRD patterns of the harvested NMC cathodes before and after the long-term cycling experiment were obtained in transmission mode with a STOE STADI P diffractometer (STOE, Germany) using Mo-Kα1 radiation (λ = 0.70932 Å, 50 kV, 40 mV) and a Mythen 1K detector. The diffraction patterns were measured in repetition mode with two repetitions per sample. The patterns were collected in a 2θ-range between 6.5–52° with a step size of 0.015° and a time of 5 s per step. To prevent any contact with moisture, the electrodes were put in an airtight sample holder with aluminum windows as reported in a previous work of our group.24
The in situ XRD cell, custom designed by our group, was used to follow the structural changes of NMC during electrochemical tests. In this cell, the aluminum of the cathode acts both as a current collector and X-ray window. Lithium metal is used as counter electrode and 4 glass fiber separators (14 mm diameter) wetted with 160 μl LP57 electrolyte are placed between cathode and anode. The in situ XRD patterns were collected with non-monochromatized Mo-Kα radiation to allow for higher flux and thus faster data collection. Bragg-Brentano geometry (reflection mode) was used in this set-up. During the experiments, the cell was connected to a SP200 potentiostat (SP200, Biologic, France). All XRD patterns were collected during intermittent OCV periods during the cycling procedure. Data analysis was performed using either WinXPow program package (WinXPow software version 3.0.2.1, 2011, by STOE & Cie GmbH, Darmstadt, Germany) or Highscore Plus25 (HighScore(Plus) software version 4.1, 2014, by PANalytical B.V., Almelo, Netherlands).
Results and Discussion
Electrochemical performance
To examine the effect of different operating conditions on the long-term cycling performance, graphite/NMC full-cells were assembled and tested with different upper cutoff potentials (4.2 V and 4.6 V) and at different temperatures (25°C and 60°C). The results are shown in Figure 1. The cells 4.2V/25°C demonstrated a negligible capacity fade after 300 cycles, while the capacity of the cells 4.2V/60°C fades more severely. Changing the upper cutoff potential leads to a different failure mechanism and a rapid capacity decay after 150 cycles can be observed in the cells 4.6V/25°C. While it is well known that higher cutoff potentials yield substantially higher initial NMC capacities6,7,12 (see 4.2V/25°C vs. 4.6V/25°C in Figure 1), higher initial capacities at 1C are also observed at elevated temperatures (see 4.2V/25°C vs. 4.2V/60°C in Figure 1), which is due to increased charge transfer kinetics and electrolyte conductivity (also evidenced by the much lower charge/discharge hysteresis shown for the first cycle after formation in Figure 8). Unfortunately, higher cutoff voltages and temperature may also accelerate undesired side reactions, like changes in the surface structure of NMC, active lithium loss through anode SEI growth triggered by transition metal dissolution, and enhanced electrolyte oxidation due to the restricted anodic stability of carbonate based electrolytes.26 For example, NMC half-cell data with 1 M LiPF6 in EC/DMC (1/1) at 25°C by Gallus et al.13 showed similarly strong capacity loss at 4.6 V cutoff potential (15% capacity loss over 50 cycles), which was ascribed to transition metal dissolution. Furthermore, similar cycling profiles were reported in the literature, showing that gradual capacity losses can be caused by loss of active lithium ions, whereas a "rapid rollover" failure is commonly linked with increasing cell impedance, mostly ascribed to the anode.19,20 In order to understand the fundamental reasons for cell failure at different operating conditions shown in Figure 1, electrochemical techniques were combined with XRD measurements and elemental analysis using PGAA.
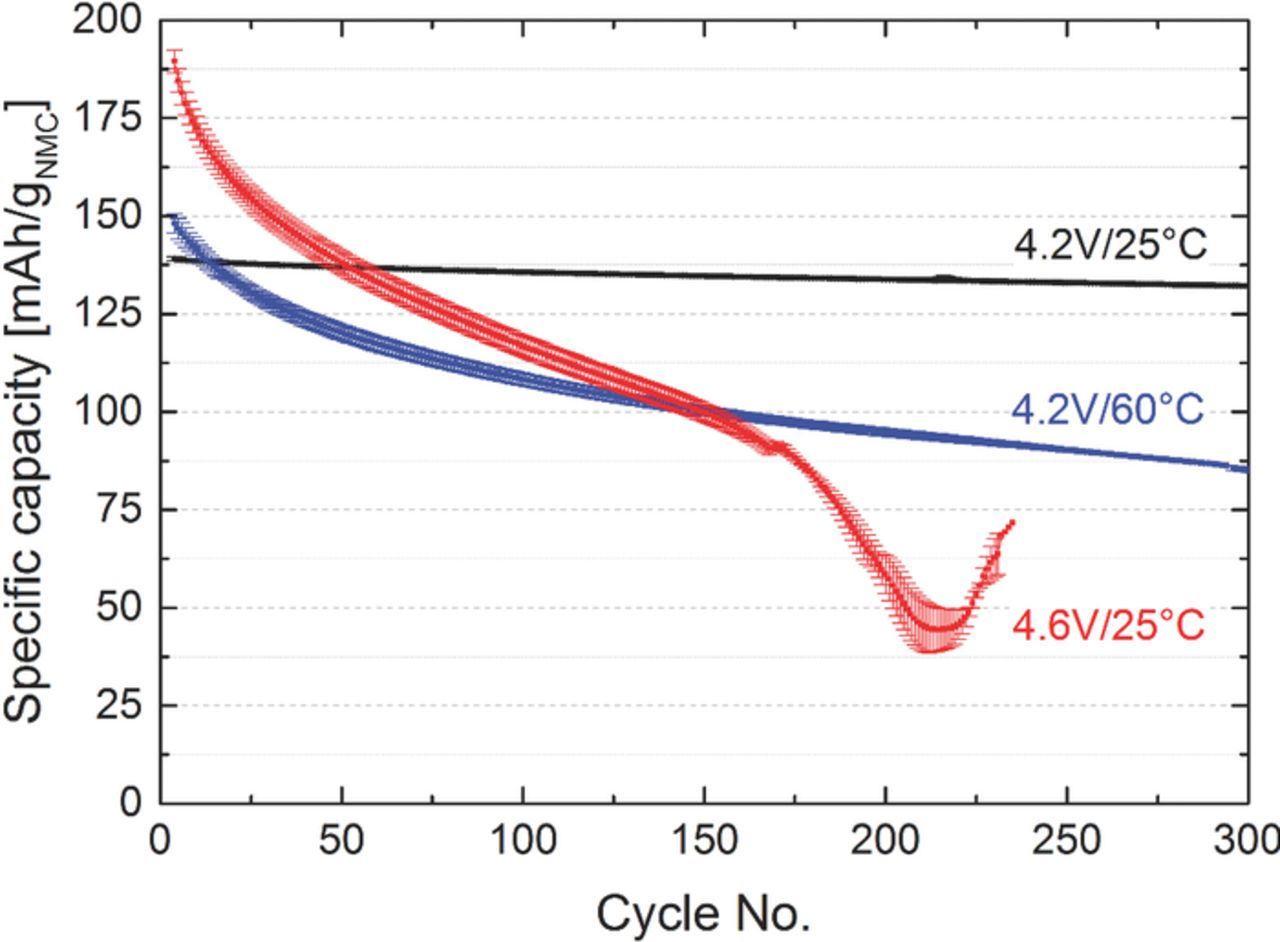
Figure 1. Specific discharge capacities vs. cycle number for graphite/NMC full-cells operated with different upper cutoff voltage limits (4.2 V, 4.6 V) and at different temperatures (25°C, 60°C) in EC/EMC (3/7) with 1 M LiPF6. The cycling was performed at a rate of 1 C for discharge and discharge with a lower cutoff potential of 3.0 V. Cathode loadings are 15.0 ± 0.2 mgNMC/cm2, while anode loadings were 7.4 ± 0.3 mggraphite/cm2 (3.0–4.2 V) and 9.3 ± 0.3 mggraphite/cm2 (3.0–4.6 V) to maintain an areal capacity ratio of graphite/NMC = 1.2. Results are averaged over two cells and the error bars represent the standard deviation between the two cells.
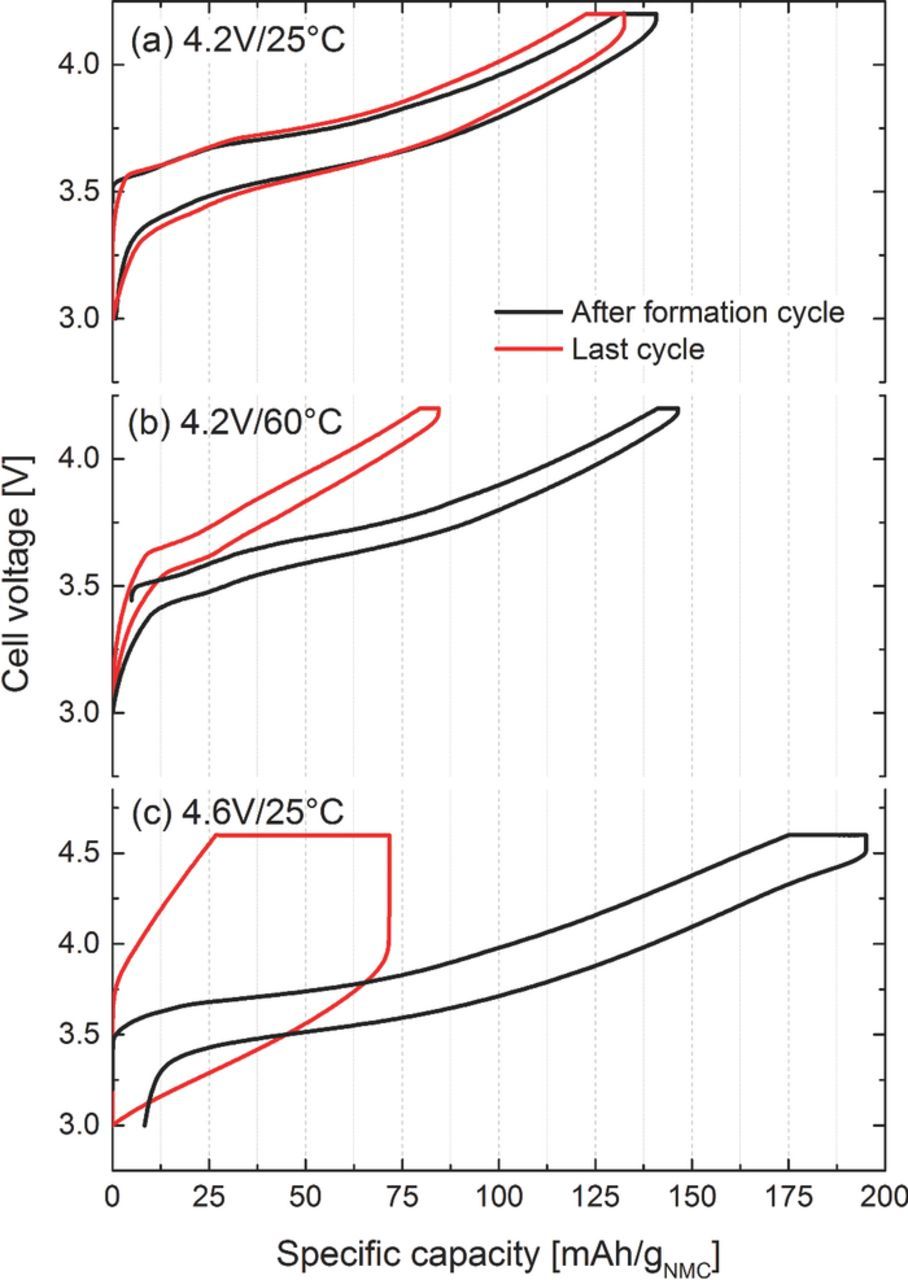
Figure 8. Cell voltage vs. specific capacity of the first cycle after formation and last cycle of the cycling test shown in Figure 1 of the aged graphite/NMC cells. Cells were charged (with a CV-step) and discharged at 1C at different temperatures (25°C, 60°C) and upper cutoff potentials (4.2 V, 4.6 V).
Ex situ XRD analysis of aged NMC electrodes
Figure 2a shows the XRD patterns of a pristine NMC electrode and electrodes harvested in the discharged state after the cycling experiment shown in Figure 1. Other than diffractions from the aluminum current collector and the XRD cell window, no additional bulk phases besides those for NMC, which can be indexed and refined in the hexagonal R m space group, are found in the XRD pattern, thus indicating the absence of any severe structural damage to NMC after long-term cycling (note that possible surface structural changes would not be detectable in this analysis). Furthermore, investigation of the profile parameter W (see caption of Figure 2) reveals that only a minor peak broadening occurs between pristine and aged NMC electrodes, most prominent for the cells cycled at 4.6 V cutoff at 25°C (see Figure 2b). This is consistent with previous reports, where the bulk structure of NMC was retained after chemical27 or electrochemical7 delithiation as well as after 500 cycles to 4.6 V12 (again, surface structural changes might occur, but would not have been detectable in these measurements).
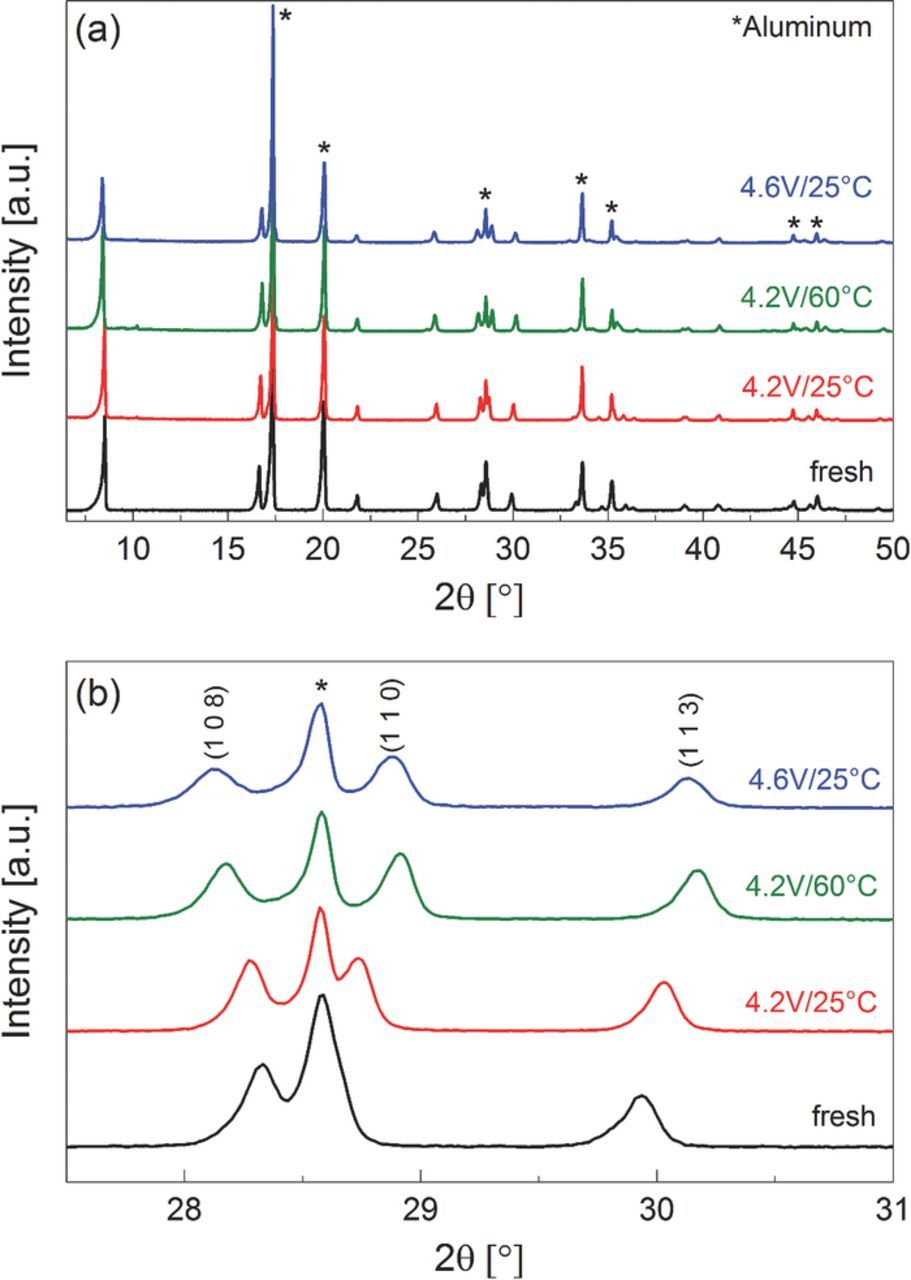
Figure 2. XRD patterns of the fresh NMC electrode and electrodes harvested in the discharged state after the cycling experiment: (a) complete diffractogram; (b) expanded view of the (1 0 8), (1 1 0), and (1 1 3) reflections. The fitted lattice parameters are: fresh NMC electrode: a = 2.859 Å, c = 14.241 Å, W = 0.0109; after 4.2V/25°C cycling: a = 2.854 Å, c = 14.320 Å, W = 0.0102; after 4.2V/60°C cycling: a = 2.836 Å, c = 14.426 Å, W = 0.0142; after 4.6V/25°C cycling: a = 2.839 Å, c = 14.448 Å, W = 0.0181. The diffractions from the Al window of the ex situ XRD holder are marked by an asterisk.
However, compared to the pristine electrode, the reflections of the harvested electrodes deviate from their original position, e.g. as clearly seen in the splitting of the (1 0 8) and (1 1 0) peaks as well as in the shift of the (1 1 3) peak to higher angles in Figure 2b. These shifts can be correlated with the lattice shrinkage along a and b direction and the expansion along c. Pattern fitting of the 4.6V/25°C sample reveals that the a-parameter decreases from 2.859 to 2.840 Å, while the c-parameter increases from 14.219 to 14.454 Å. The main reason for these structural changes is the below discussed variation in Li content of the aged NMC material, which affects the interlayer distance and thus the lattice parameter a and c. In the literature, various methods have been applied to show that the lattice parameters are correlated to the lithium content of the NMC electrode (x in Li1-xNi1/3Mn1/3Co1/3O2), e.g., chemical or electrochemical delithiation combined with ICP, XRD, neutron diffraction, or combinations of these methods.6,7,28–30 In our study, we aim to quantify the Li-loss after long-term cycling as a function of cycling condition directly from the XRD data. For this purpose, a calibration curve is needed, which correlates the transferred electrochemical charge to the Li content of NMC and its lattice parameters. As was shown previously,7 this can be done using in situ XRD during charging and discharging of an NMC electrode.
In situ XRD study of NMC
Figure 3 shows a comparison of the diffractograms and the Rietveld refinement obtained with pristine NMC electrodes collected either with the in situ XRD cell (Figure 3a) or the ex situ XRD sample holder (Figure 3b). The in situ pattern, measured in Bragg-Brentano geometry, contains a more sloping background compared to the ex situ pattern measured in transmission geometry (Debye-Scherrer). This is due to the additional electrolyte and separator contained in the in situ XRD cell. Furthermore, intensities differ due to the different impact of preferred orientation and the inability to rotate the in situ XRD cell. The transmission geometry shows more peak asymmetry, the Bragg-Brentano in situ cell though shows broader peaks and less asymmetry. In both cases the data quality was sufficient to get reliable cell constants from the fit.
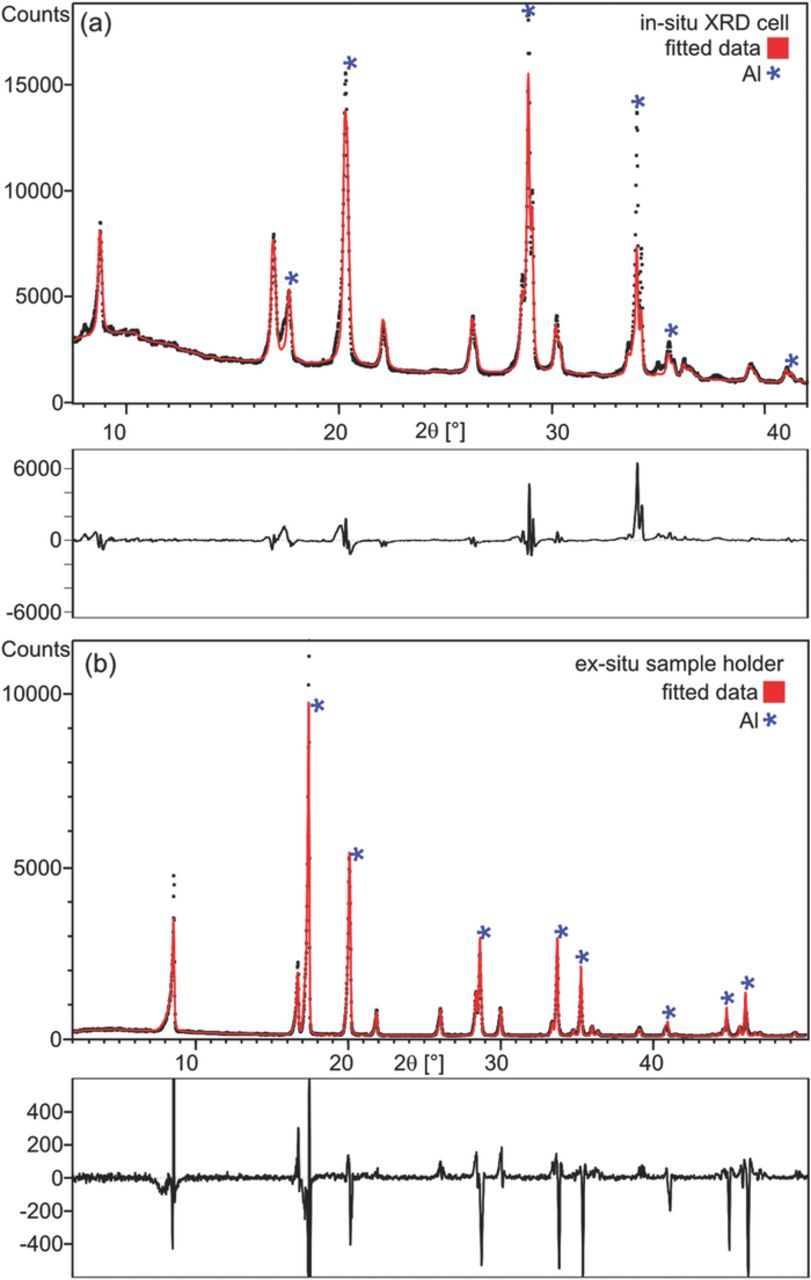
Figure 3. Comparison of the X-ray diffraction data and Rietveld refinement of pristine NMC electrodes collected (a) with the in situ XRD cell in Bragg-Brentano geometry and (b) with the ex situ sample holder in transmission geometry. Circles and lines correspond to the observed and calculated intensities, respectively. The difference between the observed and calculated patterns is indicated below each graph. The asterisks mark the diffraction peaks originating from the aluminum window(s).
Figure 4 shows the results from in situ XRD measurements of a Li/NMC half-cell at room temperature cycled between 3.0 and 4.3V during the 1st charge and discharge (black lines) as well as the 2nd charge and discharge (red lines). From the transferred charge, the amount of extracted lithium was calculated and used to establish a correlation between lattice parameters and the lithium content (1-x) in Li1-xNi1/3Mn1/3Co1/3O2 (see Figures 4b–4d), analogous to previous literature studies. A Vegard's law type linear fit31–33 is only possible in the range x = 0–0.5. Beyond that, a clear deviation from linearity suggests a phase transformation mechanism which has been discussed by Hwang et al., Koyama et al., and others;7,34,35 it has been linked with a change in the electronic state (hybridization of Co and O orbitals). While in the linear region the extraction of Li directly affects the interlayer distance due to repulsive interactions of negative charges (elongation of the c-axis), further oxidation of NMC leads to a more covalent character of the metal-oxygen bond, hence decreasing the interlayer repulsion. The best fit for x versus structural parameters is obtained when using the c/a value as a measure of the lattice distortion induced by the Li extraction and insertion (Figure 4d).7
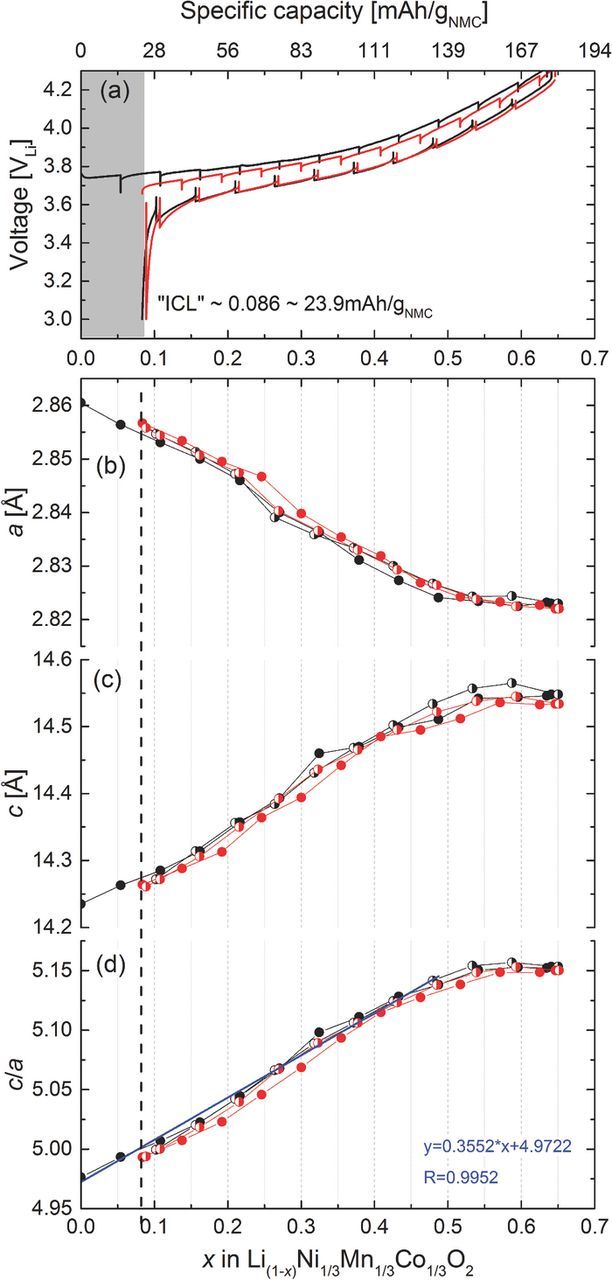
Figure 4. (a) Charge and discharge curves of Li/Li(1-x)Ni1/3Mn1/3Co1/3O2 recorded in the in situ XRD half-cell operated at a rate of 0.1C between 3.0 and 4.3 V. Spikes indicate the OCV period during which XRD diffraction patterns were collected. The black curves are the very first charge and discharge; the red curves are the second charge and discharge. (b), (c), and (d) Fitted lattice parameters a and c in hexagonal space group together with the ratio of c/a as a function of x (in Li1-xNi1/3Mn1/3Co1/3O2) during the first two charge/discharge cycles. The linear regression fit between x = 0 and 0.5 gives c/a = 0.3552*x + 4.9722 with R2 = 0.9952.
According to the NMC charging reaction, the process of Li extraction can be described as:
![Equation ([1])](https://content.cld.iop.org/journals/1945-7111/162/14/A2737/revision1/d0001.gif)
The first charge and discharge data of the Li/NMC half-cell shown in Figure 4a (black lines) indicates an irreversible capacity loss (ICL) of ∼23.4 mAh/gNMC, and the accompanying in situ XRD data (black lines in Figs. 4b–4d) suggest that the cathode material is not returning to its fully lithiated state after the first charge/discharge cycle. In these measurements, the upper cutoff potential of 4.3 V corresponds to a minimum lithium content of (1-x) = 0.35 (i.e., x = 0.65), assuming that the first delithiation reaction proceeds from Li1.00NMC to Li0.35NMC as deduced from the transferred charge using the above reaction. It is also obvious that relative to the initial material composition only a re-lithiation to ∼Li0.916NMC is achieved in the first cycle (see black lines in Figure 4a). Therefore, 0.084 moles of lithium per mole of Li1.00NMC correspond to the irreversible capacity loss (ICL) of ∼23.4 mAh/gNMC. According to the lattice parameters obtained in the 2nd cycle in the in situ XRD cell, NMC can only be cycled reversibly back to a maximum lithium content corresponding to Li0.916NMC, as the initial state under these conditions is not recovered.
Multiple groups7,12,36 have observed the occurrence of an ICL, but only few groups37–40 have proposed a mechanism for it. Figure 5 shows results from an in situ XRD Li/NMC half-cell experiment, in which the charging time was gradually increased by 1 h and the discharge terminated at 3.0 V, i.e., initially, pristine NMC was charged for 1 hour at a rate of 15 mA/gNMC (corresponding to a C-rate of 0.1 h-1 for a commonly used NMC capacity of 150 mAh/gNMC) and then discharged to 3.0 V; subsequently, the same electrode was charged for 2 hours at a rate of 15 mA/gNMC followed by another discharge to 3.0 V, etc. It is apparent from Figure 5a that after the initial 1 hour charge (left-most black symbol at 15 mAh/gNMC), essentially no discharge capacity is observed (left-most red symbol at. 2.5 mAh/gNMC); after the following 2 hour charge to 30 mAh/gNMC (second black symbol from the left), a discharge capacity of only ∼18.9 mAh/gNMC is obtained (second red symbol from the left), Only after the following 3 hour charge to 45 mAh/gNMC, the subsequent discharge capacity essentially equals the preceeding charge capacity. Thus, the accumulated irreversible capacity loss (ICL) in the first two cycles of this sequence amounts to ∼23.6 mAh/gNMC (i.e., the sum of the difference between the charge and discharge capacity in the first two cycles) or ∼0.085 mol Li, which is essentially identical to the ICL observed in the full charge/discharge shown in Figure 4a (black lines). It is obvious from these data that the ICL only occurs in the initial delithiation process and that the extraction of the first 0.085 mol lithium per mol of NMC is irreversible under these cycling conditions, which is evidenced by the fact that the c/a value in the discharged state does not return to its initial value of ∼4.975, but takes on a minimum value of ∼5.00 (see red symbols in Figure 5b). These data suggest that a fraction of the discharged lithium ions, viz., 0.085 mol lithium per mol of NMC (or ∼8.5% of the active lithium in NMC), cannot be intercalated back into the layered NMC structure and that the maximum reversible lithium content corresponds to Li0.915NMC under these conditions. Analogous observations have already been reported.39
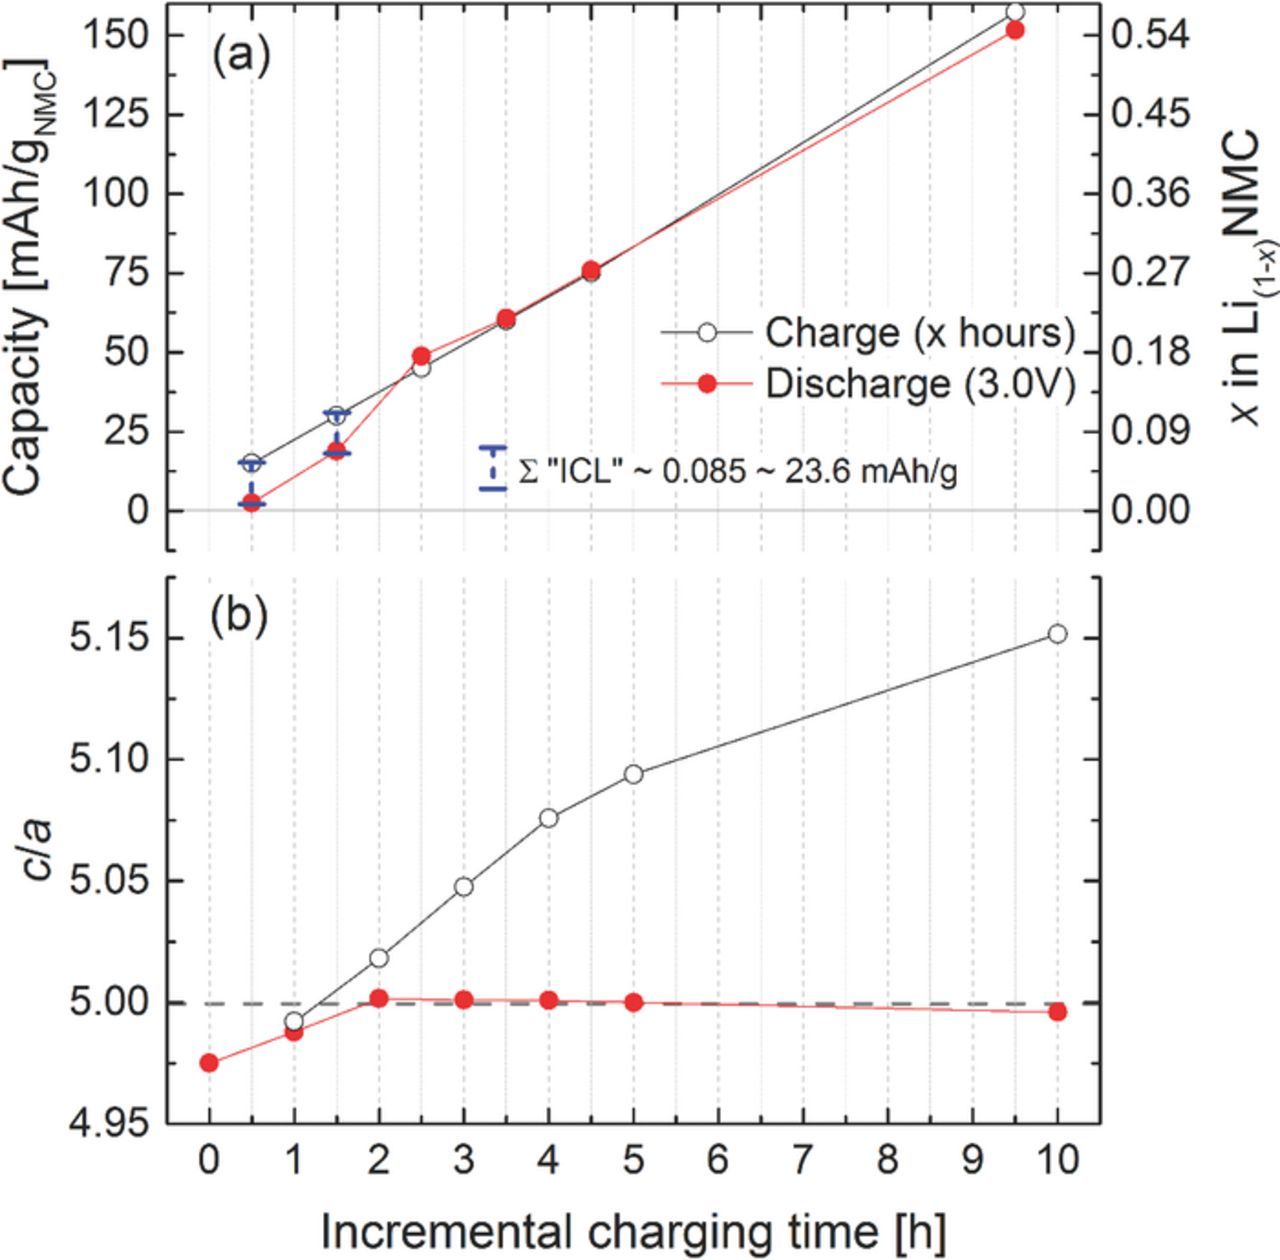
Figure 5. (a) NMC charge (black symbols) and discharge (red symbols) capacity obtained with incrementally increasing NMC charging times (followed by discharge to 3.0 V) at a rate of 15 mA/gNMC (corresponding to 0.1C if referenced to a conventionally used capacity value of 150 mAh/gNMC): 1 h charge followed by discharge to 3.0 V; then 2 h charge followed by discharge to 3.0 V; etc. (b) the corresponding parameter c/a determined at the end of every charge and discharge, respectively; note that the left-most red symbol in (b) refers to the lattice parameter of the pristine, fully lithiated Li1.00NMC.
One of the tentative explanations for the first-cycle irreversible capacity loss of NMC is that it could be based on parasitic reactions occurring on the NMC surface, as was suggested by Choi et al.,37 who had observed that NMC with lower BET area (produced by calcining at higher temperature) showed a lower ICL. On the other hand, Kang et al.38,39 related the ICL to a very sluggish lithium diffusion into the layers of the oxide structure, caused by the lack of lithium ion vacancies as the lithium content (1–x) approaches 1 (x∼0) in the Li1-xNMC structure, i.e., near the end of discharge; by allowing the discharge voltage to go below 1.5 V leading to the formation of an overlithiated phase "Li2MO2" (M = transition metal), they were able to completely recover the ICL. Therefore, if the latter hypothesis were correct, it should be possible to recover the full capacity of NMC, if the discharge is not terminated by a voltage limit but continued at constant voltage to compensate for the slow lithium ion diffusion. The results of such an approach are shown in Figure 6: after an initial charge and discharge cycle at 0.1C in the in situ XRD half-cell, the potential was first held at 3.0 V for 12 h, then at 2.0 V for 10 h, and finally at 1.6 V for 8 h. Note that the potential is kept well above 1.5 V to prevent the formation of the overlithiated "Li2MO2" on the particle surface which would result in a two-phase coexistence and two different Li diffusion processes;38,39 its absence is evidenced in Figure 6c, as the associated additional peak at ∼8°2θMo,Kα41,42 left to the (0 0 3) peak is not appearing. Holding the potential at 3.0 V for 12 hours results in a ∼50% recuperation of the ICL (marked by the gray area in Figure 6a), concomitant with a close approach of the c/a value toward its initial value (second-to the left black vs. red symbol in Figure 6b). After the final constant voltage hold at 1.6 V, all of the ICL has been recuperated and the c/a value has returned to its initial value, while at the same time the (1 1 3) reflection has moved back to its original position (see Figures 6a and 6c). These data clearly demonstrate that the intercalation process above a Li content of ∼0.915 (=Li0.915NMC) is dominated by very slow Li diffusion into the layers of the NMC host structure and that the initial structure can be retrieved given enough time for the lithium diffusion process. On the contrary, increasing the rate of the discharge process (e.g., 1C) may result in a higher value for the ICL as the kinetic barrier may increase.
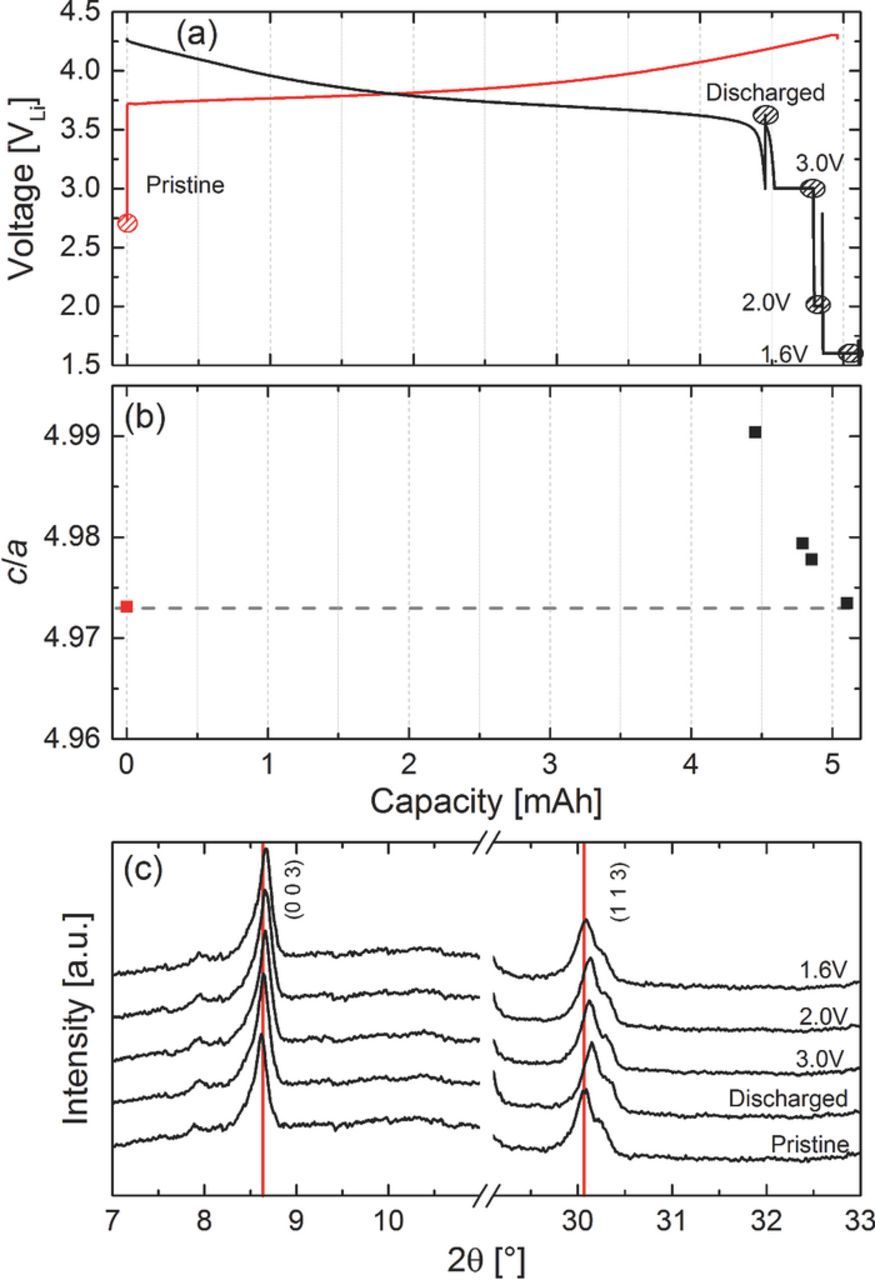
Figure 6. Initial charge/discharge cycle of Li/NMC in the in situ XRD half-cell at 0.1C to a positive cutoff potential of 4.3 V, with the discharge being followed by several constant voltage steps: for 12h at 3.0 V, then for 10h at 2.0 V, and finally for 8h at 1.6 V. (a) cell voltage versus capacity (XRD data collection is marked by dashed circles); (b) corresponding c/a values of the pristine structure of NMC (red symbol) and after the various potential holds following the first discharge cycle; (c) in situ XRD patterns in the 0 0 3 and 1 1 3 peak region.
While such extended voltage hold periods are impractical for real cells, in graphite/NMC full-cells the ICL of the NMC can be used to match the lithium-consuming SEI formation reaction of the graphite anode.43,44 This is illustrated in Figure 7 by comparing the anode and cathode voltages (referenced to a lithium metal reference electrode) of a graphite/NMC full-cell during the first charge/discharge cycle (Figure 7a) with that of the cell voltages of Li/NMC (Figure 7b) and Li/graphite (Figure 7c) half-cells made with comparable electrodes. Obviously, the first cycle irreversible capacity loss of the NMC cathode and the SEI loss of the graphite anode are not accumulative, since the sum of the ICL of the Li/NMC and the SEI loss of the Li/graphite half-cells do not match the full-cell first-cycle capacity loss (see Figure 7). Since the first-cycle capacity losses of both electrodes are very similar, the "excess" Li from NMC almost perfectly compensates the SEI loss of the graphite anode, so that the full-cell first-cycle capacity loss only amounts to the irreversible loss term of one of the electrodes, viz., the one with the larger first-cycle irreversible loss which in this case is the NMC cathode. Similar results were also confirmed by German et al.40 This, of course, has to be considered when optimizing the balancing of graphite/NMC full-cells. In our study, cells based on these considerations were fabricated by us and tested at different operating conditions to investigate failure mechanisms.
Correlation of Li content in NMC with capacity fade
As the NMC cathode was chosen to be capacity limiting in the graphite/NMC full-cells (this can also be seen in Figure 7), its lithium content can be used to track the amount of active lithium in the cell ("lithium inventory"): if lithium ions are consumed by side reactions (e.g., SEI formation), they are lost for back-intercalation into the NMC cathode material during discharge, thereby limiting discharge capacity. To determine this active lithium loss, the cycled cells (see Figure 1) were disassembled in the discharged state and XRD patterns of the harvested NMC electrodes were acquired to quantify their lithium content by means of the correlation established in Figure 4d. In the absence of active lithium loss during the cycling test, the NMC active material should be fully intercalated back to its lithium content after formation, i.e., to the stoichiometry corresponding to Li0.916NMC (x∼0.084) as deduced from the analysis of the first cycle ICL (dashed line in Figure 4). Furthermore, a correction for changing the C-rate from 0.1 to 1C has to be applied to consider the higher kinetic barrier for Li re-intercalation at 1C, i.e. Li0.891NMC (x∼0.109). For comparison see rate performance in Figure 11.
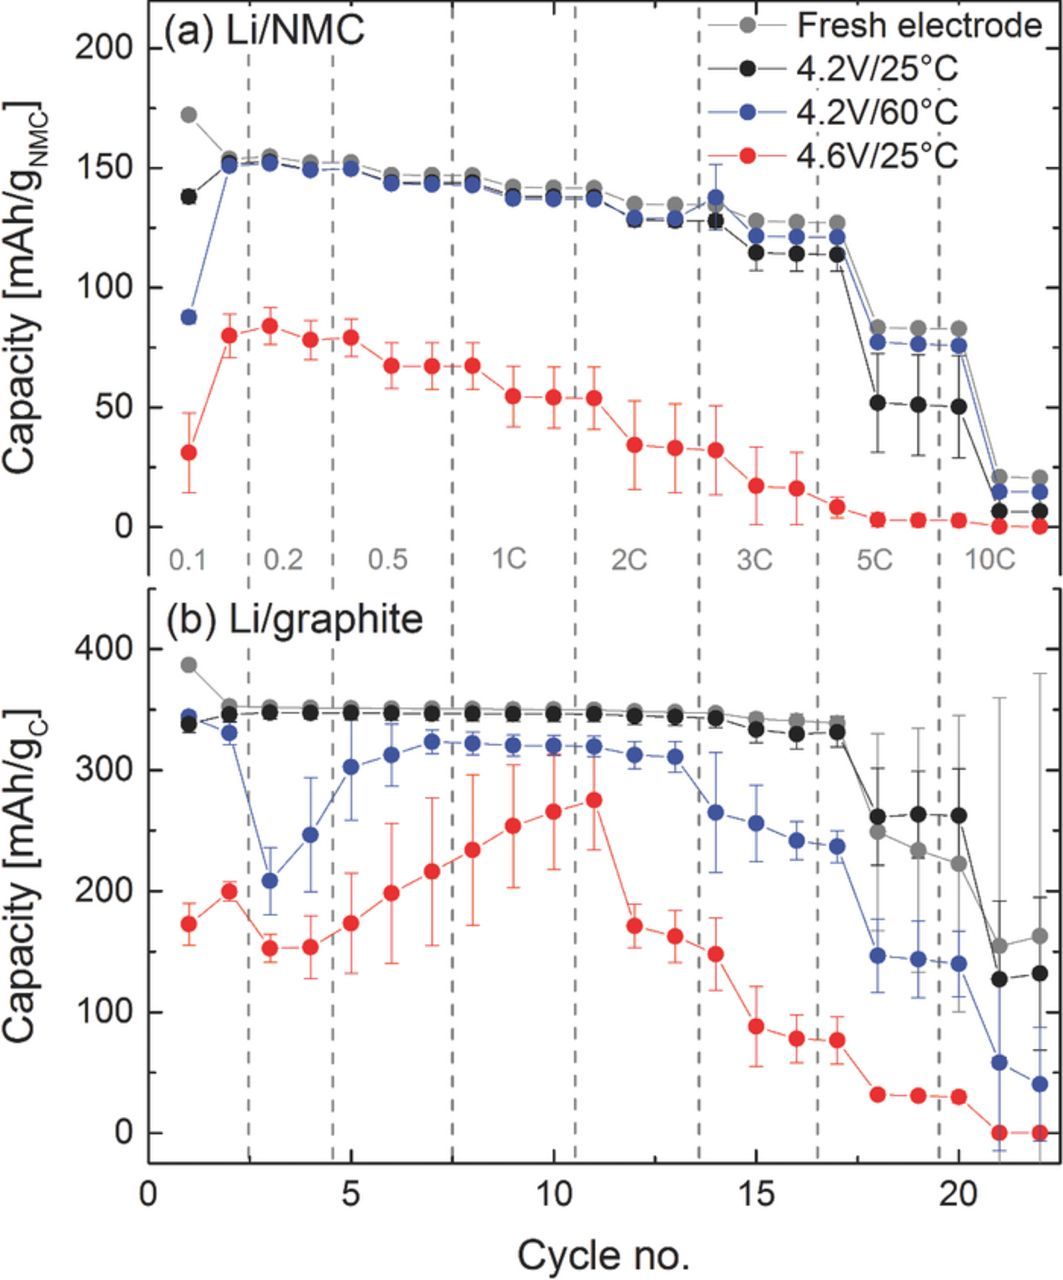
Figure 11. Rate performance of fresh and aged electrodes assembled in new half-cells at 25°C. (a) Li/NMC cells cycled between 3.0 and 4.3 V at 25°C, plotted is the lithiation capacity and (b) Li/graphite cells cycled between 0.01 and 1.5 V at 25°C, plotted is the delithiation capacity. Results are averaged over two cells and the error bars represent the standard deviation.
Table I gives an overview of the capacity losses obtained from the electrochemical cycling data (ΔCcycing) of cells aged for up to 300 cycles at different conditions. To obtain the capacity loss resulting from the loss of active lithium of the NMC electrode due to anode SEI formation45–47 or other parasitic reactions (ΔCactive-Li), ex situ XRD measurements were conducted on the harvested electrode in the discharged state to determine the lattice parameters and the c/a value (see Figure 2). From the linear part of the c/a plot obtained by in situ XRD (see Figure 4d), one can determine the lithium content x in Li1-xNMC. The loss of active lithium (ΔCactive-Li) can be quantified by subtracting the lithium loss due to the initial NMC ICL at 1C (x = 0.109) to yield the corrected value of xICL-corr. The latter can finally be converted into ΔCactive-Li by considering that the theoretical capacity of Li1-xNMC equates to 278 mAh/gNMC for x = 1.
Table I. Capacity losses of graphite/NMC cells after extended cycling at 1C (# of cycles is indicated) at different positive cutoff potentials (U) and temperatures (T). The electrochemically determined capacities at Beginning-of-Life (BoL), End-of-Life (EoL), and the thus determined capacity loss (ΔCcycling) are shown. The latter is compared to the capacity losses due to active lithium loss (ΔCactive-Li), obtained from XRD analysis of harvested NMC electrodes via quantification of the c/a-value by ex situ XRD, conversion into x in Li1-xNMC using the in situ XRD calibration curve (Figure 4d), and subtraction of the lithium ion loss due to ICL to yield the ICL-corrected x-value (xICL-corr.); note that x = 1 marks the theoretical capacity of 278 mAh/gNMC.
| Electrochemical Cycling Data | XRD Data Analysis | |||||||
|---|---|---|---|---|---|---|---|---|
| Capacity | ΔCcycling | x in Li1-xNMC | ΔCactive-Li | |||||
| U [V] | T [°C] | # of cycles | BoL [mAh/gNMC] | EoL [mAh/gNMC] | [mAh/gNMC] | x from c/a-fit | xICL-corr. (−0.109) | [mAh/gNMC] |
| 4.2 | 25 | 300 | 139.8 | 132.3 | 7.4 | 0.122 | 0.013 | 3.6 |
| 4.2 | 25 | 300 | 139.6 | 132.7 | 6.9 | 0.121 | 0.012 | 3.3 |
| 4.2 | 60 | 300 | 146.4 | 84.3 | 62.0 | 0.315 | 0.206 | 57.3 |
| 4.2 | 60 | 300 | 149.8 | 85.3 | 64.5 | 0.328 | 0.219 | 60.9 |
| 4.6 | 25 | 232 | 191.5 | 71.7 | 119.9 | 0.303 | 0.194 | 53.9 |
| 4.6 | 25 | 228 | 187.4 | 59.9 | 127.5 | 0.321 | 0.212 | 58.9 |
Table I compares the capacity losses obtained from the cycling data (ΔCcycing) to the capacity losses which can be ascribed to a loss of active lithium obtained from XRD analysis (ΔCactive-Li), showing that the capacity loss of cells cycled with a positive cutoff potential of 4.2 V (cells 4.2V/25°C and 4.2V/60°C in Figure 1) are mainly due to the loss of active lithium (i.e., ΔCcycing ∼ ΔCactive-Li). The gradual capacity loss with cycle number of these cells (see Figure 1) is consistent with the literature,19,20 which generally associates this behavior with a loss of active lithium. The loss of active lithium in the first cycle is associated with the SEI buildup on the graphite electrode, gradually passivating its surface toward further reduction.43–45 This quite effective surface passivation is indicated by the low capacity loss during extended cycling of the 4.2V/25°C cells. However, at elevated temperatures the SEI may partially dissolve in the electrolyte44,48 and/or may be attacked by PF5 which is formed as a decomposition product of LiPF6 salt at higher temperatures.14,49 Thus, the gradual SEI re-formation is the likely cause for the large active lithium loss in the cells cycled at a low cutoff voltage of 4.2 V at 60°C (see Table I). In summary, the conclusion drawn from our XRD analysis that capacity losses during cycling of graphite/NMC cells at a low cutoff potential of 4.2 V are mostly due to the loss active lithium is consistent with the literature. This validates our here described experimental approach to quantify capacity losses due to active lithium loss by means of XRD analysis, providing an alternative method to the commonly used post-mortem quantification of the lithium content of discharged cathodes by means of chemical analysis.
On the other hand, cells cycled with a cutoff potential of 4.6 V exhibit a much higher total capacity loss (ΔCcycing ∼ 120–130 mAh/gNMC) than what could be ascribed to the loss of active lithium (ΔCactive-Li ∼ 54–59 mAh/gNMC). This means, that the cathode still contains unused cyclable lithium and that the total capacity loss cannot be caused solely by a loss of active lithium. The additional large capacity loss might come from enhanced surface film formation on both anode and cathode active materials, concomitant with increased impedance and polarization losses. This would be consistent with the cycling profile of the 4.6V/25°C cells in Figure 1, exhibiting the typical "rapid rollover capacity loss" which has mainly been linked with excessive impedance growth and cell polarization.19,20 Increased cell polarization is indeed only observed for the 4.6V/25°C cells, as is shown in a comparison of the charge/discharge profiles after formation and at the end of the cycling test (see Figure 8). Quite clearly, the capacity of the 4.6V/25°C cells becomes limited by cell polarization (Figure 8c), while the charge/discharge overpotentials of the 4.2V/25°C and 4.2V/60°C cells remains unchanged between the initial and the final cycles (Figures 8a and 8b). This further supports our above findings that the capacity loss for cells cycled with a cutoff voltage of 4.2 V is mainly due the loss of active lithium as inferred from our XRD analysis (Table I).
As shown in the Nyquist plot in Figure 9, the increased charge/discharge cell voltage hysteresis for the 4.6V/25°C cells indicated in Figure 8c is also reflected in their nearly one order of magnitude larger AC impedance (red lines) compared to the 4.2V/25°C (black line) and 4.2V/60°C cells (blue line). Two semicircles can be observed in the graph that are generally attributed to surface film and charge transfer resistances.50 Interestingly, the impedance of the aged 4.2V/60°C cell (blue line in Figure 9) is essentially identical with that of the pristine cell after formation (green line in Figure 9) and lower than that of the aged 4.2V/25°C (black line). This would actually be consistent with the above discussed hypothesis of partial anode SEI dissolution at 60°C compared to 25°C. Overall, however, the most pronounced impedance increase is observed for the 4.6V/25°C (red lines), which may be related to electrolyte oxidation/decomposition and/or the dissolution of transition metal from the NMC cathode.
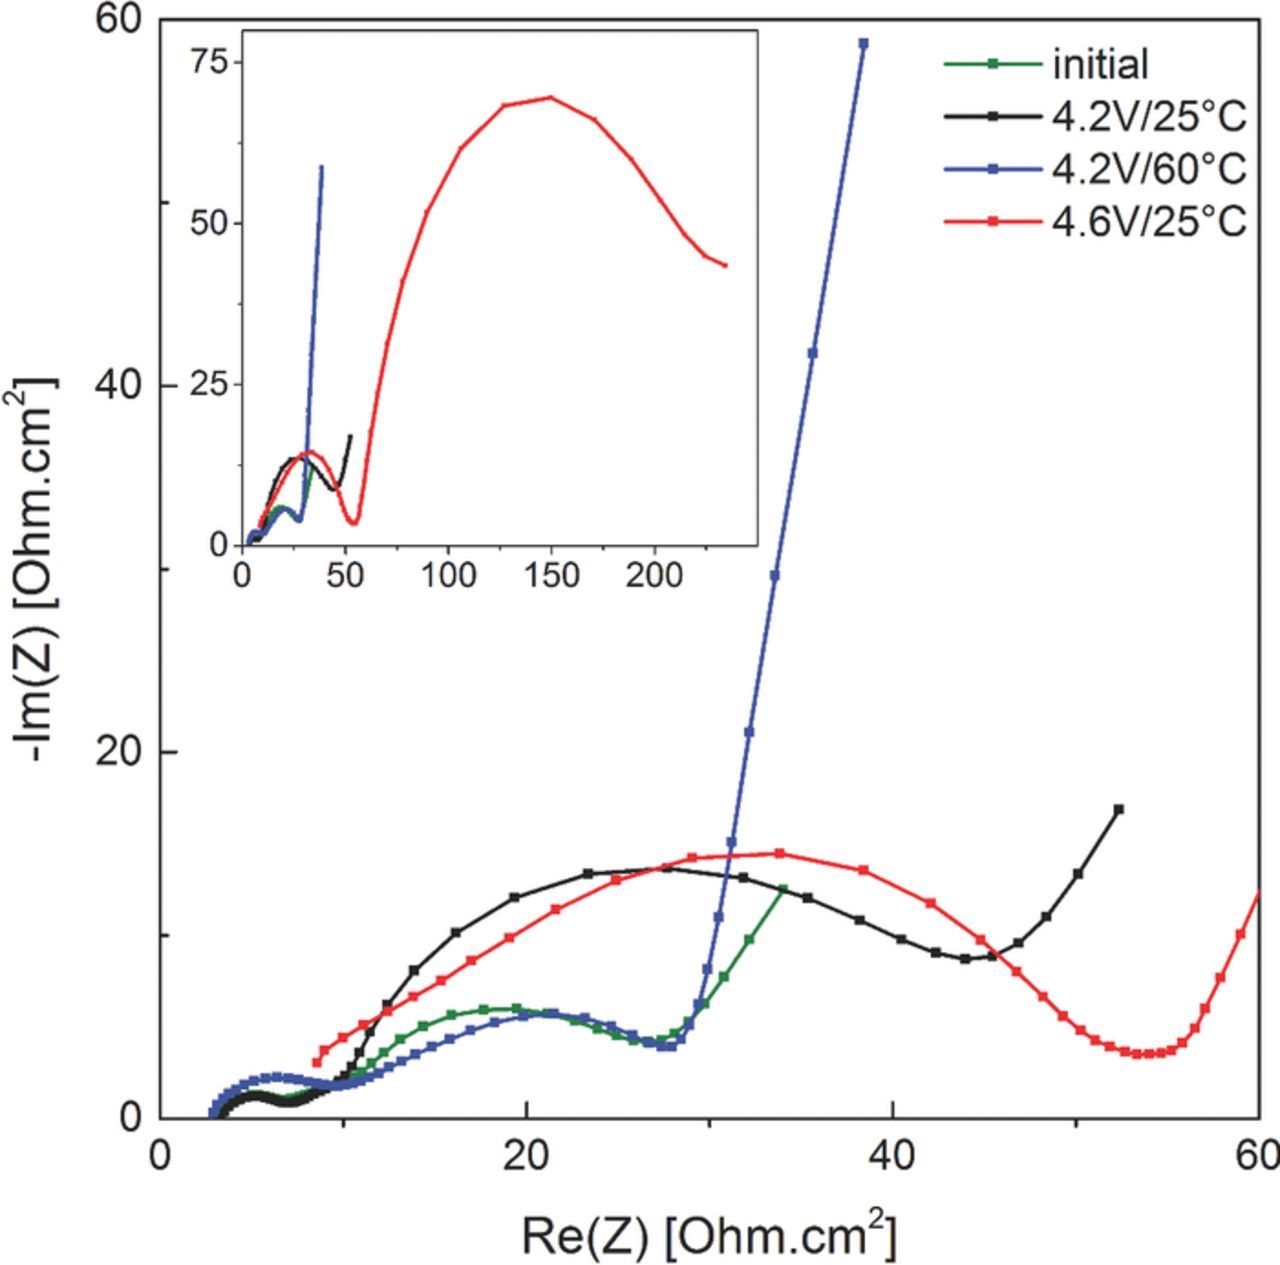
Figure 9. Nyquist plots of the fresh and aged graphite/NMC cells after long-term cycling at different temperatures (25°C, 60°C) and upper cutoff potentials (4.2 V, 4.6 V). The inset displays an expanded view in order to depict the complete AC impedance spectrum of the 4.6V/25°C cells. Spectra were collected at 25°C in the discharged state of the cell after at least 3h of OCV.
Transition metal dissolution and deposition
One of the discussed reasons for accelerated capacity loss at high positive cutoff potentials and/or high temperatures is the dissolution of transition metals and their subsequent deposition on the graphite anode.11–13,18,51 To examine the extent of transition metal deposition on the anode, PGAA was used to quantify the amount of deposited Ni, Mn, Co on harvested graphite anodes. Due to the large penetration depth of neutrons, PGAA examines the entire volume of the investigated anode samples. Figure 10 shows the concentrations of Mn, Co, and Ni deposited on the graphite anodes after the long-term cycling test shown in Figure 1. Quite clearly, elevated temperatures and high positive cutoff voltages accelerate the loss of transition metal ions from the NMC electrode and their deposition on the graphite anode.52 At 25°C, the amount of deposited Mn is 1.5- to 2-fold larger than that of Ni and Co, reasonably consistent with the report by Gallus et al.13 On the other hand, at 60°C (4.2V/60°C cell), the amount of deposited manganese is almost an order of magnitude larger than that of Ni and Co, which implies preferential Mn dissolution at high temperature.
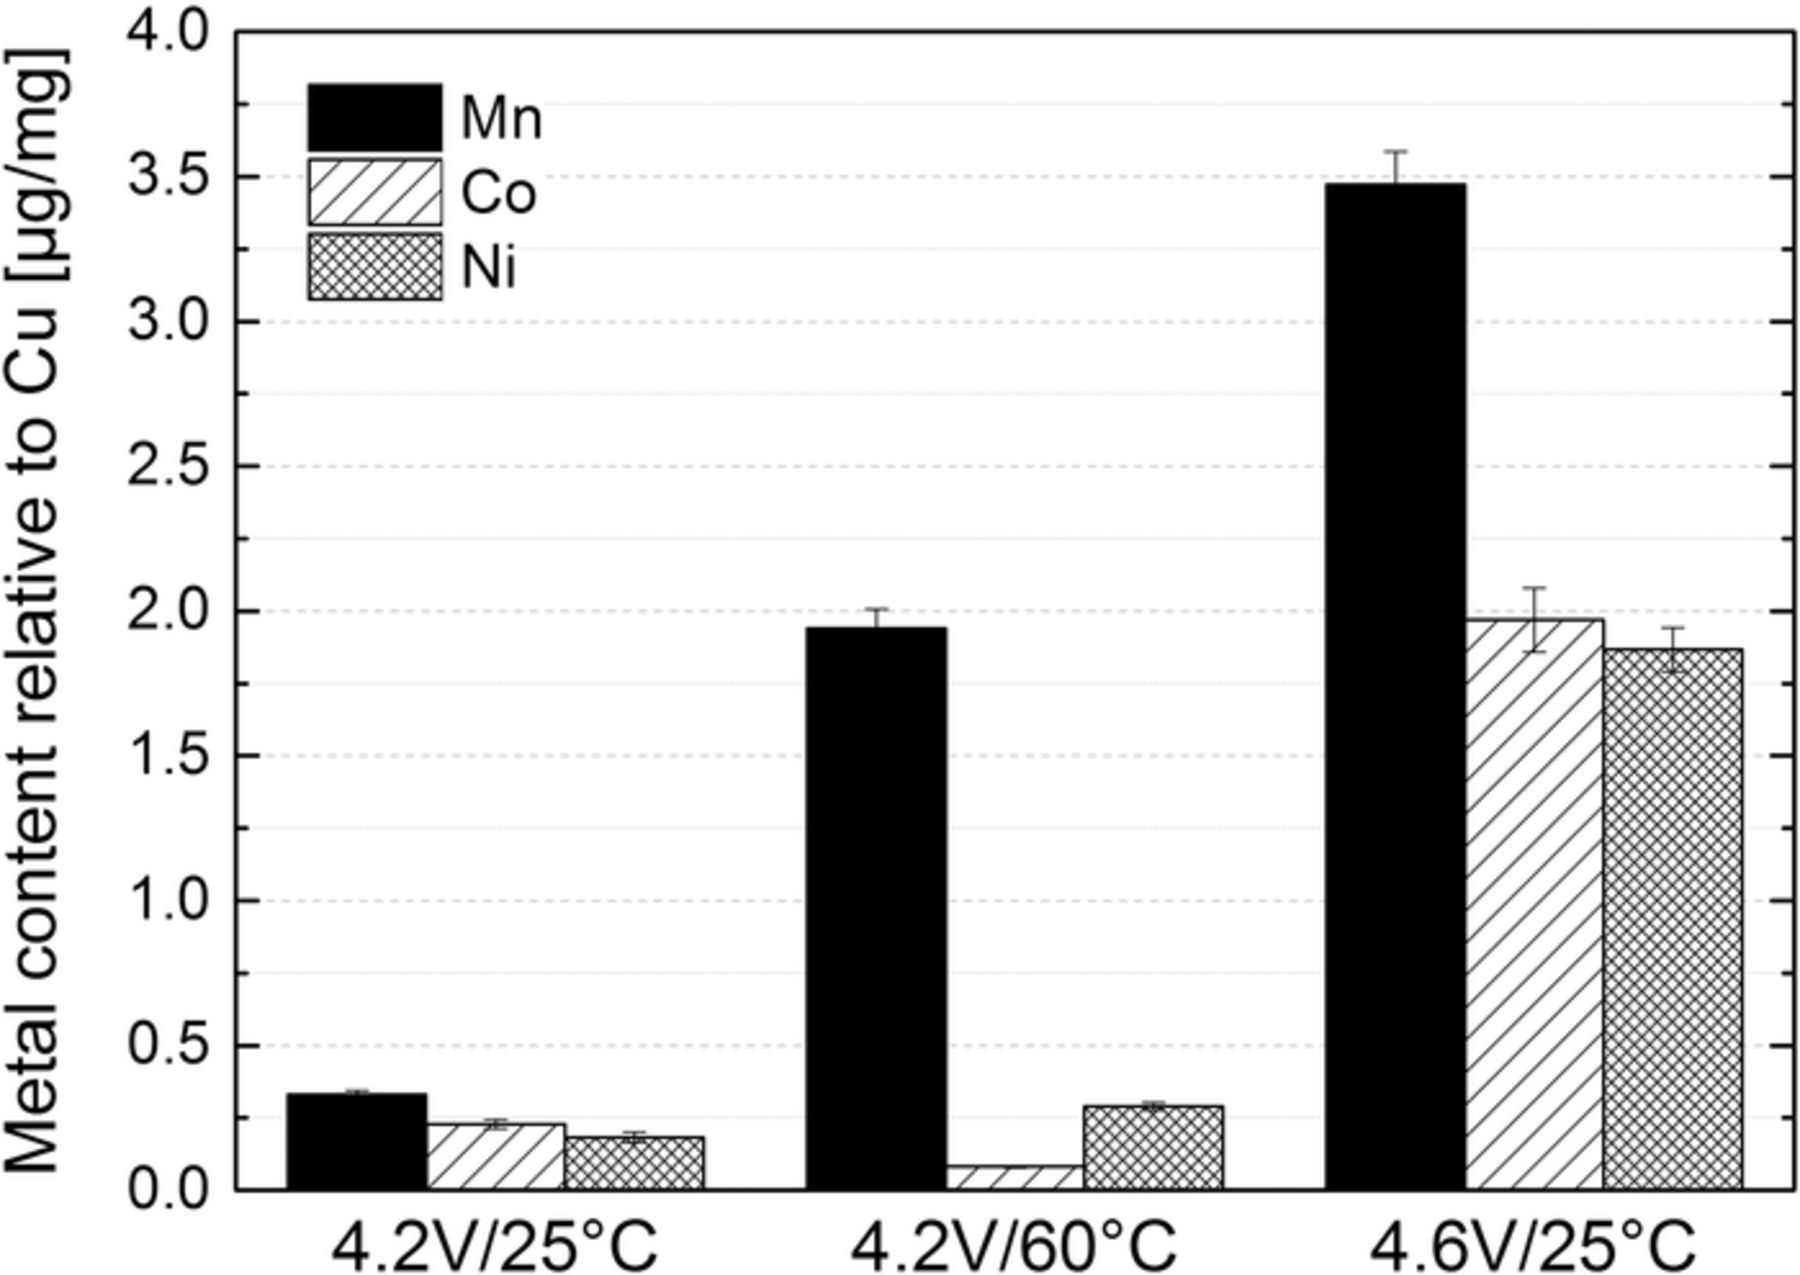
Figure 10. Concentration of Ni, Mn and Co deposited on harvested aged graphite electrodes determined by PGAA after cycling graphite/NMC cells up to 300 cycles at different temperatures (25°C, 60°C) and upper cutoff potentials (4.2 V, 4.6 V).
In general, two different mechanisms for transition metal dissolution are suggested in the literature: i) at lower voltages, disproportionation reactions according to 2Mn3+ → Mn4+ + Mn2+ are supposed to be the main reason,53,54 whereby trace amounts of Mn3+ in the NMC lattice due to defects or oxygen vacancies can trigger this reaction; ii) at higher potentials (>4.6 V), the hybridization of the electron orbitals of oxygen and the metals is hypothesized to take place34,35 and lead to a reduction of the oxidation state of the metals. The manganese dissolution triggered by either mechanism is believed to be enhanced by an HF corrosion reaction according to Hunter's reaction:55,56
![Equation ([2])](https://content.cld.iop.org/journals/1945-7111/162/14/A2737/revision1/d0002.gif)
An analogous reaction can be formulated for NMC:
![Equation ([3])](https://content.cld.iop.org/journals/1945-7111/162/14/A2737/revision1/d0003.gif)
It was shown that the HF required for this reaction is mainly formed by the decomposition reaction of LiPF6 salt and H2O:13,14
![Equation ([4])](https://content.cld.iop.org/journals/1945-7111/162/14/A2737/revision1/d0004.gif)
![Equation ([5])](https://content.cld.iop.org/journals/1945-7111/162/14/A2737/revision1/d0005.gif)
In a recent study by our group,57 the detection of gaseous POF3 at high positive potentials using online electrochemical mass spectrometry (OEMS) suggested that water may be formed during the oxidation of the electrolyte at high anodic potentials, thereby promoting the formation of HF.
The amount of metals deposited on the graphite electrode can be calculated using the copper current collector as internal standard. From this, the resulting loss of transition metals relative to the initial active mass of NMC can be determined and is shown in Table II, whereby it is assumed that a loss (y) about 1% of transition metal in the NMC will result in a maximum loss of 4% (4y) of cyclable lithium due to charge compensation of the transition metal cation leaving the structure.
Table II. Amounts of transition metals (TMs) deposited on the graphite electrodes for cells cycled at different positive cutoff potentials and temperatures after the experiments shown in Figure 1. Data are based on PGAA analysis.
| Deposited TMs | Loss of TMs | ||
|---|---|---|---|
| Cells | [μg] | [μmol] | [mol%] |
| 4.2V/25°C | 6.2 | 0.11 | 0.08 |
| 4.2V/60°C | 19.3 | 0.35 | 0.26 |
| 4.6V/25°C | 61.2 | 1.07 | 0.77 |
The data in Table II (right-most column) shows, that even for the cell cycled at the severest conditions of 4.6V/25°C, the loss of cyclable lithium due to a loss of active cathode material would be less than 5%, which cannot explain the huge capacity fade of these aged cells (∼125 mAh/gNMC or ∼65% loss of capacity). As a consequence, active NMC material loss due to transition metal dissolution seems to be negligible in the cells cycled in our study (Figure 1).
Based on this analysis, it is therefore more likely that the large capacity losses at either 4.6 V positive cutoff potential or at 60°C are due to excessive anode SEI growth caused by transition metal deposition as reported in the literature.17,18,45,58 Generally, accelerated growth of the SEI may result from an increase of the electronic conductivity of the SEI due to the precipitation of transition metals into it.45 For example, it was shown that the addition of transition metal salts to the electrolyte would decrease the cycle-life of full-cells, and surface analysis of the graphite anode revealed that the SEI layer growth was facilitated by transition metal addition.18 It was also suggested that Mn undergoes several reactions at the anode (i.e., Mn2+ → Mn0 → MnCO3 + 2Li → Mn0 + Li2CO3) which lead to cracks that favor electrolyte decomposition and further film growth. As a result, Mn contamination of the SEI should lead to the loss of active lithium.17 This would be consistent with what we have observed for the aged 4.2V/60°C cells, where the loss of active lithium was very large (see Table I) and where a substantial amount of Mn was found to be deposited on the graphite anodes (see Figure 10). On the other hand, in addition to a loss of active lithium, a substantial impedance growth was observed for the aged 4.6V/25°C cells (see Figure 9), which results in capacity losses far beyond those related to active lithium loss (see Table I).
Half-cell studies
In an attempt to deconvolute the impedance growth observed by AC impedance measurements (without reference electrode) on the aged full-cells (see Figure 9), electrodes were harvested from the aged full-cells in the discharged state and assembled in Li/NMC and Li/graphite half-cells. The rate-capability curves of fresh and aged Li/NMC and Li/graphite half-cells are presented in Figures 11a and 11b, respectively.
A comparison of half-cells with pristine NMC and graphite electrodes (gray lines in Figure 11) and half-cells with anodes/cathodes harvested from the aged 4.2V/25°C cells (black lines in Figure 11) clearly confirms that the observed full-cell capacity loss is mainly due to the loss of active lithium (see Table I), as the half-cell rate capability is unchanged. In the case of half-cells with anodes/cathodes harvested from the aged 4.2V/60°C cells (blue lines in Figure 11), significant differences to pristine electrodes can only be observed for the graphite anodes, indicating increased anode impedance. This is consistent with the study by Zheng et al.,12 who upon extended cycling of graphite/NMC half-cells to 4.3 V found no indication for increased NMC impedance but observed increased graphite impedance. However, the half-cell rate capability of the NMC electrode harvested from the aged 4.6V/25°C cells (red line in Figure 11a) is substantially reduced, indicating either a substantial loss of active material or substantially increased impedance. Since the total loss of active NMC material due to transition metal dissolution is minor (see Table II), the observed behavior must be due to increased charge transfer resistance and/or surface film resistance. While our XRD analysis does not detect any bulk structural changes of the NMC material aged in the 4.6V/25°C cells, the increased impedance might be due to surface structural changes which would not be detectable in our XRD measurements. While the rate capability of the graphite electrodes harvested from aged 4.6V/25°C cells is also substantially reduced (red line in Figure 11b), it is therefore quite clear that the capacity loss in the 4.6V/25°C cells (see Figure 1) is not only due to an impedance growth of the anode but also of the cathode (in addition to the loss of active lithium shown in Table I).
The half-cell data in Figure 11 can also be used to try to compare the loss of active lithium obtained from XRD analysis (see Table I) with that which could be inferred from the first charge and discharge capacity of the harvested NMC half-cells. Table III shows the first cycle charge and discharge capacity at 0.1 C of NMC cathodes harvested from aged cells in the discharged state in comparison to an NMC electrode just after formation. For the NMC cathodes harvested from the aged 4.2V/25°C and 4.2V/60°C cells, the half-cell discharge capacity corresponds to that of a pristine NMC electrode after formation (first row of Table III) and the difference between the capacity in the first charge and the discharge should represent the amount of active lithium loss and, indeed, matches nicely the results from the ex situ XRD measurements (see right-most column in Table III). However, for the aged NMC cathode harvested from the 4.6V/25°C cell, the half-cell discharge capacity is only 86 mAh/gNMC, so that the difference between the first charge and discharge cycle half-cell capacity does not any more allow to determine the loss of active lithium! Thus, in the case of severe impedance growth, the latter can only be determined from the XRD analysis or, alternatively, from chemical analysis of the lithium content of the harvested NMC sample.
Table III. First cycle capacity at 0.1 C of aged and fresh NMC electrodes assembled in new half-cells (data in Figure 11a) and comparison to capacity loss found with ex situ XRD measurements (from Table I).
| NMC new half-cell 1st | Ex situ | |||
|---|---|---|---|---|
| cycle capacities | XRD data | |||
| Charge | Discharge | Li loss | Li loss | |
| Cells | [mAh/g] | [mAh/g] | [mAh/g] | [mAh/g] |
| after formation | 153 | 153 | — | |
| 4.2V/25°C | 136 | 150 | 14 | 10.6 |
| 4.2V/25°C | 140 | 149 | 9 | 10.3 |
| 4.2V/60°C | 88 | 149 | 61 | 64.2 |
| 4.2V/60°C | 85 | 149 | 64 | 67.8 |
| 4.6V/25°C | 43 | 86 | 43 | 60.9 |
| 4.6V/25°C | 20 | 71 | 51 | 65.9 |
Conclusions
Using in situ XRD analysis during the initial charge/discharge of graphite/NMC full cells, the first cycle irreversible capacity loss (ICL) of NMC was confirmed not to be caused by oxidative processes occurring on the NMC surface but to result from sluggish lithium diffusion into the host structure of Li1-xNi1/3Mn2/3Co1/3O2 when the lithium content (1-x) exceeds 0.915 (x < 0.085). Given enough time, e.g., by holding the cell at constant voltage after the first discharge, the NMC can be nearly reversibly lithiated back to its initial lithium content. Consequently, in graphite/NMC full-cells, the loss of active lithium due to the ICL of NMC and the graphite SEI formation are not additive, and the loss of active lithium corresponds to the larger of the two contributions.
A correlation between the lithium content in NMC with its lattice parameters, i.e., with the c/a ratio, allows a convenient quantification of the loss of active lithium during extended cycling by determining the c/a ratio of harvested NMC cathodes in their discharged state using ex situ XRD. With this new approach, it could be shown that the capacity loss of graphite/NMC cells cycled to a positive cutoff voltage of 4.2 V over 300 cycles is mainly due to the loss of active lithium, whereby these losses are minor at 25°C and rather large at 60°C. This strong temperature dependence is ascribed to the significant amount of predominantly Mn dissolution at 60°C, as demonstrated by Prompt Gamma Activation Analysis (PGAA) of harvested graphite anodes, which is also accompanied by partial anode SEI dissolution and re-formation
For graphite/NMC cells cycled at a positive cutoff voltage of 4.6 V at 25°C, a so-called "rapid rollover capacity loss" was observed and only about half of the capacity loss could be ascribed to a loss of active lithium, while significant amounts of Mn, Co, and Ni were found on the harvested graphite anodes. Full cell AC impedance and charge/discharge cell voltage profiles indicated a significant growth of cell impedance, which has commonly been ascribed to additional impedance growth of graphite electrodes in the presence of transition metal dissolution. However, half-cell measurements of harvested aged NMC and graphite electrodes clearly showed significant impedance growth of both electrodes.
In summary, increasing the temperature is less detrimental than applying high cutoff potentials as the latter one forces enhanced electrolyte oxidation and structural stresses in the cathode active material.
Acknowledgments
The authors thank the Heinz Maier-Leibnitz Zentrum (MLZ) for granting us beam time at the neutron source and express their thanks and gratitude to Z. Revay for helpful discussions during the PGAA data analysis. We also acknowledge the BMBF (Federal Ministry of Education and Research, Germany) for funding project "ExZellTUM", grant number 03X4633A.