Abstract
The effect of mixtures of lithium hexafluorophosphate (LiPF6) and lithium bis(fluorosulfonyl)imide (LiFSI) with different molar ratios in the electrolyte of Li[Ni1/3Mn1/3Co1/3]O2/graphite pouch cells was studied using the ultra-high precision charger (UHPC) at Dalhousie University, an automated storage system, electrochemical impedance spectroscopy (EIS) and gas evolution measurements. Ethylene carbonate: ethyl methyl carbonate (EC:EMC, 3:7 wt.% ratio) solvent was used as the base solvent in these studies. Li[Ni1/3Mn1/3Co1/3]O2/graphite pouch cells containing both LiPF6 and LiFSI (with a total salt content of 1 M) with or without 2% VC showed smaller or similar self-discharge, lower charge transfer resistance (Rct), and smaller amounts of gas evolution during formation and during storage at high temperature, compared to cells containing only 1 M LiPF6 with and without 2% VC, respectively. For cells without 2% VC, cells with 0.3 M LiPF6 + 0.7 M LiFSI showed the smallest self-discharge and the lowest Rct after 40°C storage. For cells with 2% VC, cells with 0.5 M LiPF6 + 0.5 M LiFSI + 2% VC showed the lowest voltage drop and the lowest Rct after 40°C storage. The UPHC cycling data showed that cells containing LiPF6:LiFSI mixtures with 2% VC showed similar coulombic efficiency (CE), and similar charge end-point capacity slippage compared to cells with 1 M LiPF6 + 2% VC. The combination of LiFSI and LiPF6 in electrolytes that contain 2% VC can bring benefits of improved storage properties and reduced gas evolution at high temperature while maintaining all other properties of the cells in experiments limited to 4.2 V. However, preliminary experiments at voltages up to 4.45 V suggest that LiFSI may lead to increased transition metal dissolution (Ni, Mn and Co) compared to lithium bistrifluoromethane sulfonyl imide (LiTSFI), another salt additive used to improve storage properties and reduce gassing.
Export citation and abstract BibTeX RIS

This is an open access article distributed under the terms of the Creative Commons Attribution 4.0 License (CC BY, http://creativecommons.org/licenses/by/4.0/), which permits unrestricted reuse of the work in any medium, provided the original work is properly cited.
The use of electrolyte additives is one of the most economical and effective ways to improve the performance of Li-ion cells.1,2 Vinylene carbonate (VC) has been shown to be an effective electrolyte additive for the improvement of cell performance.3,4 Burns et al.5 showed that LiCoO2/graphite cells with 2% VC demonstrated improved life-time with a higher coulombic efficiency (CE) and lower charge and discharge end-point capacity slippage rates, compared to cells without VC. Lithium hexafluorophosphate (LiPF6) is the most commonly used salt in Li-ion cells, due to balance of properties, such as high dissociation constant, high conductivity and good electrochemical stability against Al corrosion.1,2,6,7
Recent studies8–10 have shown that lithium bis(fluorosulfonyl)imide (LiFSI) can be thermally stable up to 200°C. However, Al current collector corrosion was observed in Li-ion cells with LiFSI-based electrolytes.10–14 The Al corrosion problem for LiFSI-based electrolytes can be readily solved by the addition of LiPF6, which can be decomposed to form a protective film of AlF3.13,14 Zhang et al.11 showed that the addition of 0.2 M LiFSI into 1 M LiPF6-based electrolyte can effectively improve cycling stability and rate performance and reduce charge transfer resistance of Li/graphite half cells. However, there is no systematic study of the impact of different molar ratios of LiPF6 and LiFSI on the performance and life-time of full Li-ion cells in the literature.
In this work, the ultra-high precision charger (UHPC) at Dalhousie University, which can measure the coulombic efficiency (CE) to an accuracy of ±0.003% and a precision of ±0.001%,15 was used, along with EIS, an automated storage system and gas evolution measurements to study the impact of changes to the molar ratio of LiPF6 and LiFSI, on Li[Ni1/3Mn1/3Co1/3]O2/graphite pouch cells. The total molarity of salt was kept fixed at 1 M. The studies were made using 1 M salt in EC:EMC (3:7 by weight) solvent either without or with 2% vinylene carbonate (VC) by weight (compared to the total electrolyte weight).
Experimental
Machine-made Li[Ni1/3Mn1/3Co1/3]O2/graphite pouch cells (402035 size, 240 mAh, balanced for 4.4 V operation but used only at 4.2 V operation, where the capacity is 220 mAh) without electrolyte were supplied by a reputable manufacturer (Li-Fun Technology, Xinma Industry Zone, Golden Dragon Road, Tianyuan District, Zhuzhou City, Hunan Province, PRC, 412000, China). The pouch cells are 40 mm long × 20 mm wide × 3.5 mm thick. The electrode composition in the cells was as follows: Positive electrode −96.2%:1.8%:2.0% = Active Material:Carbon Black:PVDF Binder; Negative electrode −95.4%:1.3%:1.1%:2.2% = Active material:Carbon Black:CMC:SBR. The positive electrode coating had a thickness of 105 μm and was calendared to a density of 3.55 g/cm3. The negative electrode coating had a thickness of 110 μm and was calendared to a density of 1.55 g/cm3. The positive electrode coating had an areal density of 16 mg/cm2 and the negative electrode had an areal density of 9.5 mg/cm2. The positive electrode dimensions were 200 mm × 26 mm and the negative electrode dimensions were 204 mm × 28 mm. Both electrodes were coated on both sides, except for small regions on one side at the end of the foils leading to an active area of approximately 100 cm2. The electrodes are spirally wound, not stacked, in these pouch cells. Prior to electrolyte filling, cells were dried in a vacuum oven at 80°C for 14 h. Then the cells were transferred immediately to an argon-filled glove box for filling and vacuum sealing. Mixtures of LiPF6 (BASF, > 99.9%) and LiFSI (HSC Corporation, > 99.98%) with different molar ratios (but having a total salt content of 1 M) were added as salts in ethylene carbonate: ethyl methyl carbonate (EC:EMC, 3:7 wt.% ratio, BASF) solvent. 2% VC (BASF, 99.97%) was used as an electrolyte additive in some cases.
Duplicate cells were made for each concentration and additive in order to ensure repeatability of the measurements. After filling with 0.9 g of electrolyte and vacuum sealing (MTI Corporation, MSK-115A) in an argon-filled glove box, a 24 h hold at 40. ± 0.1°C and 1.5 V were used to ensure complete wetting of the cell coil. The first charge cycle (called the formation process here) was charging at 11 mA to 3.5 V. Work by Aiken et al.16 showed that all gas produced below 4.2 V has been evolved by 3.5 V during the first charge of the cell. Following the formation process, cells were degassed in the glove box and vacuum sealed again. The total volume of gas generated in the cells during the formation, and subsequently during storage and during cycling were measured using Archimedes' principle.16
An automated storage system, built at Dalhousie University,17 was used to measure the self-discharge of cells stored under open circuit conditions. Cells were charged to 4.20 V on a Maccor 4000 series charger and held at 4.20 V until the current dropped below the corresponding C/1000 current, then cells were put on the automated storage system. The open circuit potential of each cell automatically measured every 6 hours (for 500 hours) at a fixed temperature of 40. ± 0.1°C or at 60.0 ± 0.1°C. Two successive storage tests were performed in some cases with the first at 40°C and the second, after recharging to 4.20 V, at 60°C. After each storage test, electrochemical impedance spectroscopy (EIS) measurements were performed at 10. ± 0.1°C for all the cells after they were equilibrated at 3.8 V. The EIS measurements were made using a Bio-Logic VMP3, with a 10 mV peak to peak perturbation and a frequency range from 10 mHz to 100 kHz. Impedance data were collected at 10. ± 0.1°C in order to emphasize the differences between cells.
After a single storage test at 40°C, some cells were cycled using the UHPC between 2.8 and 4.2 V at 40 ± 0.1°C using currents corresponding to C/22 for 700 hours where comparisons were made. After the UHPC cycling, EIS was used to measure the combined charge transfer resistance (Rct) of both electrodes in each cell at 3.8 V and 10. ± 0.1°C.
Coin-type LiCoO2/Li (LCO/Li) cells were constructed to compare the properties of LiFSI with lithium bistrifluoromethane sulfonyl imide (LiTFSI), called HQ-115 here. HQ-115 was obtained from 3 M Co and was >99.9% pure. "High voltage" LCO was obtained from Umicore and was fabricated into electrodes on Al foil along with 5 wt% Super P carbon black (Timcal) and 5 wt% PVDF (Kynar 301 F – Elf Atochem). The areal capacity of the electrodes charged to 4.45 V was 2.4 mAh/cm2. Coin cells used 2 layers of Celgard 2325 separator. Three electrolytes blends were studied in the coin cells: a) EC:EMC 3:7(by weight) with 1.0 M LiPF6; b) EC:EMC 3:7 with 0.9 M LiPF6 and 0.1 M HQ-115 and c) EC:EMC 3:7 with 0.9 M LiPF6 and 0.1 M LiFSI. Coin cells were tested at 25°C using currents corresponding to C/20 to an upper cut-off of 4.45 V.
Results and Discussion
Figure 1 shows cell voltage versus time during the first storage at 40°C and the second storage at 60°C as well as corresponding EIS measurements after each storage period for cells containing mixtures of LiFSI and LiPF6 with different molar ratios and/or 2% VC as indicated in the legend. The "charge transfer resistance" (Rct) is marked in Figure 1d and taken to be the diameter of the overlapping semicircles in the Nyquist plots.6 The diameter of the overlapping semicircles contains more contributions than just the contributions of the true charge transfer resistances – it contains contact resistance, desolvation and transport through the SEI. Nevertheless, we lump all these contributions together and refer to the diameter of the semicircle as Rct. [Note: Different authors interpret impedance spectra of Li-ion cells in different ways. Our interpretation follows that of Atebamba et al.].18 The cell voltage decreases during storage because electrolyte oxidation at the positive electrode (or transition metal dissolution) causes simultaneous insertion of Li ions into the positive electrode (which causes the cell voltage to decrease) to maintain charge neutrality in the electrolyte.19,20 Normally, one would expect electrolyte oxidation to proceed more rapidly at 60°C than at 40°C. However, the voltage drop during the second storage at 60°C is smaller for some cells than the voltage drop for the same cells during the first storage at 40°C apparently due to thickening of passive films of the positive electrode during the first storage period.

Figure 1. Voltage as a function of storage time (a) during the first storage at 40°C and (c) during the second storage at 60°C, and the corresponding Nyquist plots at 10°C (b) after the first storage at 40°C and (d) after the second storage at 60°C for cells containing different LiPF6:LiFSI ratios with and without 2% VC. The reader is cautioned that the vertical and horizontal scales in the impedance spectra are different. This has been done so that differences in the results for different cells are more readily apparent.
Figure 2 shows a summary of voltage drop during the first storage at 40°C, the second storage at 60°C as well as the corresponding Rct after each storage period, collected when cells were stable at 3.8 V and 10°C. Cells containing mixtures of LiFSI and LiPF6 without 2% VC show smaller voltage drop during storage and smaller Rct after each storage than cells containing 1 M LiPF6 alone. Moreover, cells containing mixtures of LiFSI and LiPF6 with 2% VC show smaller voltage drop and smaller or comparable Rct after each storage period than cells with 1 M LiPF6 + 2% VC. The addition of 2% VC reduces the voltage drop during storage for cells containing different molar ratios of LiPF6 and LiFSI, compared to cells containing the same molar ratio of salts without 2% VC, but adding 2% VC increases Rct after storage.
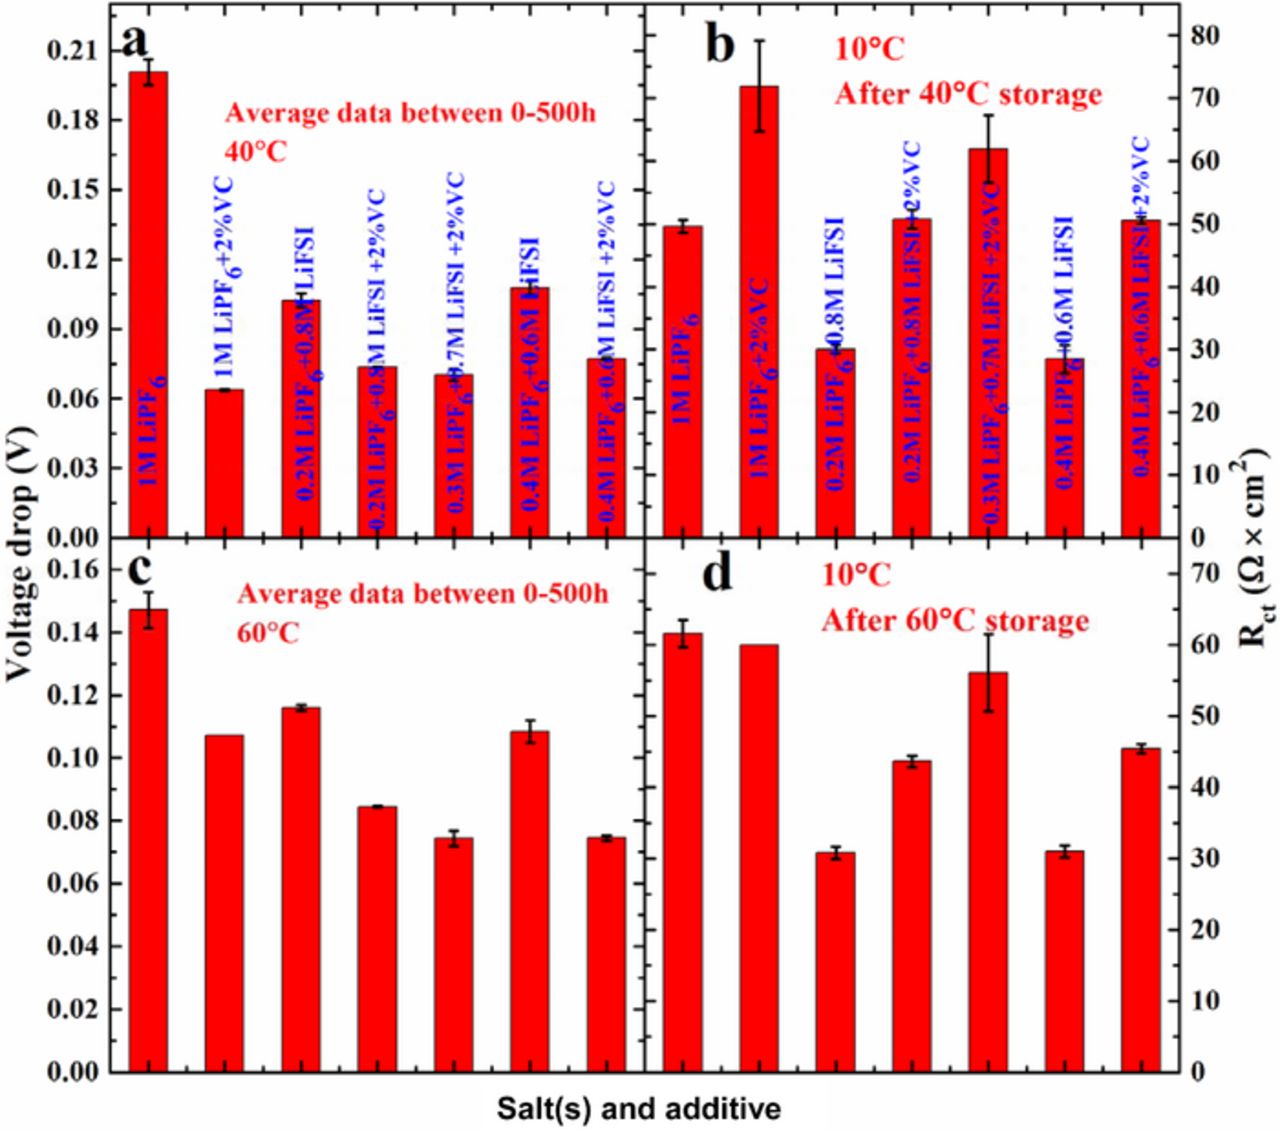
Figure 2. Summary of the voltage drop (a) during the first storage at 40°C and (c) during the second storage at 60°C, and the corresponding Rct at 10°C (b) after the first storage at 40°C and (d) after the second storage at 60°C for cells containing different LiPF6:LiFSI ratios with and without 2% VC.
It is important to minimize gas generation in pouch-type Li-ion cells. Figure 3 shows the volume of gas generated during formation and during two consecutive storage periods at 40°C and 60°C, respectively, for cells containing different molar ratios of LiPF6 and LiFSI with and without 2% VC. The cells were degassed after formation, so the gas volume reported after storage is the total gas volume observed after the 40°C storage and then after the 60°C storage with no intermediate degassing. The work by Aiken et al.16 showed that gas volumes in pouch cells can decrease with time at elevated temperatures. Cells without 2% VC show that about 0.75 mL of gas is produced during formation, independent of the LiPF6:LiFSI ratio. Cells with 2% VC show only about 0.1 mL of gas during formation, indicating that VC suppresses the generation of gas during formation as was shown in ref. 16. Gas generated during formation for cells with 2% VC is independent of the LiPF6:LiFSI ratio. After the 1st storage at 40°C, cells without 2% VC show about 0.05–0.1 mL of gas, and cells with mixed salts show lower gas generation than cells with 1 M LiPF6 alone. For cells with 2% VC after the 1st storage at 40°C, about 0.03–0.05 mL of gas was observed, and cells that contain any LiFSI have slightly larger gas generation than cells with only 1 M LiPF6. After the 2nd storage at 60°C, cells with no VC and with 1 M LiPF6 alone show a large amount of gas generation (about 0.65 mL), but cells with mixed salts and no VC show about -0.01 to 0.03 mL gas generation. After the 2nd storage at 60°C, cells with 1 M LiPF6 + 2% VC show about 1.1 mL gas but the addition of 2% VC to cells with mixed salts does not lead to any significant gassing at all. Therefore, LiFSI is a very effective salt, when used in combination with LiPF6, for suppressing gas generation in cells that contain VC during 60°C storage.
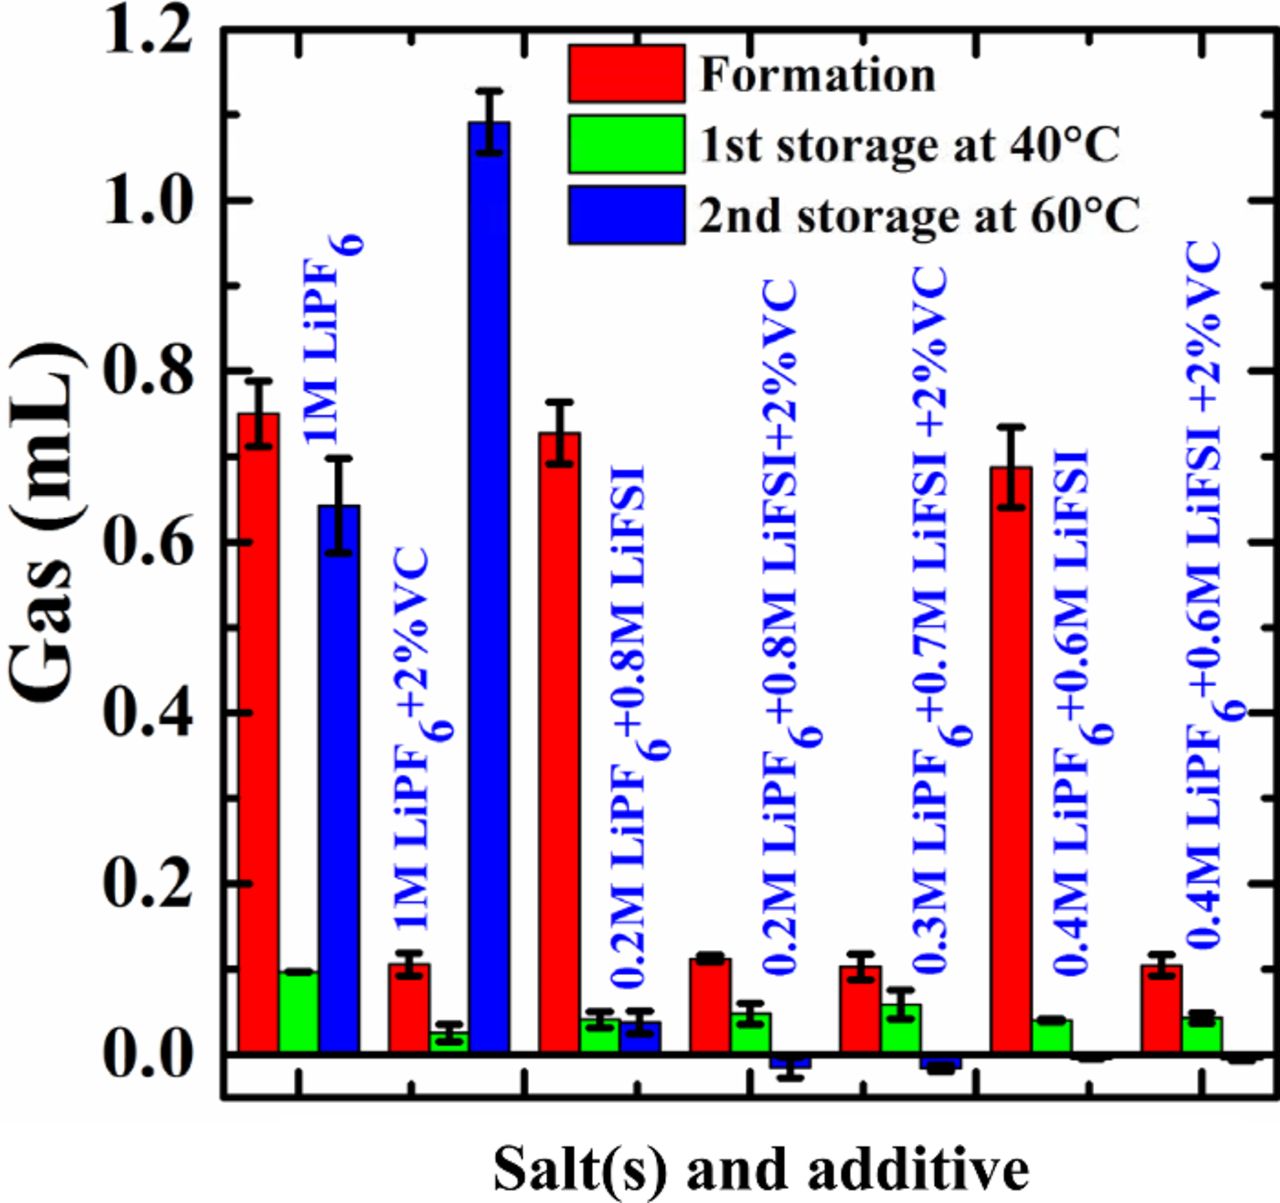
Figure 3. Gas generated during the formation step, the first storage at 40°C and the second storage at 60°C as indicated for cells containing different LiPF6:LiFSI ratios with and without 2% VC.
Figure 4 shows a summary of gas generation during formation and during storage at 40°C, voltage drop and Rct after storage at 40°C for cells containing different molar ratios of LiPF6 and LiFSI both with and without 2% VC. During formation (Figure 4a), cells with no VC show large amounts of gas (between 0.6 to 0.8 mL), independent of the LiPF6:LiFSI ratio, and cells with 2% VC show much smaller amounts of gas (about 0.09 to 0.12 mL) than cells with no VC. During storage (Figure 4c), cells with any amount of LiPF6 and with or without 2% VC show a similar amount of gas generation (0.03 to 0.1 mL), but cells containing only LiFSI with or without 2% VC show a larger amount of gas (0.25–0.35 mL) during storage. Figures 4b and 4d show the voltage drop during 40°C storage and Rct after 40°C storage. For cells with no VC, both the voltage drop and Rct after storage decrease with increasing amounts of LiFSI in the 1 M salt mixtures up to 0.3 M LiPF6 + 0.7 M LiFSI, then both the voltage drop and Rct after storage increase with increasing content of LiFSI in the 1 M salt mixtures up to 1 M LiFSI. A similar observation was made for cells with 2% VC; the optimized salt content ratio for cells to show minimum voltage drop and minimum Rct after storage is approximately 0.5 M LiPF6 + 0.5 M LiFSI + 2% VC. Generally, cells with 2% VC show smaller voltage drop but larger Rct after storage than cells with no VC.

Figure 4. Summary of gas generated during (a) the formation and (c) the first storage at 40°C, (b) voltage drop during storage and (d) Rct after the first storage at 40°C for cells containing different LiPF6:LiFSI ratios with and without 2% VC.
Figure 5 shows the coulombic efficiency (CE), charge end-point capacity, discharge capacity and the difference (ΔV) of the average charge voltage from the average discharge voltage versus cycle number, collected using the UHPC, for cells containing different molar ratios of LiPF6 and LiFSI with and without 2% VC. All cycling was performed at C/22 and at 40°C after storage. The CE values after a 500 h storage period are higher than those for cells directly cycled (for example, see data in reference 21 for cells with 1 M LiPF6 EC:EMC + 2% VC for comparison) due to a maturation of the negative electrode SEI during the storage period. Figure 5c shows that the cell capacity initially increases slightly during cycling after the storage period and Figure 5a shows that the CE initially decreases before stabilizing. During storage at a full state of charge, some lithium in the graphite slowly migrates to the overhang region of the anode. After the storage period some of this lithium in the overhang, that above the average state of charge of the anode during 100% depth of discharge (DOD) cycling, is slowly made available during cycling, causing the increase in capacity and decrease in CE shown in Figures 5c and 5a, respectively. Figure 5a shows that cells containing mixed salts and 2% VC show similar CE to cells containing 1 M LiPF6 + 2% VC. [Note: The reader is asked to appreciate the y-axis scale in Figure 5a]. Cells with no VC were not evaluated using UHPC cycling because their storage behavior was worse than cells with 2% VC, indicating increased rates of parasitic reactions, and due to lack of resources.
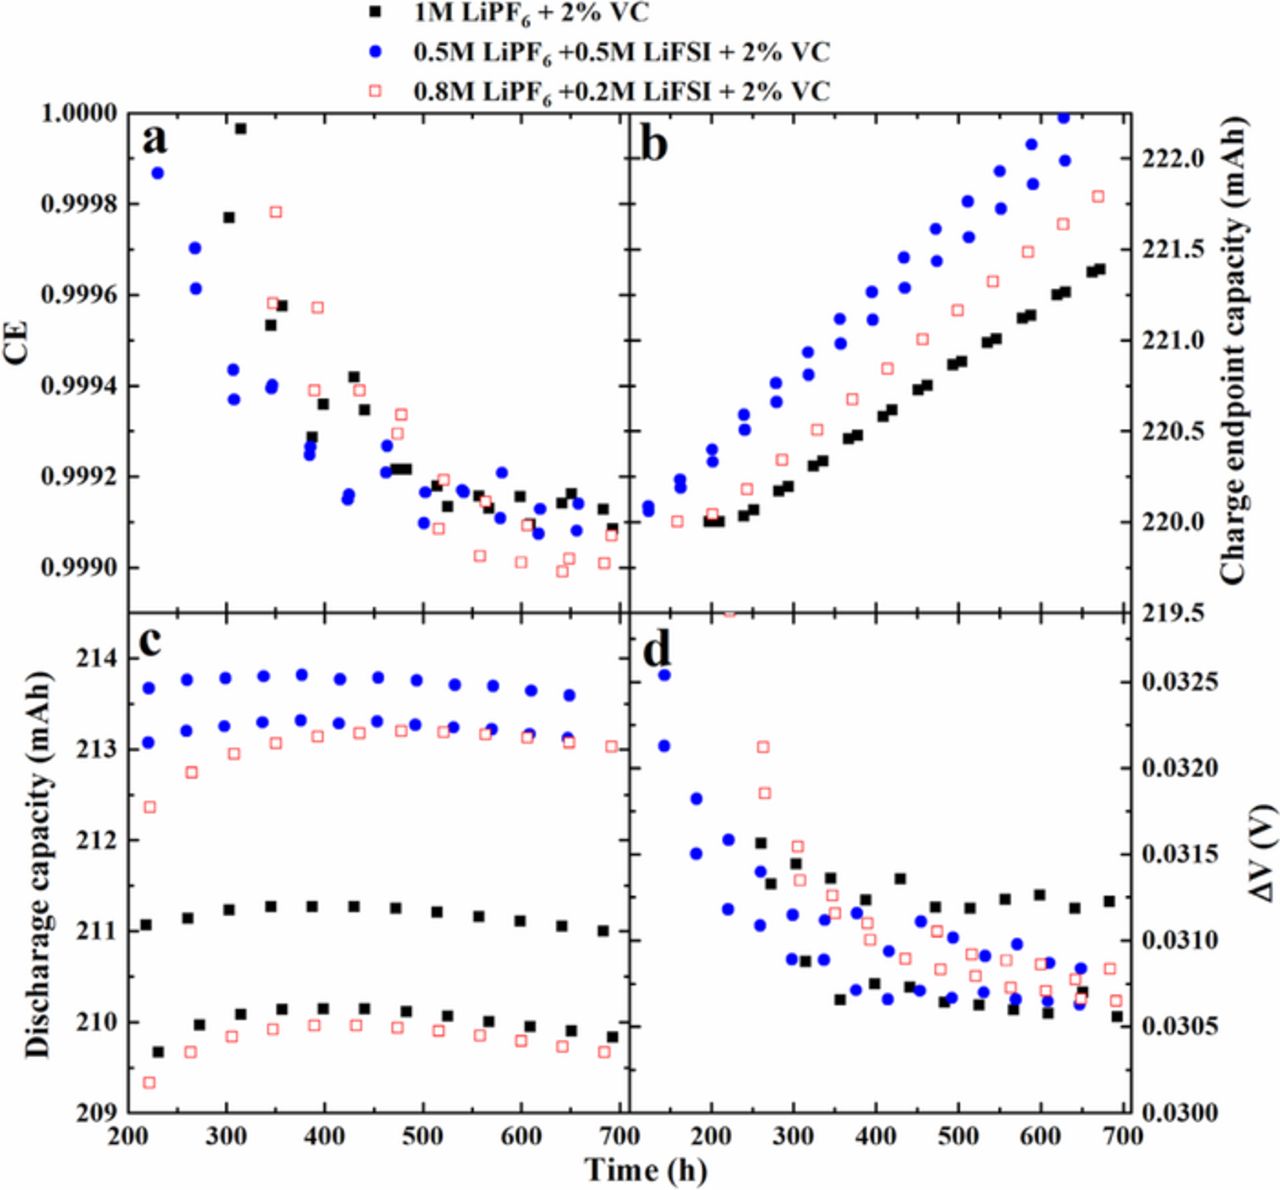
Figure 5. (a) CE, (b) charge end-point capacity, (c) discharge capacity and (d) difference between average charge and discharge voltage (∆V) as a function of cycle time for cells containing different LiPF6:LiFSI ratios with 2% VC at 40°C. Testing was done at C/22 between 2.8 and 4.2 V.
The charge end-point capacity slippage (slope of the charge end-point capacity versus cycle number graph in Figure 5b) is another important parameter to evaluate cell performance.22,23 All the charge end-point capacities in Figure 5b were intentionally shifted to the same starting point of 220 mAh at about 100 h so that small differences could be easily distinguished. Figure 5b shows that the charge end-point capacity slippage increases slightly as the LiFSI content in the electrolyte increases for cells with 2% VC. Figure 5d shows that none of the tested cells shows an increase in charge-discharge polarization during the UHPC cycling.
Figure 6 shows a summary of the coulombic inefficiency per hour (CIE/hour – calculated as (1-CE)/(time of one cycle)), charge end-point capacity slippage (given as mAh/h, reported as μA), discharge capacity fade rate (given as mAh/h, reported as μA) and polarization growth rate for the same cells as described in Figure 5. The average of data for two cells is plotted in Figure 6 and the time where data were analyzed is given in the legends in each panel of Figure 6. Lower CIE/hour indicates higher coulombic efficiency which has been directly linked with longer cycle life.24 Cells with both LiPF6 and LiFSI containing 2% VC show slightly higher (worse) CIE/h than cells with 1 M LiPF6 + 2% VC (Figure 6a). Figure 6b shows that cells with 2% VC and with mixed salts have slightly larger (worse) charge end-point capacity slippage than cells with 2% VC and only LiPF6. Figure 6c suggests that cells with mixed salts and 2% VC have slightly smaller discharge capacity fade rates than cells with 1 M LiPF6 + 2% VC but the differences very small and are within error. By contrast, the charge end-point capacity slippage results are more robust and suggest the mixed salt systems with 2% VC are worse than LiPF6 alone with 2% VC. Figure 6d suggests that cells with mixed salts and 2% VC have slightly smaller polarization growth rate than cells with 1 M LiPF6 + 2% VC, but again the results are barely outside error as can be gleaned from an examination of the raw data in Figure 5d where all cells look very similar. In addition, the vertical scale in Figure 5d is an incredibly fine scale so the changes summarized in Figure 6d are very very small. All in all, the differences in the UHPC results between 1 M LiPF6 + 2% VC and 0.5 M LiPF6 + 0.5 M LiFSI + 2% VC are very minor and not expected to impact cycle life or calendar life significantly for cells destined for applications with lifetimes less than a few years.
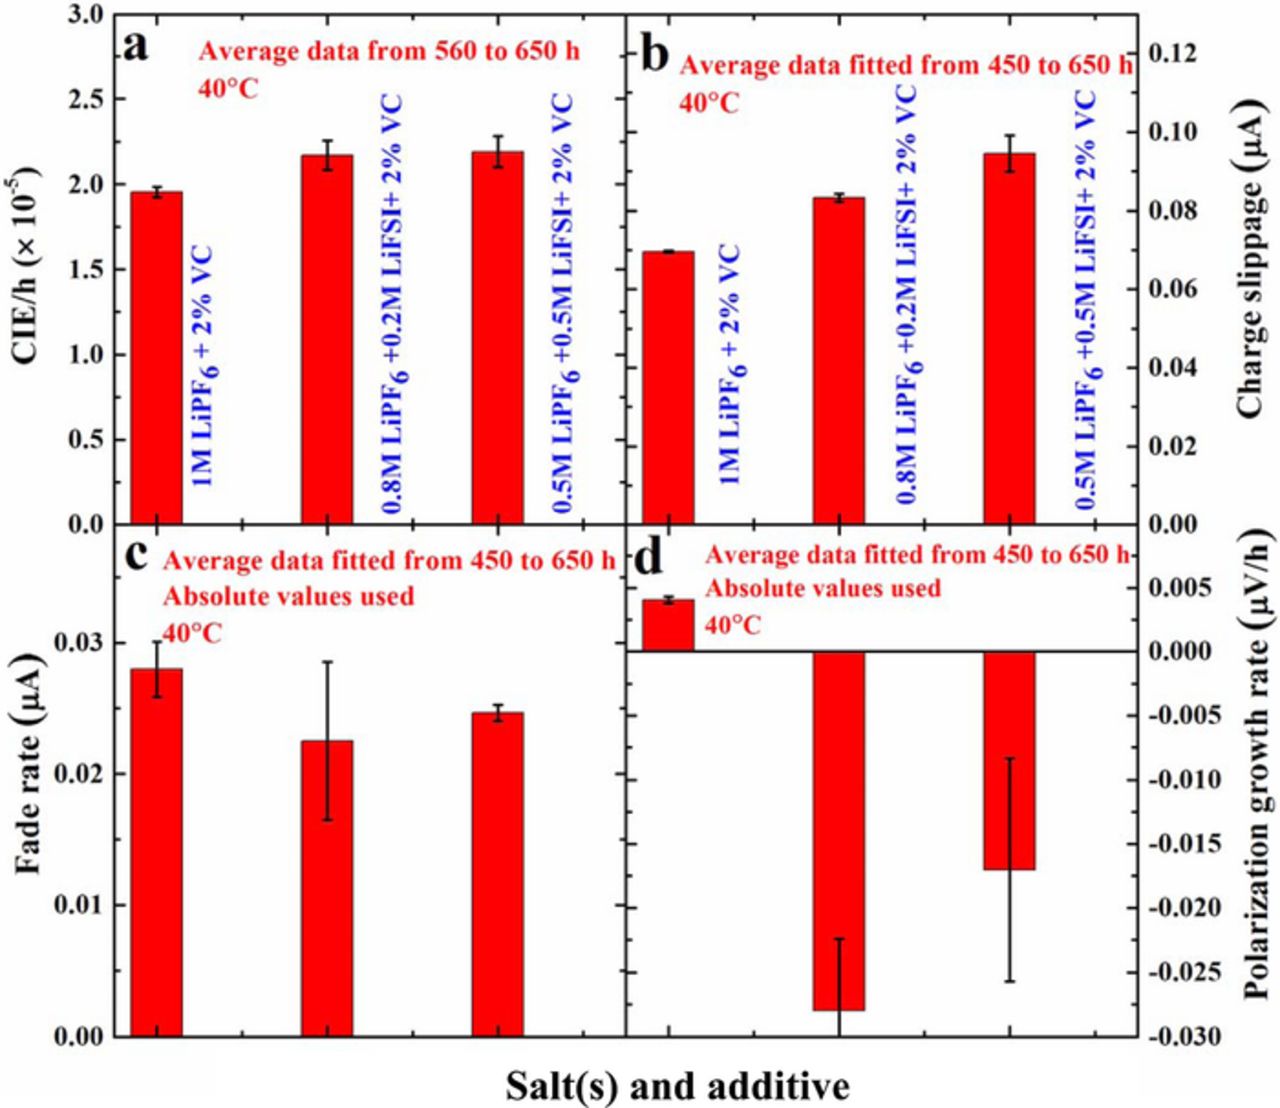
Figure 6. (a) CIE/h, (b) charge end-point capacity slippage per hour, (c) discharge fade per hour and (d) polarization growth rate for cells containing different LiPF6:LiFSI ratios with 2% VC. The average of data for two cells is reported and the data extraction methods are indicated in the legends.
Figure 7 shows the electrochemical impedance spectra for cells with different LiPF6:LiFSI ratios with 2% VC, collected after the UHPC cycling at 40°C. The impedance spectra were collected at 3.8 V and at 10°C. The width of the semi-circle is due to the sum of the positive and negative electrode charge transfer resistances, and it is important to minimize the width of this semi-circle to create cells with high rate capability. Figure 7b shows a summary of the charge transfer resistances for the cells described by Figure 7a. Figure 7b clearly shows that cells 0.5 M LiPF6 + 0.5 M LiFSI + 2% VC have smaller Rct than cells with 1 M LiPF6 + 2% VC and cells with 0.8 M LiPF6 + 0.2 M LiFSI + 2% VC. Cells with 0.8 M LiPF6 + 0.2 M LiFSI + 2% VC show larger Rct than cells with 1 M LiPF6 + 2% VC.
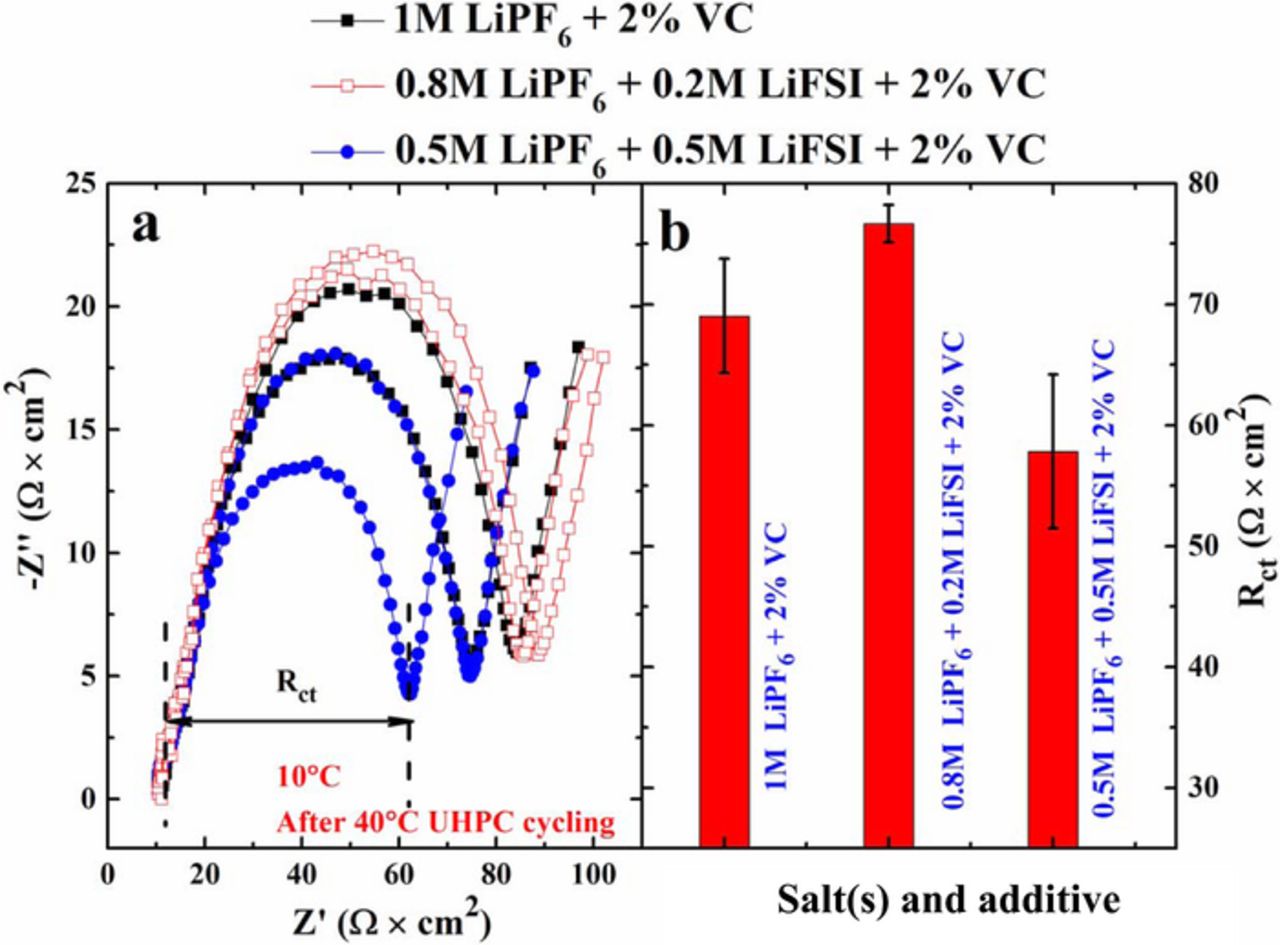
Figure 7. (a) Nyquist plots and (b) the corresponding Rct after the 40°C UHPC cycling for cells containing different LiPF6:LiFSI ratios with 2% VC. EIS data were collected at 10°C and 3.8 V. The reader is cautioned that the vertical and horizontal scales in the impedance spectra are different. This has been done so that differences in the results for different cells are more readily apparent.
The results presented so far show that LiFSI can be a useful additive in NMC/graphite cells limited to 4.2 V. Figure 8 shows the first charge/discharge cycles for LCO/Li coin cells at 25°C and with currents corresponding to C/20 when the cells were charged to 4.45 V. The 6 cells shown used the electrolytes as indicated in the figure legend. The cells that incorporate 0.1 M LiFSI clearly showed increased irreversible capacity compared to the control cells and to cells that contain 0.1 M HQ-115. Like LiFSI, HQ-115 has also been shown to reduce gassing and improve storage properties in NMC/graphite cells containing VC or prop-1-ene 1,3 sultone (PES) electrolyte additives.25 In an attempt to understand the source of the increased irreversible capacity, the coin cells were disassembled. Visible black powdery deposits were observed on the negative coin cell casing in the cells containing LiFSI, suggesting undesirable parasitic reactions which are presumably related to the increased irreversible capacity. No similar black deposits were observed in the control cells and the cells with HQ-115. It is therefore our opinion that there could be issues with cells containing LiFSI when operated at potentials near 4.45 V. Further work is required to carefully study the stability of LiFSI at high potentials.

Figure 8. Potential versus capacity of the first cycle of LiCoO2/Li coin cells charged to 4.45 V at 25°C using currents corresponding to C/20.
Conclusions
The effect of varying the LiPF6:LiFSI ratio in Li[Ni1/3Mn1/3Co1/3]O2/graphite pouch cells with and without 2% VC was systematically studied using an automated storage system, EIS, gas evolution measurements and the UHPC. The results shows that adding LiFSI to electrolytes without VC brings improvements, but not to the level of 1 M LiPF6 + 2% VC. If LiFSI is added to LiPF6-based electrolytes with 2% VC there are several significant effects that occur:
- (1)Gas generation during elevated temperature storage is dramatically reduced;
- (2)Impedance after storage is reduced slightly for cells with mixed salts and 2% VC compared to cells with only LiPF6 and 2% VC;
- (3)Voltage drop during storage for cells with 2% VC and both LiPF6 and LiFSI is less than for cells with 2% VC and only LiPF6; and
- (4)The coulombic efficiency, charge end-point capacity slippage, discharge capacity fade rate and rate of polarization growth are not significantly compromised when LiFSI is substituted for LiPF6, at least up to 50%, in the presence of 2% VC in cells limited to 4.2 V.
The reasons why LiFSI imparts benefits to Li-ion cells is not understood at present. Careful surface science studies will be required to understand how the addition of LiFSI impacts the protective solid electrolyte interface films on both the negative and positive electrodes. Our research group has now started a major effort in such surface science studies26 so we are hopeful that one day some understanding will be possible. Nevertheless, these results suggest that LiFSI is an useful additive to use in cells with 2% VC to reduce gassing and improve storage properties at elevated temperatures. However, preliminary experiments suggest there may be stability issues with LiFSI at potentials near 4.45 V. Further work is required to carefully study LiFSI stability.
Acknowledgments
The authors thank NSERC, 3 M Canada for the funding of this work under the auspices of the Industrial Research Chairs program. DYW thanks IRM (Institute for Research in Materials at Dalhousie University) and DREAMS (Dalhousie Research in Energy Advanced Materials and Sustainability) for funding. The authors thank Dr. Jing Li of BASF for providing some of the additives and solvents used in this work. The authors thank Xiaodong Cao of HSC Corporation for providing LiFSI.