Abstract
To elucidate the pit initiation behavior of sensitized stainless steels, the anodic polarization of a single grain boundary was examined in 0.1 M NaCl (pH 5.4) at 298 K using a micro-electrochemical system. For Type 304 heat-treated at 923 K for 2 h, no pitting was initiated on a small area (ca. 100 μm × 100 μm) with a sensitized grain boundary without MnS inclusions. However, stable pitting was observed on the electrode area that was larger than ca. 200 μm × 200 μm. In situ microscopy revealed that the first step in corrosion was a spherical pit generated at a MnS inclusion at a sensitized grain boundary, and that intergranular corrosion started at the pit. The local depassivation of the Cr-depleted zone along the sensitized grain boundary was thought to be introduced by the dissolution of the inclusion. The co-existence of the MnS inclusion and the Cr-depleted zone was considered to be the critical factor in the pit initiation of sensitized stainless steels in NaCl solutions.
Export citation and abstract BibTeX RIS

This is an open access article distributed under the terms of the Creative Commons Attribution 4.0 License (CC BY, http://creativecommons.org/licenses/by/4.0/), which permits unrestricted reuse of the work in any medium, provided the original work is properly cited.
Stainless steels are widely used in chloride environments because of their high corrosion resistance, which is attributed to their high Cr content, at above 12 mass%.1 When stainless steels are heated to around 900 K (e.g., welding), sensitization occurs due to the formation of Cr-depleted zones at the grain boundaries. The susceptibility to intergranular corrosion and pitting at the grain boundaries increases as a result of sensitization-treatments.2
To assess the degree of sensitization and/or the mechanisms of intergranular corrosion, acidic solutions are usually used. ASTM A262 testing specification contains the following intergranular corrosion tests: 1) Huey test (boiling HNO3), 2) Strauss test (boiling H2SO4 + CuSO4 + metallic Cu), 3) and Streicher test (boiling H2SO4 + Fe2(SO4)3). After immersion, the specimens are visually examined and/or measured for weight loss. These methods have been widely and successfully used in corrosion engineering. ISO 12732 specifies a method that uses the double loop electrochemical potentiodynamic reactivation test (based on Ĉihal's method3). In this method, the standard solution is 0.5 M H2SO4–0.01 M KSCN, and the degree of sensitization can be evaluated quantitatively from the comparison of the peak current densities between the anodic scan and the subsequent cathodic scan.
Although acidic solutions are generally used to evaluate the degree of sensitization, in practical applications, pitting and stress corrosion cracking occur in stainless steels in near-neutral pH environments. NaCl solutions are used to evaluate the pitting corrosion resistance and the susceptibility of sensitized stainless steels to stress corrosion cracking (SCC). Cheng et al. studied the pitting corrosion of sensitized Type 304 stainless steel under wet-dry cycling and demonstrated that both the probability of pitting and the average size of the pit increased as a result of sensitization.4 It was suggested that the observed change in the pit morphology from round to an irregular shape could be attributed to preferential corrosion along the grain boundaries at the pit initiation locations. Hsu et al. evaluated the stress corrosion cracking susceptibility of Type 304L substrate and Type 308L weld metal in a salt spray containing 5 mass% NaCl at 80°C.5 They concluded that sensitization after cold rolling was practically harmful to the SCC resistance of Types 304L and 308L. While numerous SCC mechanisms have been proposed, it has not yet been clearly ascertained which of the models best explain the SCC behavior and susceptibility in various actual environments.6 It has been reported that cracks are often created by the initiation and growth of corrosion pits in near-neutral pH and mild environments.7,8 Because the susceptibility to SCC of sensitized stainless steels is closely related to pitting, it is important to elucidate the mechanism of pitting at the grain boundaries on sensitized stainless steels in detail. In this study, we focused on pit initiation at the sensitized grain boundaries in a 0.1 M NaCl solution.
The sensitization of Type 304 stainless steels occurs at higher temperatures due to Cr23C6 precipitation at the grain boundaries. Grain boundaries can be classified into low-angle and high-angle grain boundaries based on the extent of misorientation between the two neighboring grains. Another way to classify gain boundaries is by the degree of fit (Σ) between the lattice structures of the two grains, which is expressed in the coincident site lattice (CSL) theory by the reciprocal of the ratio of coincidence sites to the total number of sites.9 Grain boundaries with high-Σ valus (higher than 30) are regarded as random grain boundaries. On the other hand, the grain boundaries with low-Σ values (less than 30) are categorized as CSL boundaries. The grain boundary energy depends on the geometrical matching at the boundaries.10,11 CSL boundaries (with low-Σ values) are known to be lower-energy than random grain boundaries.12 During the sensitization heat-treatments, the Cr23C6 precipitation mainly occurs at high-energy grain boundaries. Therefore, Cr-depletion (sensitization) occurs more readily at the random grain boundaries than at the CSL boundaries.
In this study, a single grain boundary was targeted using micro-electrochemical techniques to elucidate the electrochemistry and pit initiation behavior at sensitized grain boundaries. Micro-electrochemical measurements are powerful techniques for the analysis of the electrochemical properties of a small area of a material.13–15 However, the occurrence of crevice corrosion between a sensitized grain boundary and the masking of the electrode area was expected. A micro-TIG (tungsten inert gas) welding technique was applied to prevent crevice corrosion. The intersections between the grain boundary and the masking positions of the electrode area were solution-treated by a micro-TIG welding system. Micro-scale anodic polarization was performed in a 0.1 M NaCl solution. Following polarization, the surface was observed, and the grain boundary was characterized. After describing this process and the obtained results in detail, the pit initiation mechanisms are discussed in this paper.
Experimental
Specimens and electrolytes
A commercial Type 304 stainless steel sheet with the thickness of 2 mm was used as specimens. Table I shows the chemical composition of the steel. To elucidate the sensitization and degradation behavior of pitting corrosion resistance at the grain boundaries, the steel with 0.06 mass% C was used in this study. The concentrations of Mn and Si were 1.1 and 0.39 mass%, respectively, suggesting that this stainless steel was deoxidized mainly with Mn and Si. Due to 0.003 mass% S content, the formation of a small number of sulfide inclusions, such as MnS, was inevitable.
Table I. Chemical composition of Type 304 stainless steel (mass%).
| C | Si | Mn | P | S | Ni | Cr | Mo | Cu | Al | N | O |
|---|---|---|---|---|---|---|---|---|---|---|---|
| 0.06 | 0.39 | 1.1 | 0.03 | 0.003 | 8.0 | 18.0 | 0.13 | 0.22 | 0.002 | 0.038 | 0.003 |
The steel sheet was cut into 20 mm × 25 mm coupons. The specimens were solution-treated at 1373 K for 0.5 h and quenched in water. As a sensitization-treatment, the specimens were heat-treated at 923 K for 2 h and quenched in water after the solution-treatment. The temperature of 923 K corresponds to the nose temperature of the TTS (time-temperature-sensitization) diagram for Type 304.16 After the heat-treatments, the specimen surfaces were mechanically ground using SiC paper through 1000 grit and were finished by polishing with a 1 μm diamond paste. The specimens were then degreased with ethanol.
Potentiodynamic anodic polarization was performed in naturally aerated 0.1 M and 1.0 M NaCl solutions at pH 2.0 (adjustment with HCl) and 5.4 (no adjustment). All solutions were prepared from deionized water and analytical grade chemicals.
Macro-scale anodic polarization measurements
Electrochemical measurements were conducted in a three-electrode setup at 298 K. The counter electrode was a Pt sheet, and a Ag/AgCl (3.33 M KCl) electrode was used as the reference electrode. All potentials cited in this paper are expressed in terms of the Ag/AgCl (3.33 M KCl) electrode (0.206 V vs. the standard hydrogen electrode at 298 K). Naturally aerated 0.1 M NaCl at pH 5.4 (no pH adjustment) was used as the electrolyte. The electrode areas of ca. 1 cm2, ca. 0.25 cm2, and ca. 0.1 cm2 were fabricated by masking the specimen surfaces first with an epoxy resin and then with paraffin. After polarization measurements, the electrode areas were accurately measured using a Vernier caliper to convert the measured current values to the current densities. Potentiodynamic anodic polarization began at −0.2 V, and the scan rate was 3.8 × 10⁻⁴ V s−1 (23 mV min−1).
Micro-scale anodic polarization measurements
Potentiodynamic anodic polarization was performed in naturally aerated 0.1 M and 1.0 M NaCl at pH 5.4 (no adjustment) and 2.0 (adjustment with HCl). A battery powered potentiostat was used to reduce electrical noise.17 A micro-electrochemical system similar to that developed by Chiba et al. was used in this study.18,19 A small acrylic cell was placed on the specimen to preserve the electrolyte on the working electrode. A small Ag/AgCl reference electrode filled with the electrolyte was inserted into the cell after the calibration with the Ag/AgCl (3.33 M KCl) electrode. The counter electrode was a Pt wire. The sizes of the working electrode area were ca. 0.01 cm2 (ca. 1000 μm × 1000 μm), ca. 0.0009 cm2 (ca. 300 μm × 300 μm), ca. 0.0004 cm2 (ca. 200 μm × 200 μm), and ca. 0.0001 cm2 (ca. 100 μm × 100 μm). The electrode areas were scaled to convert the measured current values to the current densities after the polarization measurements.
In the case of the micro-scale anodic polarization for the electrode area of ca. 0.0001 cm2 (ca. 100 μm × 100 μm), electrochemical properties of a single grain boundary were assessed. To identify the exact location of the grain boundaries, the specimens were first etched in 10 mass% oxalic acid for 10 s, and indentations were formed using a Mitutoyo Vickers hardness tester (HM 210A) to mark the position of a random grain boundary. To prevent crevice corrosion under the masking during anodic polarization, the intersections between the grain boundary and the masking positions of the electrode area were solution-treated by a pulsed (micro) TIG welding system (Lampert, Puk4). The pulse duration was 6 ms. Then, the specimen surface was re-polished with a 1 μm diamond paste and masked with resin. In the case of the anodic polarization for the electrode area of ca. 0.0004 cm2 (ca. 200 μm × 200 μm), in situ observation of the electrode area was carried out with a water-immersion objective lens with the magnification of 60 times (Olympus, LUMFLN 60XW).
Measurement of depassivation pH
Open circuit potential of the specimens were measured in naturally aerated 0.1 M NaCl to obtain the depassivation pH of the specimens. The volume of the solution was 500 mL. The electrode area was ca. 1.0 cm2. The pH of the solution was decreased stepwise with 3 M HCl. The open circuit potentials were measured at each pH for 600 s. The measurements were conducted at 298 K.
Microstructural characterization
The specimens were metallographically examined by electrolytic etching in 10 mass% oxalic acid at the current density of 1.0 × 10⁴ A m−2 at 298 K. An optical microscope (OM) was used to obtain the surface images of the electrode area before and after the electrochemical measurements. A scanning electron microscope (SEM) equipped with an energy-dispersive X-ray spectroscopy (EDS) system was also employed to observe the surface morphology and to analyze the elemental composition. The accelerating voltage was 20 kV.
To characterize the structure of the grain boundaries of the specimens, electron diffraction back scattered pattern (EBSD) analysis was performed on a JEOL JSM-7800F FEG-SEM equipped with a Hikari Super camera coupled to OIM Analysis software (TSL solutions); the accelerating voltage was 25 kV under a 70° tilt angle and the step size of 2 μm. Prior to the EBSD analysis, the specimen surface was slightly polished with a colloidal silica slurry to eliminate the work-affected layer formed during polishing with a diamond paste.
Grain boundaries were analyzed in detail using a JEOL JEM-ARM200F scanning transmission electron microscope (STEM) equipped with an EDS system. The acceleration voltage of the electron was 200 kV and the size of the probe was ca. 1 nm. A STEM-sample was prepared by a JEOL JIB-4600F focused ion beam (FIB) system. The samples were obtained by milling the specimen surface with a gallium ion beam, and were lifted out using a manipulator.
Results and Discussion
Microstructures and grain-boundary characterization
To confirm the microstructures and sensitization of the specimens, electrolytic etching in 10 mass% oxalic acid at the current density of 1.0 × 10⁴ A m−2 was conducted for 90 s. Figure 1 shows the OM images of the specimens after the etching. In the case of the solution-treated specimen, grain boundaries were faintly etched, but no sensitization was confirmed according to ASTM A262 Practice A. Furthermore, it is clear that there were many annealing twins which formed the straight boundaries. Twin is a typical CSL boundary and is known to be formed during the annealing of Type 304 stainless steels.20 On the other hand, the grain boundaries were etched deeply in the sensitized specimen. Generally, the morphology of the random grain boundaries is wavy and curved, not straight. The heavily etched boundaries presented in Fig. 1b were determined to be the random grain boundaries.21 As described above, it is known that the sensitization readily occurs at random grain boundaries. It was confirmed that the specimens were sensitized by the heat-treatment at 923 K for 2 h, and that the corrosion resistance of the grain boundaries decreased.
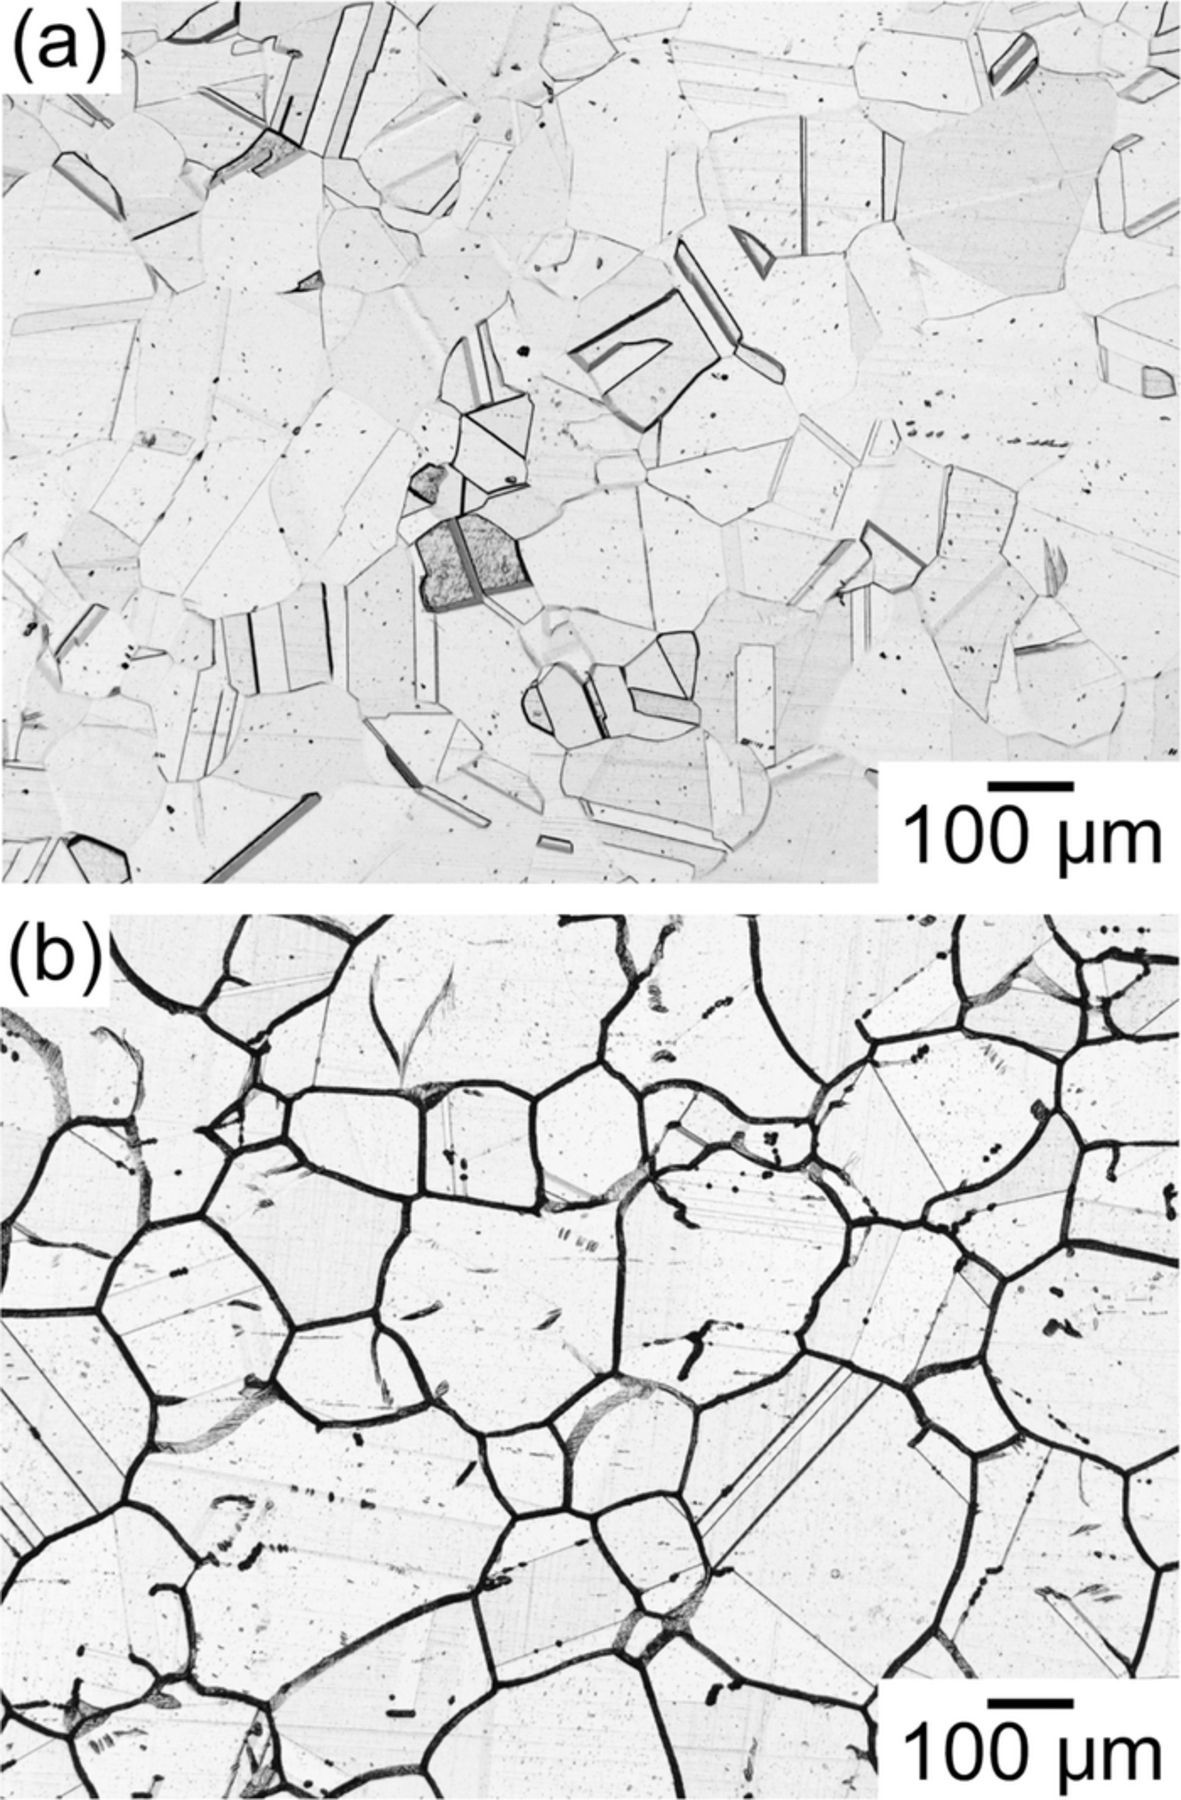
Figure 1. OM images of (a) solution-treated and (b) sensitized specimens after electrolytic etching in 10 mass% oxalic acid at the current density of 1.0 × 10⁴ A m−2 for 90 s.
It is well-recognized that the sensitization of stainless steels is caused by the precipitation of Cr carbides and the formation of Cr-depleted zones at the grain boundaries.22 The results of the STEM/EDS analysis of a random grain boundary of the sensitized specimen are shown in Fig. 2. Figure 2a is the STEM bright field image of the grain boundary. In this image, the difference in the brightness on the upper-right and lower-left sides can be observed, and the boundary of these areas indicates the location of the grain boundary. Figure 2b shows the enlarged image of Area 1 marked in Fig. 2a. A block-shaped precipitate is clearly seen at the grain boundary. The inset in Fig. 2b shows the selected area electron diffraction pattern of this area. The large bright spots indicate diffraction from the austenite matrix (face centered cubic, fcc), and some of these were labeled A(200) and A(020). The many small spots which can be seen in addition to these large spots are the signature of the precipitate at the grain boundary. The indexing of the electron diffraction patterns of the precipitate was expressed by P. The diffraction pattern of the precipitate was consistent with the crystal structure of Cr23C6 (fcc), and the lattice parameter was well indexed.23 Figure 2c shows the results of the EDS analysis along Line 1 shown in Fig. 2a. A decrease in Cr intensity was measured at the grain boundary, and the existence of the Cr-depleted zone resulting from the formation of Cr23C6 was confirmed in the specimens heat-treated at 923 K for 2 h.
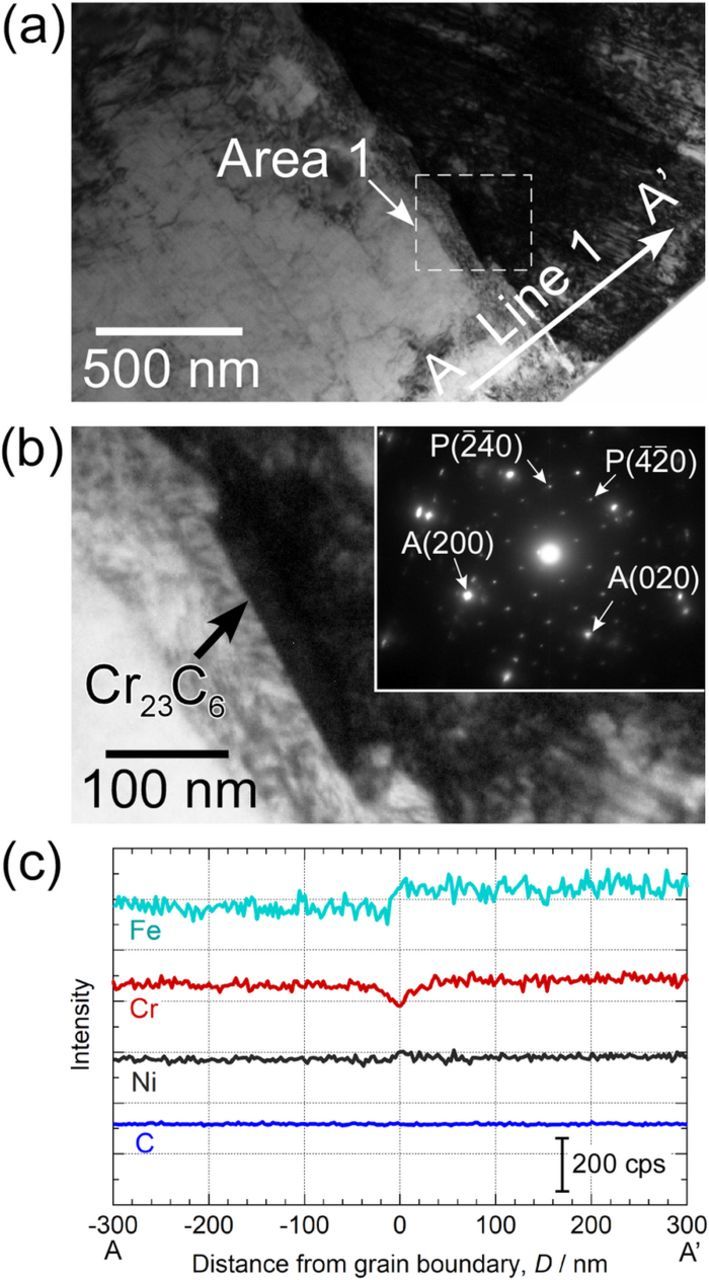
Figure 2. (a) STEM bright field image of a grain boundary. (b) Enlarged view of Area 1 shown in (a) and selected area electron diffraction pattern at and around the grain boundary. (c) EDS line analysis along Line 1 shown in (a).
Macro-scale polarization
To analyze the pitting corrosion resistance of the solution-treated and the sensitized specimens, macro-scale anodic polarization was carried out. Figure 3 shows the macro-scale anodic polarization curves of the solution-treated and sensitized specimens in 0.1 M NaCl (pH 5.4) at 298 K. Polarization was started at −0.2 V (23 mV min−1) and stopped when the measured current density exceeded 0.1 A m−2. For the solution-treated specimen, many current spikes were generated above 0.4 V, and the current density rapidly increased and exceeded 0.1 A m−2 at 0.67 V. The potential region for MnS dissolution has been reported to be around 0.5 V in NaCl solutions.13,14,17–19,24 The many current spikes around 0.5 V were due to the dissolution of the sulfide inclusions, suggesting that the inclusions were likely the initiation sites for pitting.17 In the case of the sensitized specimen, a sharp increase in the current density appeared suddenly at 0.32 V. The pitting potential of the sensitized specimens were determined to be around 0.3 V.

Figure 3. Macro-scale anodic polarization curves of solution-treated and sensitized specimens in 0.1 M NaCl.
Micro-scale polarization for single grain-boundary
To elucidate the pit initiation site on the sensitized specimens, potentiodynamic anodic polarization curves of a single grain boundary were measured. Figure 4a shows the micro-scale anodic polarization curve of a small area with a single grain boundary of the sensitized specimen in 0.1 M NaCl (pH 5.4) at 298 K. The electrode area was ca. 80 μm × 80 μm. Figure 4b is the composite OM image of the electrode area and the microstructure revealed by electrolytic etching in the oxalic acid for 10 s. As can be seen in this figure, the electrode area included a single grain boundary, and this grain boundary was clearly sensitized by the heat-treatment. In Fig. 4a, no signal of pitting was observed during the anodic polarization. This suggests that not all of the sensitized grain boundaries act as initiation sites for pitting in the NaCl solution. In this study, the anodic polarization for a small electrode area including a single grain boundary (sensitized random grain boundary) was conducted independently three times, but neither pit initiation nor intergranular corrosion was observed.

Figure 4. (a) Micro-scale anodic polarization curve of a small area with a single grain boundary of sensitized specimen in 0.1 M NaCl at pH 5.4. (b) Composite image of electrode area and microstructure prepared by electrolytic etching in 10 mass% oxalic acid for 10 s.
To characterize the polarized grain boundary shown in Fig. 4a, EBSD and STEM/EDS analyses were conducted after the polarization. Figure 5a is the IPF (inverse pole figure) map in and around the electrode area shown in Fig. 4. Grain boundaries were classified into CSL boundaries or random boundaries according to the Σ value of the grain boundary. In this IPF map, the grain boundaries with the Σ values smaller than 30 were regarded as the CSL boundaries and are indicated by thick black lines.10,11,21 Random grain boundaries are shown as boundaries of color without the black lines. Two indentations are seen on the right and left sides in this image. The electrode area was indicated by the broken black lines. In this area, the position of the polarized grain boundary was indicated by the black arrow. The Σ value of the polarized grain boundary was higher than 30, confirming that the polarized grain boundary was a random grain boundary. Several CSL boundaries were also included in this electrode area. To determine the Cr concentration of the polarized random grain boundary, STEM/EDS analysis was carried out along Line 2 shown in Fig. 5a. The STEM-sample was lifted out by the FIB system from the position indicated by the arrow (Line 2 in Fig. 5a). The EDS point analysis was conducted along B-B'. The width between each point analysis was 5 nm. Figure 5b shows the Cr concentration profile along B-B'. The Cr concentration at the grain boundary was estimated to be 13 mass%, suggesting that there was a Cr-depleted zone at and around the grain boundary. Considering the results shown in Figs. 4 and 5, not all of the random grain boundaries act as pit initiation sites in 0.1 M NaCl. This suggests that the existence of the Cr-depleted zone is not the only reason for pit initiation at sensitized grain boundaries.

Figure 5. (a) IPF map of sensitized specimen surface after anodic polarization shown in Fig. 4a. Grain boundaries with Σ values smaller than 30 are indicated by black lines. (b) Cr concentration profile along B-B' in (a).
Depassivation pH
The depassivation pH of stainless steels decreases with decreasing Cr content.26 Local depassivation of the Cr-depleted zone at the sensitized grain boundaries may be one possible reason for the lower pitting corrosion resistance of the sensitized specimen. Therefore, the depassivation pH values of the solution-treated and sensitized specimens were measured. Figure 6a shows the effect of pH on the open circuit potentials of the solution-treated and sensitized specimens in a 0.1 M NaCl solution. Open circuit potential of the solution-treated specimen decreased suddenly at pH 0.4. In the case of the sensitized specimen, the potential dropped at pH 1.0. These results confirmed that depassivation occurs more readily on the sensitized specimens than on the solution-treated specimens. Figures 6b and 6c show the OM images after the measurements of depassivation pH shown in Fig. 6a. In the solution-treated specimen (Fig. 6b), pit initiation was observed as local depassivation. As shown in Fig. 6c, local depassivation (pitting) was also initiated on the sensitized specimen. Moreover, it was found that grain boundaries were slightly etched as depassivation sites. It can be seen that the grain boundary near the pitting site was heavily corroded at the position indicated by the black arrow. This indicates that the Cr content at the grain boundary was closely correlated with pit initiation. One possible explanation for this effect is that the Cr-depleted zones dissolve in acidic solutions. Intergranular dissolution results in severe acidification at and around the grain boundary, and finally is followed by pit initiation.

Figure 6. (a) Effect of pH on open circuit potential of solution-treated and sensitized specimens in 0.1 M NaCl. OM images of (b) solution-treated and (c) sensitized specimens after the measurements of depassivation pH.
Micro-scale polarization in acidic solutions
It was predicted that acidification gave rise to the pit initiation at the sensitized grain boundary due to the low Cr content. To reveal the corrosion behavior of a single sensitized grain boundary in low pH solutions, micro-scale anodic polarization was conducted in 0.1 M NaCl solution at pH 2.0. The pH of the solution just above the specimen surface tends to be lower due to the hydrolysis reaction of metallic ions released from the passive steel surface during anodic polarization. Therefore, the solution pH was selected as 2.0, which is slightly above the depassivation pH of the sensitized specimens. Figure 7a shows the micro-scale anodic polarization curve of a small area with a single grain boundary for the sensitized specimen in 0.1 M NaCl at pH 2.0. The pH of the solution was adjusted with 0.1 M HCl. The electrode area was ca. 100 μm × 80 μm. Figure 7b is the composite OM image of the electrode area and the microstructure prepared by electrolytic etching in the oxalic acid for 10 s. This image shows that a sensitized random grain boundary was included in the electrode area. As indicated in Fig. 7a, even though three current spikes were observed during the polarization, no stable pitting was generated. While those current spikes were thought to be derived from the initiation of metastable pits, metastable pits were not identified by the surface observation after the polarization. Although the metastable pitting was supposed to be generated in the acidic environments, no stable pit was initiated. Additionally, no intergranular corrosion was generated.

Figure 7. (a) Micro-scale anodic polarization curve of a small area with a grain boundary of sensitized specimen in 0.1 M NaCl at pH 2.0. (b) Composite image of electrode area and microstructure prepared by electrolytic etching in 10 mass% oxalic acid for 10 s.
The concentration of chloride ions was also a factor affecting pit initiation of stainless steels, and hence the 1 M NaCl solution (pH 2.0) was used in the polarization measurements. Figure 8a indicates the micro-scale anodic polarization curve of a small area with a single grain boundary for the sensitized specimen in 1 M NaCl at pH 2.0. Figure 8b indicates the composite OM image of the electrode area and the microstructure revealed by the etching in the oxalic acid for 10 s. In this case, the electrode area was ca. 110 μm × 120 μm, and a random grain boundary was confirmed to exist in the electrode area. As can be seen in Fig. 8a, no pitting was observed in this case as well.
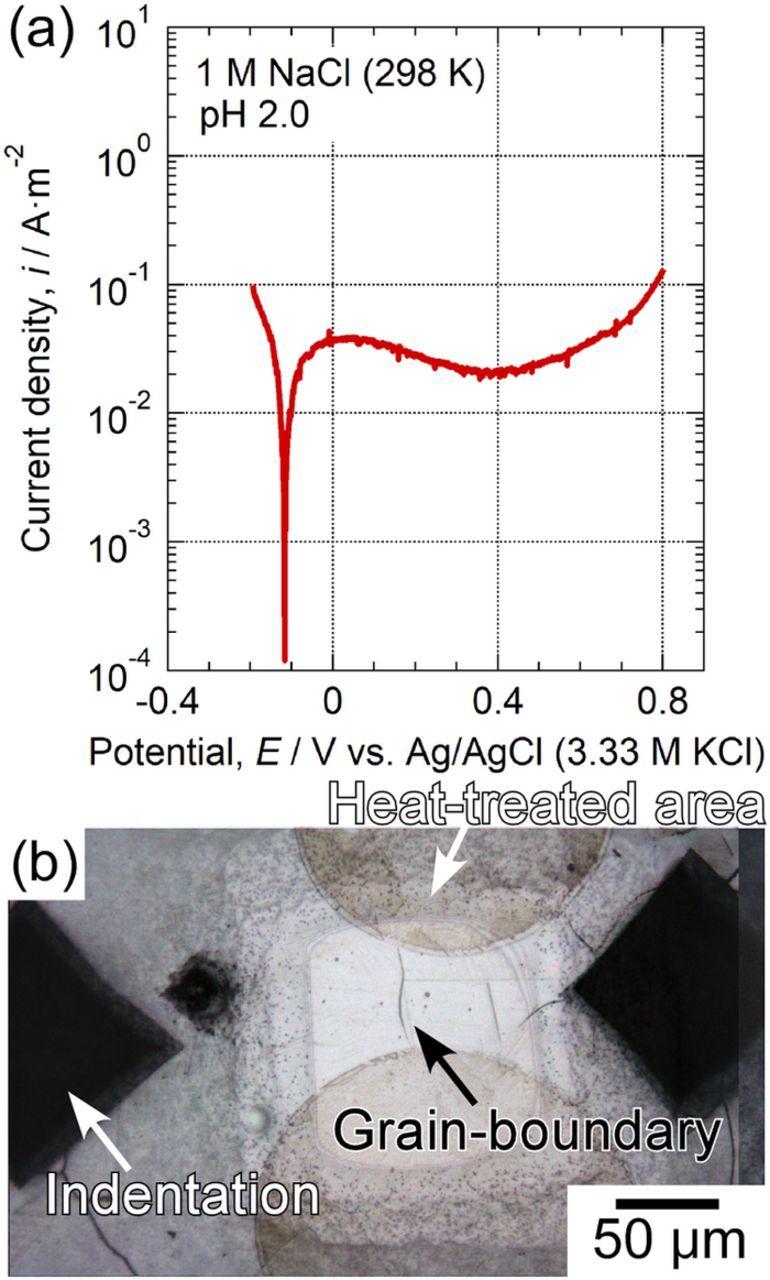
Figure 8. (a) Micro-scale anodic polarization curve of a small area with a grain boundary of sensitized specimen in 1 M NaCl at pH 2.0. (b) Composite image of electrode area and microstructure prepared by electrolytic etching in 10 mass% oxalic acid for 10 s.
Effect of electrode size on pit initiation
Comparison of Figs. 3, 4, 7, and 8 shows that when the electrode area was ca. 1.0 cm2, stable pitting was observed on the sensitized specimen (Fig. 3). On the other hand, as shown in Figs. 4, 7, and 8, no stable pits were generated in the electrode area of ca. 0.0001 cm2 (ca. 100 μm × 100 μm). The size of the electrode area was thought to be an important factor affecting the stable pit initiation. The corrosion resistance at the weakest point in the electrode area is reflected in the pitting potential. To evaluate the density of pit initiation sites on the sensitized specimens, pitting potentials were measured for the specimens with various electrode sizes. The electrode areas were varied from ca. 1.0 cm × 1.0 cm (ca. 1.0 cm2) to ca. 60 μm × 60 μm (ca. 0.000036 cm2). Figure 9 shows the effect of the size of the electrode area on pitting potentials for the sensitized specimen in 0.1 M NaCl (pH 5.4). In the case of ca. 200 μm × 200 μm, the polarization was repeated 10 times independently, and a stable pit was initiated 4 times. This result indicated that the density of pit initiation site on the sensitized specimens was likely to be ca. 1 per 200 μm square. Although no pit was initiated for the electrode area smaller than ca. 200 μm × 200 μm, if the micro-scale polarization is repeated many times, stable pits are thought to be initiated even in the micro-scale electrochemical measurements. However, the electrode area of ca. 200 μm × 200 μm was thought to be suitable for revealing the pit initiation site on the sensitized specimens.
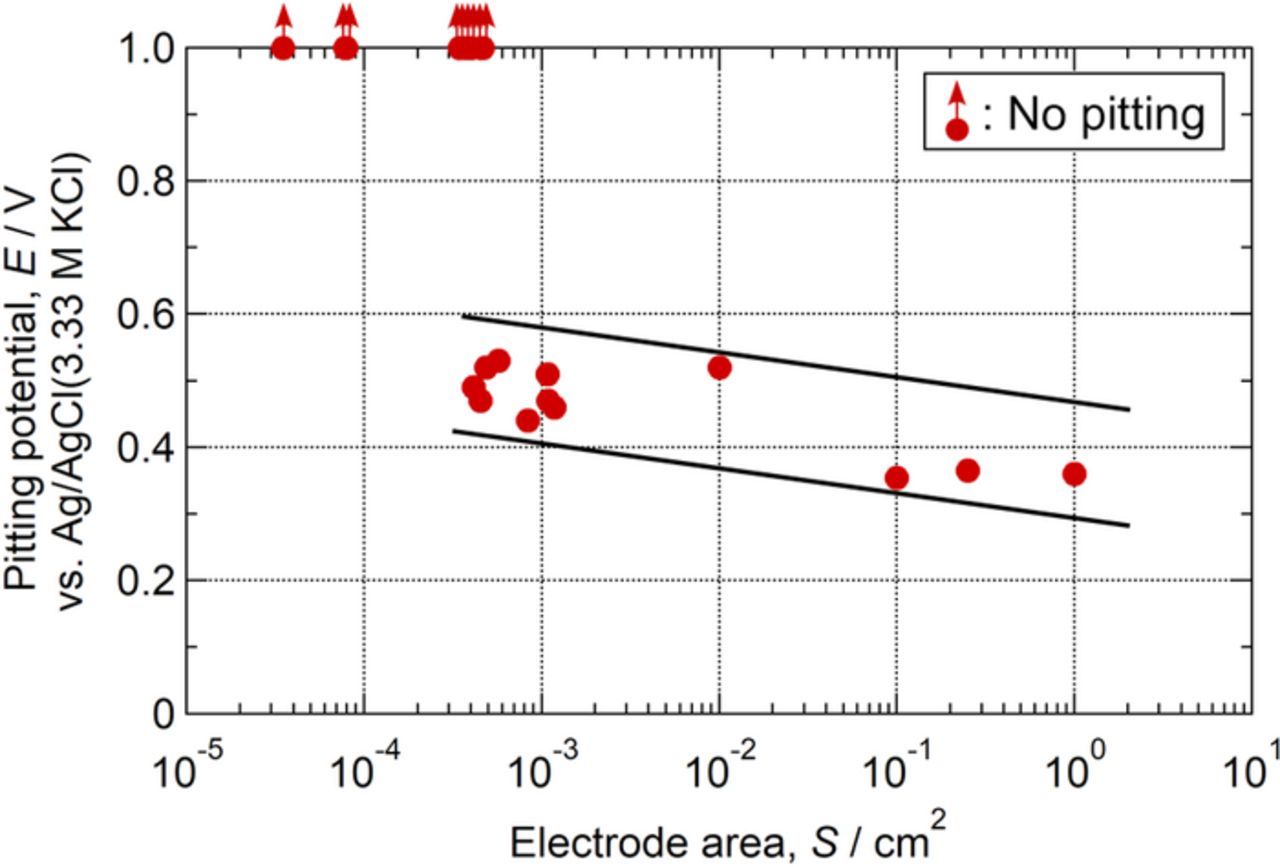
Figure 9. Effect of electrode area on pitting potentials for sensitized specimens in 0.1 M NaCl at pH 5.4.
In situ observation of pit initiation processes at sensitized grain boundaries
As indicated in Fig. 9, the electrode area of ca. 200 μm × 200 μm was thought to be suitable for in situ observation of pit initiation processes at sensitized grain boundaries. To elucidate the relationship between the stable pit initiation and Cr content, the electrode surface was observed with the water immersion lens (magnification of 60) during the polarization. Figure 10 shows the micro-scale anodic polarization curve of a small area for the sensitized specimen in 0.1 M NaCl (pH 5.4), and the OM images of the electrode area before and after the anodic polarization. Fig. 10a shows that the current density suddenly increased at 0.53 V. The initiation of a stable pit was observed at the position indicated by the black arrow (Fig. 10c).

Figure 10. (a) Micro-scale anodic polarization curve of sensitized specimen (electrode area 4 × 10⁻⁸ m2) in 0.1 M NaCl at pH 5.4. OM images of electrode area (b) before and (c) after anodic polarization.
Figure 11 shows the in situ observation images of the stable pit initiation processes during the anodic polarization shown in Fig. 10a. Figure 11a shows the electrode surface at the open circuit potential (OCP) prior to the anodic polarization. The black spot was considered to be an inclusion. Fig. 11b presents the electrode surface immediately before the pit initiation, and this time was defined as 0 s (0.537 V) for the subsequent analysis. Based on the comparison of Figs. 11a (OCP) and 11b (0.537 V), the appearance of the black spot did not change during the potentiodynamic anodic polarization until the potential reached 0.537 V. The size of the black spot was smaller than 1 μm. From 0.1 to 0.4 s, the current rapidly increased, and the surface appearance of the black spot became slightly darker, suggesting that local dissolution was initiated at the small black spot, and the dissolution proceeded during this period. From 0.5 to 0.7 s, the size of the black spot increased with time. At 0.8 s, a black line was generated from the black spot. Then, the length of the black line increased with time. Polarization was stopped at 0.538 V. This result indicates that the pit was initiated at the black small spot, considered to be an inclusion, and the size of the black spot increased with time. Moreover, the black line was generated after the initiation of the local dissolution.

Figure 11. In situ observation images of stable-pit initiation processes during anodic polarization shown in Fig. 10a.
Figure 12 shows the SEM images of the pit (local dissolution) initiated during the anodic polarization shown in Figs. 10a and 11. As presented in Figs. 12a and 12b, a spherical pit was generated, and straight trenches were clearly observed. The straight trenches were considered to be intergranular corrosion. The trench existed at the center inside the pit. On the basis of the in situ observations shown in Fig. 11, a stable pit was initiated at the grain boundary, and then the intergranular corrosion was induced by the pitting. It appears that the acidification by the hydrolysis reactions of dissolved metallic ions from the pit caused the depassivation of the Cr-depleted zone at the grain boundary.

Figure 12. SEM images of pit initiated during anodic polarization shown in Fig. 10a. (b) Enlarged view of the pit shown in (a).
In addition to the above results, some residuals or corrosion products were observed at the position indicated by the arrow in Fig. 12b. To determine the composition of the products, EDS mapping was carried out. Figure 13 shows the EDS maps of the corresponding area of Fig. 12b. An accumulation of Mn and S was observed at the position marked by the arrow in Fig. 12b, and Si, Cu, Cr and a small amount of O were accumulated as well. While it is widely known that MnS inclusions act as an initiation site for pitting, the inclusions themselves remained largely intact even after anodic polarization. The observation results shown in Fig. 13 are in good agreement with the work of Muto et al., who demonstrated that the composition of (Mn,Cr)S inclusions changes, becoming Cr-rich under anodic polarization, and that oxide films form on the inclusions.27 Lillard et al. also observed Cu deposition on the MnS surface immersed in 0.1 M NaCl.25 The results of the SEM/EDS analysis presented in Figs. 12 and 13 demonstrate that the MnS inclusion at the sensitized grain boundary acts as the initiation site for pitting. It is likely that the MnS inclusions located at the random grain boundaries are the initiation sites for stable pitting in sensitized Type 304 stainless steels.

Figure 13. EDS maps for the region shown in Fig. 12b.
EBSD analysis was carried out to elucidate whether the stable pit was initiated at a random grain boundary. Prior to the EBSD analysis, the masking was removed, and the specimen surface was slightly polished with a colloidal silica slurry to remove the work-affected layer formed during the polishing with a diamond paste. Prior to the polishing, indentations and a scratch were made to identify the position of the pit as shown in Fig. 14a. Figure 14b shows the IPF map in and around the electrode area. Grain boundaries with the Σ value smaller than 30 were indicated by the black lines. In this electrode area (ca. 200 μm × 200 μm), many CLS and random grain boundaries were present. The position of the stable pit was indicated by the white arrow. As shown in the OM image given in Fig. 14a, after the SEM/EDS analysis, the surface of the observed area had a slight blown tinge due to contamination. This area was indicated by the white arrow. To clearly show that the pit was located at a random grain boundary, the IPF map of the Fig. 14a was enlarged (Fig. 14c). Examination of Fig. 14c shows that a random boundary was definitely located at the pit initiation site, and the position of the trench was consistent with that of the random grain boundary. It is concluded that the trench observed at the pit initiation site was the intergranular corrosion of the random grain boundary. By considering the pit initiation processes shown in Fig. 11, it is clearly shown that stable pit initiation induced the intergranular corrosion. This is probably due to the local acidification caused by the hydrolysis of metallic ions dissolved from the pit.28
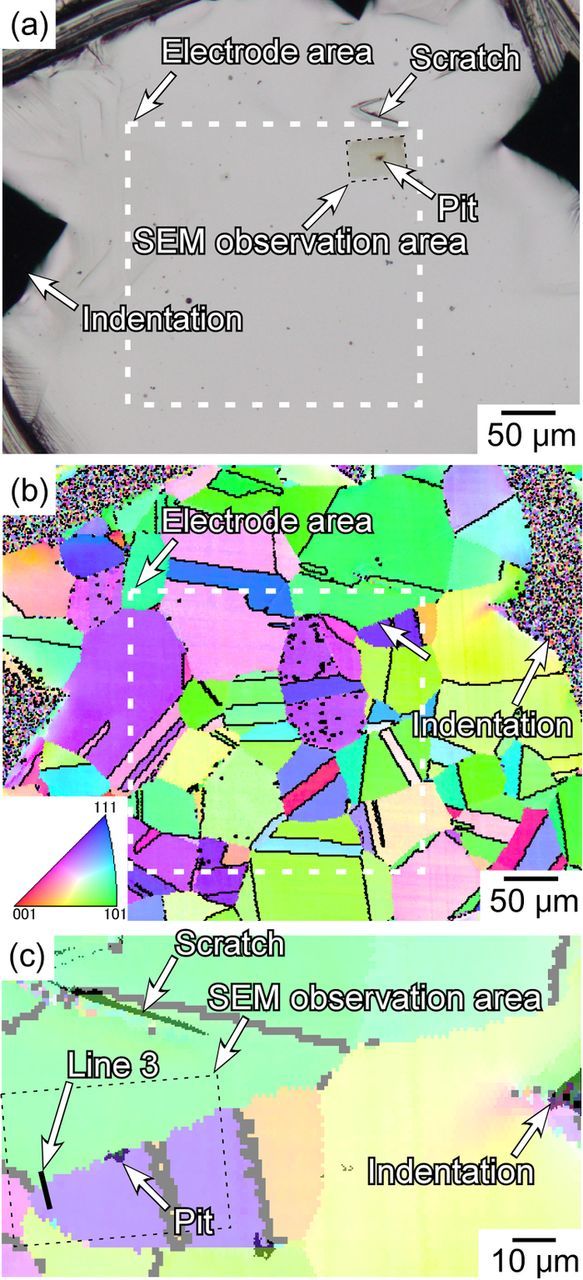
Figure 14. (a) OM image and (b) IPF map around the electrode area of anodic polarization shown in Fig. 10a. Grain boundaries with Σ values smaller than 30 are indicated by black lines. (c) Enlarged IPF map of (b).
STEM/EDS analysis was conducted to characterize the degree of Cr-depletion of the grain boundary at which the stable pit was initiated. The STEM-sample was lifted out using the FIB system from a location close to the pit (Line 3 in Fig. 14c). Figure 15a shows the STEM bright field image of the area at and around the grain boundary. The EDS point analysis was conducted along C-C', and the Cr concentration across the grain boundary is shown in Fig. 15b. The minimum Cr concentration was 10 mass%. As shown in Fig. 5, the Cr concentration of the grain boundary, at which no pitting was initiated, was 13 mass%. Considering this difference in the Cr concentration, it is possible that the Cr concentration affects the susceptibility of pitting at the grain boundaries of the sensitized specimens. However, the pit generation preceded the intergranular corrosion; therefore, the predominant factor is thought to be the existence of the inclusion at the grain boundaries. Chiba et al.18,19,29 proposed the pit initiation mechanisms at MnS inclusions in stainless steels. When MnS inclusions dissolve, the pH on and around the MnS is thought to decrease,30,31 and is followed by the precipitation of elemental S.19 In chloride solutions, the depassivation of the boundary between the inclusion and steel matrix occurs due to the synergistic effect of Cl− ions and elemental S. The trench is generated as selective dissolution at the boundary of the inclusions and steel matrix, and a pit is initiated inside the trench as a local transition from passive to active state. Also in the case of the MnS inclusions at the sensitized grain boundaries, it is expected that the trench is probably generated at the boundary between the inclusion and steel matrix. In the Cr-depleted zones, the passive-active transition proceeds readily.26 The trench is formed at the boundary of the inclusion and steel matrix of the sensitized specimens, and the passive-active transition probably occurs at a lower potential than for the solution-treated specimens. This explains why the pitting corrosion resistance of the sensitized stainless steels is lower than that of the solution-treated steels. Additionally, in the case of sensitized stainless steels, it is clear that the MnS inclusions are the predominant factor that determines the pitting susceptibility of the stainless steels to pitting corrosion.

Figure 15. (a) STEM bright field image at the grain boundary indicated in by Line 3 in Fig. 14c. (b) Cr concentration profile along C-C' in (a).
Conclusions
- (1)For Type 304 stainless steel heat-treated at 923 K for 2 h, no pitting was initiated at a sensitized single grain boundary without MnS inclusions in naturally aerated 0.1 M NaCl (pH 5.4) at 298 K.
- (2)When the electrode area was less than ca. 200 μm × 200 μm, no stable pitting was observed in 0.1 M NaCl despite the presence of several sensitized grain boundaries in the electrode area. On the other hand, stable pit initiation could be observed on the electrode area, which was larger than ca. 200 μm × 200 μm. The density of the pit initiation sites on the sensitized specimens was determined to be ca. 1 per 200 μm square.
- (3)In 0.1 M NaCl (pH 5.4), a stable pit was initiated at the MnS inclusion at the sensitized grain boundary. In situ microscopy revealed that the generation of a spherical pit at the inclusion was the first step, and then intergranular corrosion proceeded from the pit.
- (4)Depassivation pH values in 0.1 M NaCl (298 K) of the solution-treated and sensitized specimens were 0.4 and 1.0, respectively. While small pit initiation occurred after depassivation on both of the specimens, intergranular corrosion was generated only on the sensitized specimens. The local depassivation induced by the sulfide inclusion dissolution occurred more readily at the Cr-depleted zones along the sensitized grain boundaries than at the solution-treated grain boundaries. The co-existence of the MnS inclusion and Cr-depleted zone at the sensitized grain boundary is likely to be the deterministic factor for the pit initiation of sensitized stainless steels in NaCl solutions.
Acknowledgments
This work was supported by JSPS KAKENHI grant Number JP17H01331. I. Muto thanks Natsumi Takaya for her help in preliminary work.