Abstract
Iron chloride in a deep eutectic solvent containing high concentrations of iron with choline chloride and ethylene glycol have been synthesized. It was found that physical properties of the electrolytes, as well as the nature of the electroplated iron are greatly influenced by electrolyte composition. This is not surprising in that electrochemical reactivity of the solute ions as well as the physical properties of the electrolyte are controlled by speciation of the metals in solution. When the chloride to iron ratio is ≥4:1, complexes such as [FeCl4]− and [FeCl4]2− were shown to be the dominant species using X-ray absorption near edge structure measurements coupled with Raman spectroscopy. However, when the chloride to iron ratio falls below 4:1, the ethylene glycol was found to complex the iron; the presence of this complex hinders fluid properties as shown by an order of magnitude decrease in solution conductivity as well as alter the iron deposition mechanism.
Export citation and abstract BibTeX RIS

This is an open access article distributed under the terms of the Creative Commons Attribution Non-Commercial No Derivatives 4.0 License (CC BY-NC-ND, http://creativecommons.org/licenses/by-nc-nd/4.0/), which permits non-commercial reuse, distribution, and reproduction in any medium, provided the original work is not changed in any way and is properly cited. For permission for commercial reuse, please email: oa@electrochem.org.
Flow batteries present a potentially low cost energy storage solution that is flexible in design due to external storage of the electrolyte. They offer reversible energy storage along with the load-leveling capabilities needed to facilitating implementation of renewable energy sources. Unlike conventional batteries, dissolved reactive species are stored in tanks and flowed through an electrolytic stack, where the electrochemical reactions occur, allowing for scalability. Redox flow batteries (RFBs) employ a redox chemistry at both electrodes; examples include the all-vanadium,1 iron-chrome,2,3 or a metal-free system utilizing quinones.4 There are also several hybrid configurations, such as the all-iron,5 all-copper,6 and zinc halide7 system which involve metal deposition/dissolution at one electrode. With the hybrid configurations, the storage capacity is related to the amount of metal that can be stored within the stack. The reactions for the all-iron chemistry are shown by Equations 1 and 2 where iron metal is deposited at the negative electrode upon charge. The all-iron chemistry represents a cost effective and environmentally friendly RFB chemistry and was thus chosen for this study.
![Equation ([1])](https://content.cld.iop.org/journals/1945-7111/164/4/A796/revision1/d0001.gif)
![Equation ([2])](https://content.cld.iop.org/journals/1945-7111/164/4/A796/revision1/d0002.gif)
Aqueous based flow battery systems have been widely studied,8–10 however there is a growing interest in non-aqueous electrolytes with larger electrochemical windows (1.5−5.0 V11) as a means to increase power density. Unfortunately, organic solvents have safety hazards associated with them due to their volatile and flammable nature and contamination by trace amounts of moisture or oxygen can have detrimental effects on battery performance.12 The solubility of active species in these types of electrolytes are often very low, limiting the energy storage capacity.13,14
Ionic liquids (IL) offer a different approach to increase energy and power densities of current non-aqueous redox flow battery (RFB) technologies. They possess wide electrochemical windows similar to organic solvents but with the advantages of high thermal stability and low volatility.15–17 High solubility of transition metals (> 6 M) can be achieved when the electroactive material becomes part of the ionic liquid.18–21 A type of moisture stable ionic liquids called "deep eutectic solvents" (DES) are formed by combining organic halide salts such as choline chloride with a hydrogen bond donor, such as ethylene glycol or urea.22,23 DES can be prepared and used under ambient conditions and are an order of magnitude less expensive than traditional ILs; this is attributed to their ease of synthesis and wide availability of the non-toxic pre-cursor materials. As a result, there have been several recent studies of using DES as an electrolyte for RFB applications.24–30
The all-copper chemistry is a good example of a chemistry that has been demonstrated in both a traditional ionic liquid RFB31 and a DES type electrolyte for RFBs.24 In the ionic liquid RFB, the copper was part of the electrolyte, enabling high concentrations of active species (>3 M). However, it was speculated that the dendritic and non-adherent nature of the electrodeposited metal in addition to crossover at the membrane are the cause of low energy efficiencies as determined from charge/discharge experiments in an H-type cell (10–30%). The all-copper chemistry in a DES type electrolyte (ethaline) was demonstrated in a small-scale flow cell.24 However, due to mass transport limitations and poor conductivity of the electrolyte, energy efficiencies of only 52% and 62% at current densities of 10 and 7.5 mA/cm2 respectively had been achieved. This group also explored the possibility of iron chloride and zinc chloride and obtained an energy efficiency of 78% (at 0.5 mA/cm2).25 The Fe2+/Fe3+ redox reaction was used as the positive couple with zinc deposition and dissolution at the negative electrode; electrodeposition of iron as the negative electrode reaction had been abandoned due to its sluggish kinetics, whereas zinc is known to exhibit fast electrodeposition and dissolution kinetics.
From the literature it is clear that ILs have demonstrated promise for future energy storage applications through enhanced potential windows for higher power density, fast electrokinetics, and the ability to operate under ambient conditions as well as a wide range of temperatures. However, electrodeposition in these hybrid type RFB systems has not been widely studied. There has been little investigation of the Zn, Fe, or Cu electrodeposition reactions or the factors that affect electrodeposition. Furthermore, as with most non-aqueous systems, conductivity must be improved in order to decrease ohmic overpotentials and enhanced fluidity is desired to eliminate mass transfer limitations. In addition, for higher energy density systems, higher solubility must be achieved. These electrolytes are "tailorable", however, an understanding of compositional effects is needed for electrolyte optimization. This work focuses on understanding factors affecting iron deposition as well as the speciation of iron and how the nature of the iron species present are responsible for changes in the physical properties of the electrolytes. Although the iron system does not take full advantage of the potential window, an understanding of this system is expected to assist with the development of chemistries with even greater promise for the application of DESs in energy storage.
Experimental
Chemicals were analytical grade; iron (III) chloride (anhydrous), iron (II) chloride (anhydrous), and ethylene glycol (anhydrous) were used as received (Alfa Aesar). Choline chloride (Alfa Aesar) was dried at 150°C inside a vacuum oven for a minimum of 12 hours. The electrolytes were prepared by combining iron chloride (FeClx), choline chloride (ChCl), and ethylene glycol (EG) and stirring at 80°C until all solids had dissolved. Experiments were performed in a nitrogen-filled glove box (<15 ppm water) in order to minimize possible effects due to oxygen or water. DES formed from choline chloride and ethylene glycol are not sensitive to moisture and oxygen, however, all experiments were performed in a N2 atmosphere so as to avoid air oxidation of ferrous ions as well as formation of the iron hydrates. A thermostated three electrode glass cell with Ag/AgCl reference whose construction has been previously described elsewhere20 was used for electrochemical measurements along with a potentiostat/galvanostat (Solartron SI 1287) and a frequency response analyzer (Solartron SI 1260). Scanning electron microscopy (SEM) imaging was carried out using a Helios NanoLab 650.
Flow battery testing was performed using a 4 cm2 cell (membrane area). SIGRACELL carbon felts from SGL were used as electrodes, KFD 2.5 for the negative and GFD 4.6 for the positive. A less conductive felt was used for the negative electrode to minimize metal deposition adjacent to the membrane.32,33 GFD felt is often employed in aqueous vanadium redox flow batteries where the positive electrode potential is higher than that of the ferrous/ferric couple. As a result, any oxidative degradation of the felt electrode in this system is expected to be minimal. The felts were bonded to impervious graphite plates using carbon ink (Acheson) and separated by a Daramic 175 microporous separator that was pre-soaked in a 1:4 choline chloride:ethylene glycol solution (2 days). Felts were compressed 10% using Teflon gaskets to limit the amount of compression. Electrolytes were circulated by a peristaltic pump at a flow rate of 25 mL/min. The positive reservoir contained 35 mL of electrolyte and the negative contained 17.5 mL of electrolyte (since two electrons are transferred at the negative electrode, half the volume is required). The cell was charged and discharged at 5 mA/cm2, at 80°C in a N2-filled glove box (<15 ppm water), with voltage limits of 1.35 volts for charge and 0 volts for discharge. Conductivity and viscosity have an Arrhenius type dependence on temperature34 (refer to Fig. S1 of the Supplementary Material), thus, operation at 80°C allows for higher conductivity and lower viscosities to be achieved due to a weakening of interactions with the hydrogen bond donor while still enabling use of conventional RFB hardware. It should be noted that future work includes exploration of other hydrogen bond donors in order to improve fluid properties and allow for operation closer to room temperature.
Plating experiments were performed under static conditions on a polished glassy carbon disc substrate. It is important to note that an iron rod was used as a counter electrode in for all electrodeposition experiments so as to maintain constant ferrous concentrations within the electrolyte (and not introduce ferric ions at the counter). Additional nucleation studies were performed using polished gold and platinum disk electrodes (BASi) as well as carbon fiber microelectrodes whose construction have been previously described elsewhere.35 For the coulombic efficiency experiments, a controlled plating potential (−1.0 V) was held for 5 minutes, then the deposit was stripped for 5 minutes at a voltage positive of the stripping peak but negative of Fe2+ oxidation, found from CV analysis (+ 0.15 V). In between consecutive experiments, the working electrode was held at a positive overpotential for an additional 5 minutes to ensure that the iron was completely stripped, then the system was allowed to rest at the open circuit for 5 minutes.
To study electrolyte degradation products, electrolytes underwent bulk electrolysis in a sealed, thermostated (80°C) glass H-type cell. The headspace was swept with argon gas; differential pumping was used to introduce the gas to the mass spectrometer. The H-type cell utilized high surface area platinum mesh electrodes and each half-cell was separated by a Daramic 175 microporous separator (exposed area of 0.8 cm2) that had been pre-soaked in a 1:4 choline chloride:ethylene glycol solution (24 hours). The cell was assembled inside a nitrogen filled glove box.
Cell and electrolyte temperatures were allowed to equilibrate for a minimum of 20 minutes prior to making any measurements. A conductivity cell (Fisher Scientific, Accumet with cell constant of 1 cm−1) was used to measure conductivities; viscosities were measured using a Cannon SimpleVIS glass viscometer, values reported represent an average of five measurements. For the purpose of constructing the Waldon Plot, densities were estimated by simply weighing a set volume of electrolyte (extracted after it had been held at the desired temperature for a minimum of 20 minutes); all densities are an average of 5 measurements.
Liquid samples for Raman measurements had been contained using 1 dram glass vials that were prepared, sealed, and stored inside a nitrogen-filled glove box. Raman spectra of the liquids were recorded using a SENTINEL Raman spectrometer from Bruker Optics. Liquid samples for X-ray absorption studies had been contained using polyimide tubing (diameter was dependent on the desired path length) that were prepared, sealed with epoxy, and stored inside a nitrogen-filled glove box. X-ray absorption experiments were conducted at beamline 10 BM of the Advanced Photon Source at Argonne National Laboratory. All experiments had been performed using transmission mode with beam widths of 0.5 to 0.9 mm to constrain the beam to be narrow enough to fit inside the narrow width of the tube while still allowing for enhanced signal to noise. Iron foil was placed in line with the second ionization chamber to allow for an internal energy calibration between each test (Fe K-edge 7112 eV). In addition, the iron foil as well as FeCl2 and FeCl3 (hydrates) salts ground to fine powders and sandwiched between Teflon tape had been used as standards. Analysis of the data was performed using Demeter software36 and Origin Lab. A spline function was used to interpolate the background using data from several eV before and after the pre-edge feature. Deconvolution of the pre-edge features were modeled using a Voigt fit in Origin Lab.
Results and Discussion
Iron DES flow battery
The all-iron flow battery chemistry consists of the Fe2+/Fe3+ redox reaction as well as the electrodeposition/dissolution reaction (Fe2+/Fe0) at the negative electrode.5 The open circuit voltage (OCV) for this system in a DES is similar to that of the expected OCV in typical aqueous electrolytes, 1.21 V. Prior to running a flow battery, a symmetric positive cell was run to assess the performance of the iron containing DES electrolytes. Symmetric cell testing provides insight on individual redox reactions and allows for the investigation of a single half-cell of the battery without requiring a reference electrode.37 The same flow battery hardware described in the Experimental section was used for the symmetric cell testing with the exception of the electrodes; for this experiment no felt electrodes had been used (only the flat impervious graphite plates). Gaskets allowed for a 0.61 mm gap between the graphite plates and the Daramic separator. At one electrode, Fe2+ is oxidized to Fe3+ and at the other electrode, Fe3+ is reduced to Fe2+. A single tank was used to store the electrolyte in order to maintain constant concentrations of ferrous and ferric ions.
We have previously reported that an electrolyte containing 1:1:4 FeClx:ChCl:EG shows promise for use in a flow battery system20 due to high coulombic plating efficiencies and fast kinetics for the iron redox reaction in addition to a high concentration of iron (2.6 M). Thus, a symmetric cell utilizing an equal molar FeCl2/FeCl3 (1:1:4 FeClx:ChCl:EG) electrolyte was charged and discharged at current densities up to 50 mA/cm2 (refer to Figure S2 of the Supplementary Material). These results are promising for a non-aqueous system, especially since a flat plate electrode was used instead of typical highly porous felt electrodes. Polarization curves (Fig. S2) showed that even up to 50 mA/cm2, a limiting current could not be observed (polarization curves were performed by holding a current density and measuring the steady state potential). From electrochemical impedance spectroscopy (Fig. S3 of the Supplementary Material), the area specific resistance (ASR) was determined to be 13.7 Ωcm2 which is reasonable for a non-aqueous electrolyte and less than half as resistive as a DES-based flow battery system employing the copper chemistry.24 This implies that if the cell were charged at 10 mA/cm2, the iR losses (or ohmic overpotential) is expected to be 137 mV, which agrees with the polarization curve. The ohmic overpotentials are expected to dramatically decrease when using compressed felt electrodes where the gap between the electrodes is small (whereas for the flat plate with gaskets, the overall gap was ∼1.22 mm). From the symmetric cell experiments, we have demonstrated that the positive half-cell of the battery (Fe2+/Fe3+ reaction) is attractive for use in a full flow battery.
Although the results from the symmetric cell were promising, the full flow cell utilizing 1:1:4 FeCl2:ChCl:EG was unable to discharge. The electrolyte became much more viscous after charging and the metal deposit could not be stripped. Within the flow cell, concentrations change with state of charge; for concentrated ionic liquid type flow battery systems, a change in concentration affects not only the mass transfer but also the conductivity and viscosity of the electrolyte. For example, a 1:1:4 FeClx:ChCl:EG electrolyte containing only FeCl3 has a conductivity of 20.9 mS/cm (80°C) whereas an electrolyte containing only FeCl2 has a conductivity of 2.4 mS/cm at 80°C. This is an order of magnitude difference. However, an electrolyte containing 0.5:1:4 FeClx:ChCl:EG appeared to be more suitable; high coulombic efficiencies and fast kinetics as well as more desirable fluid properties were observed. The conductivities for the 0.5:1:4 FeClx:ChCl:EG electrolyte containing only FeCl3 or only FeCl2 were similar (25.5 and 19.2 mS/cm, respectively) and thus, large changes in conductivity and viscosity are not expected to occur upon charge and discharge.
Consequently, the 0.5:1:4 FeCl2:ChCl:EG electrolyte was evaluated in a full flow cell. The cell was charged to 10% state of charge, then cycled for one hour charge-discharge cycles at 5 mA/cm2. Figure 1 compares the first three cycles to cycles 14–16 (all cycles are shown in Fig. S4 of the Supplementary Material). These results are much more promising than those of the battery testing with the 1:1:4 FeClx:ChCl:EG electrolyte, demonstrating the feasibility of an iron-containing DES. It should be noted, however, that the capacity does begin to fade even after 14 cycles. It is speculated that the large changes in charge and discharge potentials during the later cycles occur after the initial iron deposit has been consumed by inefficiencies, and then are due to issues with the negative (deposition) electrode, such as poor deposit quality (lowering the coulombic efficiency). Other possibilities include passive film formation or electrolyte breakdown (lowering voltaic efficiency, as well as coulombic efficiency). It is clear that improved understanding of the electrodeposition reaction is needed, which is the subject of the next section. Ionic liquids are often referred to as "tailorable electrolytes" where both the physical and electrochemical properties can be tuned when the composition is altered as will be shown below.
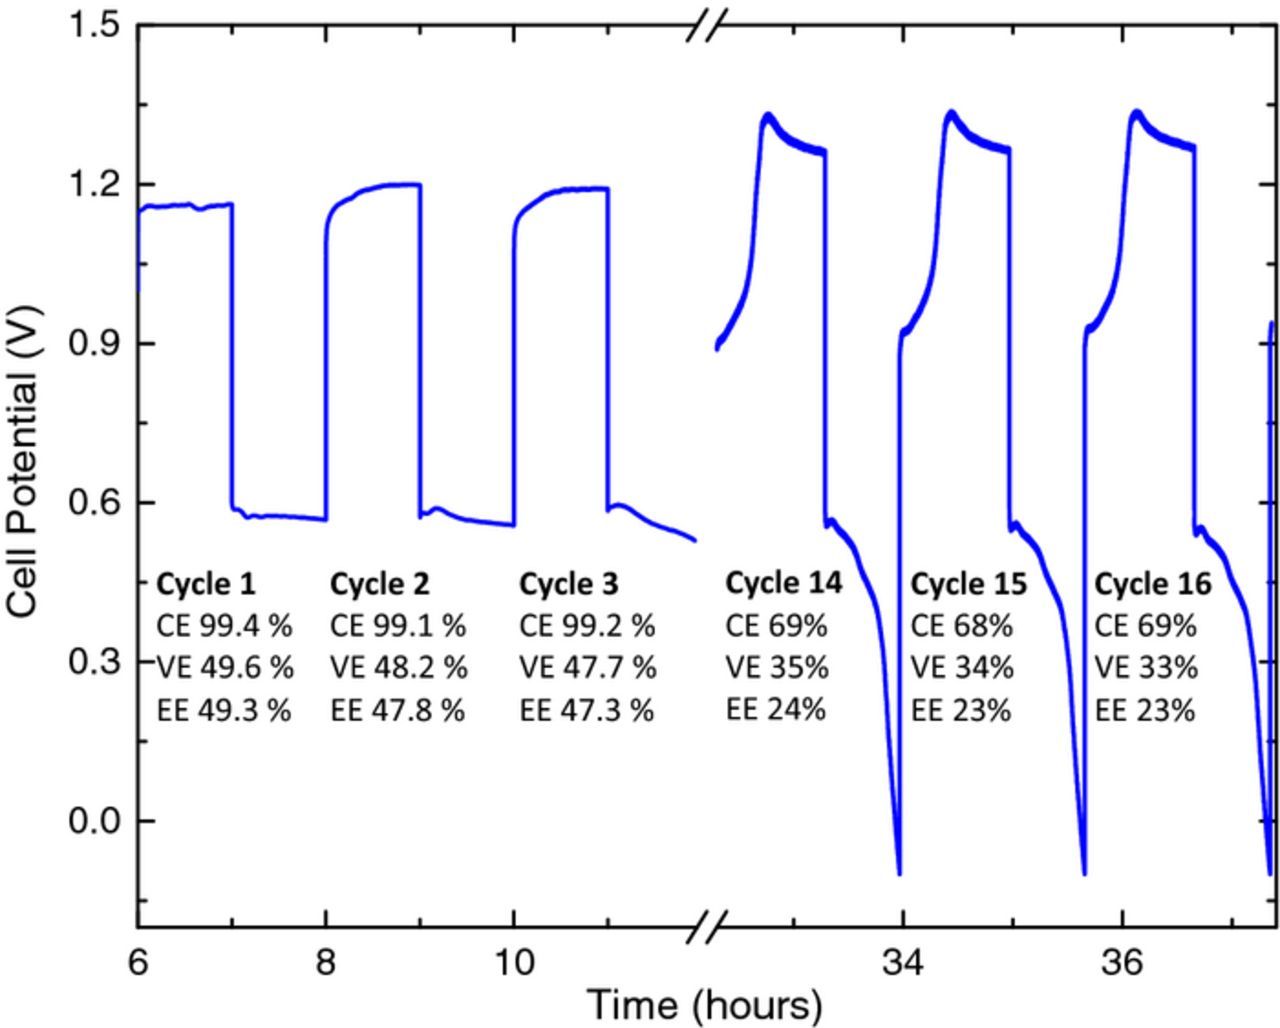
Figure 1. One hour charge-discharge cycles for a RFB utilizing 0.5:1:4 FeCl2:ChCl:EG after an initial charge to 10% SOC; current density of 5 mA/cm2, flow rate 25 mL/min, 80°C, N2-atmosphere.
Electrodeposition of iron
In order to investigate the effects of electrolyte composition on the electrochemical properties of the iron containing DESs, the molar ratios of the salts were varied. It is important to note that electrolytes synthesized with FeCl2 contain two moles of chloride per mole of iron; additional chlorides come from any added choline chloride. Electrolytes synthesized with FeCl3 contain three moles of chloride per every one mole iron (again, additional chloride comes from added choline chloride).
Cyclic voltammetry was performed in iron containing DESs with varying molar ratios of FeCl2:ChCl:EG (Fig. 2). The cyclic voltammograms (CVs) for 1:1:4, 0.5:1:4 and 0.1:2:4 are compared; it should be noted that the CVs shown are the 5th scan and represent the steady state response. The current response is similar to what would be expected for Fe2+/Fe0 in a typical aqueous based electrolyte;38 iron deposition/dissolution displays sluggish kinetics as indicated by the wide separation between the potential for deposition and the dissolution peaks. The 1:1:4 electrolyte contains 3 chloride ions for every 1 iron ion, the 0.5:1:4 electrolyte contains 4:1 Cl:Fe and the 0.1:2:4 represents a solution containing chloride in excess of iron (Cl:Fe is 22:1). As the chloride to iron ratio is increased (from 3:1 up to 22:1), the onset for dissolution is shifted to a more negative potential and a reduced separation between reduction and oxidation is observed, implying faster kinetics for dissolution of iron. The CVs for the 1:0:4 and 1:1:4 electrolytes overlay (Fig. 2 inset); indicating that the addition of choline does not largely affect the kinetics for the deposition/dissolution reaction, but the chloride ion does when chloride is in access of 4:1, as discussed below. Furthermore, the CVs for the 0.5:1:4 and 1:2:4 electrolytes agree (both contain 4:1 Cl:Fe) and the CVs for the two electrolytes where chloride is in excess (0.25:2:4 and 0.1:2:4) also agree with one another (refer to Fig. S5 of the Supplementary Material for all CVs). Thus, there exists three regimes: (a) that of iron deposited from solutions containing low chloride (curve "c" in Fig. 2), (b) deposition with an excess of chloride present, or (c) a region in between where chloride to iron ratio is 4:1. This indicates that the iron deposition/dissolution reaction is dependent on the ratio of chloride to iron.
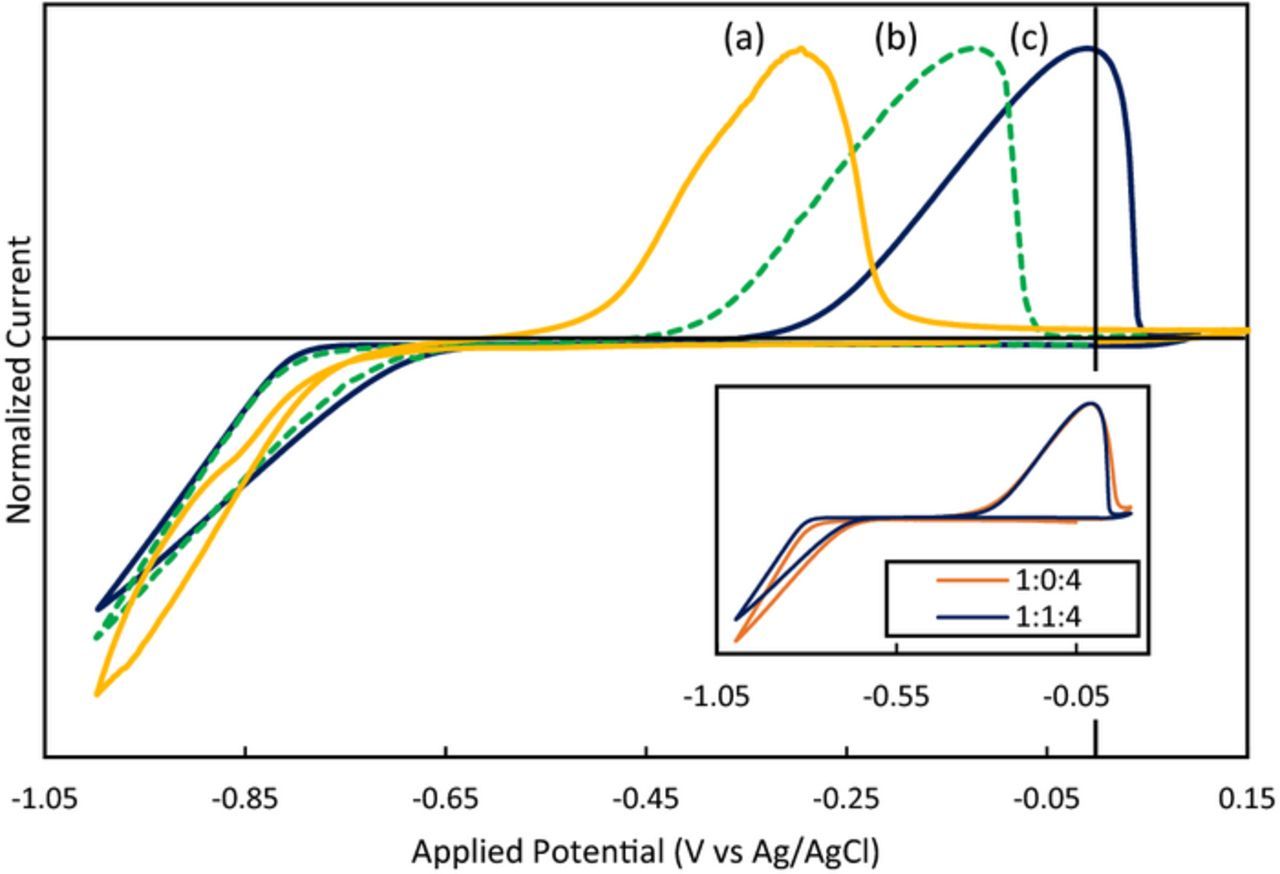
Figure 2. Cyclic voltammetry at a glassy carbon electrode in (a) 0.1:2:4 (b) 0.5:1:4 or (c) 1:1:4 FeCl2:ChCl:EG at 50 mV/s, 80°C, in a N2-atmosphere. Current was normalized to allow for a more direct comparison. Inset: comparison of the 1:1:4 and 1:0:4 solutions.
Nucleation mechanism
In order to understand how iron electrodeposits, it is important to first understand the initial stages of deposition and nucleation. As shown by the CVs in Fig. 2, the electrodeposition of iron changes with the Cl:Fe ratio, thus, it is of interest to compare nucleation cases in which there is an excess of chloride to that of iron deposited from an electrolyte containing a low Cl:Fe ratio.
The current transient for the case of high chloride (0.25:2:4) in Fig. 3a shows a typical response where the current decays quickly upon relaxation of the double layer charging, then shows an increase (beginning at ∼0.2 s) due to growth of independent nuclei (or simultaneously an increase in the number of independent nuclei) without the effect of overlapping diffusion boundary layers. After a certain point, a maximum is reached after the independent nuclei have grown close enough together for their diffusion boundary layers to overlap. At this point diffusion to the surface changes from hemispherical to linear mass transfer and the current decays. Interestingly the current response for the case of low chloride (1:1:4 electrolyte) does not reach a maximum and does not decay even after 500 s (inset Fig. 3b). In fact, the current response appears to be invariant with time as shown in Fig. 3b. It is important to note that electrolyte breakdown was not observed at these potentials (especially for those containing low chloride concentrations) and thus would not contribute to the current transients.
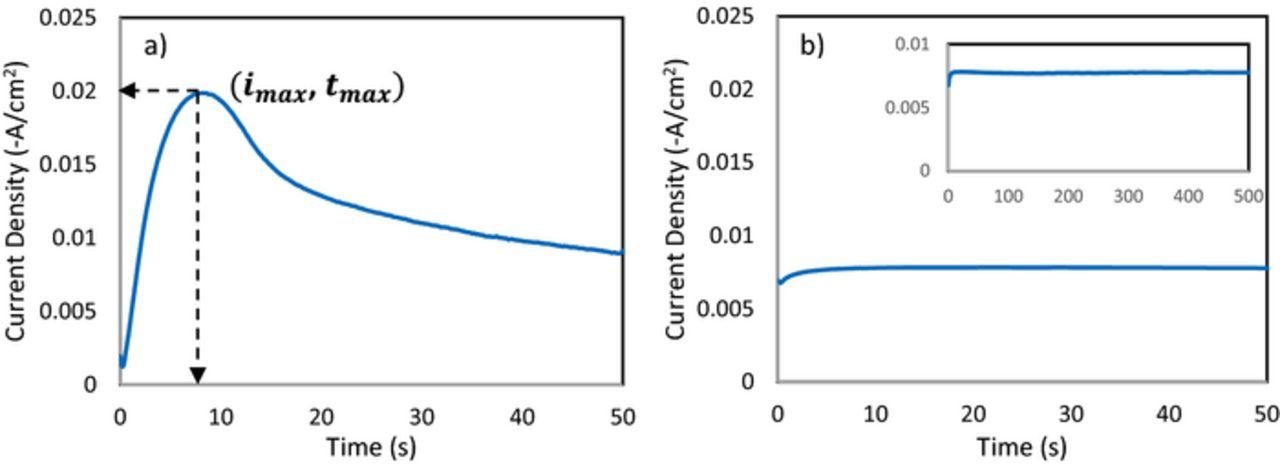
Figure 3. Current vs time transients for iron electrodeposition at −1.15 V vs Ag/AgCl in (a) 0.25:2:4 and (b) 1:1:4 FeCl2:ChCl:EG electrolytes.
Nucleation studies have been carried out in ionic liquid media using the theoretical model proposed by Scharifker and Hills.39,40 This model describes the two mechanisms for formation of a monolayer: (1) instantaneous where nucleation spreads out on the substrate from nuclei formed at t = 0 (ie nucleation rate is fast compared to growth rate) or (2) progressive nucleation, where nuclei appear randomly on the substrate (slow nucleation rate). When there is an excess of chloride, iron electrodeposition was found to follow progressive nucleation as shown in Fig. 4a. However, for electrodeposition in solutions containing low chloride, nucleation cannot be explained using the traditional S-H model (Fig. 4b).
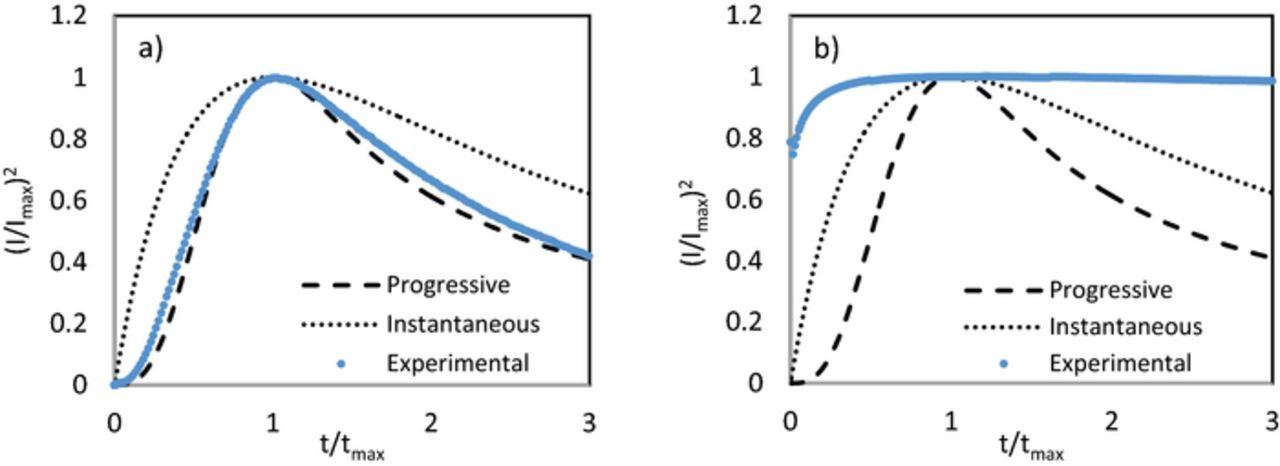
Figure 4. Nondimensional plots (I/Imax)2 vs t/tmax for experiments of iron electrodeposited at −1.15 V vs Ag/AgCl in (a) 0.25:2:4 and (b) 1:1:4 FeCl2:ChCl:EG electrolytes. Dashed and dotted lines represent progressive and instantaneous nucleation, respectively.
The nucleation mechanism may be expected to change as a function of applied potential as well as substrate material. However, iron electrodeposition from solutions containing low chloride exhibited similar nucleation behavior regardless of applied potential (ranging from −0.75 to −1.35 V) or substrate material (glassy carbon, carbon fiber microelectrode, platinum, and gold); these data are located in the Supplementary Material (Figs. S6 and S7). It is also interesting to note that the time invariant deposition behavior is not characteristic of iron electrodeposition or even electrodeposition of metals that exhibit sluggish kinetics (refer to the Fig. S8 of the Supplementary Material for 1:1:4 ZnCl2:ChCl:EG a kinetically facile electrodeposition reaction). Similar time invariant deposition behavior has been reported in the literature for zinc deposition onto a platinum substrate from a choline chloride and ethylene glycol based electrolyte as well as deposition of Ru, Rh, and Pd onto a stainless steel substrate from a 1-butyl-3-methylimidazolium chloride IL.41,42 It has been proposed that the cations present within the double layer effect the nucleation mechanism as well as the halides, and thus it is important to determine speciation. Since the redox active ions present in solution affect the charge transfer mechanisms, this gives an indication that different species are present at different chloride concentrations.
From the early stages of deposition (nucleation), it is clear that the mechanism for electrodeposition changes with chloride to iron ratio. This also influences the nature of the electrodeposited iron. As shown by the SEM micrographs in Figure 5, iron deposited from an electrolyte containing high chloride was rough and almost dendritic compared to iron deposited from an electrolyte containing low chloride. These rough deposits present an issue for a system where the iron must be reversibly plated and stripped upon charge/discharge of the battery and thus it is of interest to investigate the coulombic efficiency for the deposition/dissolution reaction with solution composition.
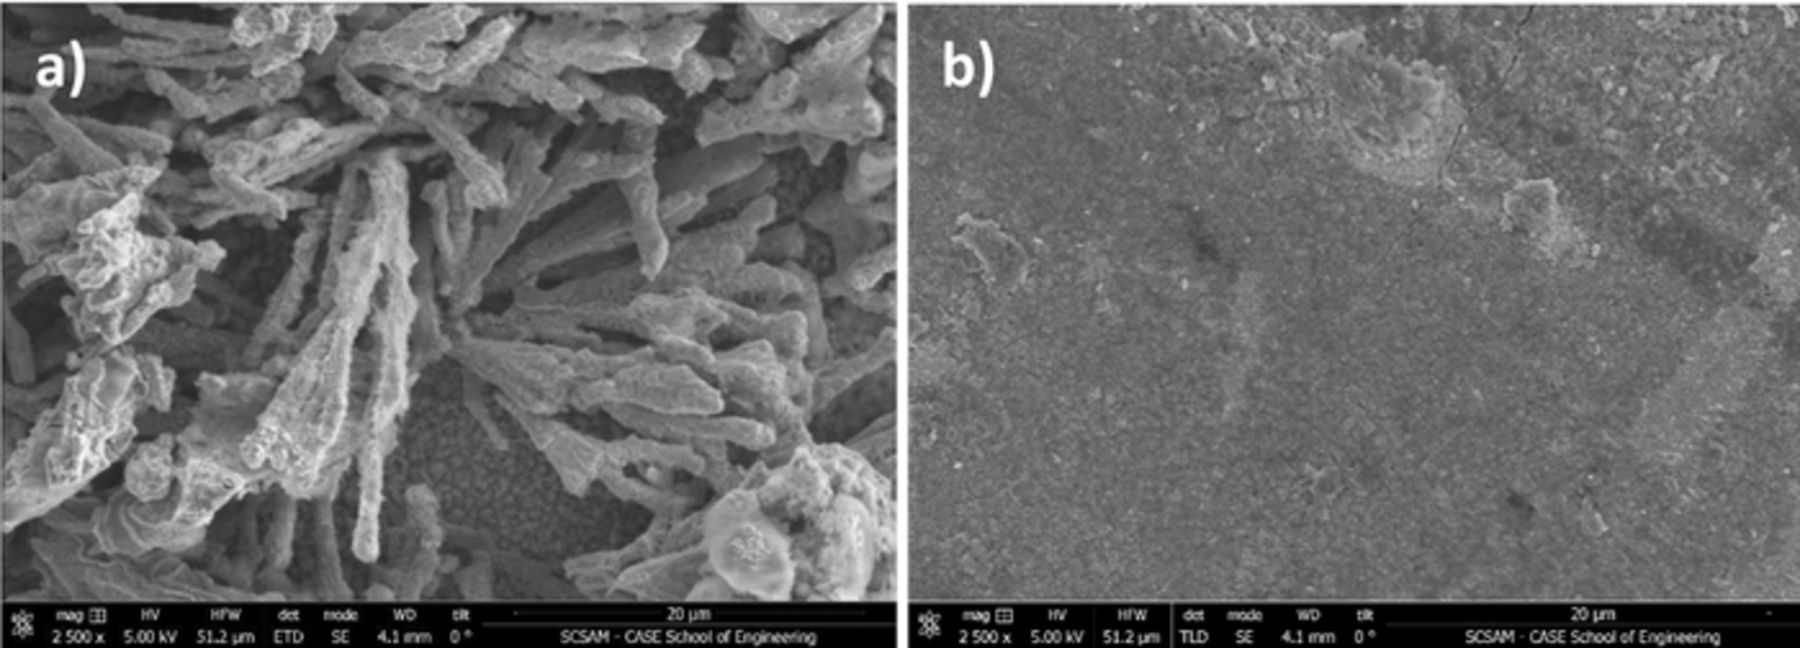
Figure 5. Plating 10 mAh @ 5 mA/cm2 onto a glassy carbon substrate (80°C) from (a) 0.25:2:4 and (b) 1:1:4 FeCl2:ChCl:EG electrolytes. Potential was ∼−1.15 V vs Ag/AgCl for deposition/nucleation and levelled out at −0.9 and −1.1 resp.
Coulombic plating efficiencies for iron deposited at −1.0 V and stripped at +0.15 V vs Ag/AgCl are compared for the various compositions of iron DES electrolytes (Table I). Efficiencies are surprisingly low for the 0.1:2:4 and 0.25:2:4 electrolytes, where chloride is in excess of iron. Inefficiencies have been attributed largely to the nature of the electrodeposited iron20 as well as formation of a passive film43 or electrolyte decomposition. As was discussed in our previous publication,20 we observed that iron deposited from a 1:2:4 FeCl2:ChCl:EG solution was found to be non-adherent and easily cracked and flaked off the surface whereas iron deposited from a 1:1:4 electrolyte was strongly attached to the surface in the form of a smooth deposit. The 0.1:2:4 and 0.25:2:4 electrolytes behave similarly to the 1:2:4 electrolyte where the deposits do not adhere well, thus, coulombic inefficiency is mainly due to loss of metal from the surface of the electrode. It is apparent that electrolytes that contain an excess of chloride (compared to iron) consistently exhibit this deposit morphology.
Table I. Coulombic plating efficiency for the IL electrolytes of this study at 80°C. Iron was plated at −1.0 V vs Ag/AgCl for 5 minutes and then stripped for 5 minutes at a potential more positive of the electrodissolution peak (+ 0.15 V). The efficiency was estimated from the number of coulombs passed during stripping divided by coulombs during plating.
| Molar Ratio (FeCl2:ChCl:EG) | Plating Efficiency at −1.0 V (%) |
|---|---|
| 1:0:4 | 92 |
| 1:1:4 | 98 |
| 0.5:1:4 | 77 |
| 1:2:4 | 69 |
| 0.25:2:4 | 20 |
| 0.1:2:4 | 10 |
In addition to poor deposit quality, electrolyte breakdown was found to occur in the solutions containing an excess of chloride. Hydrogen gas evolution at the platinum mesh negative electrode was confirmed using mass spectrometry after bulk electrolysis in an H-type cell for 5 hours at 22 mA/cm2 (membrane area). Additional degradation products have been reported in the literature for a 1:2 choline chloride and ethylene glycol solution after bulk electrolysis.44
The association of anions or cations plays an important role in electrochemical stability. The fact that electrolyte breakdown was not observed within the potential range of interest for electrolytes containing low concentrations of chloride suggests that the reduction potential of the hydrogen bond donor (ethylene glycol) was lowered to a more negative potential. This implies that the hydrogen bond donor is interacting more strongly within the ILs containing low chloride, which increases the lowest unoccupied molecular orbital (LUMO), therefore increasing the electrochemical stability window (it is more difficult to put an additional electron in this orbital).
Physical properties of the electrolytes
Effect of chloride to iron ratio on conductivity
In Figs. 6, conductivity is plotted as a function of (a) mole fraction of iron (b) mole fraction choline and (c) mole fraction ethylene glycol. When referencing Fig. 6a, the conductivity decreases dramatically when the mole fraction of iron is greater than 0.17 (as indicated by the dashed vertical line); this trend is consistent for electrolytes containing Fe2+ or Fe3+. It is useful to make note of the moles of chloride per moles of iron (Cl:Fe ratio), independent of oxidation state of the iron. Interestingly, solutions containing 0.17 mole fraction iron correspond to those with a chloride to iron ratio of 4:1. Thus, it is apparent that a chloride to iron ratio of at least 4:1 is required for enhanced conductivity. Increasing this ratio to 5:1 and even higher does not appear to significantly alter electrolyte conductivity. It is known that the addition of choline, a bulky inorganic cation, will improve conductivity.21 However, when referencing Fig. 6b, the conductivity of these iron containing electrolytes appears to depend more strongly on the chloride to iron ratio; the data can be grouped into two clusters. Those with ≥4:1 ratio Cl:Fe exhibit a high conductivity whereas those with <4:1 ratio Cl:Fe have low conductivities (refer to Fig. S9 of the Supplementary Material for plots containing the data labels for each of the electrolytes tested). Similarly, these two clusters are present when referencing Fig. 6c where electrolytes with ≥4:1 ratio Cl:Fe exhibit a high conductivity and those with <4:1 ratio Cl:Fe have low conductivities. Furthermore, the amount of ethylene glycol does not largely affect the electrolyte properties.
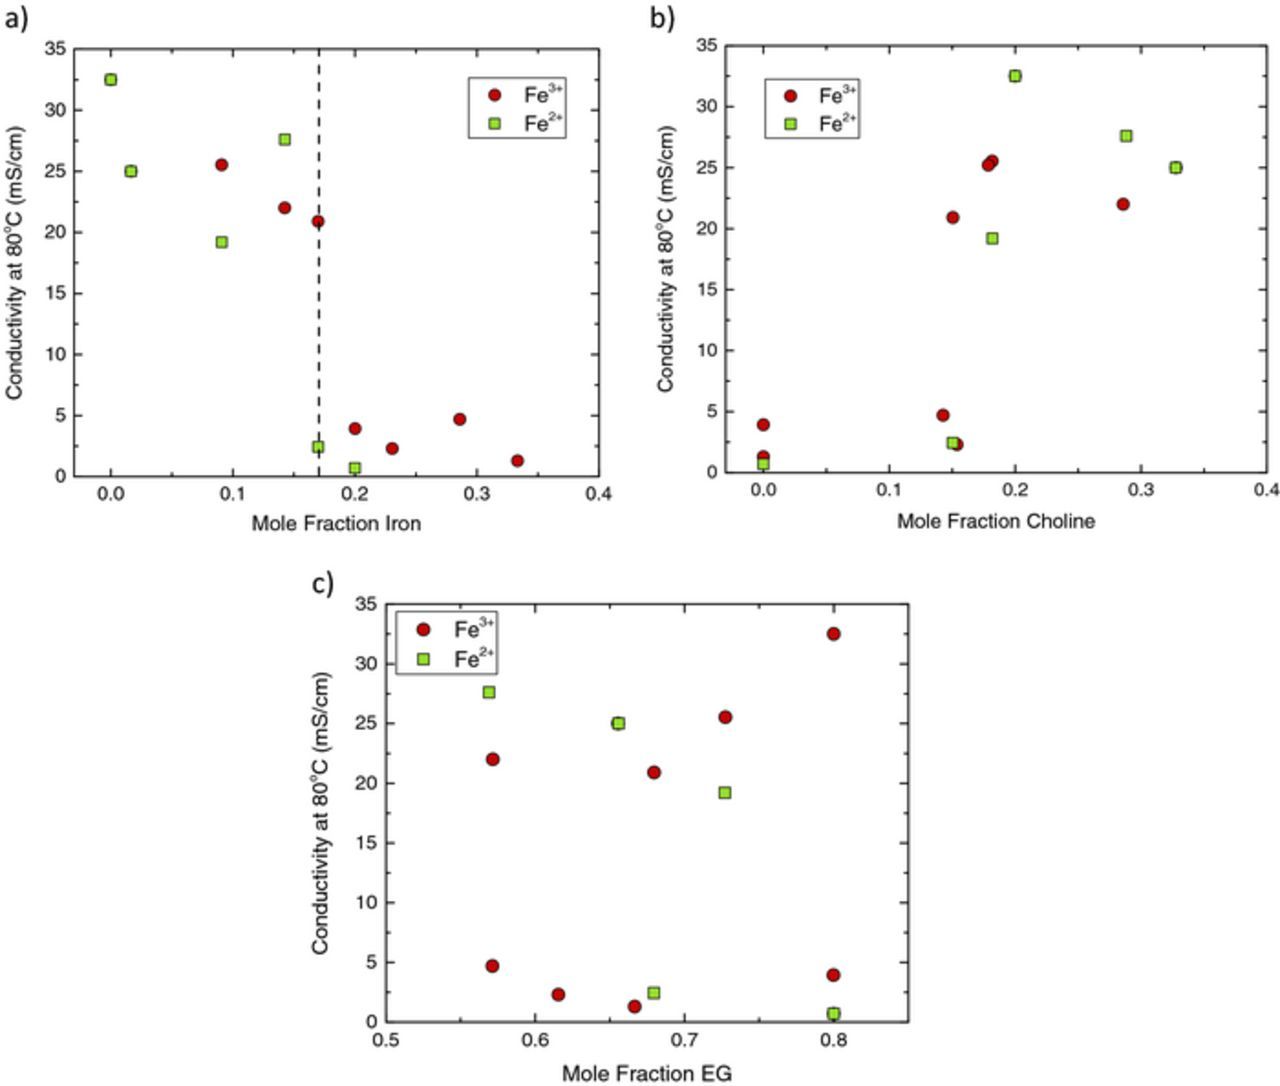
Figure 6. Conductivity of iron containing ILs as a function of concentration of (a) iron (b) choline or (c) ethylene glycol at 80°C.
Walden plot
Within the IL literature, the use of the Walden Rule has been applied to explain physical properties of ILs and to provide insight on the degree of ionicity.45 The Walden rule suggests that the molar conductivity (conductivity per mole of charge) is proportional to the fluidity, or inverse viscosity (Λη = Constant). For example, in a dilute aqueous solution (0.01 M KCl), the ions are completely dissociated and ion mobility is solely effected by solution drag thus, the relationship is linear and passes through the origin. However, many ILs fall below this line on the Walden plot. This is not surprising in that ionic interactions are expected to occur in very concentrated ionic media that would yield a lower molar conductivity than expected. These ionic interactions in the form of ion pairs or aggregates can strongly influence the conduction mechanism. This is shown by the Walden plot (Fig. 7) for selected iron containing DESs where the log of the molar conductivity is plotted as a function of the log of the inverse viscosity. The 0.5:1:4 FeCl2:ChCl:EG solution contains Cl:Fe in a 4:1 ratio, whereas the 1:1:4 FeCl2:ChCl:EG electrolyte does not (Cl:Fe of 3:1). The 0.5:1:4 and the 1:2 M ChCl:EG solutions show a similar trend, implying that there are some interactions between the ions in solution but also that the iron does not largely affect conductivity (compared to a traditional IL). However, the 1:1:4 solution line is much lower implying that the ions are interacting very strongly, hindering solution conductivity. In fact, the line for the solution containing 1:1:4 FeCl2:ChCl:EG deviates significantly from the "ideal solution line"; a vertical deviation, ΔW, of 1 indicates an ionic liquid which exhibits only 10% of the ionic conductivity expected (implying that it is only 10% ionized).46 This suggests that there are strong ion-ion interactions and possible aggregation in electrolytes containing low concentrations of chloride which hinder solution conductivity.
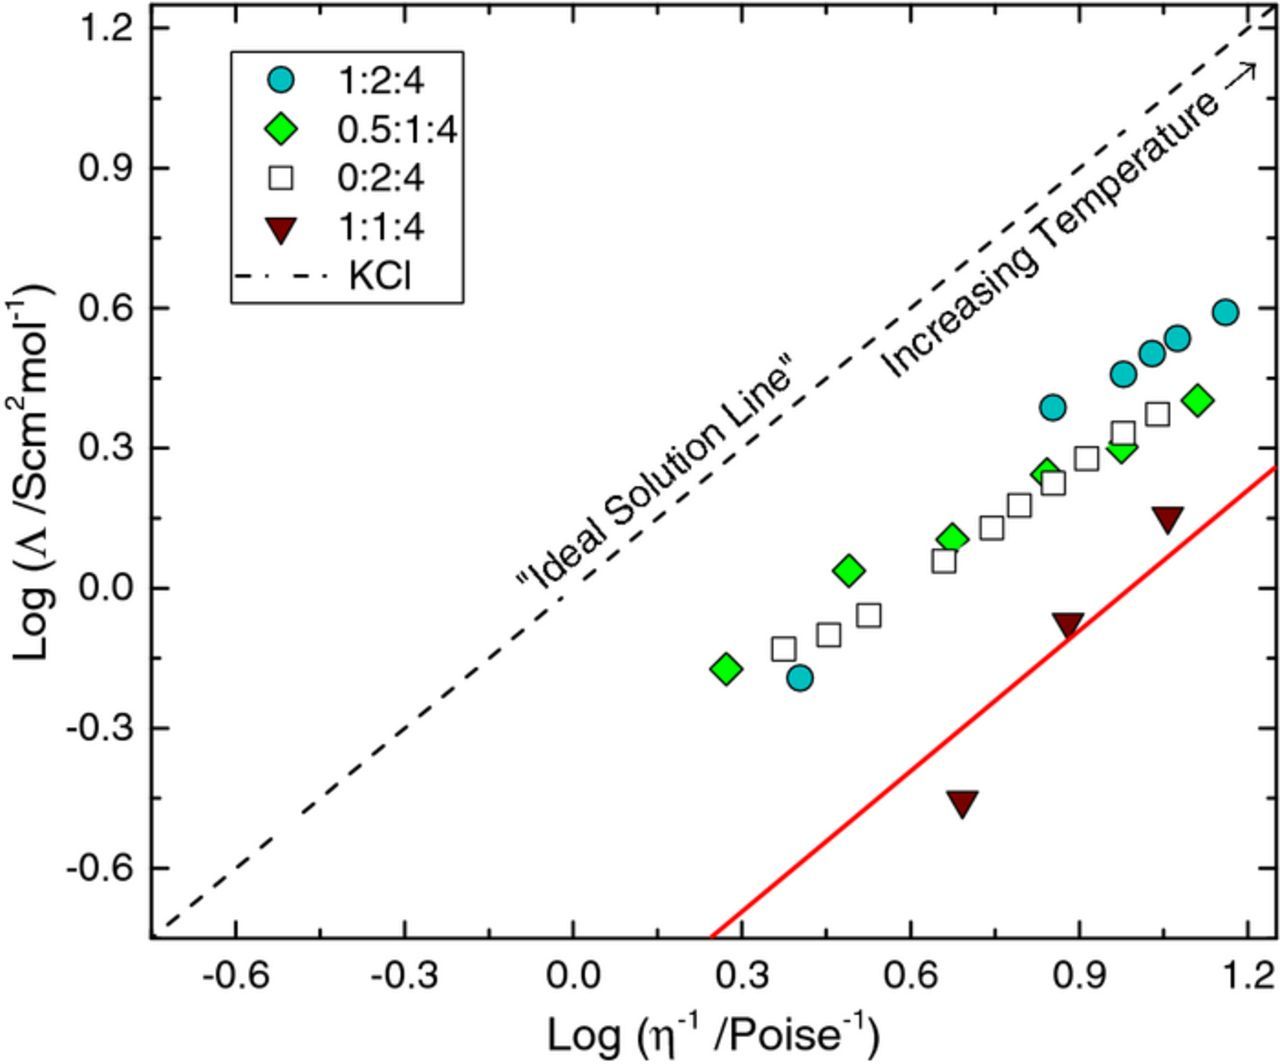
Figure 7. Walden plot for selected iron (Fe2+) containing ILs compared to a neat 2:4 M ChCl:EG electrolyte as well as the ideal solution line (0.01 M KCl in water). The red line indicates a deviation of ΔW = 1.
Iron speciation
Thus far we have shown that the electrodeposition kinetics and also the fluid properties of the electrolyte change when the chloride to iron is above vs below a 4:1 molar ratio. Electrochemical reactivity of the solute ions as well as the physical properties of the electrolyte are controlled by speciation of the metal moieties in solution. To understand what ions are responsible for the observed properties in these iron DES electrolytes, chemical speciation was investigated using X-ray Absorption Near Edge Structure (XANES) measurements and Raman spectroscopy. Both techniques enable non-destructive probing of the liquid samples.
X-ray absorption fine structure (XAFS) spectroscopy is sensitive to the iron oxidation states as well as the coordination geometry, especially in the pre-edge region located ∼10 eV before the main K-edge absorption peak. Intensity of the pre-edge in this region is related to the centrosymmetry or coordination geometry and the centroid position is dependent on oxidation state. In Figure 8, the normalized pre-edge spectra for the Fe K-edges for an electrolyte containing a 4:1 ratio of Cl:Fe (0.5:1:4 FeCl2:ChCl:EG) is compared to an electrolyte which contains a 3:1 ratio Cl:Fe (1:1:4 FeCl2:ChCl:EG) as well as a salt standard. The peak intensity for the salt standard (aq) shows the lowest intensity, characteristic of a centrosymmetric complex (likely octahedral). This is unsurprising in that in aqueous systems iron exists as an octahedral complex, Fe(H2O)62+.47 In contrast, the electrolyte containing a 4:1 Cl:Fe ratio shows the highest intensity, characteristic of a lack in inversion symmetry (likely tetrahedral). Peaks for electrolytes containing Fe2+ that is 4-coordinated can be satisfactorily fit using two components centered around 7112.4 and 7114.0 eV, which is consistent with literature.48,49 When the chloride to iron ratio is greater than 4:1, the iron is 4-coordinated with tetrahedral or square planar geometry (a summary table with data from deconvolution of the pre-edge peaks is reported in the Supplementary Material). Within the literature the tetrahedral complexes [FeCl4]− and [FeCl4]2− have been shown to be the dominant species in iron containing DES.50–53 It is unsurprising that for Cl:Fe ratios ≥4:1 we see evidence of these complexes as well which makes sense when considering the stoichiometric ratios. Results obtained from Raman spectroscopy support this observation; example spectra can be referenced in the Supplementary Material (Fig. S10) which show the presence of the [FeCl4]− tetrahedral iron complex was confirmed by the large peaks located at 333 cm−1.52–54

Figure 8. Normalized pre-edge spectra (Fe K-edge) for selected electrolytes compared to that of a standard, FeCl2•4 H2O with the corresponding models of best fit.
The concentration of choline showed little to no effect on the iron deposition/dissolution kinetics or on the solution conductivity. However, for electrolytes containing low amounts of chloride (ie Cl:Fe ratios less than 4:1) it is of interest to probe the interactions with ethylene glycol. Figure 9 displays the Raman spectra in the region from 800 to 1500 cm−1. Ethylene glycol is compared to a solution of choline chloride and ethylene glycol (1:4 M ChCl:EG) as well as two electrolytes that contain iron. Upon addition of choline chloride, the Raman lines for ethylene glycol do not change but additional peaks from the choline appear at 957, 1140, and 1342 cm−1. For the case of electrolytes containing ≥4:1 Cl:Fe (ie 0.5:1:4 FeCl2:ChCl:EG), the spectra resemble that of the choline chloride and ethylene glycol. However, when the chloride:iron ratio is low (i.e. 2:1) there is a dramatic difference in the spectra suggesting that the ethylene glycol is interacting with the iron. The hydrogen bond donor has been shown to play a significant role in the coordination of metal ions, furthermore, ethylene glycol is known to form complexes with transition metal chloride salts.55–57 The proposed Fe-EG complex is shown by Fig. 10.
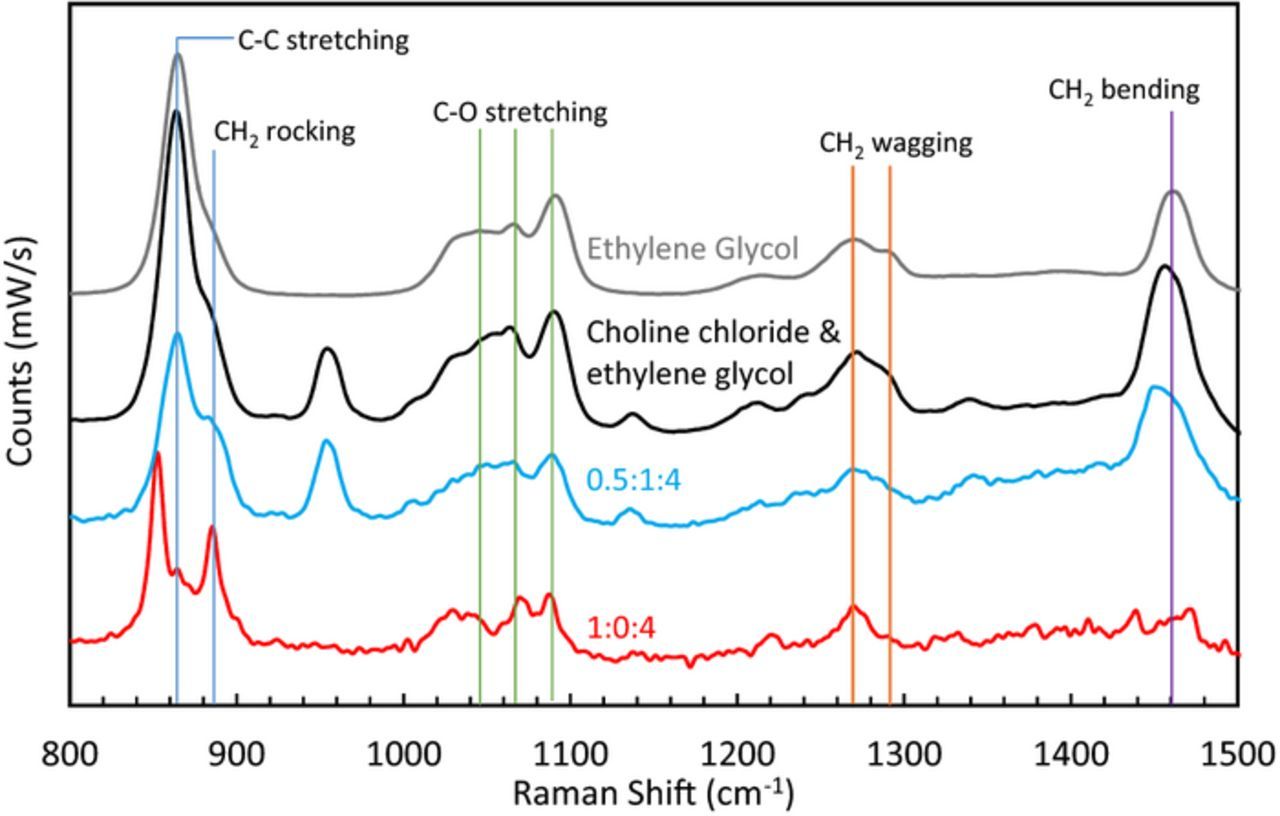
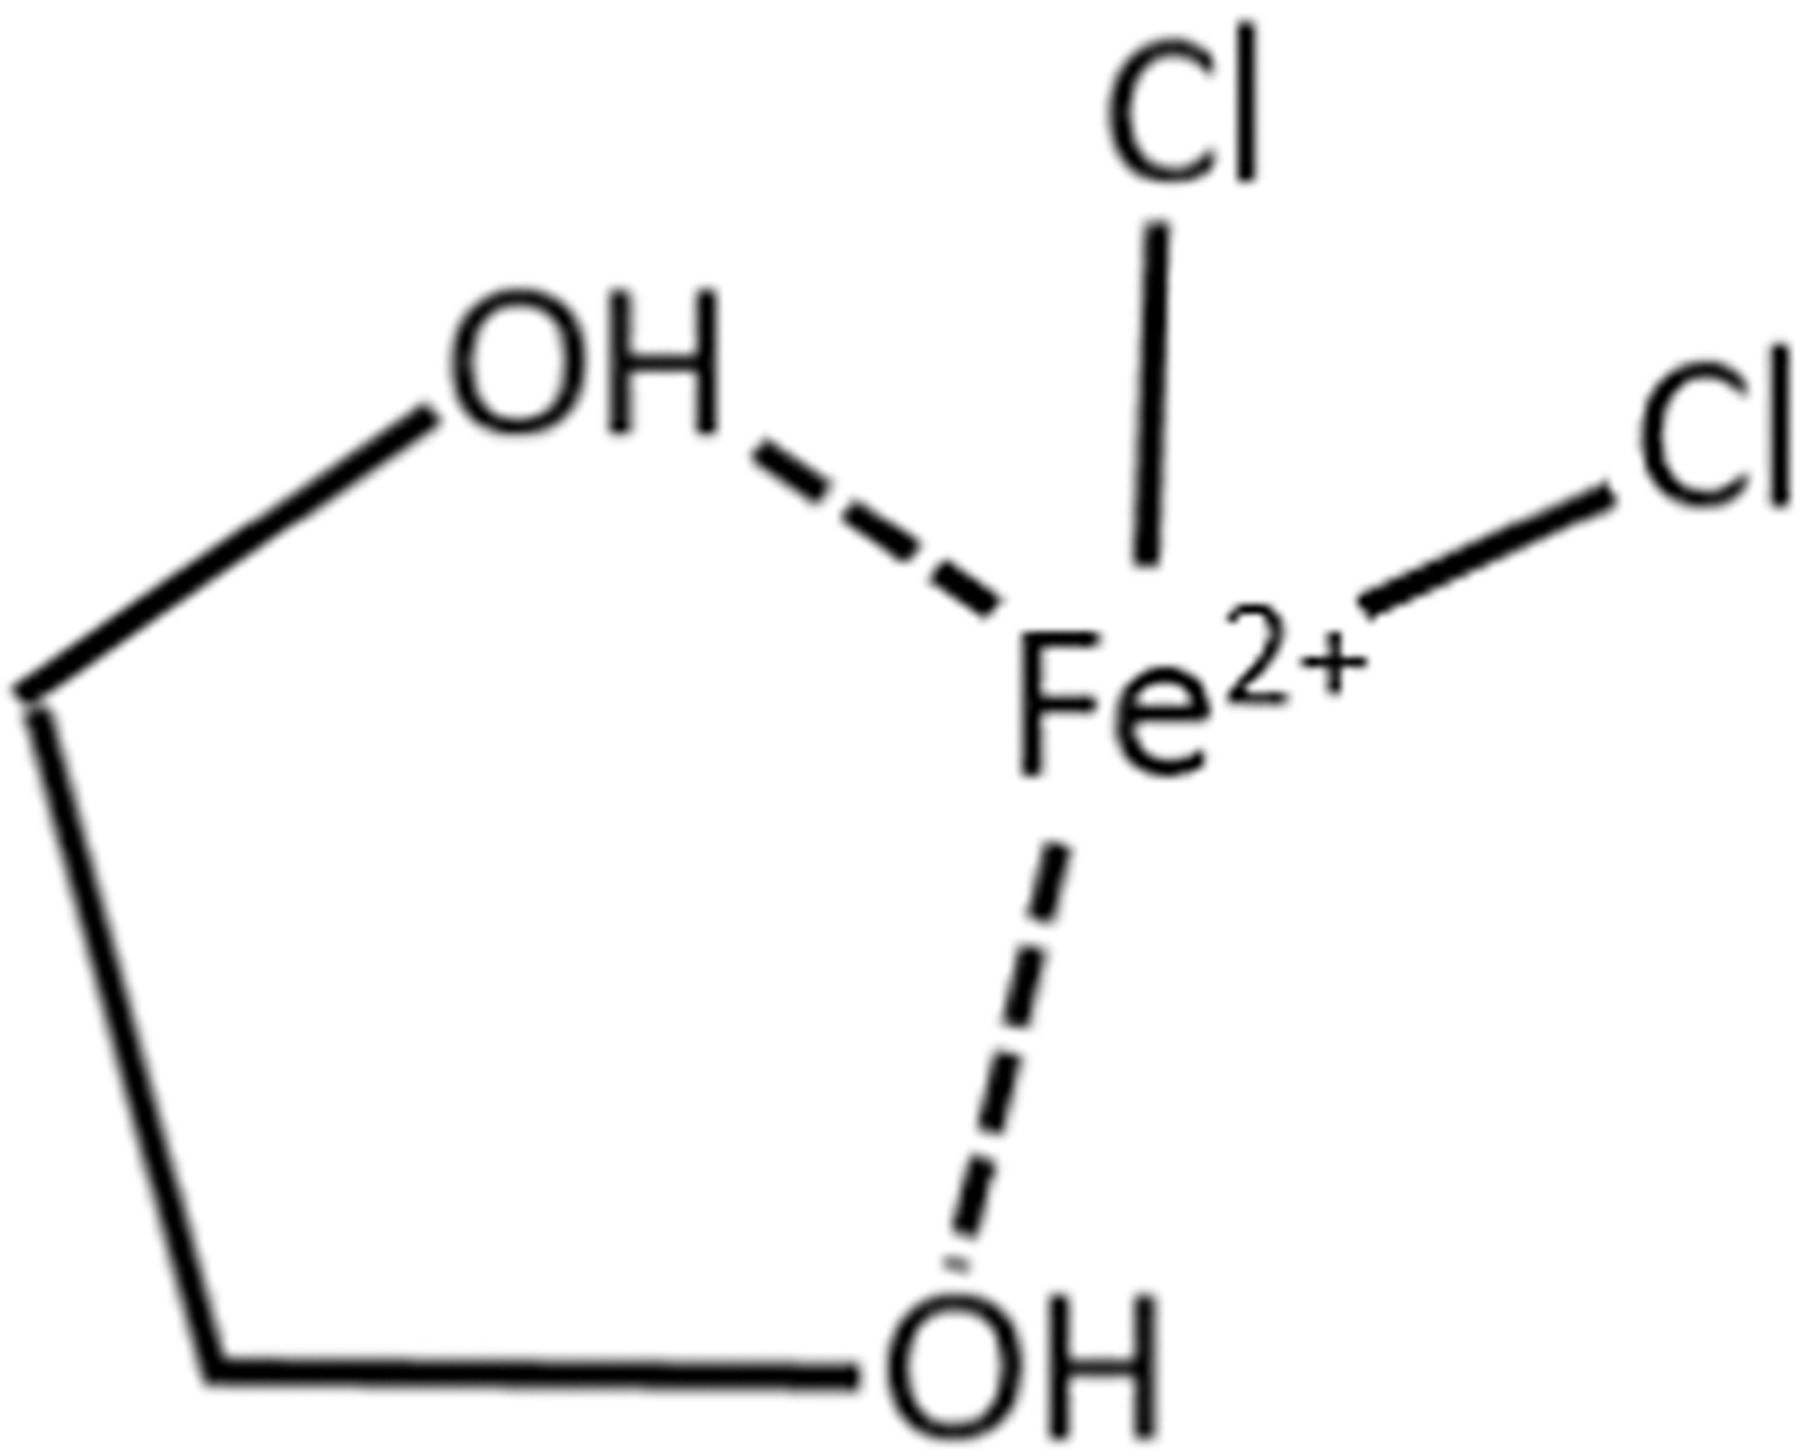
Figure 10. Proposed EG-Fe complex.
Conclusions
The feasibility of an electrolyte containing 0.5:1:4 FeClx:ChCl:EG was demonstrated in a flow battery system. However, the flow cell utilizing a 1:1:4 FeClx:ChCl:EG electrolyte would not discharge, emphasizing the need for an understanding of the factors that affect the electrochemistry, specifically that of the iron deposition and dissolution reaction, as well as how iron speciation influences the properties of the electrolytes. We have demonstrated this for solutions containing iron chloride, choline chloride, and ethylene glycol. It was shown that the chloride to iron ratio dominates both electrochemical and physical properties of these electrolytes. X-ray absorption spectroscopy (XAS) coupled with Raman spectroscopy data indicate the presence of the tetrahedral iron chloride complexes, [FeCl4]− and [FeCl4]2− for solutions containing ≥ 4:1 molar ratio chloride to iron. However, for low chloride electrolytes (i.e. <4:1 Cl:Fe), the ethylene glycol forms a complex with the iron. This EG-Fe complex allows for enhanced plating efficiencies due a decrease in the H2 evolution side reaction and a smoother, more adherent iron deposit, however, the physical properties of the solution are compromised (i.e. conductivity for a 3:1 electrolyte is an order of magnitude lower than that of the 4:1 electrolyte). The Walden plot suggests that this is due to strong ion-ion interactions that hinder the solution conductivity. Furthermore, iron plating in solutions containing an excess of chloride follows progressive nucleation at low overpotentials. However, for electrodeposition in solutions containing low chloride, there is a change in the mechanism and nucleation cannot be explained using the traditional S-H model.
Acknowledgments
This work was supported by the U.S. National Science Foundation, Sustainable Energy Pathways Program (NSF-1230236) in collaboration with Dr. Levi Thompson and Dr. Jason Gaudet of the University of Michigan. Dr. Jason Gaudet is acknowledged for his help with X-ray Absorption Spectroscopy measurements. This research used resources of the Advanced Photon Source, a U.S. Department of Energy (DOE) Office of Science User Facility operated for the DOE Office of Science by Argonne National Laboratory under Contract No. DE-AC02-06CH11357. Nanthawan Avishai of the Swagelok Center for Surface Analysis of Materials at Case Western Reserve University is acknowledged for help with high-resolution imaging of the electrodeposited iron.