
Abstract
As feature size continue to decrease, traditional copper (Cu) interconnections will encounter many problems. Ruthenium (Ru) is selected as a barrier material and even a future interconnection metal material because of its many advantages. However, due to its high hardness and chemical inertness, Ru is difficult to be removed during chemical mechanical polishing (CMP). In this study, the effect of UV-activated potassium persulfate (K2S2O8) on the removal rate of Ru CMP was studied. X-ray photoelectron spectroscopy (XPS) combined with electrochemistry is used to study the removal mechanism and chemical reactions. The results show that ultraviolet rays can enhance the chemical action in the CMP process and change the removal rate. Under the condition of 80 mM, the promotion rate is about 28.01%. When the particle diameter increases to 80 nm, the removal rate is also significantly increased by about 26.36%. Mechanism analysis shows that, on the one hand, it is affected by diffusion-control. On the other hand, the surface RuO3 and K2S2O8 undergo a Fenton-like reaction under UV conditions, which makes the Ru surface loose and porous (Rq = 0.533 nm), so it is easier to remove under mechanical action.
Export citation and abstract BibTeX RIS

This is an open access article distributed under the terms of the Creative Commons Attribution Non-Commercial No Derivatives 4.0 License (CC BY-NC-ND, http://creativecommons.org/licenses/by-nc-nd/4.0/), which permits non-commercial reuse, distribution, and reproduction in any medium, provided the original work is not changed in any way and is properly cited. For permission for commercial reuse, please email: permissions@ioppublishing.org.
With the gradual reduction of feature size, Traditional copper (Cu) interconnects barrier materials (such as tantalum/tantalum nitride) will encounter many problems, such as the inability to eliminate the copper seed layer, the sharp increase in interconnect resistance in the back end of the line (BEOL) interconnects, 1–3 which will seriously affect the performance of the device. Ruthenium (Ru) has the advantages, low resistivity (14 μΩ·cm), direct copper electroplating and high melting point (2310 °C), and is selected as the barrier material. 4–6 At the same time, Because of the mean electron free path of Ru (10.2 nm) is smaller than that of Cu (39.3 nm), under the condition of nanowires, compared with Cu, the resistance change of Ru with the shrinking size is weak. 7–10 Therefore, Ru can be used as a future interconnect metal material.
As we all know, chemical mechanical polishing (CMP) is currently the most critical technology for global planarization and local planarization in the integrated circuit manufacturing process. 11 However, Ru's chemical inertness and high hardness (6.5 Mohs) make it difficult to polish during CMP process. 12,13 There are usually two ways to solve the problem,as shown in Table I. One is KIO4-based slurry system, B. C. Peethala, 14 Jie Cheng 15 and Hao Cui 6 et al. studied the effect of KIO4 on the removal rate of Ru, the results showed that KIO4 can significantly increase the removal rate of Ru. However, serious corrosion will occur when polishing the pattern wafer, which is a serious problem. The another one is adding a complexing agent to the H2O2-based slurry system, Ziyan Wang 16 studied the effect of ammonium complexing agent, Liang Jiang 17 studied the effect of potassium ions, and Yichen Du 18 and Qingwei Wang 19 et al. studied the effect of guanidinium ions. The results show that, on the one hand, the added cation can weaken the electrostatic repulsion between the silica particles and the Ru surface, and on the other hand, complexing agent can produce a complex reaction, which is the enhancement of the Ru removal rate. Different from the above commonly used methods, it is an effective method to enhance the oxidation ability to promote the Ru removal rate. Therefore, environmentally friendly H2O2 is selected as the oxidant in this paper, and the effect of ultraviolet (UV)-activated potassium persulfate (K2S2O8) on the removal rate of Ru under the H2O2-based slurry system is studied. Firstly, characterization was performed by the CMP experiment. Followed by mechanism analysis by electrochemical and X-ray photoelectron spectroscopy (XPS). Finally, its surface topography will be obtained through scanning electron microscopy (SEM) and atomic force microscopy (AFM).
Table I. The previously published method on Ru CMP.
| Name | Oxidant | Summary |
|---|---|---|
| B. C. Peethala 14 | KIO4 | A removal mechanism with KIO4 as the oxidizing agent is proposed |
| Jie Cheng 15 | KIO4 | Comprehensively reveal the polishing mechanism affected by the potassium periodate (KIO4) concentration and the slurry pH values. |
| Hao Cui 6 | KIO4/NaClO | Ru film underwent severe pitting corrosion with these slurries, and formed a porous RuO3/RuO2 oxide layer. |
| Ziyan Wang 16 | H2O2 | Ammonium complexing agent can effectively increase the removal rate of Ru. |
| Liang Jiang 17 | H2O2 | Potassium ions can reduce the electrostatic repulsion between particles. |
| Yichen Du 18 | H2O2 | Guanidinium ions complexing agent can effectively increase the removal rate of Ru. |
| Qingwei Wang 19 | H2O2 | Control removal rate selectivity by using guanidine ion and 124-triazoles |
Experimental
Polishing experiments
All polishing experiments were carried out on an E460E polisher from Alpsitec Inc., equipped with a politex pad (purchased from the Dow chemical company). The polishing slurry under investigation was composed of colloidal silica (particle size between 60 nm to 70 nm, pH = 9.5–10.0), Hydrogen peroxide ((H2O2, the mass fraction of 30 wt%, semiconductor grade) and potassium persulfate (K2S2O8, 99.5% purity). Finally, the pH of the slurry was adjusted to 8.0 by using diluted KOH or HNO3. A 200 nm Ru film was deposited on a silicon substrate with a diameter of 12 inches by plasma enhanced atomic layer deposition, and a 76.2 mm diameter Ru samples was cut out for the CMP experiment. An ultraviolet lamp (UV, purchased from Shanghai Yichen) is used for CMP experiment and subsequent experiments. A Schematic diagram of CMP process is shown in Fig. 1, and the experimental process parameters are shown in Table II. In order to reduce the influence of the irradiation position, the UV lamp is covered with a hood during the polishing process, so that the UV lamp can only irradiate to the upstream of the polishing head. All the CMP experiments were carried out at room temperature (25 ± 1 °C). The removal rates of Ru were determined by measuring the difference in film thickness before and after polishing, using four-point probe (4D Model 333 A) test the mean value of 81 different points along any diameter. To ensure the accuracy of the data, each experiment was repeated three times and the average value was recorded.

Figure 1. Schematic diagram of CMP process planarization.
Download figure:
Standard image High-resolution imageTable II. Several key parameters of the CMP process.
| Parameter | Condition |
|---|---|
| Down force | 1.5 psi |
| Back pressure | 0 psi |
| Polishing head speed | 87 rpm |
| Polishing platen speed | 93 rpm |
| Slurry flow rate | 300 ml min−1 |
| UV wavelength | 253.7 nm |
Electrochemical experiments
All electrochemical experiments were conducted in the CHI660E electrochemical workstation produced by Shanghai Chenhua. Electrochemical workstation with a three-electrode glass cell, (100 ml volume, Pt counter electrode and saturated calomel electrode). a Ru coupon (10 × 20 × 2 mm, 99.99% purity) was used as a working electrode. Before experiment, the working electrode was abraded with sandpaper, then dipped into 1 wt% citric acid solution to ensure the removal of naturally oxidized products.
Open circuit potential (OCP) was continuously measured at 600 s and a dynamic potential curves (Tafel curve) were obtained by the potentiodynamic polarization curve test. The tests of electrochemical impedance spectroscopy (EIS) were performed at premeasured OCP by superimposing a sinusoidal AC potential perturbation of 5 mV in the frequency range of 0.01 Hz to 10 kHz. The EIS data was applied to complex nonlinear least square (CNLS) analyses by the ZSimpWin software to fit the electrode equivalent circuit (EEC) of the reaction interface between the Ru electrode and the slurry.
X-ray photoelectron spectroscopy (XPS) experiments
The surface characteristics and chemical modifications of Ru films were analyzed by X-ray photoelectron spectroscopy (PHI 250Xi, ESCA System). The Ru square samples (10 × 10 mm, cut from Ru blanket wafer) were immersed in a 500 ml solution (without abrasives) for 10 min and then tested. Finally, the surface chemicals of the Ru square sample were analyzed using CASA XPS software.
Surface characterization
Surface roughness and surface quality of Ru films treated with various solutions (without abrasives) for 6 min were measured using Atomic force microscopy (AFM, Agilent 5600LS) and Scanning electron microscopy (SEM, ZEISS SIGMA 500/VP). Three 10 × 10 μm positions were randomly measured on the surface of the Ru square sample (10 × 10 mm, cut from Ru blanket wafer). All experiments were repeated at least three times for each sample and the average value was reported.
Results and Discussion
Effect of UV on Ru removal rate
In the presence of potassium ions, the removal rate of Ru could be increased, which is due to the reduction of the electrostatic repulsion on the surface of silica and Ru. 17 Figure 2 shows the effect of different potassium salts on the removal rate of Ru under the conditions of 0.15 wt% H2O2 and 5 wt% SiO2 at pH = 8.0. From Fig. 2, we can see that under the same potassium ion concentration conditions, the removal rate of Ru in the slurry containing K2S2O8 is almost the same as that of the polishing slurry containing potassium sulfate (K2SO4) or potassium nitrate (KNO3). This may be due to partly K2S2O8 and H2O2 react with each other to cause the self-consumption of the oxidant and reduce the oxidation capacity. 20 The reaction should be as follows.

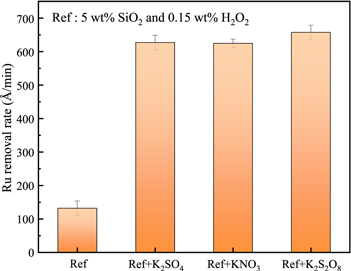
Figure 2. The effect of different potassium salts with the same molar concentration of potassium ions (160 mM K+) on the Ru removal rate.
Download figure:
Standard image High-resolution imageFigure 3 shows the effects of UV and K2S2O8 concentration on Ru removal rate under the condition of 0.15 wt% H2O2 and 5 wt% SiO2 at pH = 8.0. In the absence of UV, the polishing removal rate of Ru increases with the increase of K2S2O8 concentration and reaches the saturation maximum (about 620 Å min−1) at 40 mM K2S2O8. In the presence of UV, the Ru removal rate is increasing from 132 Å min−1 to 786 Å min−1 with the increase of K2S2O8 concentration from 0 mM to 80 mM. In contrast to the absence of UV, when the K2S2O8 concentration is less than 60 mM, the addition of UV will inhibit the Ru removal rate, but exhibit a promoting effect at 80 mM K2S2O8, indicating that UV can promote the activation of K2S2O8 and accelerate the formation of the passivation layer on the Ru surface. From Fig. 4, when only potassium persulfate is contained, there are fewer surface oxides and have the ability of UV to increase Ru removal rate (from 85 Å min−1 to 102 Å min−1). Moreover, when the H2O2 concentration is greater than 0.15 wt%, the removal rate of Ru will decrease, and the removal rate of Ru will further decrease under UV irradiation. The results show that when the concentration of H2O2 is higher than 0.15 wt%, UV has the obvious ability to inhibit the removal rate of Ru.
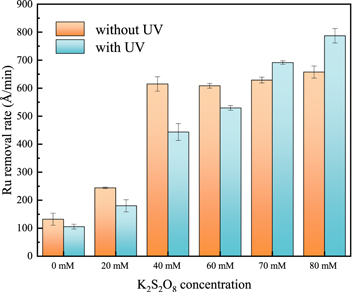
Figure 3. Effects of UV and K2S2O8 concentration on Ru removal rate under the condition of 0.15 wt% H2O2 at pH = 8.0.
Download figure:
Standard image High-resolution image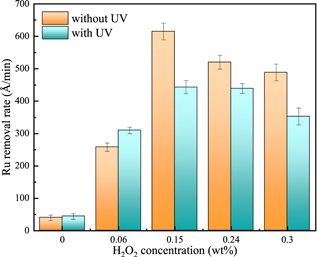
Figure 4. Effects of UV and H2O2 concentration on Ru removal rate under the condition of 40 mM K2S2O8 at pH = 8.0.
Download figure:
Standard image High-resolution imageOpen circuit potential (OCP) and Potentiodynamic polarization curves (Tafel plots)
Figure 5 shows the OCP and Tafel plots of Ru in the solutions which contain various concentrations of K2S2O8 and with and without UV. From Fig. 5a, it can be seen that the OCP increases with the concentration of K2S2O8 in the solution increases. Moreover, without UV, the OCP of 0 mM K2S2O8, 40 mM K2S2O8 and 80 mM K2S2O8 were 0.119 V, 0.168 V and 0.460 V, and they increased to 0.143 V, 0.498 V and 0.508 V, respectively, with UV. This means that the addition of UV can make the solution more likely to generate RuO2/RuO3 oxide layer on the Ru surface. There is an OCP difference of 0.04 V between Only 80 mM K2S2O8 with and without UV, indicating that UV can enhance the activity of the Ru surface. This coincides with the polishing experiment. Similarly, it can be seen from Fig. 5b that the corrosion voltage (Ecorr) also shows a rising trend with the increase of K2S2O8 concentration, and the presence of UV will also increase the corrosion voltage. It is worth noting that under the condition of 40 mM K2S2O8, the Ecorr with UV is 0.33 V higher than that without UV, implying the reactions occurring on Ru surface were strengthened, but their polishing rate is inhibited, which will be explained in the following experiment. The reaction equations (Eq) that may occur during the surface corrosion and CMP of Ru are shown in the below following.


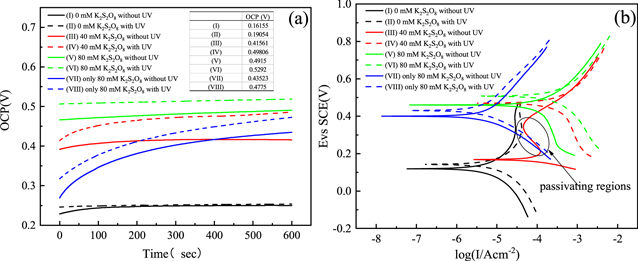
Figure 5. OCP measurements (a) and Potentiodynamic polarization plots (b) of Ru at pH = 8 in different concentration K2S2O8 and with or without UV under the condition of 0.15 wt% H2O2.
Download figure:
Standard image High-resolution imageAfter UV, the corrosion current of only-K2S2O8 (without H2O2) increased by 2.955 μA cm−2, indicating that K2S2O8 was sensitive to UV and produced substances with stronger oxidation ability, as shown in Table III. The reasonable explanation are as follows: persulfate was more stable at normal temperature (25 °C). However, once it is affected by some external conditions such as transition metal ions, light, heat, etc., it will break the oxygen-oxygen single bond (–O–O–), and produce a more oxidizing sulfate radical (SO4 ·−, E0 = 2.5–3.1 V vs NHE). 21,22 Therefore, persulfate (S2O8 2−) could be photochemically (UV used in this paper) activated, this is the Fenton-like method, and the reaction equation should be as follows.

The formation of strong oxidizing SO4 ·− promotes the formation of Ru oxide film, which explains the increase of Ru OCP and Ecorr in the UV-containing solution.
Table III. The parameters of static Tafel curves with different concentration.
| Ru | ||
|---|---|---|
| Solution system (pH = 8.0) | Ecorr(V) | Icorr(μA cm−2) |
| 0 mM K2S2O8 without UV | 0.119 | 1.799 |
| 0 mM K2S2O8 with UV | 0.143 | 2.831 |
| 40 mM K2S2O8 without UV | 0.168 | 23.35 |
| 40 mM K2S2O8 with UV | 0.498 | 77.173 |
| 80 mM K2S2O8 without UV | 0.460 | 32.442 |
| 80 mM K2S2O8 with UV | 0.508 | 68.615 |
| Only 80 mM K2S2O8 without UV | 0.400 | 1.633 |
| Only 80 mM K2S2O8 with UV | 0.431 | 4.588 |
Impedance measurements and circuit models of reactive electrodes
To further understand the Ru surface oxidation mode and the passivation film structures, the Nyquist and Bode plots were used for different k2s2o8 concentrations slurries in 0.15 wt% hydrogen peroxide. Figure 6 shows that the Nyquist impedance plots and corresponding electrode equivalent circuit (EEC). The equivalent circuit fitting is divided into the following parts. In the ultra-high frequency region, the electrolyte transfer can be represented by a slurry resistance (Rs). In the high frequency region, the electrolyte/metal oxide interface to form a semi-circle capacitive loop. This process can be represented by an passivation film resistance (Rpf) and passivation film capacitance (CPEpf). In the intermediate frequency region, a semi-circle capacitive loop related to the charge transfer process, which can be represented by charge transfer resistance (Rct) and double-layer capacitance (CPEdl). In the low-frequency region, an approximately 45-degree line related to the solid diffusion process of ions inside the Ru passivation layer. This process can be represented by Warburg impedance (W) describing diffusion. Therefore, the equivalent circuit should consist of two time constant and a Warburg impedance (W), as shown in Fig. 7, and the EIS fitted parameters is shown in Table II by the Zsimpwim analyzed software. Here, due to the non-uniformity of the surface, the ideal capacitor is replaced by a constant-phase element (CPE). 5,23

where Q is a constant, ω is the angular frequency, j is the imaginary part, the value of n represents the extent of frequency dispersion in the capacitive component of double layer charging (n = 1 for no dispersion). As can be seen from Table IV, under the condition of not containing UV, the Rs, the Rpf and the Rct decreases with the increasing of K2S2O8 concentration, the Warburg impedance is almost negligible. So, the Ru surface is mainly affected by charge transfer at this time, the internal charge transfer speed of Ru increases, the chemical reaction is enhanced. This is consistent with polishing experiments.
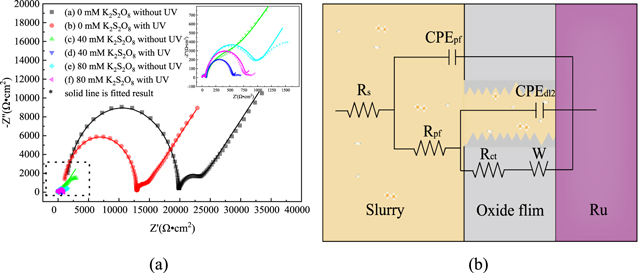
Figure 6. (a) Nyquist plots for Ru in different concentration K2S2O8 and with or without UV under the condition of 0.15 wt% H2O2 at pH = 8.0. (b) electrode equivalent circuit of the impedance spectra in (a).
Download figure:
Standard image High-resolution image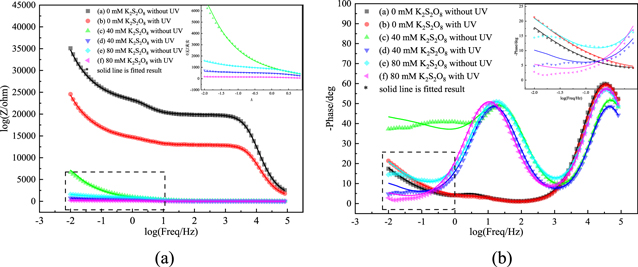
Figure 7. Bode-magnitude graphs (a) and Bode-phase graphs (b) of samples solution in different concentration K2S2O8 and with or without UV under the condition of 0.15 wt% H2O2 at pH = 8.
Download figure:
Standard image High-resolution imageTable IV. EIS fitting parameters using the equivalent circuits shown in Fig. 4.
| Without UV | With UV | |||||
|---|---|---|---|---|---|---|
| 0 Mm (std%) | 40 mM (std%) | 80 mM (std%) | 0 mM (std%) | 40 mM (std%) | 80 mM (std%) | |
| Rs (Ω·cm2) | 1374 (1.30) | 9.571 (8.21) | 4.908 (2.78) | 943.4 (1.09) | 9.002 (4.42) | 4.76 (5.15) |
| CPEpf (10−7Ω−1·cm−2·sn) | 0.0103 (5.14) | 0.714 (2.11) | 3.01 (2.54) | 0.0144 (2.22) | 0.811 (12.21) | 3.001 (11.75) |
| Rpf (Ω·cm2) | 18430 (2.28) | 65.91 (1.89) | 52.28 (0.63) | 11960 (0.20) | 65.15 (1.14) | 52.01 (1.05) |
| CPEdl (10−7Ω−1·cm−2·sn) | 102.3 (2.52) | 1045 (8.87) | 830.5 (1.13) | 160.2 (2.10) | 1342 (2.50) | 1249 (2.79) |
| ndl | 1 | 0.819 (1.79) | 0.843 (0.79) | 1 | 0.895 (0.60) | 0.881 (0.71) |
| Rct (Ω·cm2) | 2932 (0.20) | 515.4 (7.51) | 886 (2.69) | 1212 (8.105) | 447.2 (0.87) | 715.4 (1.03) |
| W (10−4Ω−1·cm−2·s0.5) | 2.685 (0.90) | 10.31 (1.51) | 53.56 (2.18) | 3.211 (0.63) | 459 (6.64) | 386 (14.52) |
Under the condition of containing UV, compared with UV-free conditions, Rs and Rpf are all slightly decreased, it may be that the Ru electrode is partially dissolved in the solution, which reduces the resistivity of the solution. Simultaneously, the Rct of 40 mM K2S2O8 decreased from 515.4 Ω to 447.2 Ω, and the W increased from 10.31 × 10⁻⁴ Ω−1·cm−2·s0.5 to 495 × 10−4 Ω−1·cm−2·s0.5 (the increase is about 48 times); The Rct of 80 mM K2S2O8 decreased from 886 Ω to 715.4 Ω, and the W increased from 53.56 × 10⁻⁴ Ω−1·cm−2·s0.5 to 386 × 10−4 Ω−1·cm−2·s0.5 (the increase is about 7 times). The decrease of Rct can prove that the charge transfer can be accelerated in the presence of UV, and the chemical reaction is enhanced, while the increase of W indicates that the reaction is more affected by diffusion-control. Under the condition of 40 mM K2S2O8, W increases by 48 times, while 80 mM K2S2O8 only increases by 7 times, indicating that the passivation layer under 40 mM K2S2O8 condition is denser. Therefore, it can be explained that the removal rate decreased under the condition of 40 mM K2S2O8 and the removal rate increased under the condition of 80 mM K2S2O8 in the polishing experiment.
Bode diagrams can also be applied to study the corrosion behaviors of slurries. 24,25 Bode Amplitude graph was given in Fig. 7a. Impedance modulus (IM) changes with frequency, and different frequencies represent different interface responses. It can be seen from Fig. 7a, the impedance decreased with the increase of K2S2O8 concentration regardless of any frequency, this indicated that K2S2O8 can effectively reduce the impedance of Ru, which accelerated the corrosion of Ru. Similarly, under the same K2S2O8 concentration, the impedance with UV is smaller than the impedance without UV, indicating that UV can effectively decrease the impedance and increase the corrosion voltage of Ru. Bode-phase graphs was given in Fig. 7b. Two obvious capacitance and resistance loops can be observed, the high-frequency peak shifted to a high phase angle, indicating the increase in impedance.
Mechanism analysis
The XPS technique can be used to analyze the surface chemical changes, 26 when the Ru material is immersed in different solutions. The Fig. 8 shows The XPS Ru (3d, hybridized orbital) spectra of Ru wafers after being immersed in the slurries containing (a) 40 mM K2S2O8 without UV; (b) 40 mM K2S2O8 with UV; (c) 80 mM K2S2O8 without UV; (d) 80 mM K2S2O8 with UV. The binding energy of metal Ru is 280.0 eV and 284.2 eV at 3d5/2 and 3d3/2, respectively. 27,28 It was found that the binding energy of RuO2 was 280.6 eV 29 and 285.0 eV. Since the RuO2·2H2O conductive tape is only partially filled, it is likely that nuclear-hole coupling will occur on the surface. Therefore, RuO3 is considered to be a phase of RuO2·2H2O with a characteristic peak of 282.1 eV. 30 By further calculation of Ru/RuOx (x=2,3) content, shown in Table V. The results showed that in the absence of UV, the concentration of K2S2O8 increased from 40 mM to 80 mM, and the oxide RuOx (x=2,3) on the surface of Ru increased from 42.08% (calculated according to each peak area) to 63.13%, indicating that the addition of K2S2O8 can increase the oxide content on the Ru surface. When UV is present, the content of RuO2 at 40 mM K2S2O8 and 80 mM K2S2O8 increases by 12.72% and 8.61%, respectively. However, RuO3 hardly changed under 40 mM K2S2O8 conditions, and reduced by 5.4% under 80 mM K2S2O8 conditions. This shows that RuO3 hardly reacts under the condition of 40 mM K2S2O8, and UV only promotes the formation of RuO2. The possible reason for this phenomenon is that on the one hand, K2S2O8 and H2O2 react with each other to cause the self-consumption of the oxidant and reduce the oxidation capacity. On the other hand, UV activated K2S2O8 causes the deposition of Ru dioxide on the Ru surface, which consumes most of the K2S2O8, it cannot continue to react with RuO3. Combined with the analysis of the polishing data of 40 mM K2S2O8 in Fig. 3, we reasonably speculate that the Ru surface oxide grows uniformly, which makes the surface RuO2/RuO3 oxide layer denser, the impedance becomes higher, and the removal rate decreases. The reactions should be as follows.

Under the condition of 80 mM K2S2O8, RuO3 will participate in the reaction process and dissolve in the solution, making the surface oxide layer looser and more porous, so the removal rate of Ru is significantly improved under mechanical action. This is in good agreement with the polishing data of 80 mM K2S2O8 in Fig. 3. The possible reactions process should be the following Fenton-like reaction. 31–33
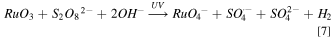
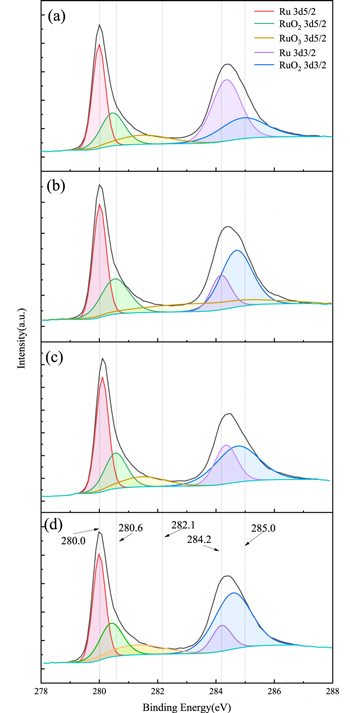
Figure 8. The fitted Ru 3d spectra from the surface of Ru treated for 10 min with a solution at pH = 8.0 containing (a) 40 mM K2S2O8 without UV; (b) 40 mM K2S2O8 with UV; (c) 80 mM K2S2O8 without UV; (d) 80 mM K2S2O8 with UV.
Download figure:
Standard image High-resolution imageTable V. The detailed composition content parameters of the Ru surface in Fig. 7.
| Relative content of Ru oxide species (%) | ||||
|---|---|---|---|---|
| Hybrid orbital | (a) | (b) | (c) | (d) |
| Ru 3d5/2 | 24.87 | 28.36 | 25.24 | 25.44 |
| RuO2 3d5/2 | 14.99 | 15.50 | 16.96 | 15.08 |
| RuO3 3d5/2 | 8.89 | 8.91 | 15.81 | 10.41 |
| Ru 3d3/2 | 33.05 | 16.76 | 11.63 | 9.63 |
| RuO2 3d3/2 | 18.20 | 30.41 | 30.36 | 39.44 |
In order to show the effect of mechanical action more clearly, we characterize the effect of UV under different abrasive particle size conditions, as shown in Fig. 9. The results show that when the particle size increases from 40 nm to 80 nm, under the action of ultraviolet rays, the increase in Ru removal rate increases from 20.59% to 26.36%, indicating that the increase in mechanical action can significantly increase the removal rate. Therefore, at 40 mM K2S2O8, the addition of UV made the Ru removal rate exhibits a suppressed phenomenon due to the rapid generation of a large amount of robust, dense RuO2/RuO3 oxide layer on the surface. The promotion phenomenon under 80 mM K2S2O8 with UV conditions is due to the excessive K2S2O8 that makes RuO3 also participate in the reaction, which makes the Ru surface loose and porous, so it is easier to remove under mechanical action.
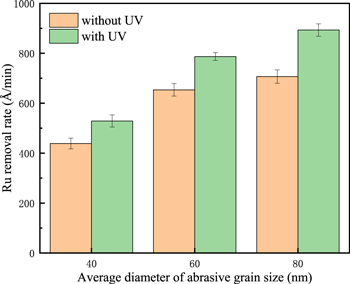
Figure 9. Effects of UV and abrasive particle size on Ru removal rate under the condition of 80 mM K2S2O8 at pH = 8.0.
Download figure:
Standard image High-resolution imageSurface morphology analysis
Figure 10 represents SEM images of the Ru surface after immersion in each condition's solution at pH = 8.0 for 10 min, it can be seen that the surface corrosion is weak in the absence of UV. After adding UV, loose surface of oxidation corrosion could be clearly seen on the surface of Ru, and the corrosion degree of 80 mM K2S2O8 is stronger than 40 mM K2S2O8. Figure 11 represents AFM images of the Ru surface after immersion in each condition under 0.15 wt% H2O2 at pH = 8.0 for 10 min It can be seen from Fig. 11 that the surface roughness (Rq) of Ru decreases from 0.418 nm to 0.340 nm when the 40 mM K2S2O8 solution is irradiated with UV, while the surface roughness of Ru increases from 0.421 nm to 0.533 nm when the 80 mM K2S2O8 solution is irradiated with UV. This is consistent with the previous analysis. A small amount of K2S2O8 makes a dense RuO2/RuO3 oxide film on the Ru surface. However, in the excessive K2S2O8, the Ru surface becomes loose and porous due to the consumption of RuO3. Therefore, the corrosion diagram of Ru surface should be as shown in Fig. 12.
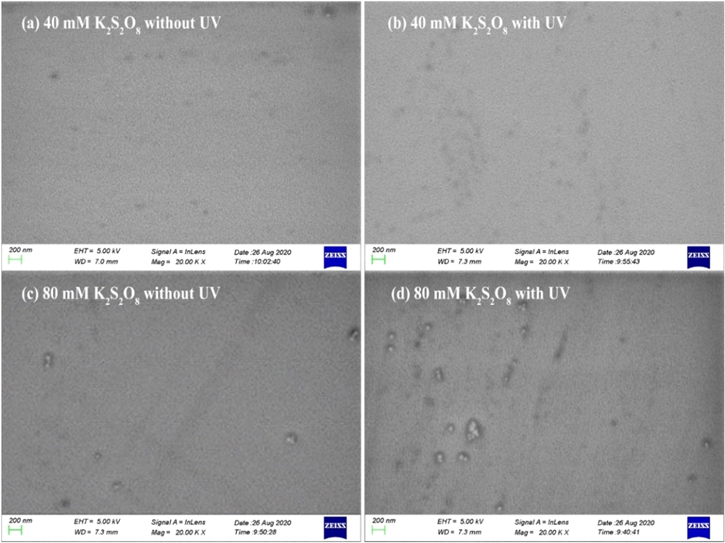
Figure 10. The SEM images of Ru after immersion in different conditions for 10 min: (a)40 mM K2S2O8 without UV; (b) 40 mM K2S2O8 with UV; (c) 80 mM K2S2O8 without UV; (d) 80 mM K2S2O8 with UV.
Download figure:
Standard image High-resolution image
Figure 11. The AFM images of Ru after immersion in different conditions for 10 min: (a)40 mM K2S2O8 without UV; (b) 40 mM K2S2O8 with UV; (c) 80 mM K2S2O8 without UV; (d) 80 mM K2S2O8 with UV.
Download figure:
Standard image High-resolution image
Figure 12. Schematic diagram of Ru surface corrosion in the presence of UV.
Download figure:
Standard image High-resolution image
Conclusions
In this work, the effect of UV-activated potassium persulfate (K2S2O8) on the removal rate of Ru CMP were systematically investigated. The Fenton-like method is applied to the Ru CMP process. The results show that, without UV, the Ru removal rate increases with the increase of K2S2O8 concentration, and tends to be saturated at 40 mM (about 600 Å min−1). Under the condition of UV, the Ru removal rate keeps increasing with the increase of K2S2O8. Compared with the condition without UV, the removal rate is suppressed when the K2S2O8 concentration is less than 60 mM, which is caused by the rapid production of a large number of dense RuO2/RuO3 oxide layers on the surface. At the same time through the particle size experiment and AFM experiment also proved that the removal rate is promoted the removal rate is promoted under 80 mM K2S2O8 conditions, because K2S2O8 will continue to react with RuO3 under the action of UV, making the surface porous, and the removal rate is improved.
Acknowledgments
Financial support of this research work was provided by major National Science and Technology Special Projects (No. 2016ZX02301003-004-007).