
Abstract
This work studies the chemical composition of copper tarnish products formed at 40, 60, and 80% relative humidity (RH) in an uncontaminated environment, for 21 days experimentation at 30°C. The experimental method used was X-ray photoelectron spectroscopy (XPS) in conjunction with  -ion sputtering. The main compounds found were cuprite
  and copper hydroxide
  Differences were observed between 40, 60, and 80% RH. Copper specimens exposed to 40% RH show the thickest tarnish layers, while the thinnest correspond to the 80% RH specimens. The tarnish layer of the copper specimen exposed to 80% RH is constituted mainly by copper hydroxide. For the 40 and 60% RH copper specimens the tarnish layer is a mixture of copper hydroxide and cuprite. © 2000 The Electrochemical Society. All rights reserved.
Export citation and abstract BibTeX RIS
Copper is used in numerous applications, e.g., in the chemical and electronics industries, in heat exchanger systems, in construction for roofing, plumbing, and decorative purposes, and in artistic applications such as chalcographic plates and enamels. Extensive studies have been performed on atmospheric copper corrosion at high humidity in contaminated and uncontaminated environments. However, very little is known about the chemical composition of the tarnish layer that develops during atmospheric copper corrosion at low humidities.
The first step in the atmospheric copper corrosion process is the formation of an oxide film of thickness ∼20 Å, followed by the adsorption of water (usually 5-500 Å) depending on the humidity and temperature.1 2 The corrosion process occurs due to the formation of local anodes and cathodes under the adsorbed electrolyte layer.
Relative humidity (RH) has been considered to be one of the most important parameters of atmospheric copper corrosion since the pioneering work of Vernon,3
4 who reported 60% as the critical relative humidity (CRH) value below which copper corrosion does not take place. On the other hand, Sharma has reported copper corrosion at RH as low as 50%.5 Rice et al. have shown that the functional dependence of corrosion rate (CR) on RH takes the form:  with little evidence for a CRH in a complex environment, and reported copper corrosion at RH down to 35%.6
7 Dante and Kelly and Seo et al. have studied water adsorption on copper as a function of the RH at 30°C using quartz crystal microbalance and ion chromatography measurements.2
8 These authors associated mass gain on the copper surface mainly with humidity, since copper corrosion is limited for the time involved in their experiments, up to 72 h. Eriksson et al. have studied copper corrosion in pure air at 70 and 90% RH for a period of 4 weeks at 22°C.9 These authors reported that metal loss at 70% RH (0.005 mg cm−2) was about half the value obtained at 90% RH (0.012 mg cm−2). Cuprite
with little evidence for a CRH in a complex environment, and reported copper corrosion at RH down to 35%.6
7 Dante and Kelly and Seo et al. have studied water adsorption on copper as a function of the RH at 30°C using quartz crystal microbalance and ion chromatography measurements.2
8 These authors associated mass gain on the copper surface mainly with humidity, since copper corrosion is limited for the time involved in their experiments, up to 72 h. Eriksson et al. have studied copper corrosion in pure air at 70 and 90% RH for a period of 4 weeks at 22°C.9 These authors reported that metal loss at 70% RH (0.005 mg cm−2) was about half the value obtained at 90% RH (0.012 mg cm−2). Cuprite  was identified as the corrosion product for both 70 and 90% RH. Mariaca has reported mass loss of copper exposed to an uncontaminated atmosphere at 50, 70, and 90% RH and at 35°C for 7 days exposure.10 The author reported mass loss values of 2.62, 2.34, and 2.14 μg cm−2 for 50, 70, and 90% RH, respectively.
In general, the above literature shows that there are contradictory results on the influence of RH on copper corrosion. The role played by tarnish films developed on copper surfaces at low relative humidities is also unclear. It is important that the composition of the tarnish layer be known as a function of RH. The X-ray photoelectron spectroscopy (XPS) technique provides structural and chemical information about a corroding copper surface.11 12
The aim of this paper is to discuss the behavior of copper oxide films when exposed to 40, 60, and 80% RH for short time periods. A study was performed to determine the chemical composition and thickness of tarnish films developed in an uncontaminated environment. The film analyses were made using the XPS technique in conjunction with argon ion sputtering.
Experimental
The copper used had the following chemical composition (mass %): 0.009 Sn, <0.001 As, <0.001 Bi, 0.003 Ni, <0.001 Fe, 0.015 Pb, <0.001 Mn, 0.019 P, <0.0005 Ag, <0.001 S, <0.005 C, <0.002 Sb, <0.001 Al, with the balance in Cu. The copper was phosphorus-deoxidized and had a low residual phosphorus content (type Cu-DLP, ISO 1337).
The specimens were mechanically cut from a sheet 1.0 mm thick, and their surfaces were hand polished with different grades of emery paper down to grade 600, degreased with acetone, rubbed energetically with cotton wool soaked in ethanol, dried at room temperature, and tested immediately.
The RH was achieved by placing 350 mL of a saturated aqueous salt solution, according to ASTM E104 Standard, in the bottom of an airtight 2.4 L glass vessel (AGV). A potassium carbonate dihydrate  solution was used for ∼43% RH, a sodium bromide dihydrate
  solution for ∼58% RH, and an ammonium chloride
  solution for ∼78% RH.
The copper specimens were placed on a perforated ceramic grill situated above the saturated aqueous salt solution for humidity control. The temperature was held at  during the experiments by immersing the AGV in a thermostatically controlled water bath. At the end of these experiments, 21 days, the specimens were analyzed using the XPS method in conjunction with
  -ion sputtering.
XPS analysis was performed using a VG Microtech model MT 500 spectrophotometer with an Mg  anode X-ray source
  with a primary beam energy of 15 kV and an electron current of 20 mA. The pressure in the analysis chamber was maintained at
  throughout the measurements. The regions of interest were Cu 2p, O 1s, C 1s, and the
  Auger peak. The instrumentation was calibrated periodically using Ag
  (368.3 eV) and Au
  (84.0 eV) substrates. The spectra were integrated for 20 scans. The XPS spectra were analyzed by a least squares fit in order to obtain more information about the chemical states. The peaks were fitted using a Gaussian-Lorentzian mixed function.
XPS in conjunction with  -ion sputtering was used to characterize the approximate element composition of the surface as a function of depth. Successive sputtering was carried out up to 17 min with a primary beam energy of 5 kV and an ion intensity of 10 mA. The sputtering rate was obtained by ion etching of a tantalum specimen covered by a
  layer of known thickness. An etching rate of 5 Å min−1 was obtained, which corresponds approximately to 15 Å min−1 on a copper specimen.13
In order to obtain accurate binding energies (BE) for the fitting of the experimental data, a standard copper hydroxide  has been analyzed. This copper hydroxide was prepared by adding 5 mL of a 5 M NaOH solution to 125 mL of a 0.1 M
  solution. The blue copper hydroxide precipitate was filtered, washed with distilled water, and dried at room temperature.14 The powdered hydroxide was pressed onto a double-sided adhesive tape and analyzed using the XPS method, in the same experimental conditions as the tested specimens. In order to study the stability of copper hydroxide in
  -ion sputtering, a 5 min bombardment was performed on the specimen and the XPS analysis repeated afterward.
Figures 1
2
3 show the high resolution XPS spectra corresponding to the Cu  O 1s, and Cu
  Auger regions, respectively, obtained from the standard copper hydroxide
  without sputtering (original) and after 5 min of
  -ion sputtering. The C 1s signal from the adventitious carbon (284.6 eV) was used for energy referencing. The Cu
  spectra shows a main peak at 934.2 eV BE and a smaller one at 932.5 eV, plus the two satellites at higher BEs characteristic of Cu(II) species. The peak at 934.2 eV corresponds to the emission from the copper hydroxide, while the peak located at 932,5 eV BE is attributable to cuprite
  arising from the reduction of the copper hydroxide by X-rays.14
15 These two peaks have their correspondence in the O 1s spectra, in the peaks at 531.3 eV [for
arising from the reduction of the copper hydroxide by X-rays.14
15 These two peaks have their correspondence in the O 1s spectra, in the peaks at 531.3 eV [for  ] and at 529.7 eV (for
  ). The peak located at 533 eV BE is attributable to adsorbed water. The Auger line shows a broad peak at ∼337 eV BE. After
  -ion sputtering, the main feature is a dramatic increase in the cuprite components of the spectra, with the corresponding decrease in the copper hydroxide lines. These results indicate that copper hydroxide is not stable to
  -ion bombardment, decomposing to cuprite.
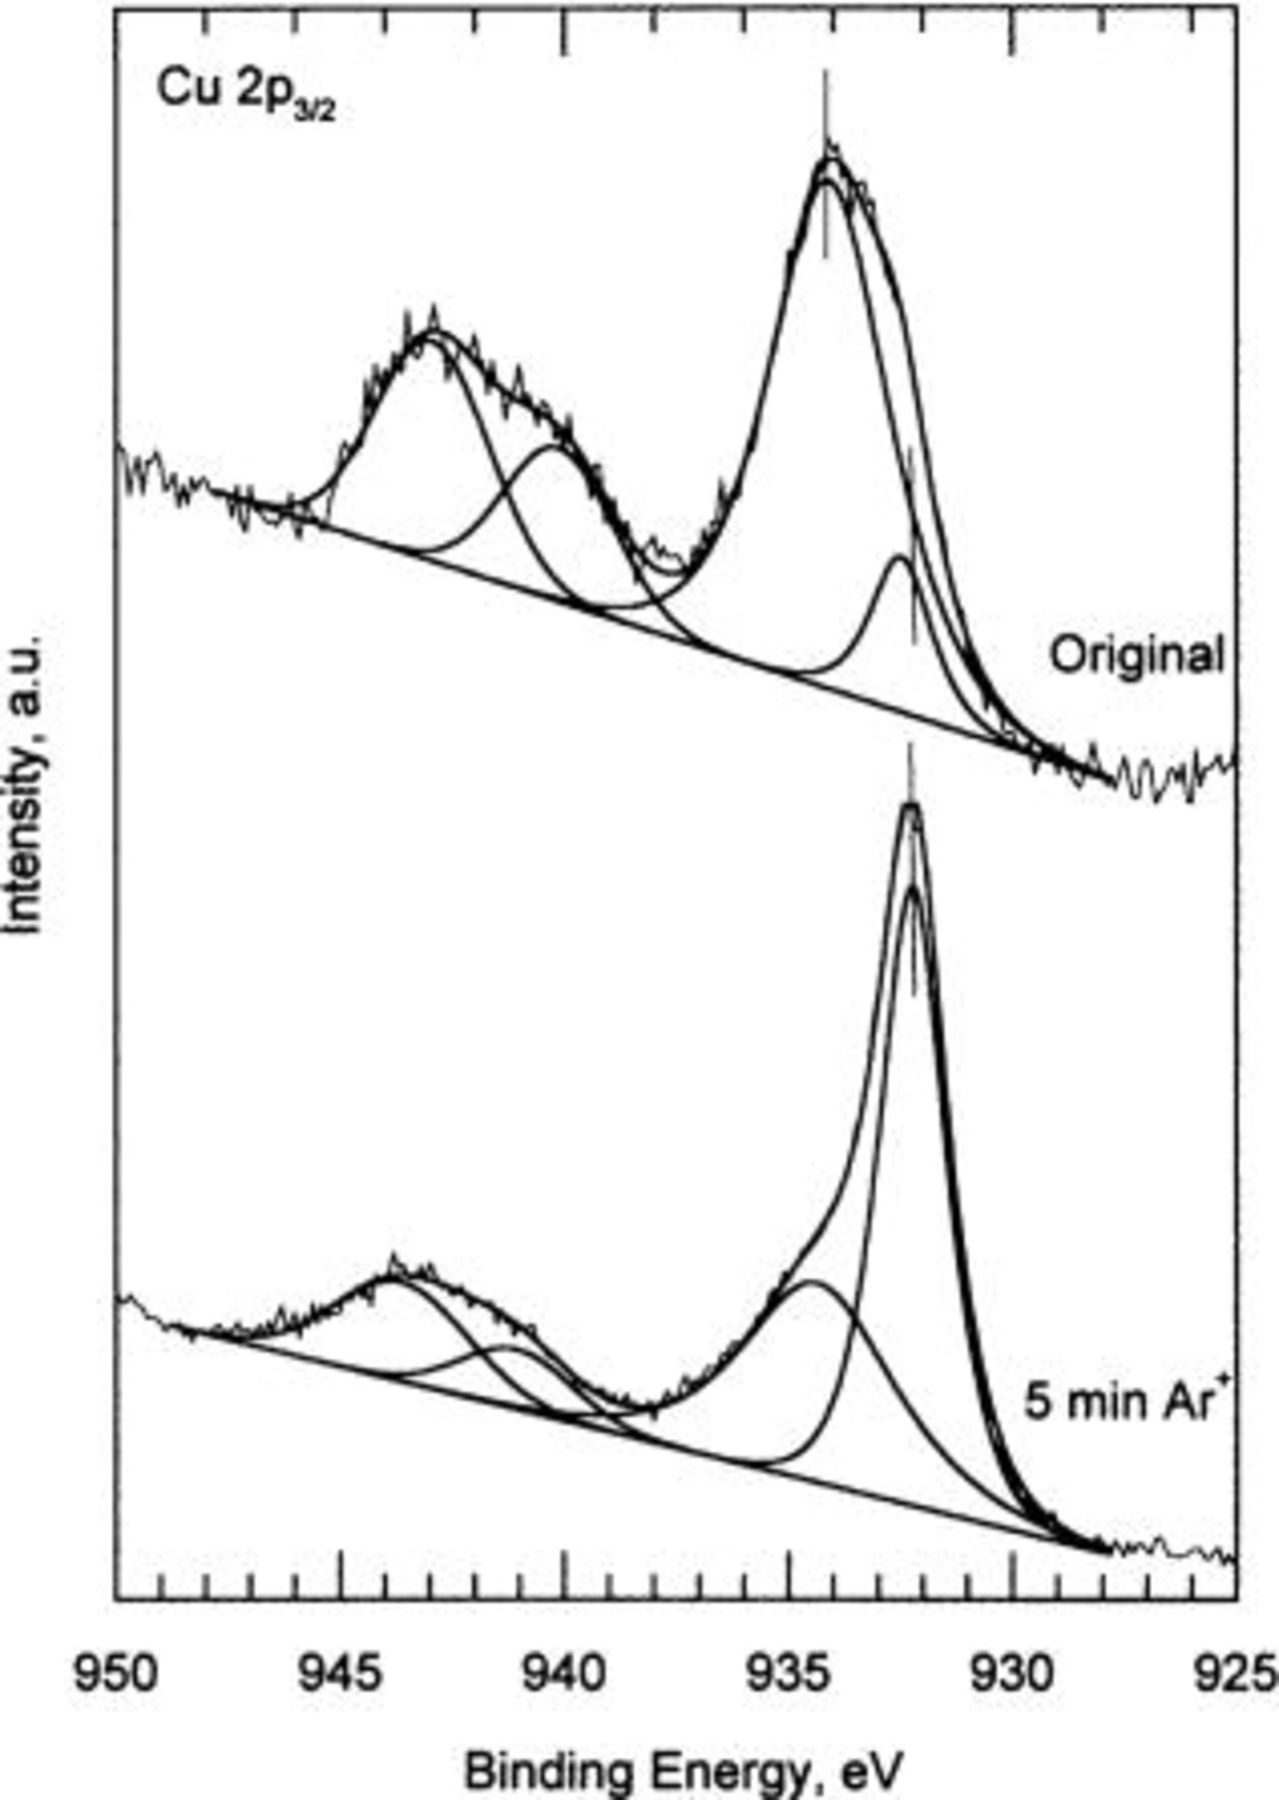
Figure 1. Cu 2p spectrum for standard copper hydroxide 
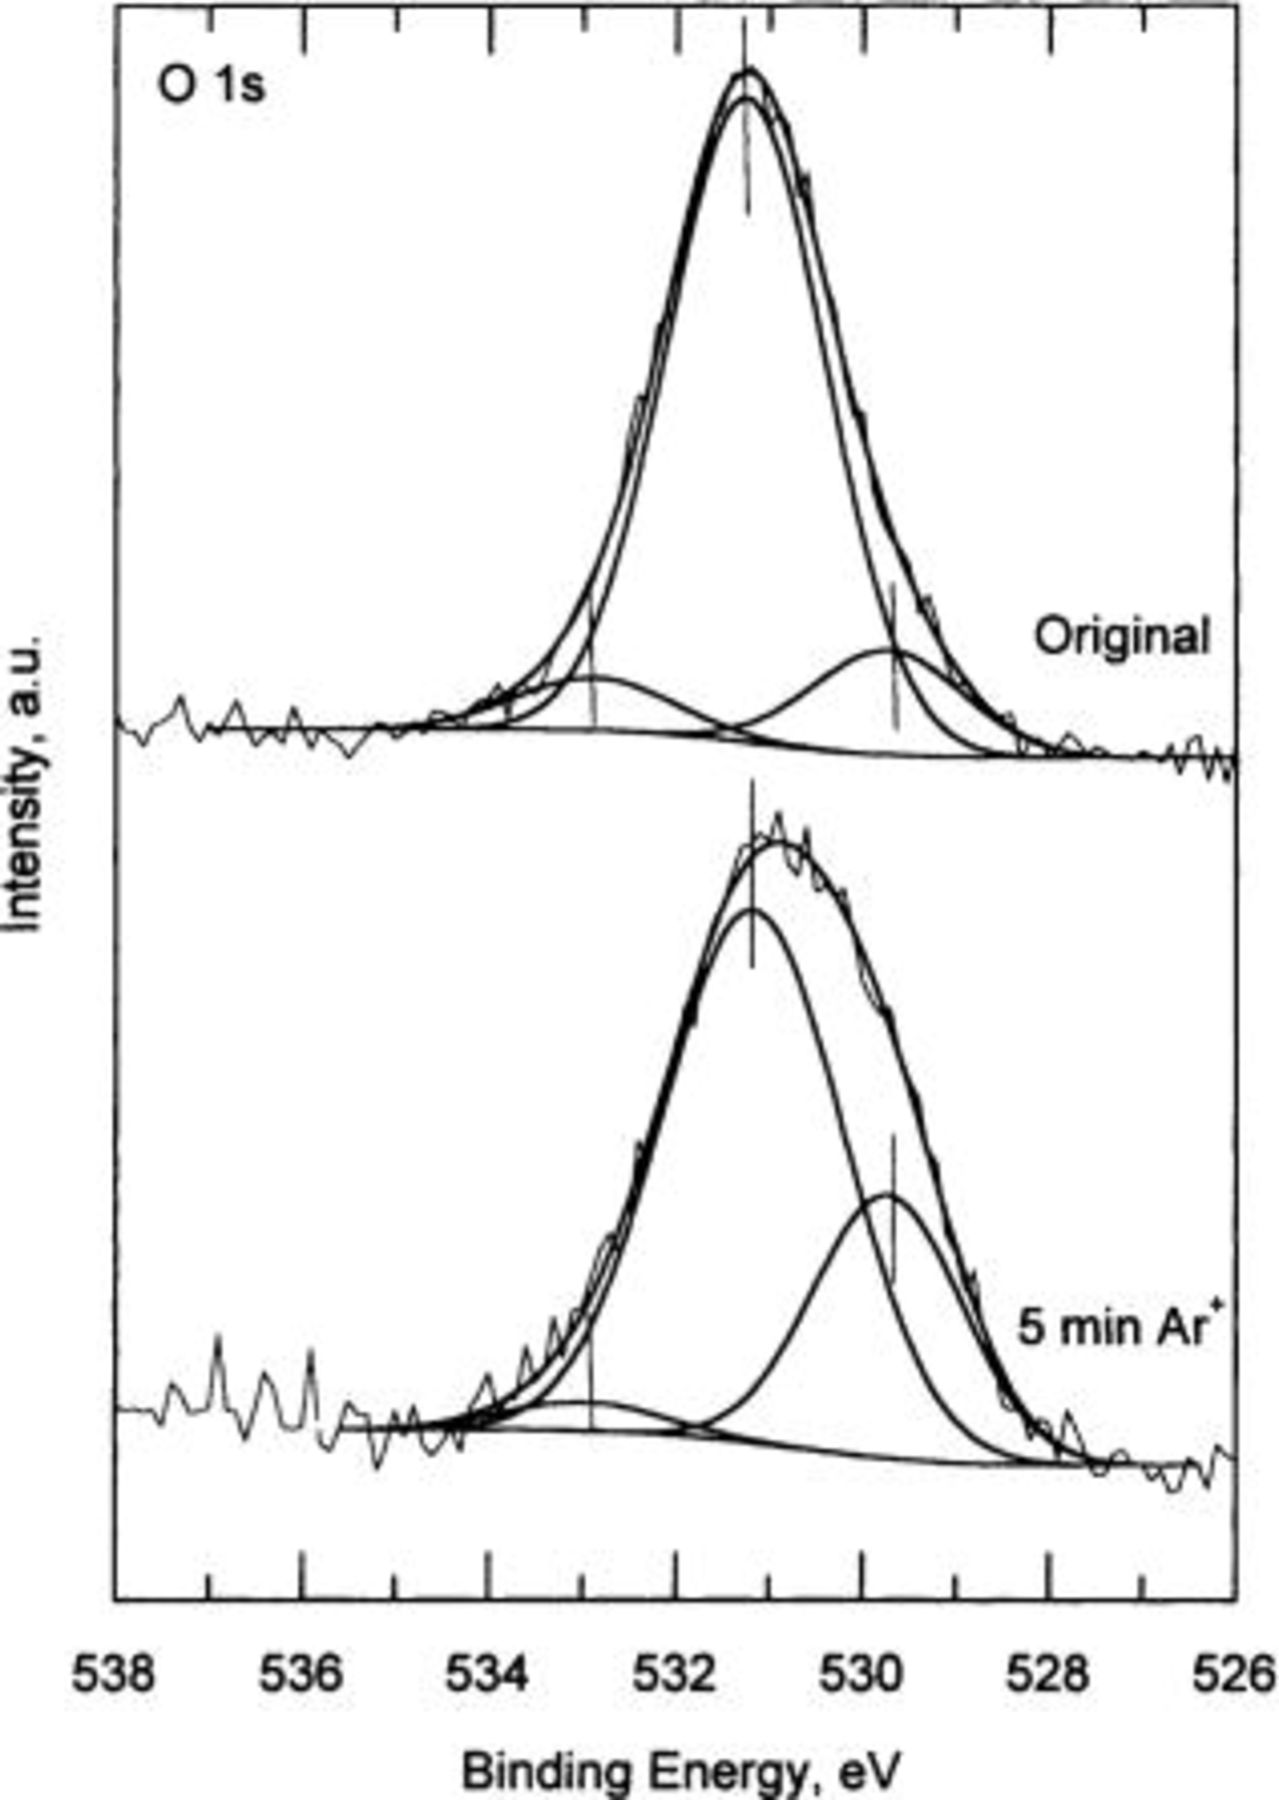
Figure 2. O 1s spectrum for standard copper hydroxide 
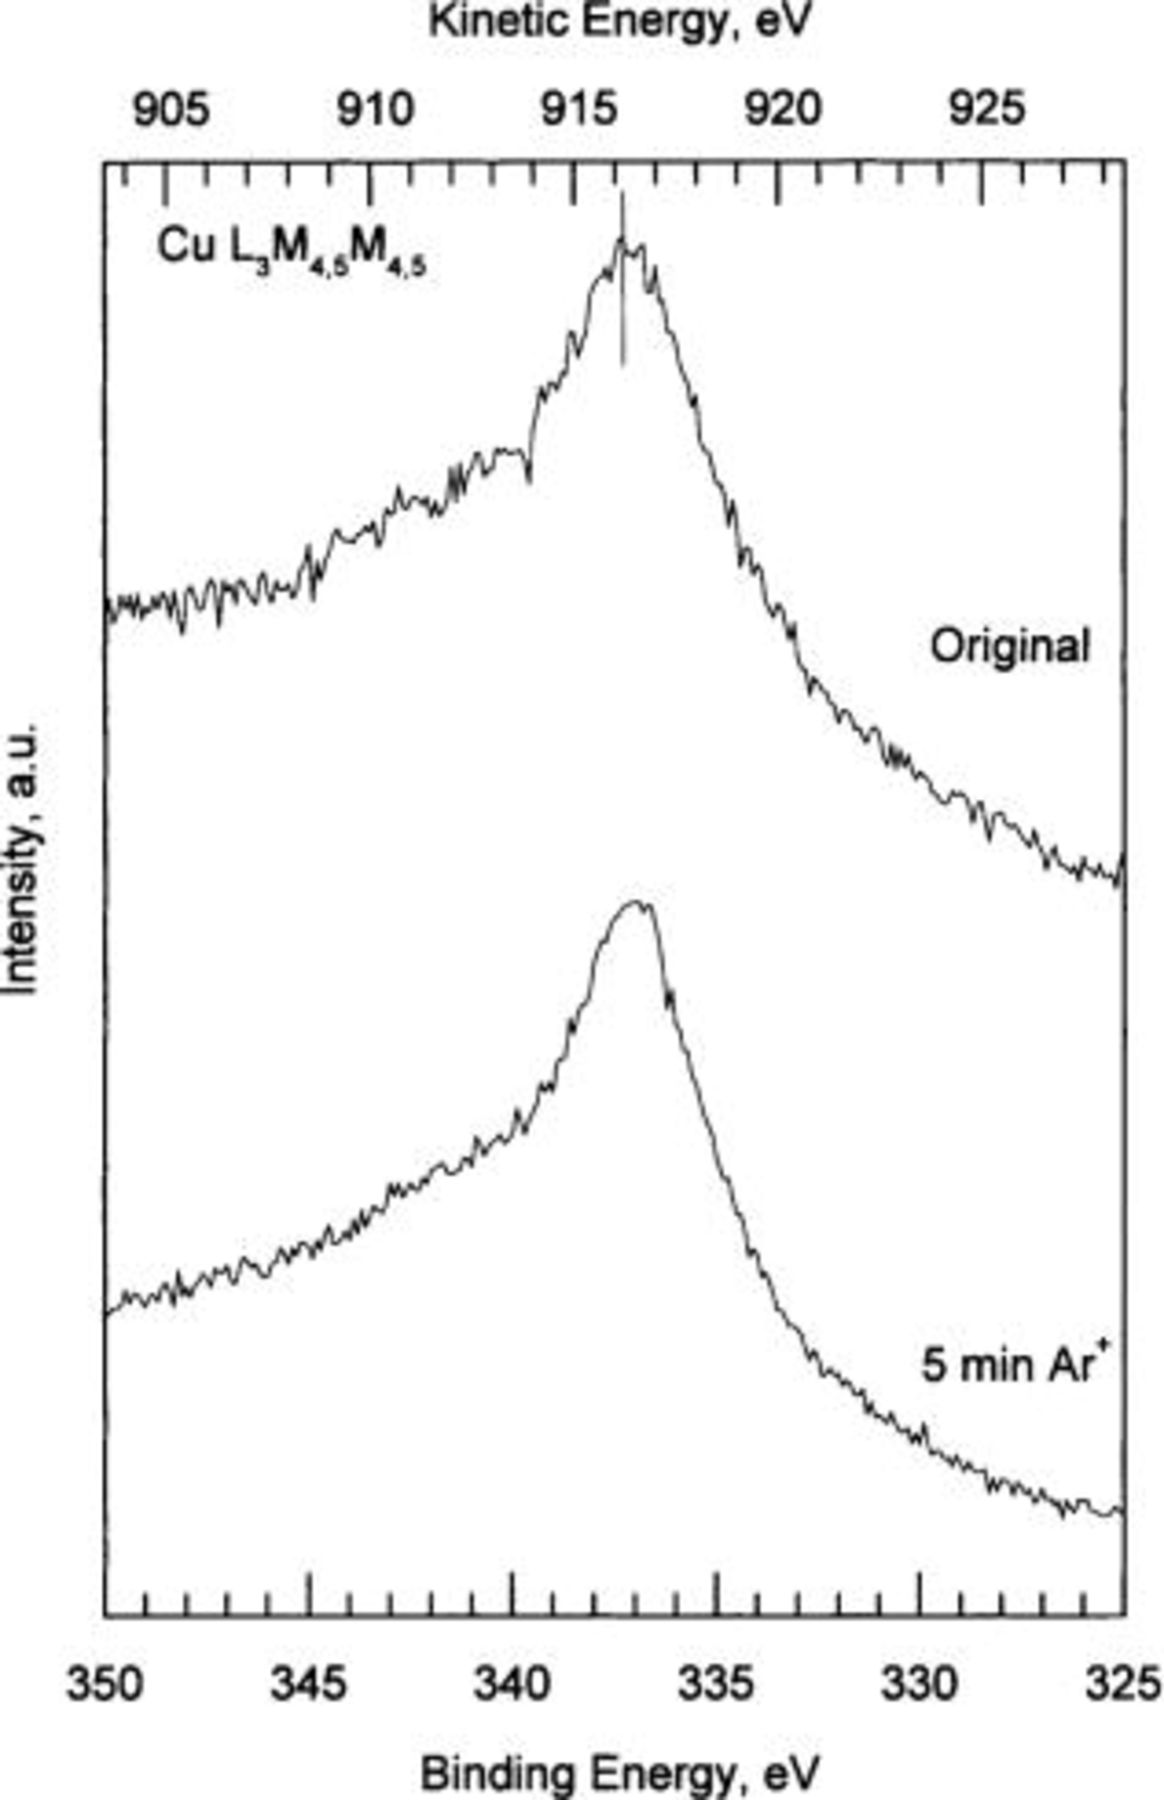
Figure 3. Cu  Auger spectrum for standard copper hydroxide
Results and Discussion
General XPS spectra over a wide BE region for copper specimens exposed to 40, 60, and 80% RH showed C and O peaks in addition to those corresponding to the different copper compounds. To avoid a very extensive manuscript, and as an example, only the spectra for copper specimens exposed to 80% RH, without sputtering (original) and after 7 min of argon sputtering, are shown.
Figure 4 shows the Cu  core-level emission corresponding to a copper specimen exposed to 80% RH, without sputtering (original) and after 7 min of
  -ion sputtering. The spectrum of the original specimen exhibits the characteristic shake-up satellites of compounds containing Cu(II) at high BE (∼940.3 and ∼943.3 eV). For this spectrum, with a clear presence of Cu(II), the prominent shake-up satellites give rise to a rather large Shirley background. Therefore, in order to perform a good analysis a linear background was applied.14 Following the least squares fit analysis two subspectra were obtained: the subspectrum located at ∼932.4 eV BE corresponds to cuprite and/or to metallic copper (Cu°), and the subspectrum at ∼934.3 eV BE represents the copper hydroxide emission. For the 80% RH sample after 7 min of
  -ion the spectrum shows a main narrow line located at ∼932.15 eV, corresponding to cuprite and/or metallic copper, and a small wide peak at ∼934.3 eV BE, which represents the copper hydroxide emission. For evaluation of the contribution of copper species by XPS analysis it is important to mention that both metallic copper and cuprite appear at a very similar BE. In order to distinguish between both components, it is necessary to look at the photon excited Cu
  Auger peak.
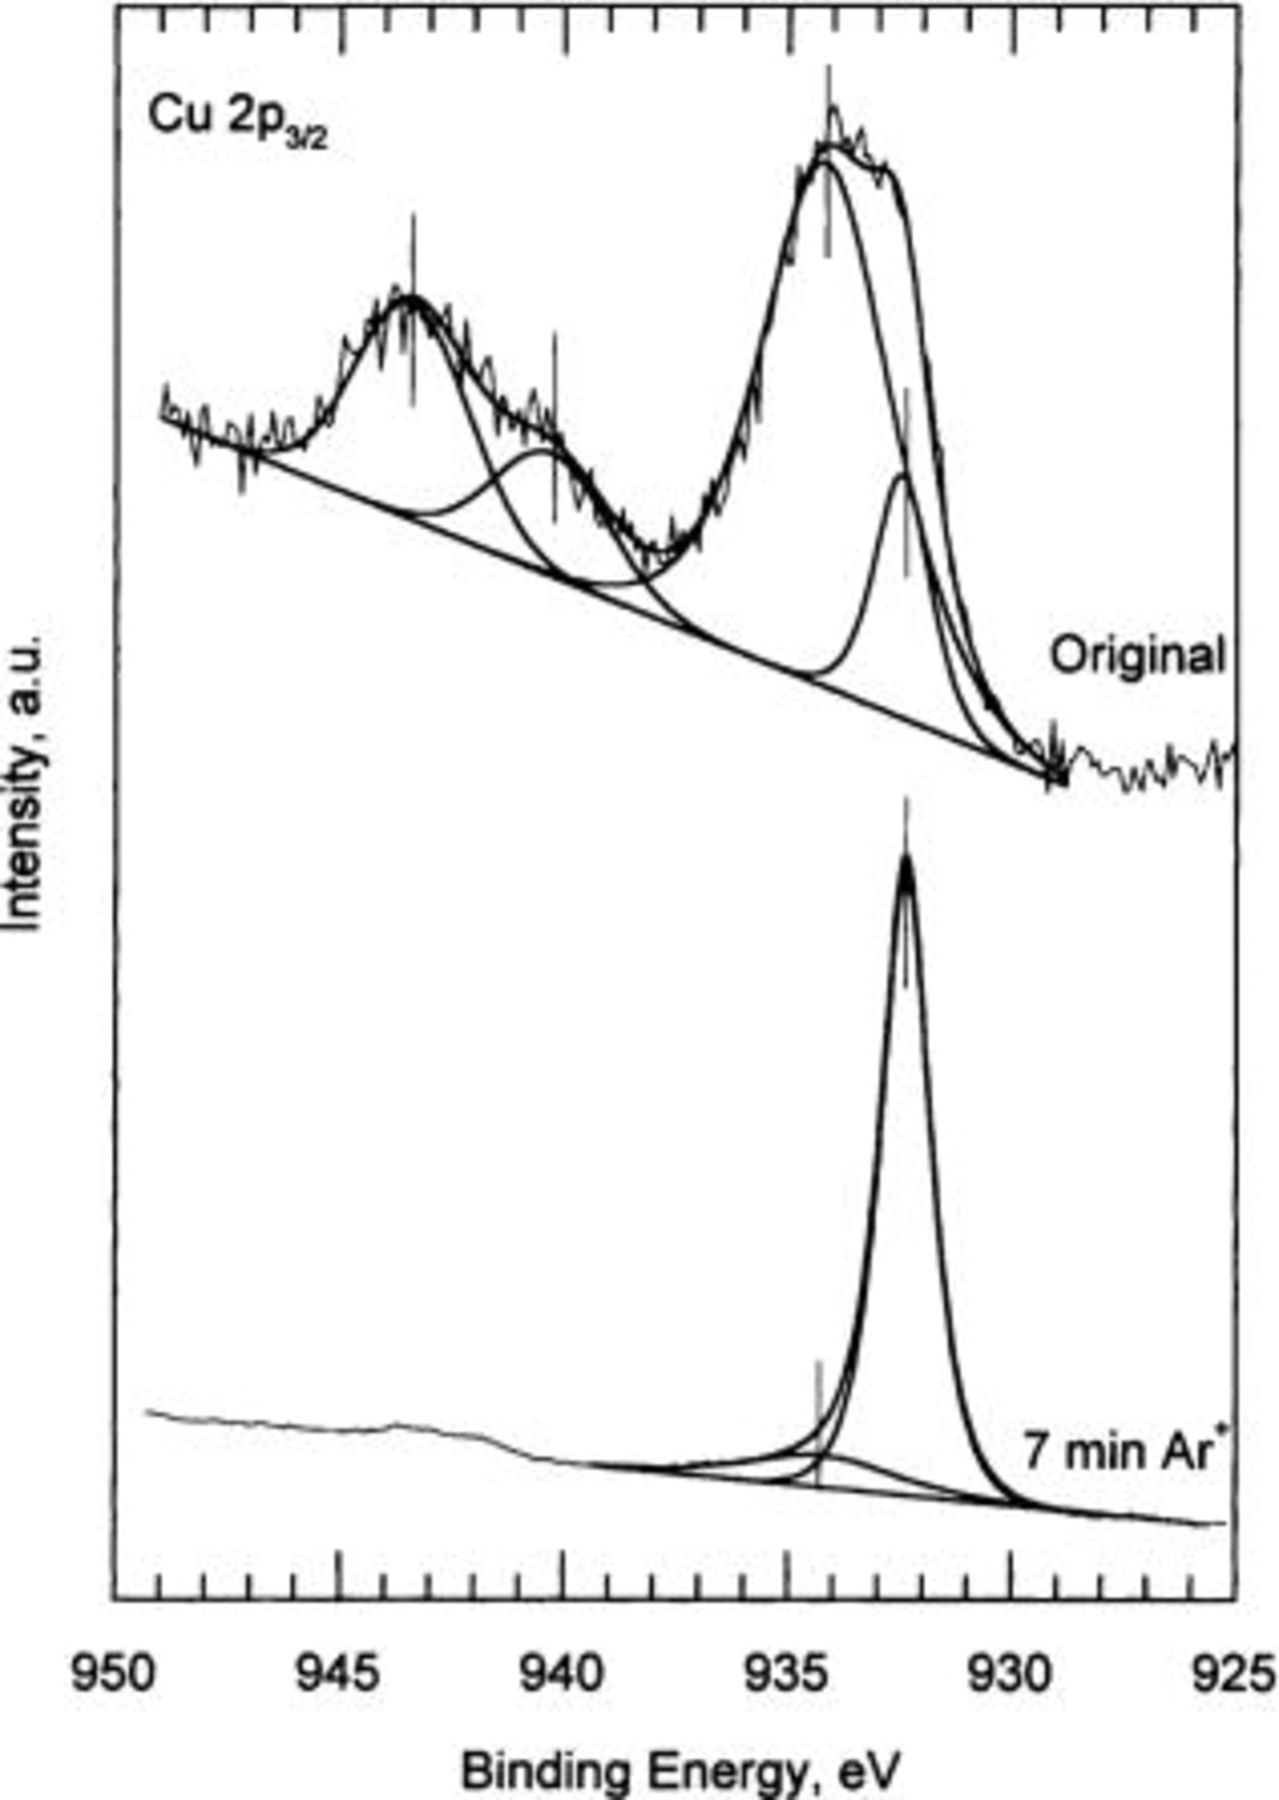
Figure 4. High resolution Cu  XPS spectra. Original: copper specimen exposed to 80% RH for 21 days. 7 min: copper specimen after 7 min
  -ion sputtering.
Figure 5 shows the Cu  Auger peak obtained from a copper specimen exposed to 80% RH, without sputtering (original) and after 7 min of
  -ion sputtering. The narrow intense peak located at ∼335 eV BE (∼918.6 eV kinetic energy) corresponds to metallic copper and is clearly observed for the sputtered specimen. However, the broad feature found in the original specimen, with a maximum at ∼337 eV BE, is typical of a surface formed mainly by copper hydroxide or by cuprite, indicating that there is no metallic copper in this specimen. The Cu
  Auger peak should be located at ∼337 eV BE for copper hydroxide and at (336.5 eV BE for cuprite. Due to the closeness of the two signals, the Auger peak does not distinguish well between the
  and
and  compounds. Therefore, in order to quantitatively determine the contributions of the different compounds forming the tarnish layer it is necessary to analyze the O 1s XPS spectra.
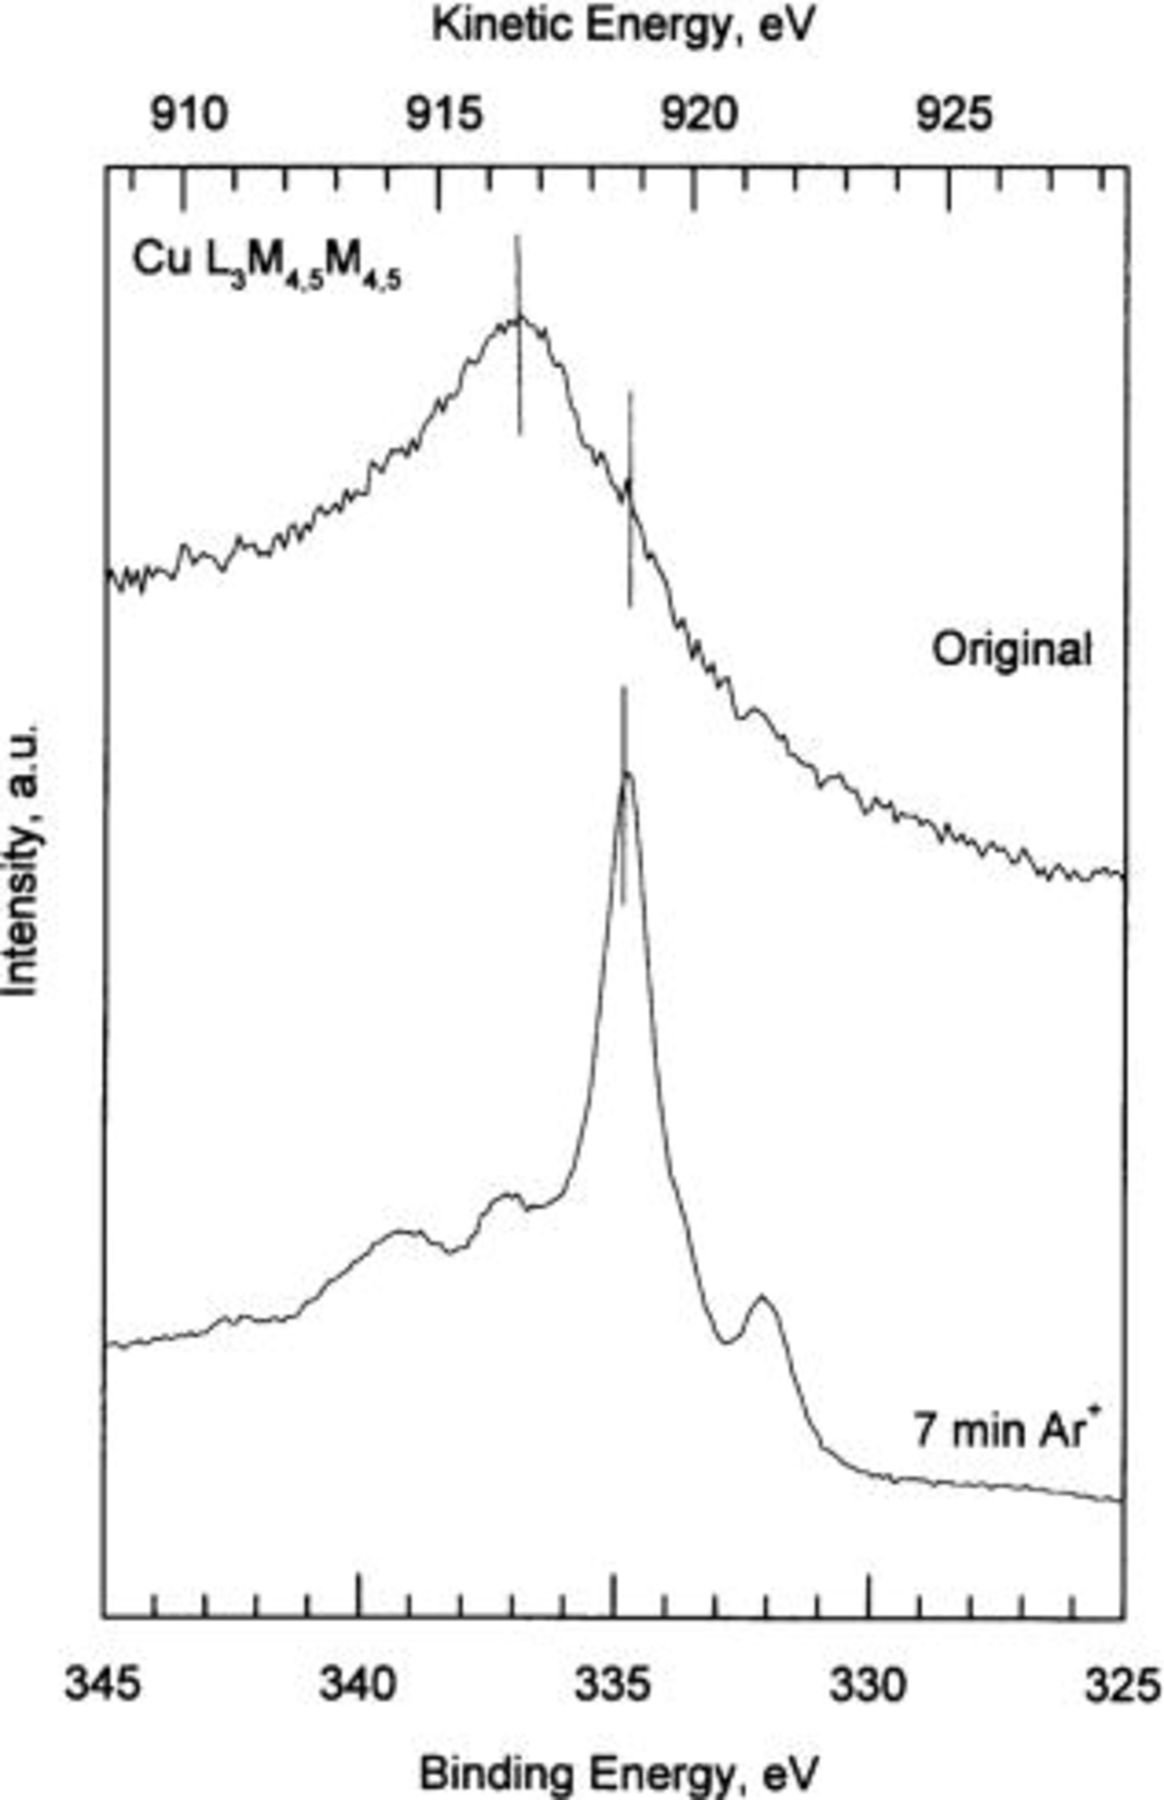
Figure 5. High resolution Cu  Auger spectra. Original: copper specimen exposed to 80% RH for 21 days. 7 min: copper specimen after 7 min
  -ion sputtering.
Figure 6 shows the O 1s emission corresponding to a copper specimen exposed to 80% RH, without sputtering (original) and after 7 min of  -ion sputtering. The subspectrum located at ∼530.1 eV BE represents the cuprite emission, the line defined at 531.3 eV BE corresponds to copper hydroxide, and finally the signal at 532.5 eV BE is the contribution of water. The presence of chemically bonded water is typical of original specimen, without sputtering. However, the copper specimens after 7 min of sputtering do not show any water emission due to the effect of the sputtering process.
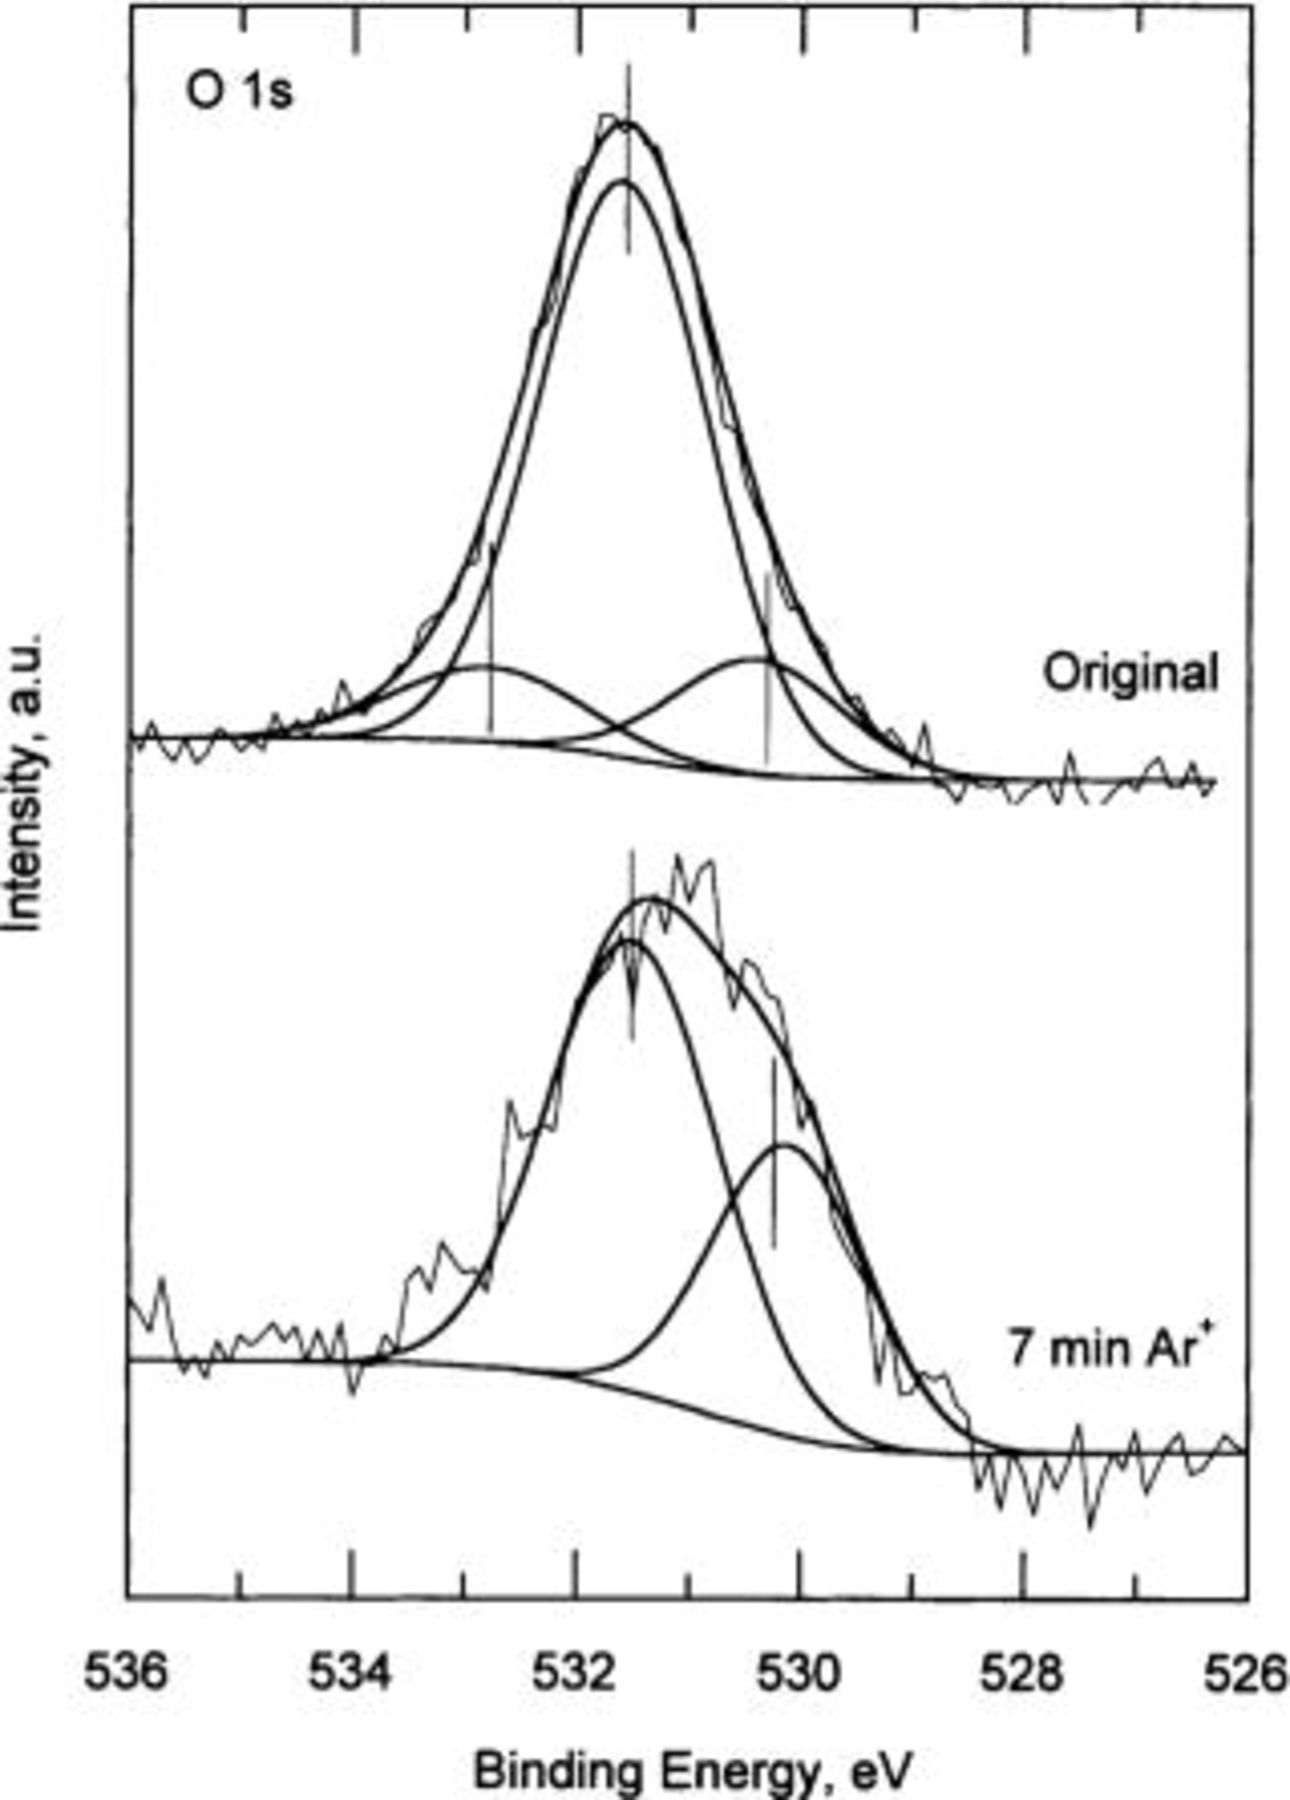
Figure 6. High resolution O 1s XPS spectra. Original: copper specimen exposed to 80% RH for 21 days. 7 min: copper specimen after 7 min  -ion sputtering.
It is important to quantitatively determine the contribution of each copper compound to the composition of the tarnish layer. Therefore, the areas of the different Cu and O emissions were calculated and the corresponding sensitivity factors for these elements were utilized.16 This method was applied to all the copper specimens tested at 40, 60, and 80% RH.
Figure 7 exhibits the behavior of the percentage of cuprite, copper hydroxide, and metallic copper as a function of the sputtering time. Figure 7a shows copper specimens exposed to 40% RH, Fig. 7b shows copper specimens at 60% RH, and Fig. 7c shows copper specimens exposed to 80% RH. Similar behavior can be observed in Fig. 7 for the three RHs tested. As expected, metallic copper emission is not observed for the case of the original specimens. All the specimens show a pronounced decrease in copper hydroxide at first, for 30 s sputtering time, which subsequently becomes more gradual. This decrease contrasts directly with the effect observed for the cuprite signal, in which an abrupt increase occurs for the same sputtering time (30 s). These effects may be related with the removal of the outer layer of copper hydroxide, but also with the reduction of cupric hydroxide during X-ray treatment and the sputtering process.15 Copper hydroxide is less stable and leads to the formation of cuprite on the surface. This process can explain the significant decrease in copper hydroxide and the increase in cuprite which occurs at first.
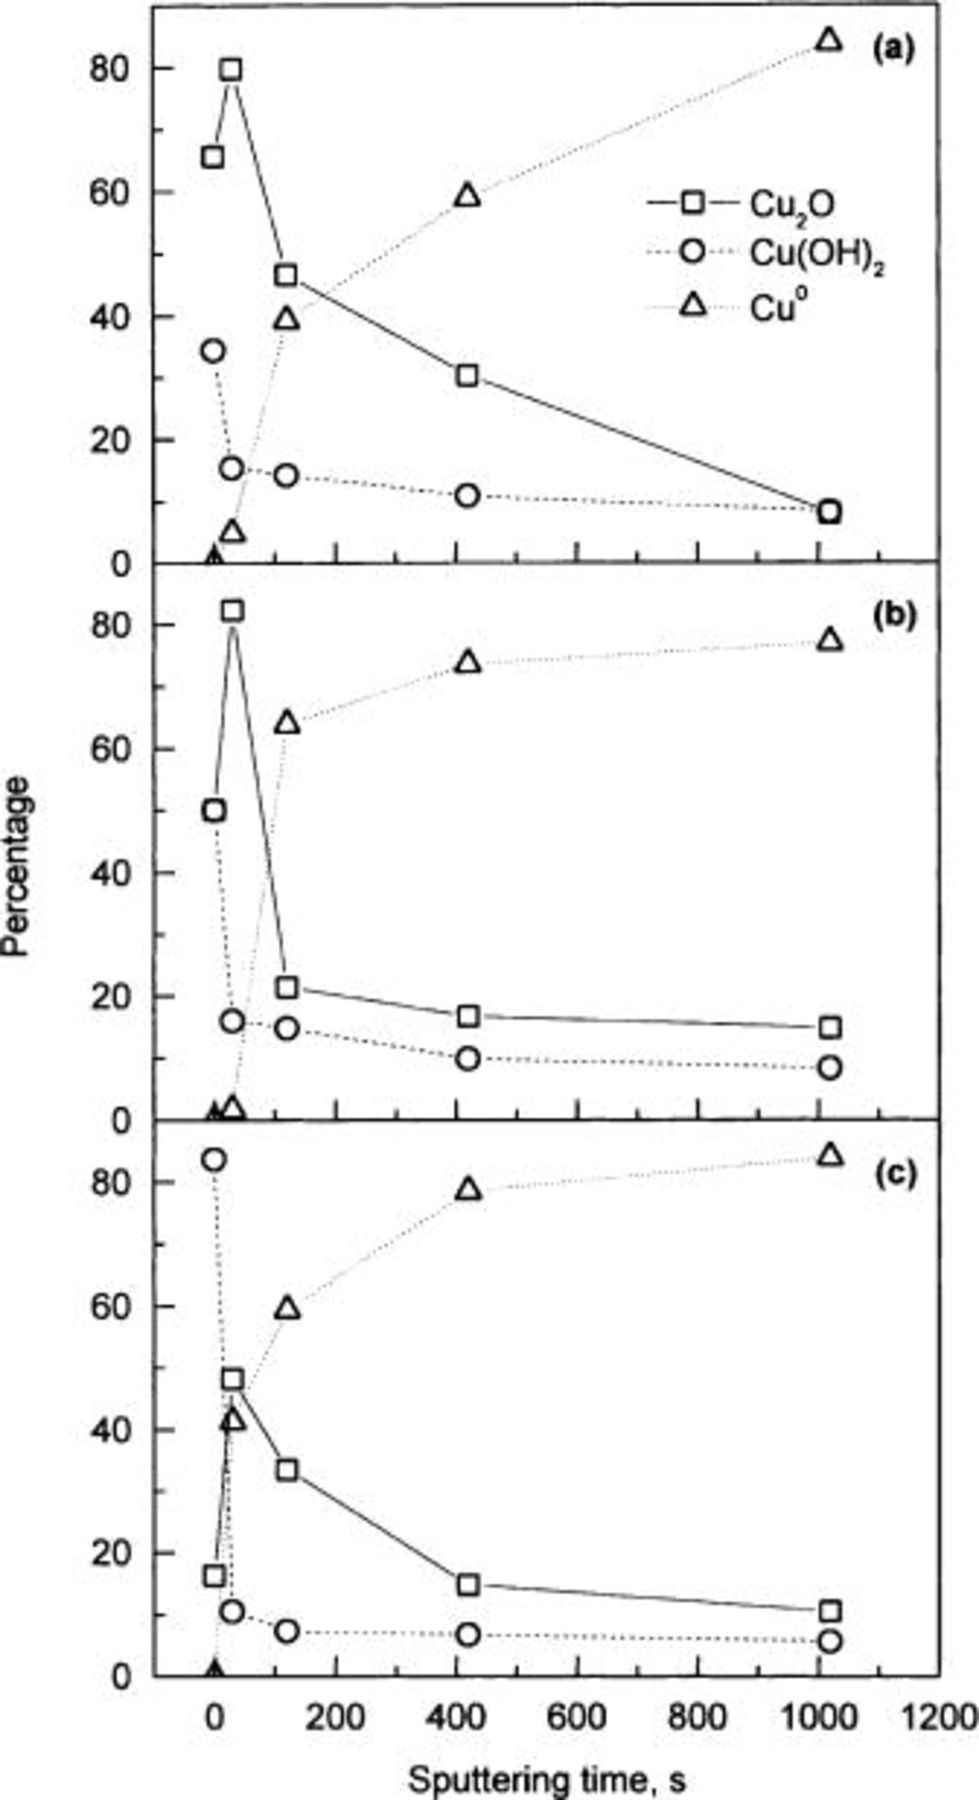
Figure 7. Percentage of cuprite  copper hydroxide
  and metallic copper
  against sputtering time for the copper specimens exposed to 40, 60, and 80% RH for 21 days experimentation.
At the initial stage, the main difference between 40, 60, and 80% RH is the amount of copper hydroxide and cuprite present in the outer tarnish layer. At the highest RH tested, the hydroxide is the main component of the tarnish (84% copper hydroxide and 16% cuprite). At 60% RH the amount of both components is the same (50% hydroxide and 50% cuprite), and at 40% RH cuprite is the main component of the tarnish layer (34% copper hydroxide and 66% cuprite).
After short sputtering times, some other differences can be observed. In the case of 40 and 60% RH the amount of metallic copper increases suddenly for 2 min of sputtering. For the specimens exposed to 80% RH, this enhancement is observed at shorter sputtering times, 30 s. This result suggests a thinner passive layer formed on the copper specimens exposed to 80% RH compared with the specimens exposed to 40 and 60% RH. The results corresponding to 40% RH specimens (Fig. 7a) show that a longer sputtering time is required to remove the cuprite layer, indicating that the passive layer is thicker than these on specimens exposed to higher humidity (60 and 80% RH). These results are in agreement with previous studies reported in the literature on the copper corrosion rate at different RH values, in which the corrosion attack seems to be lower for higher RH.10
Figure 7 indicates that the thickest tarnish film is formed on the copper specimens exposed to 40% RH. An approximate estimation of the tarnish layer thickness can be made by taking into account the etching rate on copper (∼15 Å min−1). After 17 min of sputtering both the cuprite and the copper hydroxide signals reach a minimum value, and thus a tentative tarnish layer thickness of ∼170 Å can be estimated. The surface roughness parameter may explain why neither copper hydroxide nor cuprite signals reach a zero value (Fig. 7), as some small amount of copper hydroxide and cuprite may remain intact in the valleys (or deeper regions) of the surface after the  -ion sputtering process. For the copper specimens exposed to 60 and 80% RH, low percentages of cuprite and copper hydroxide and high percentages of metallic copper are obtained after less than 17 min sputtering time. These values change only slightly when the sputtering time increases. Consequently, it can be concluded that the thickness of the tarnish layer on copper specimens exposed to 60 and 80% RH is smaller than on copper specimens exposed to 40% RH.
The porous nature of cuprite is known.6 Thus copper ions can diffuse from the copper surface to the outer corrosion product layer through faults and/or pores in the cuprite. However, the stratified mixed structure of the tarnish formed on the copper surface,17 18 19 20 21 22 consisting of an inner cuprite film and an outer copper hydroxide film (Fig. 7), yields a more compact and adherent layer which obstructs the diffusion of copper ions. Consequently, the corrosion rate of copper specimens exposed to 80% RH, with a higher copper hydroxide content than copper specimens exposed to 40 and 60% RH, may be lower.
Conclusions
XPS results show that the tarnish film formed on copper specimens exposed to 40, 60, and 80% RH for 21 days experimentation is mainly cuprite  covered by a thin layer of copper hydroxide
  The copper hydroxide percentage is highest for 80% RH specimens, lower for 60% RH, and reaches its minimum value for the 40% RH specimens. The thinnest tarnish layer is formed on the 80% RH copper specimens and is mainly composed by copper hydroxide, conferring high protection to the base material. For the lowest RH (40%) specimens the tarnish layer is a mixture of copper hydroxide and cuprite which provides low protection, and therefore the corrosive attack is deeper and the tarnish layer thicker than in the previous case (80% RH).
Acknowledgments
The authors express their gratitude to the Regional Government of Madrid, Spain, for financial support under Project 07N/0043/1999. E.C. expresses his gratitude to the Spanish Ministry of Education and Culture for the scholarship granted to him.
Centro Nacional de Investigaciones Métalurgicas assisted in meeting the publication costs of this article.