
Abstract
The electrochemistry of tin at polycrystalline tungsten and at glassy carbon (GC) electrodes was investigated in acidic and basic zinc chloride-1-ethyl-3-methyl-imidazolium chloride  ionic liquids at 90°C. The electrodissolution of Sn produces a Sn(II) solution, which can be either oxidized to Sn(IV) or reduced to Sn metal. The formal potentials of the Sn(II)/Sn(0) couple in the 40.0-60.0 and 25.0-75.0 mol % ionic liquids are 0.25 and
  respectively, vs. Zn(II)/Zn in a 50.0-50.0 mol % ionic liquid. The formal potentials of the Sn(IV)/Sn(II) couple in the 40.0-60.0 and 25.0-75.0 mol % ionic liquids are 0.78 and 0.29 V, respectively. The electrodeposition of Sn from Sn(II) at both electrodes is complicated by nucleation. Experimental current-time transients recorded at these electrodes are in good agreement with the theoretical model based on 3D nucleation. Sampled-current voltammograms constructed from chronoamperometric experiments indicated that the reduction of Sn(II) to Sn metal in the acidic ionic liquid is hindered by the adsorption of Sn(II) at tungsten, nickel, and GC electrodes. In the acidic ionic liquid, the adsorption of Sn(II) also hindered the voltammetric oxidation of Sn(II) to Sn(IV) at the tungsten electrode but not at the GC electrode. In the basic ionic liquid, however, the adsorption of Sn(II) at these electrodes is not observed. When the deposition potential was extended to the range where Zn(II) reduction occurred, coatings of Sn-Zn codeposits could be obtained. The Sn-Zn codeposits consist of a two-phase mixture of Sn and Zn. The effects of deposition potential and Sn(II) concentration on the Sn-Zn codeposits composition were investigated. © 2003 The Electrochemical Society. All rights reserved.
Export citation and abstract BibTeX RIS
Ambient-temperature ionic liquids (or molten salts) formed by combining dialkylimidazolium cation and aluminum halide anions1 have attracted enormous attention as the electrolyte for a wide variety of chemical and electrochemical applications including electrodeposition, batteries, and catalysis.2 However, the chloroaluminate ionic liquids have the disadvantage of being highly reactive with water and air to produce corrosive HCl. This property of chloroaluminate means that they must be handled in a water-excluded atmosphere. To avoid such problems, various water- and air-stable ambient-temperature ionic liquids have been developed by substituting the tetrachloroaluminate chloride anion with water-stable anions such as tetrafluoroborate  and hexafluorophosphate
  3
4 These water-stable ionic liquids are considered green solvents and have found wide application as reaction media for synthesis and for energy conversion.3
4 Examples of electrodeposition studies using the water-stable ionic liquids have also appeared in the literature.5
6 Recently, low-temperature dialkylimidazolium chlorozincate ionic liquids resulting from the combination of zinc chloride and 1-ethyl-3-methylimidazolium chloride (EMIC) have been prepared for the electrodeposition of zinc and zinc-containing alloys.7
8
9
10
11 These studies revealed that complications associated with hydrogen evolution that often occur in aqueous bath are eliminated in the chlorozincate ionic liquids because the ionic liquids are aprotic solvents. Moreover, the
3
4 These water-stable ionic liquids are considered green solvents and have found wide application as reaction media for synthesis and for energy conversion.3
4 Examples of electrodeposition studies using the water-stable ionic liquids have also appeared in the literature.5
6 Recently, low-temperature dialkylimidazolium chlorozincate ionic liquids resulting from the combination of zinc chloride and 1-ethyl-3-methylimidazolium chloride (EMIC) have been prepared for the electrodeposition of zinc and zinc-containing alloys.7
8
9
10
11 These studies revealed that complications associated with hydrogen evolution that often occur in aqueous bath are eliminated in the chlorozincate ionic liquids because the ionic liquids are aprotic solvents. Moreover, the  ionic liquids do not react with water as vigorously as the chloroaluminates.
Tin and tin-zinc alloys are materials widely used to improve corrosion resistance, enhance appearance, and increase solderability.12
13 While the electrochemistry of Sn has been extensively studied in aqueous solutions,12
13
14
15 it is less studied in ionic liquids or molten salts. Castrillejo et al.16 studied the electrochemistry of Sn(II) with voltammetry, chronopotentiometry, and chronoamperometry at glassy carbon (GC) and W electrodes in the  molten salt system at 450°C. They observed that Sn(IV)/Sn(II) and Sn(II)/Sn redox couples are quasi-reversible. Xu and Hussey17 investigated the electrochemistry of Sn(II) and Sn(IV) with voltammetry and chronoamperometry at several different electrodes in the
  ionic liquids at 40°C. They found that the Sn(II) reduction is uncomplicated at Pt whereas the underpotential deposition of Sn occurs at Au. Furthermore, the deposition of Sn at GC is complicated by 3D nucleation. They also reported that the voltammetric oxidation of Sn(II) to Sn(IV) is hindered by the weak adsorption of Sn(II). Xu and Hussey also summarized some of the other studies on the electrochemistry of Sn.
To further explore the potential utility of  ionic liquids as electrolytes for electrodeposition, this work reports the electrodeposition of Sn and Sn-Zn coatings in this ionic liquid system. The Lewis acidity of the
  ionic liquids can be adjusted by varying the molar ratio of
  to EMIC in the ionic liquids.7 In general, ionic liquids that have a
  molar ratio higher than 0.5:1 are acidic because they contain Lewis acidic chlorozincate species such as
 and
and  Ionic liquids that have a
  molar ratio lower than 0.5:1 are considered basic. In this study, the effects of the ionic liquid composition, Sn(II) concentration, deposition potential, and temperature on the composition of the electrodeposited Sn-Zn coatings are described.
Experimental
Apparatus.—
All electrochemical experiments were conducted inside a Vacuum Atmospheres glove box filled with dry nitrogen. The moisture and oxygen level in the box was kept lower than 1 ppm. An EG&G model 273A potentiostat/galvanostat controlled with EG&G model 270 software was employed to conduct the electrochemical experiments. A three-electrode electrochemical cell was used for the electrochemical experiments. The electrochemistry of Sn(II) was investigated at tungsten (geometric area  and GC (geometric area
  working electrodes. These electrodes were fabricated by sealing a piece of tungsten rod (Stream, 99.99%) or a GC rod (Tokai, GC20) into Pyrex tubes followed by cutting off the tip of the tube to expose the electrode surface. All the electrodes were polished successively with increasingly finer grades of emery paper followed by silicon carbide grit, and finally to a mirror finish with aqueous slurry of 0.05 μm alumina, rinsed with distilled water, and dried under vacuum. The counter electrode was a Zn spiral in a fritted glass tube containing pure
  melt of the same composition as the bulk solution. The reference electrode was a Zn wire placed in a separate fritted glass tube containing pure 50.0-50.0 mol %
  melt. Bulk electrodeposits were prepared on nickel foils
  Aldrich 99.99%). Approximately the same charge density was used for all the deposition experiments. Because the
  ionic liquid does not react violently with water, the residual ionic liquid on the electrodeposits coated nickel foil electrode was removed easily by rinsing with warm
  deionized water following each deposition experiment. A Hitachi S-4200 field effect scanning electron microscope (SEM) with energy-dispersive spectrometer (EDS) working at 15 kV was used to examine the surface topography and the elemental compositions of the electrodeposits. A Shimadzu XD-D1 X-ray diffractometer (XRD) was used to study the crystalline phases of the electrodeposits.
Chemicals.—
The EMIC was prepared and purified according to the method described in the literature.1 The  melts were prepared in the glove box by mixing proper amounts of
  (99.99%, Aldrich) and EMIC in a beaker followed by heating at 90°C for 2 days to ensure that the reaction between
  and EMIC is complete. The resulting ionic liquids were colorless. Anhydrous
  (99.999%),
  (99.99%), and Sn foil (99.99%) were purchased from Aldrich and used as received.
Results and Discussion
Electrodissolution of tin.—
A staircase cyclic voltammogram (CV) recorded for a Sn foil electrode in an unstirred acidic 40-60 mol %  melt at 90°C is shown in Fig. 1a. This voltammogram shows that the anodic dissolution of the Sn electrode begins at about 0.2 V and increases rapidly until the potential scan is reversed at about 0.5 V. To determine the oxidation state of the Sn species produced from the anodic dissolution process, the number of moles of Sn that was oxidized is determined from the weight loss of the Sn electrode after the passage of a certain amount of charge at 0.3 V. By comparing the number of moles of Sn that were oxidized and the moles of charge that were passed, the number of electrons,
  transferred during the oxidation of each Sn atom was then determined to be two (Table I), indicating that Sn(II) is produced during the anodic dissolution of Sn metal. Similar to the voltammogram in Fig. 1a, the staircase CV shown in Fig. 1b and the data in Table I indicate that the anodic dissolution of Sn metal to Sn(II) also occurs in a basic 25-75 mol %
  melt. Nernst plots were constructed for the Sn(II)/Sn couple in both the 40-60 and 25-75 mol % melts by using controlled-potential electrolysis to vary the Sn(II) concentration in solutions contained in an electrochemical cell equipped with the usual Zn reference electrode and a Sn indicator electrode. As shown in Fig. 2, the resulting plots of
  vs.
vs.  were linear with slopes of 0.015 and 0.014 V and intercepts of 0.25 and
  for the Sn(II)/Sn couple in the 40-60 and 25-75 mol % melts, respectively. The experimental Nernst slopes were in excellent agreement with a 0.015 V theoretical slope expected for a two-electron redox couple at 90°C. The intercepts of the plots, which correspond to the formal electrode potential,
  of the Sn(II)/Sn couple in each melt, exhibit a substantial negative shift with decreasing melt acidity. Such potential shift is not unexpected; similar behavior has been observed in the
  system.17 This kind of behavior can be attributed to the differences in the solvation of the Sn(II) ions in acidic and basic melts.17 In basic melts, Sn(II) may exist as well-defined chloride complexes18 such as
  or
or  In acidic melt, however, Sn(II) is probably weakly solvated by chlorozincate ions.
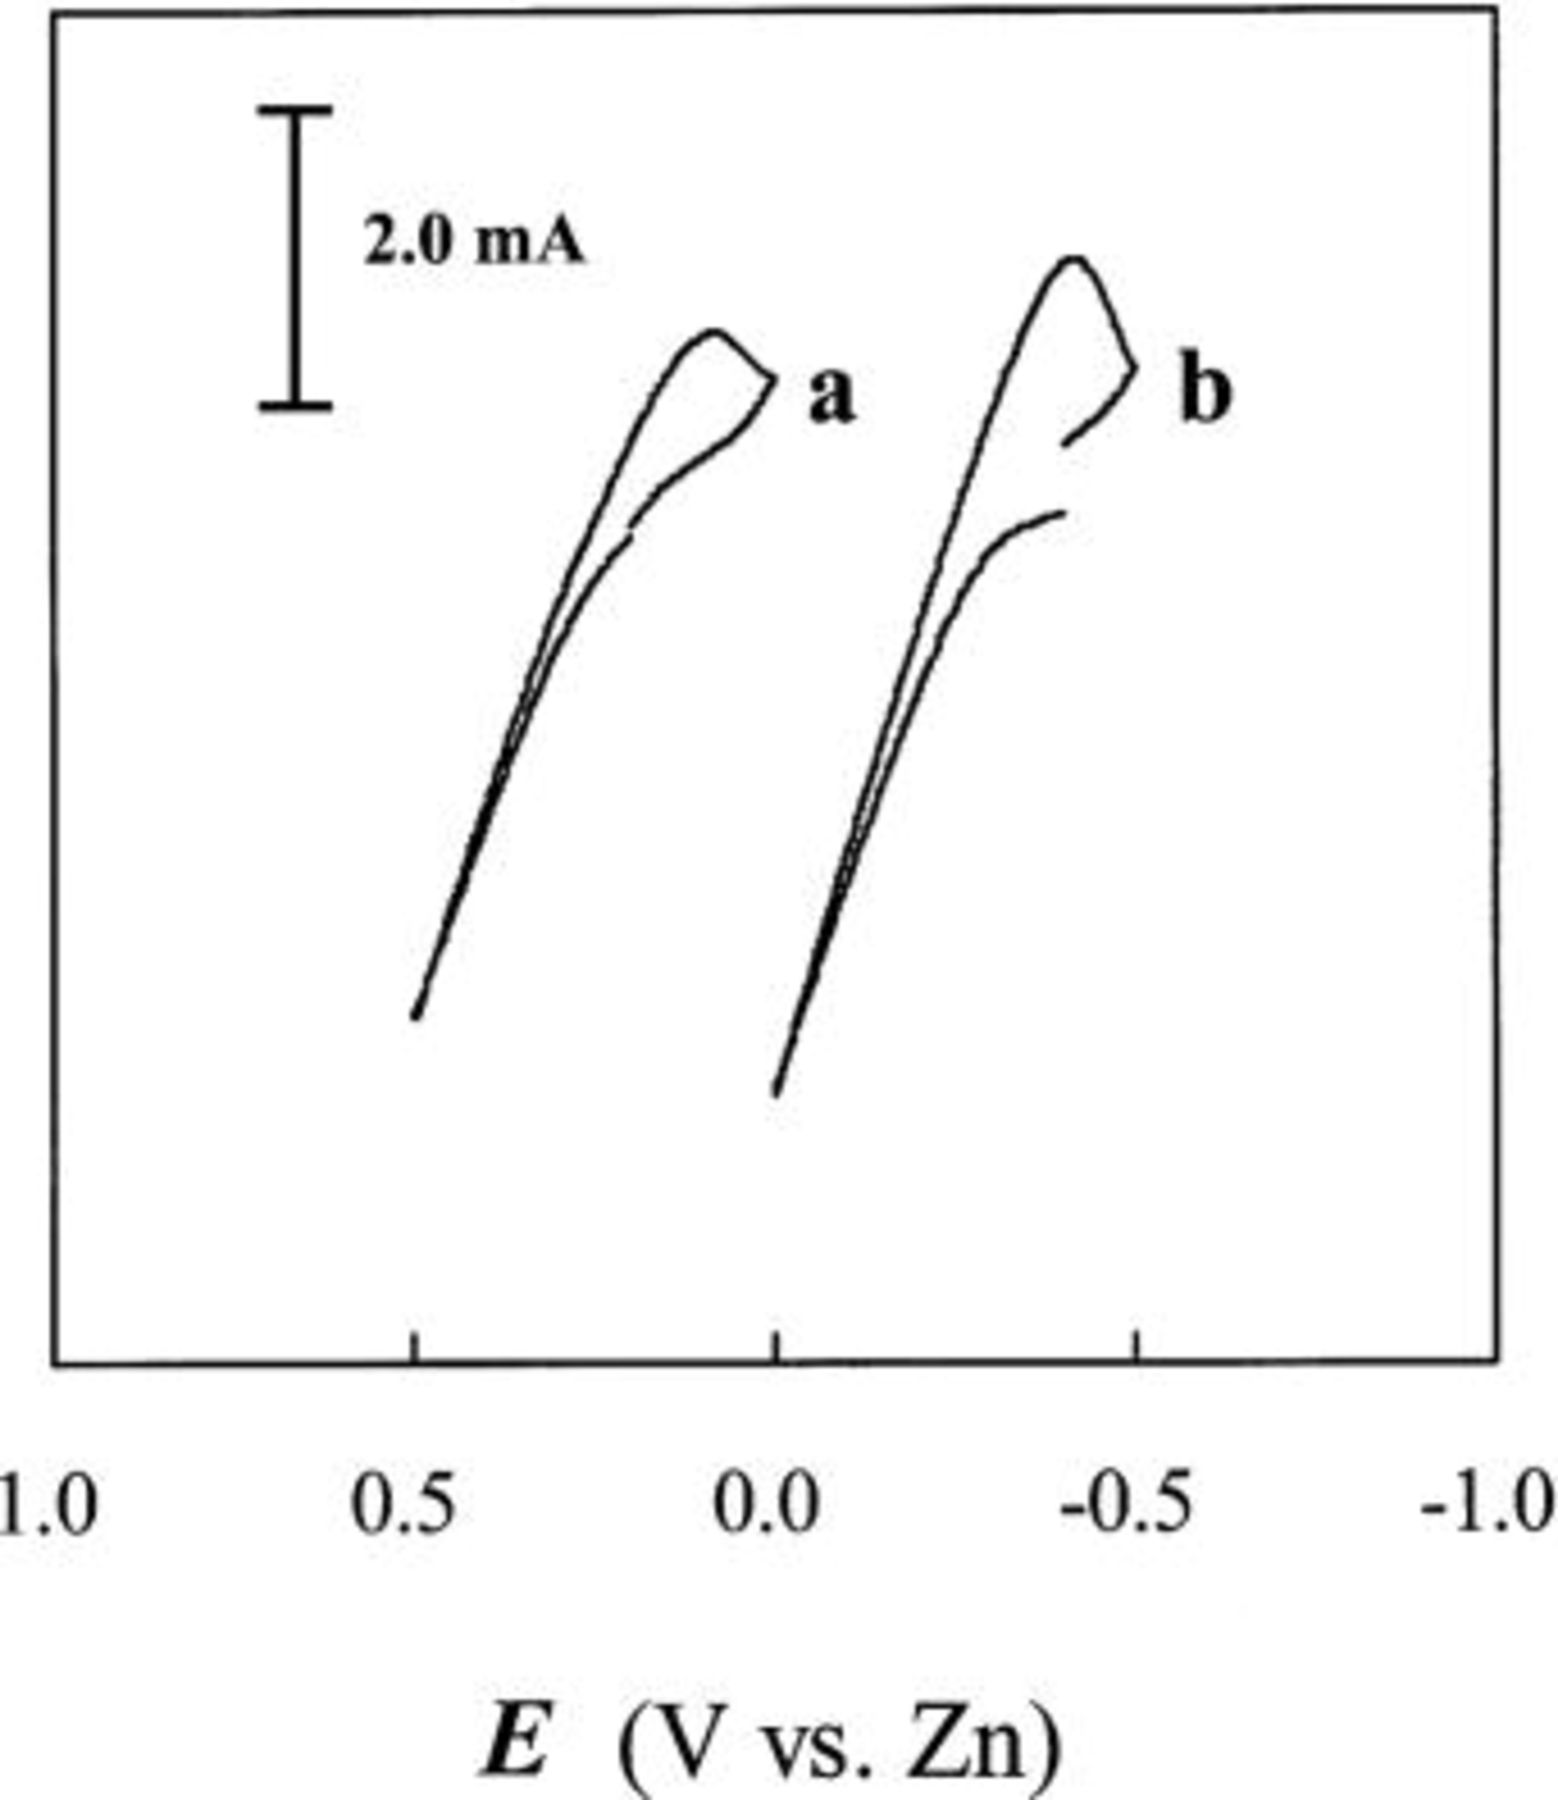
Figure 1. Staircase CVs of a Sn foil electrode in the (a) unstirred acidic 40-60 mol % and (b) basic 25-75 mol %  ionic liquids at 90°C.
Table I.
Results for the anodization of Sn electrodes in  -EMIC ionic liquids. -EMIC ionic liquids. | |||||
|---|---|---|---|---|---|
 (mol %)
 |
 (g)
(g) |
 (mol)
(mol) |
 (C)
(C) |
 (C)
(C) |
 |
| 40a | 0.028 | 2.36 | 22.76 | 45.64 | 2.01 |
| 40a | 0.026 | 2.19 | 21.13 | 44.40 | 2.10 |
| 40a | 0.027 | 2.27 | 21.95 | 43.72 | 1.99 |
| 25b | 0.026 | 2.19 | 21.13 | 42.22 | 2.00 |
| 25b | 0.029 | 2.44 | 23.58 | 47.24 | 2.00 |
a  | |||||
b 
| |||||
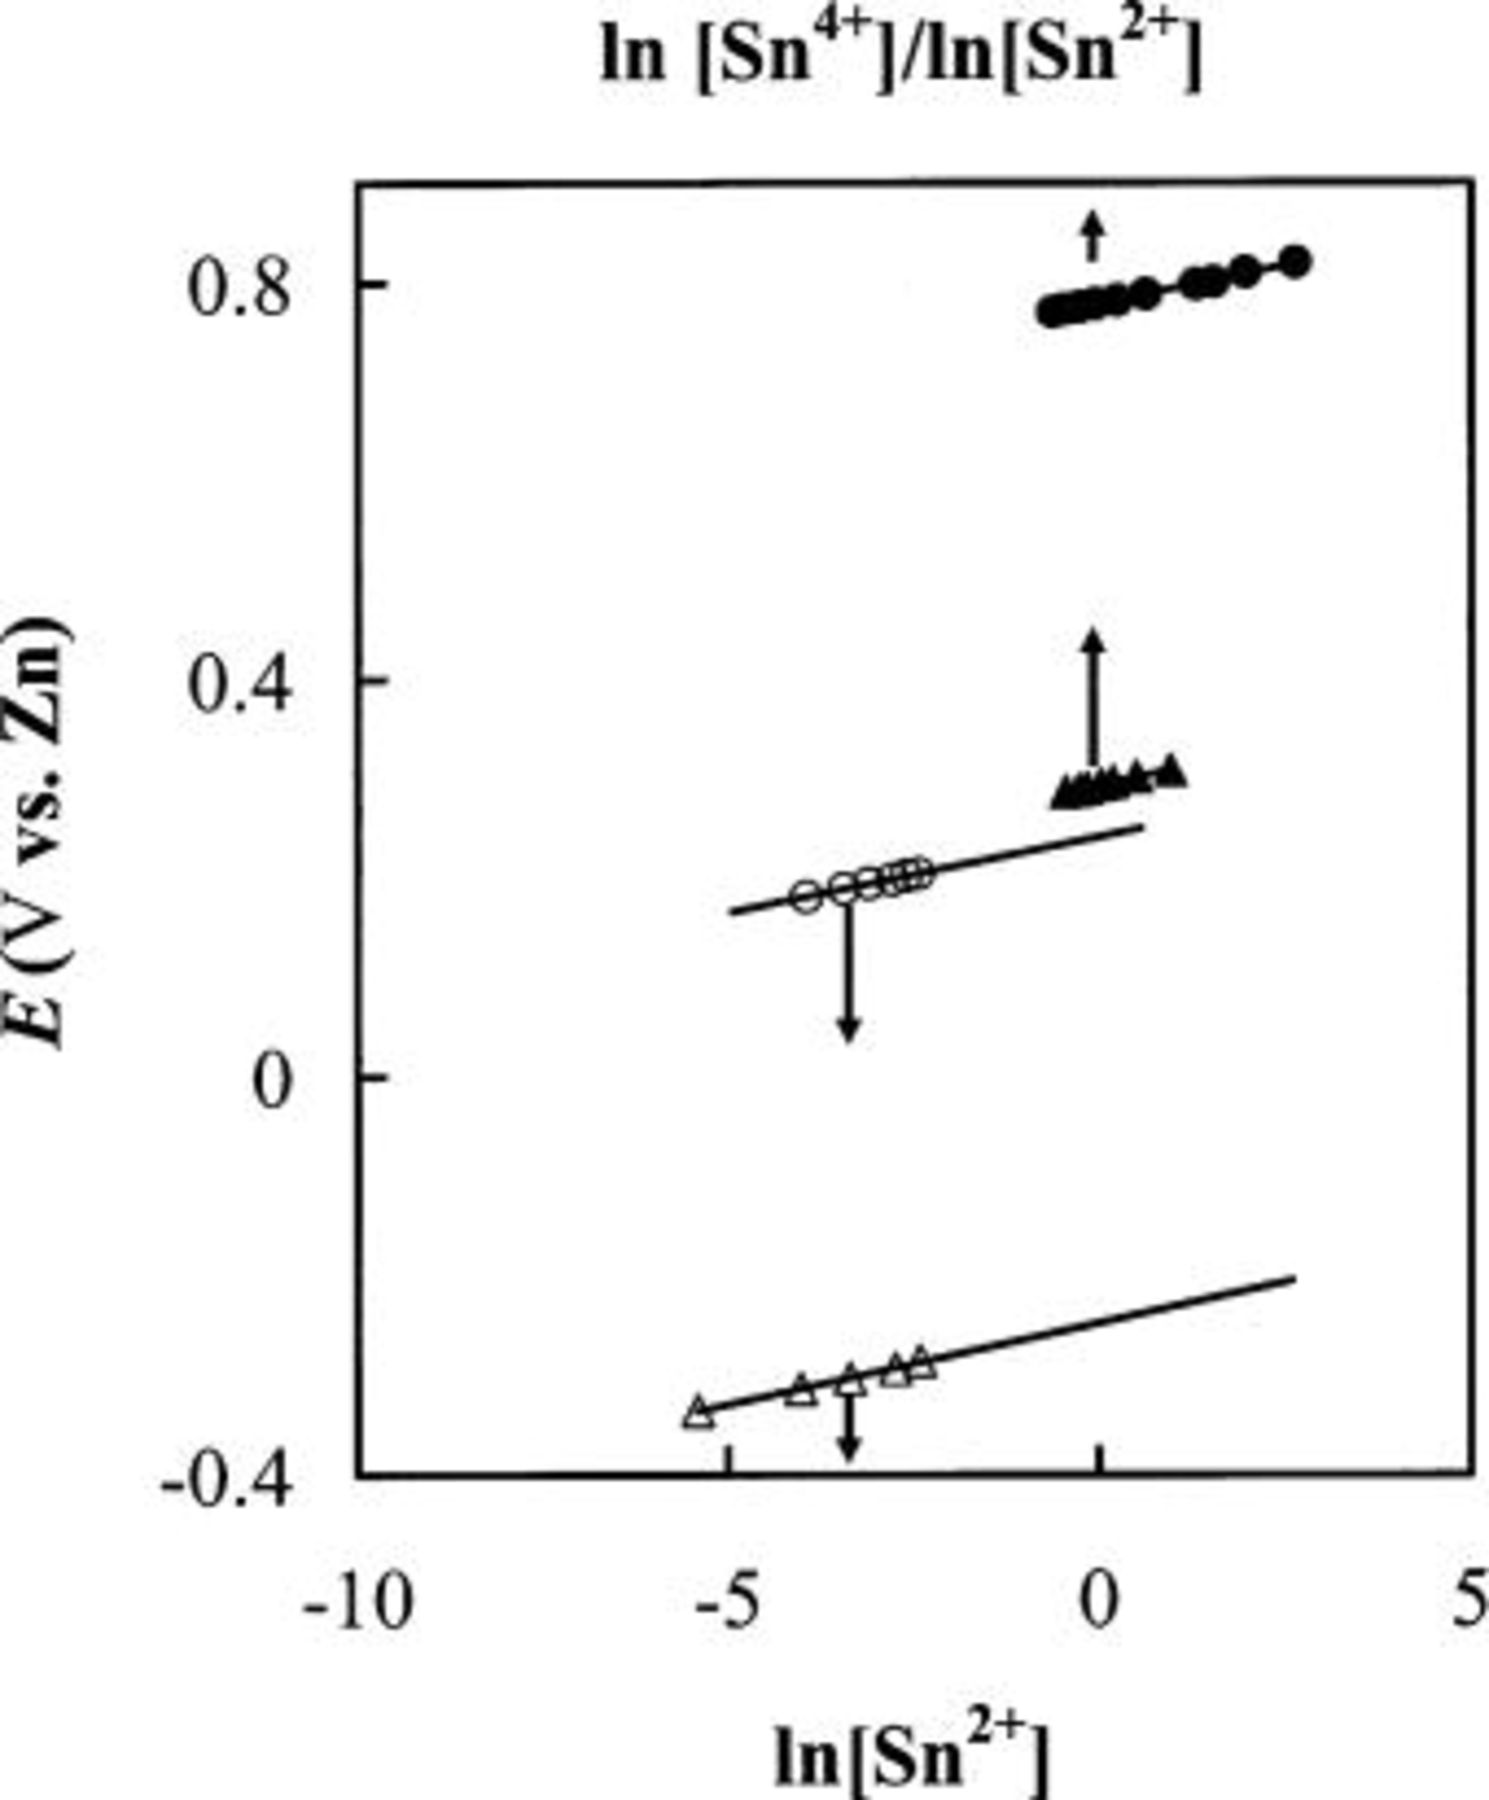
Figure 2. Nernst plots for the Sn(IV)/Sn(II) and Sn(II)/Sn redox couples at 90°C in (a) basic 25-75 mol %  ionic liquid, (▵) Sn(IV)/Sn(II) and (▴) Sn(II)/Sn; and (b) acidic 40-60 mol %
  ionic liquid, (○) Sn(IV)/Sn(II) and (•) Sn(II)/Sn.
Voltammetry of Sn(II) in basic 25-75 mol %  ionic liquid.—
Colorless Sn(II) solutions were prepared either by the controlled potential coulometric oxidation of a Sn electrode or by dissolving  into basic 25-75 mol %
  ionic liquid. Typical staircase CVs recorded at both tungsten and GC electrodes of a 30 mM Sn(II) solution at 90°C are shown in Fig. 3. When the voltammetric scan was initiated in the negative direction (Fig. 3a), only a single reduction wave,
  arising from the reduction of Sn(II) to Sn metal is observed. Upon scan reversal at
  the stripping of the electrodeposited Sn metal occurs at wave
  The integrated charge from this stripping wave equals the charge corresponding to wave
  indicating that virtually 100% of the deposited Sn is recovered during oxidation. In addition, a second oxidation wave,
  can be seen on the reverse scan. If the voltammetric scan is initiated in the positive direction and reversed at 1.3 V (Fig. 3b), then it is found that wave
  is associated with a reduction wave,
  prior to the bulk deposition of Sn. In order to determine the number of electrons,
  transferred during the oxidation wave
  exhaustive controlled potential electrolysis experiments were conducted with solutions of Sn(II) at an applied potential of 0.9 V. Based on the initial number of moles of Sn(II) present in the solutions and on the total charge consumed during the electrolysis, the average
  value determined from three independent experiments was 2 (Table II), suggesting that Sn(II) is oxidized to Sn(IV) at wave
  The reduction wave
  is most probably due to the reduction of Sn(IV) to Sn(II). To further study wave
  the rotating disk electrode (RDE) voltammogram was recorded for a 30 mM Sn(IV) solution and compared to the RDE voltammogram recorded for a 30 mM Sn(II) solution. As shown in the inset of Fig. 3b, the total limiting current resulting from
  and
and  is about twice that of
  only. After subtracting the limiting current that arises from wave
  from the total limiting current, the remaining current, which is the limiting current due to wave
  is approximately the same in magnitude as the limiting current of
  Since wave
  is a two-electron process, wave
  must also be a two-electron oxidation process; that is, wave
  is due to the reduction of Sn(IV) to Sn(II). A Nernst plot was constructed for the Sn(II)/Sn(IV) couple by adding different portions of
  to adjust the Sn(IV)/Sn(II) concentration ratio in a solution that initially contains only Sn(IV). The equilibrium potentials were recorded as a function of the Sn(IV)/Sn(II) concentration after each addition of
  As shown in Fig. 2, the resulting plot of
  vs.
vs.  was linear with a slope of 0.015 V. This experimental slope is in good agreement with the theoretical slope expected for a two-electron redox couple at this temperature (90°C). The intercept of the Nernst plot, which corresponds to the formal potential,
  of the Sn(IV)/Sn(II) couple, is 0.78 V. Taken together, these results suggest that waves
  and
and  in Fig. 3 are due to

It is noted in Fig. 3 that wave  occurs at a less positive potential at the GC electrode than at the tungsten electrode, indicating that the oxidation of Sn(II) is kinetically more favorable at the GC electrode.
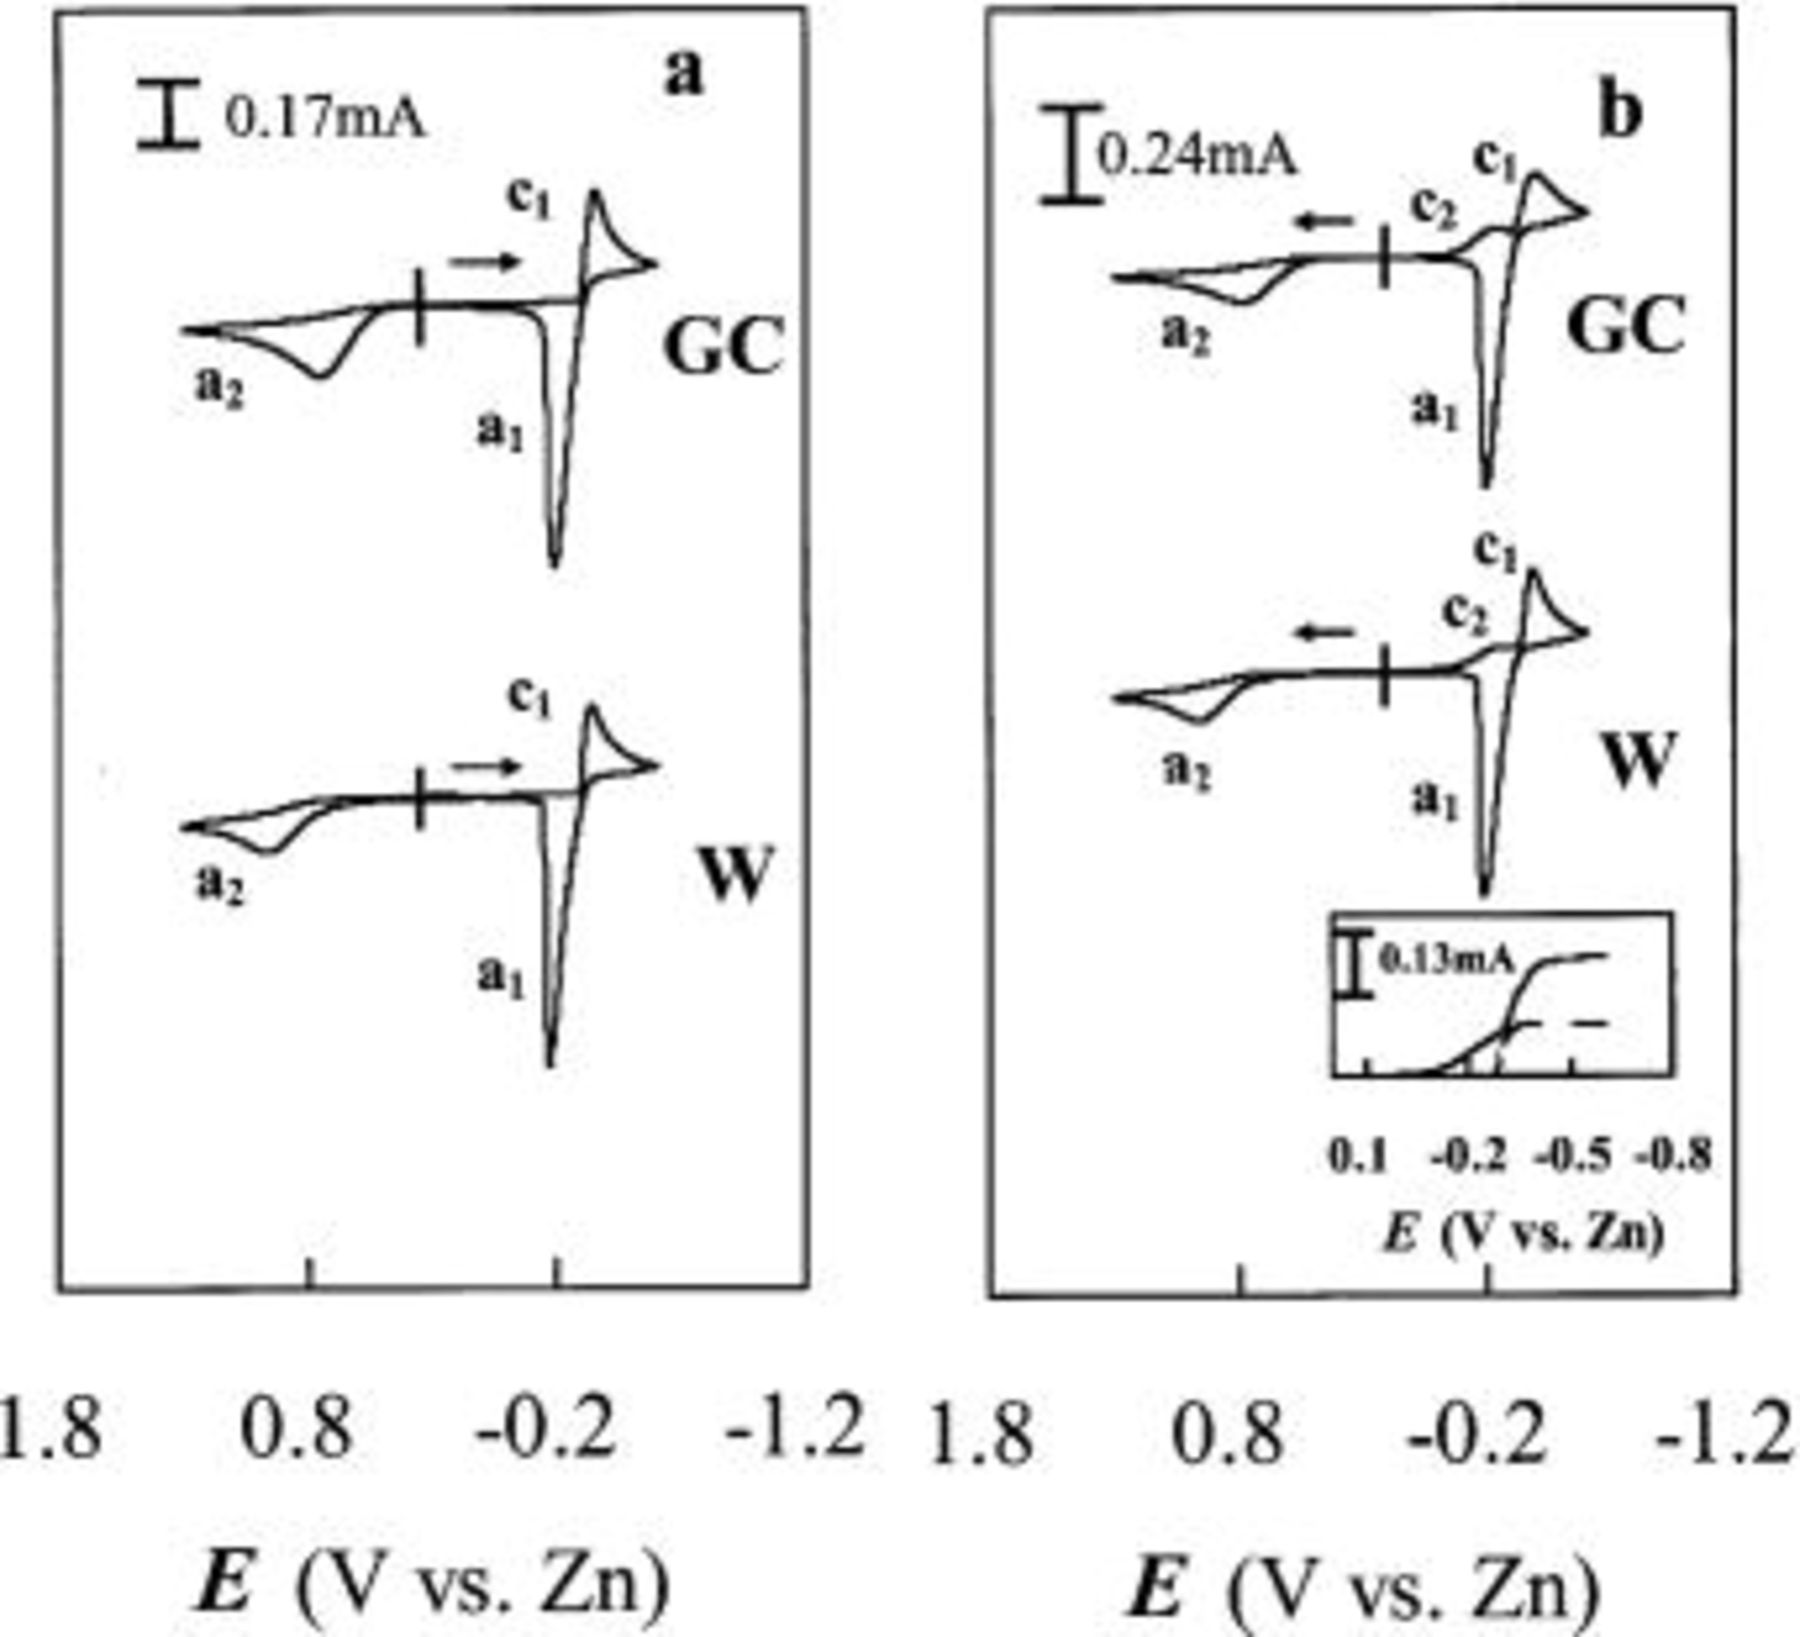
Figure 3. Staircase CVs of Sn(II) at W and GC electrodes in a basic 25-75 mol %  ionic liquid containing 30 mM Sn(II) at 90°C: (a) potential scan initiated in the negative direction and (b) potential scan initiated in the positive direction. Scan rate 50 mV/s. Inset: the RDE voltammograms recorded at a W electrode for (⎯) Sn(IV) and (—) Sn(II). Rotation rate
  scan rate 5 mV/s.
Table II.
Coulometric results for the oxidation of Sn(II) in  -EMIC melts. -EMIC melts. | ||||
|---|---|---|---|---|
 (mol %)
 |
 (mol)
(mol) |
 (C)
(C) |
 (C)
(C) |
 |
| 40a | 2.36 | 22.76 | 45.21 | 1.99 |
| 40a | 2.19 | 21.13 | 43.82 | 2.07 |
| 40a | 2.27 | 21.95 | 43.62 | 1.99 |
| 25b | 2.19 | 21.13 | 43.04 | 2.04 |
| 25b | 2.44 | 23.58 | 47.11 | 2.00 |
a  | ||||
b 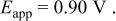
| ||||
Voltammetry of Sn(II) in the acidic 40-60 mol % ionic liquid.—

Typical staircase CVs recorded for 30 mM Sn(II) at both tungsten and GC electrodes in an acidic 40-60 mol %  ionic liquid at 90°C are shown in Fig. 4. The voltammogram (Fig. 4a) exhibits waves arising from the bulk deposition and stripping of Sn at waves
  and
and  when the potential scan is initiated in the negative direction. In addition, a second oxidation wave
  is also seen on the reverse scan. Controlled potential coulometric experiments were performed for solutions of Sn(II) in the acidic melt at 1.6 V, and the results (Table II) indicate that the number of electrons transferred at wave
  was two, indicating that wave
  in Fig. 4 is similar to that which occurs in the basic melt due to the oxidation of Sn(II) to Sn(IV). When the potential scan was initiated in the positive direction from the rest potential, the voltammogram obtained (Fig. 4b) reveals that although the anodic wave
  for the oxidation of Sn(II) to Sn(IV) is apparent, the cathodic wave
  for the reduction of Sn(IV) to Sn(II) that was observed in the basic melt (Fig. 3) is not seen in the acidic melt (Fig. 4). It was found, however, that when the potential was initially scanned in the positive direction and reversed after wave
  the current for the electrodeposition of Sn (wave
  in Fig. 4b) was significantly higher than that observed in Fig. 4a, whereas the currents for waves
  and
and  remained relatively constant in these two figures. This suggests that wave
  in Fig. 4b actually resulted from two electrochemical processes, i.e., the Sn(IV) was first reduced to Sn(II) which was further reduced to Sn metal at this potential. The Sn(IV)/Sn(II) redox reaction was not observed in a study of the electrochemistry of Sn(II) in an acidic
  system.17 A Nernst plot was constructed for the Sn(II)/Sn(IV) couple in the acidic melt using the same method as was used for this couple in the basic melt. As shown in Fig. 2, the resulting plot of
  vs.
vs.  was linear with a slope of 0.015 V, which is in good agreement with the theoretical slope expected for a two-electron redox couple at this temperature (90°C). The intercept of the Nernst plot, which corresponds to the formal potential,
  of the Sn(IV)/Sn(II) couple is 0.29 V. Taken together, these results indicate that similar to those observed in basic
  melt, Sn(IV)/Sn(II) and Sn(II)/Sn metal redox reactions also occur in acidic
  melt. However, the peak potentials or the formal potentials of these processes are shifted to more positive values relative to those found in basic melt because of the differences in the solvation of the Sn(II) and Sn(IV) ions in acidic and basic melts.
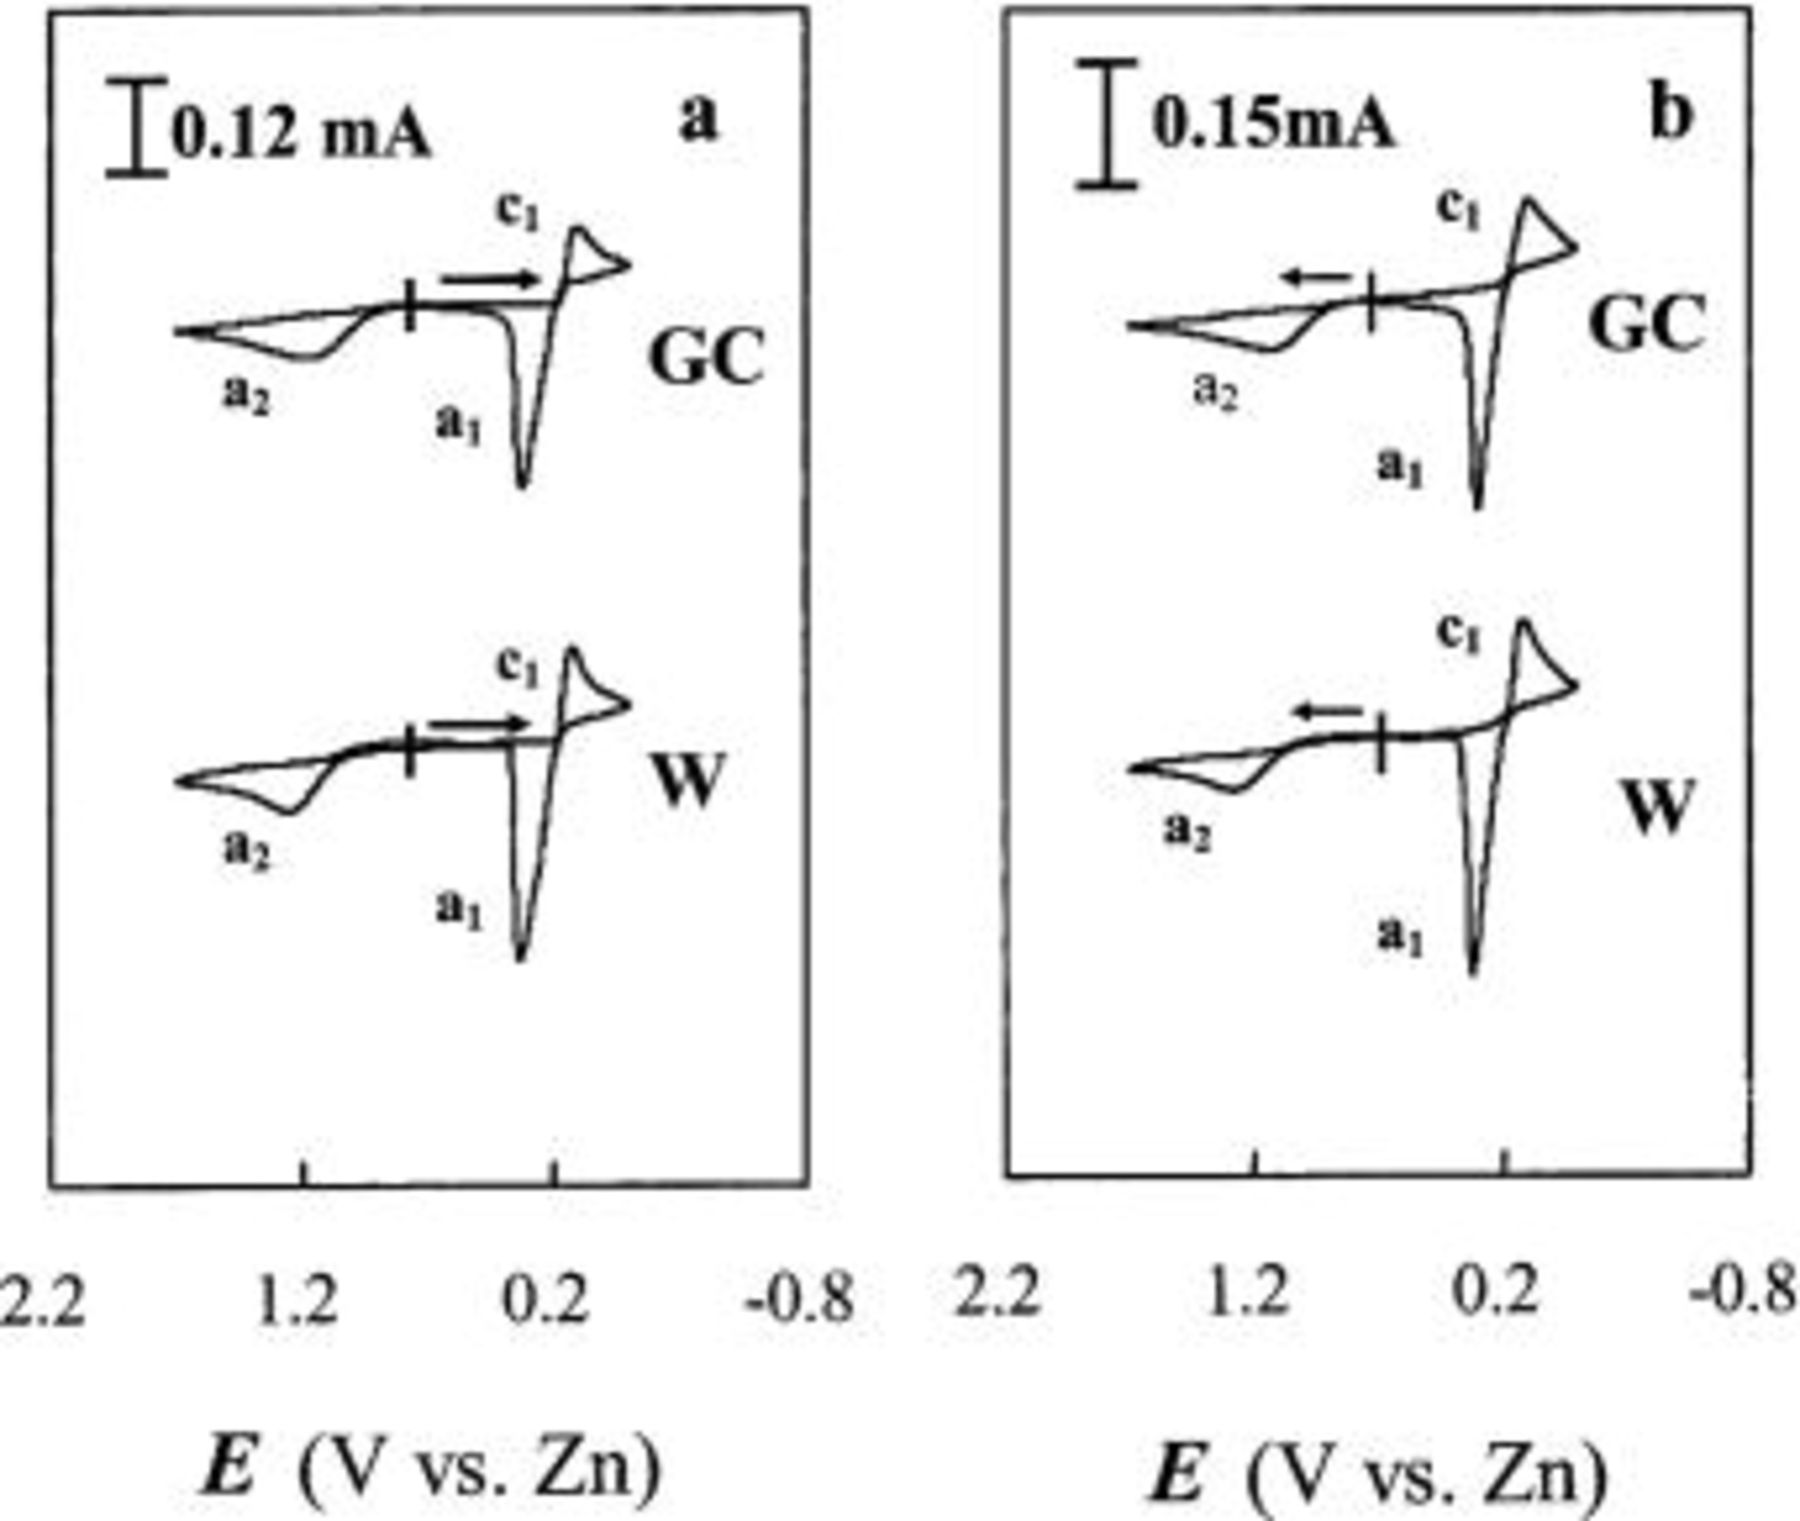
Figure 4. Staircase CVs of Sn(II) at W and GC electrodes in an acidic 40-60 mol %  ionic liquid containing 30 mM Sn(II) at 90°C: (a) potential scan initiated in the negative direction and (b) in the positive direction. Scan rate 50 mV/s.
Determination of charge-transfer rate constant of Sn(II)/Sn(IV) couple.—
The peak potential separation,  for the Sn(II)/Sn(IV) couple observed in Fig. 3 is fairly large and increases rapidly as the scan rate,
  is increased, indicating that the Sn(II)/Sn(IV) electrode reaction is nearly irreversible.19 The charge-transfer kinetics of the Sn(II)/Sn(IV) couple at W and GC electrodes in the basic ionic liquid was further studied. The standard heterogeneous rate constant,
  and the transfer coefficient, α, for the oxidation of Sn(II) to Sn(IV) was estimated from the CVs of the oxidation of Sn(II) by plotting the logarithm of the peak current,
  vs. the difference of the peak potential and the formal potential,
 as shown in Fig. 5, according to the following equation19

The α values were estimated from the slope of Fig. 5, and the  values were estimated from the intercept of Fig. 5. The results are collected in Table III along with the diffusion coefficient of Sn(II) determined from chronoamperometric experiments. This table indicates a smaller
  was obtained at W electrode than at the GC electrode, indicating that Sn(II)/Sn(IV) oxidation at the W electrode is kinetically less favorable than at the GC electrode. The Sn(II)/Sn(IV) reaction is reported to be nearly irreversible in the
  melt and in most aqueous solutions. In addition, the change of the Sn coordination sphere during the electrode reaction may also contribute to the large peak potential separation. For example, Sn(IV) may be coordinated to six chloride ions while Sn(II) may be coordinated to three or four chloride ions.20
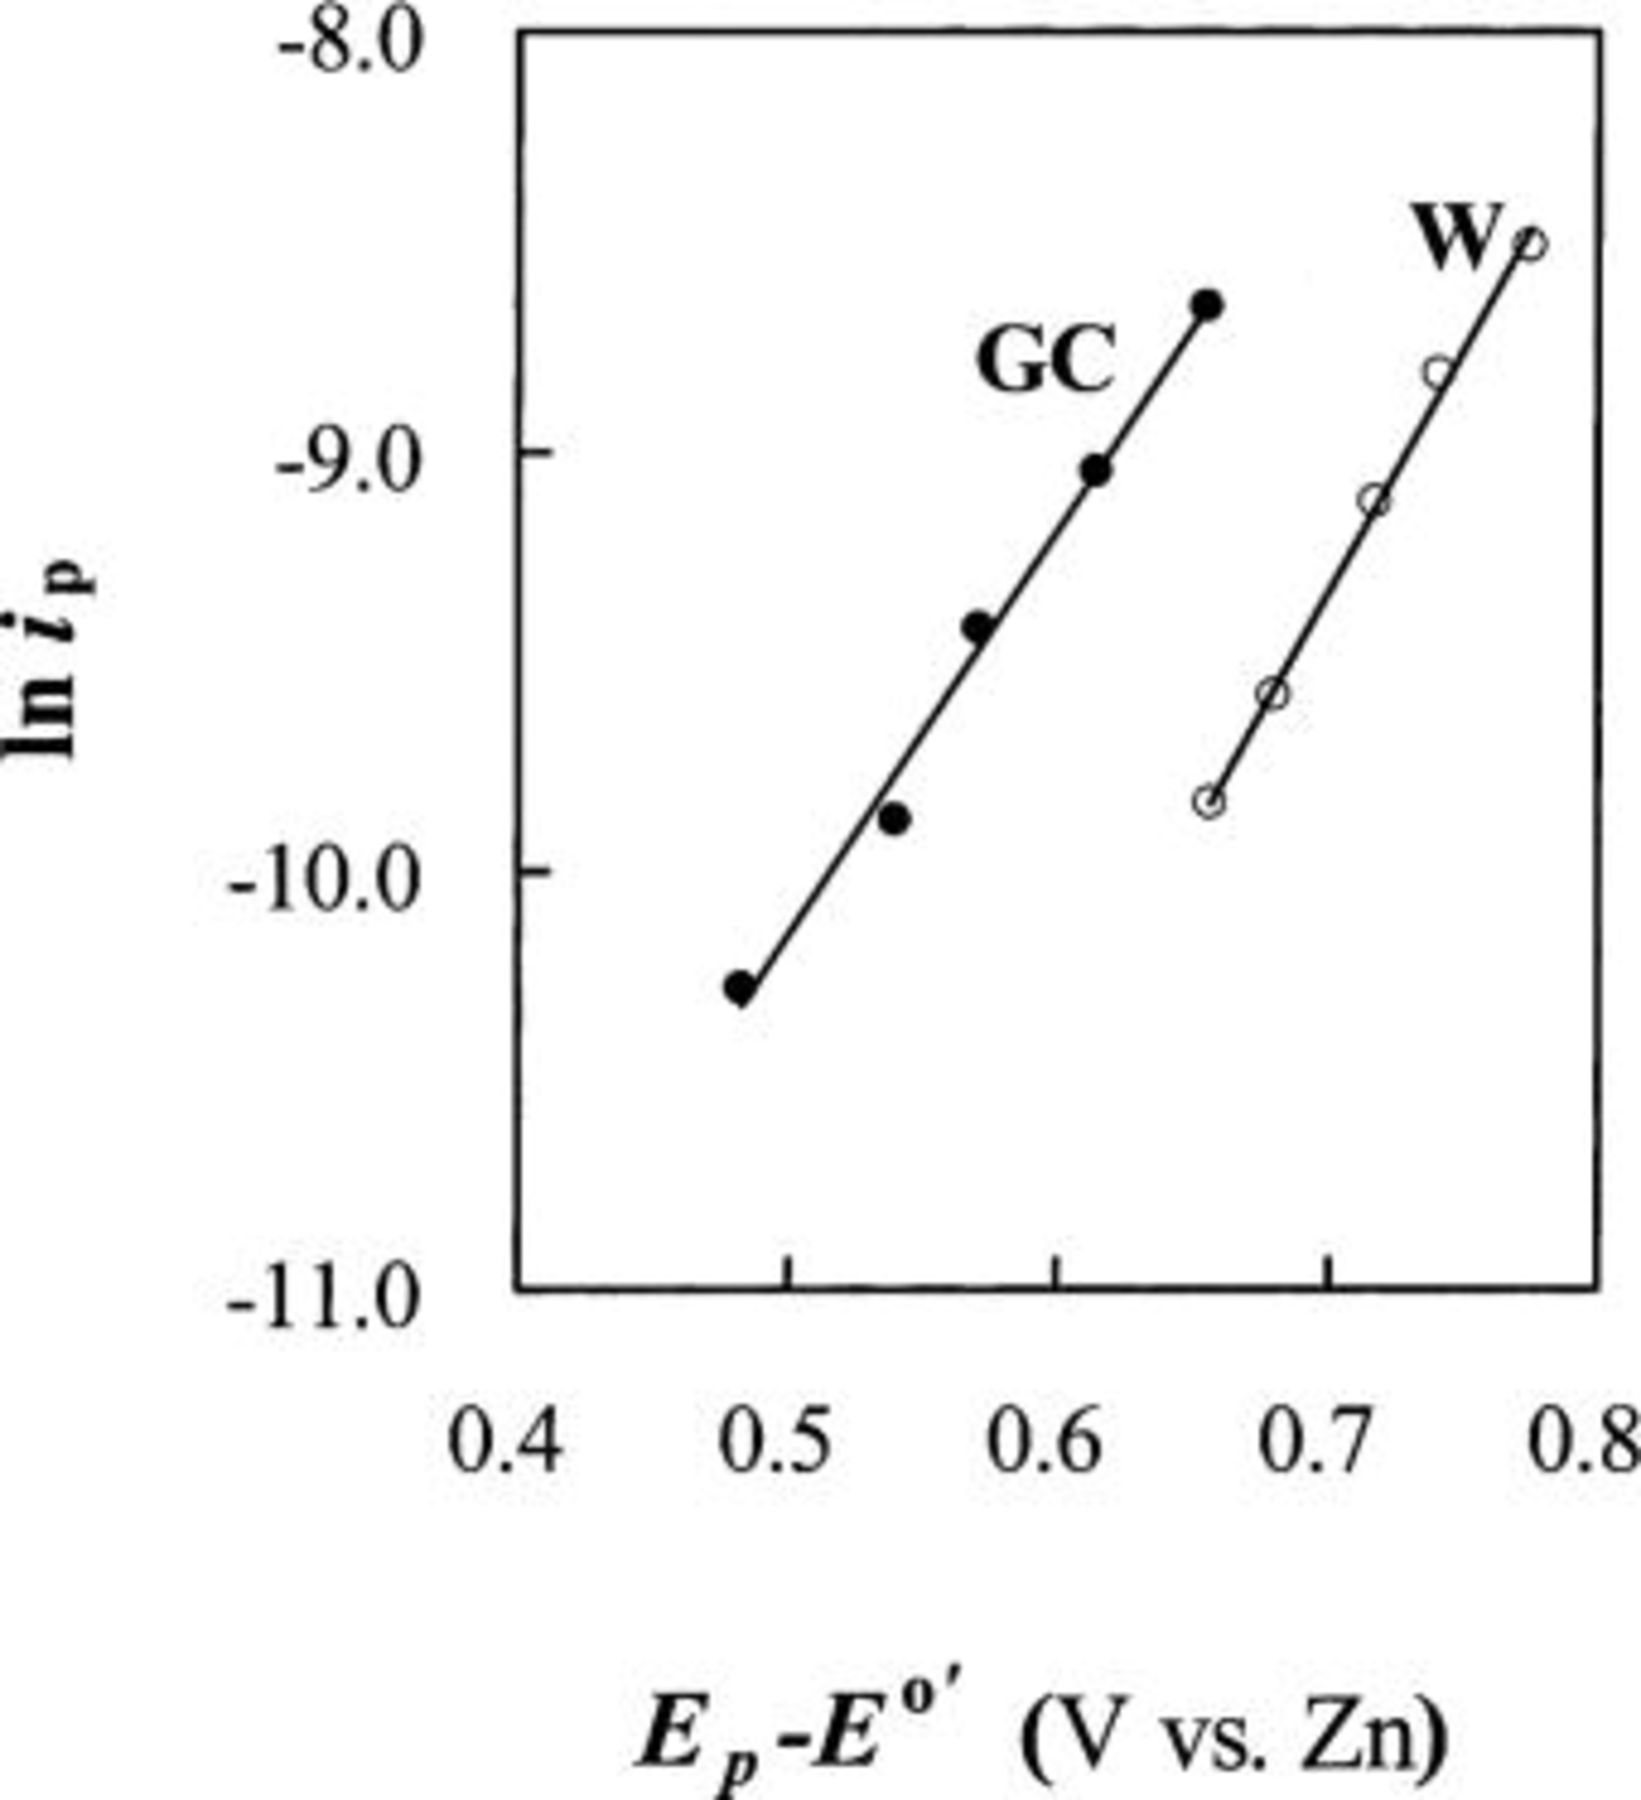
Figure 5. Plots of  vs.
vs.  determined at different scan rates. The data were taken from the staircase CVs for the oxidation of 30 mM Sn(II) at W and GC electrodes in the 25-75 mol %
  ionic liquid at 90°C.
Table III.
Summary of electrochemical data for the Sn(II)/Sn(IV) oxidation reaction in the 25-75 mol %  -EMIC ionic liquid at 90°C. -EMIC ionic liquid at 90°C. | ||||||
|---|---|---|---|---|---|---|
| Solute |
 (V)
(V) |

 |
 | α | ||
| W | GC | W | GC | |||
| Sn(II) | 0.24 | 4.61 |
 |
 | 0.36 | 0.30 |
Adsorption of Sn(II) on electrodes.—
The adsorption of Sn(II) on metallic electrodes was noted in previous studies conducted in aqueous solutions15 and in  ionic liquid.17 To verify if adsorption of Sn(II) also occurs in the acidic 40-60 mol %
  melt, sampled-current voltammograms21 were constructed from chronoamperometric current-time transients recorded for the reduction of Sn(II) to Sn metal at W, Ni, and GC electrodes in a solution of this melt containing 30 mM Sn(II). These transients were obtained by stepping the electrode potential from an initial value of 0.6 V, where no faradaic reaction takes place, to the potential of interest, and the current was sampled at 100 s following the application of each pulse. After each desired datum was collected, the resulting electrodeposit was anodically stripped from the electrode surface by holding the electrode potential at 0.6 V until the oxidation current decayed to the background level. The complete sequence was repeated at another potential. Thus, each datum was obtained at a deposit-free electrode surface. All the chronoamperometric transients displayed Cottrell behavior. The sampled-current voltammograms were then constructed by plotting the sampled current as a function of the pulse potential. The resulting voltammograms are presented in Fig. 6a. As can be seen in the figure, the sampled-current voltammograms all exhibit an obvious diminution in the current in the potential region extending from about 0.2 to 0.06 V, where the limiting current for the reduction of Sn(II) should be observed. Although these distortions were not especially reproducible, all of them do exhibit limiting currents in the 0.06 to
  potential region. The diminished currents seen in these voltammograms can be ascribed to the partial blocking of the active area of the electrode by the adsorbate. As a result of the extra stability imparted by the adsorption process, the adsorbed Sn(II) is reduced at more negative potentials than freely diffusing Sn(II) species. Thus, the expected value of the limiting current is not attained until the potential reaches about 0.06 V and the adsorbed Sn(II) is reduced, restoring the full active area of the electrode.
Figure 6. ampled-current voltammograms constructed from potential-step experiments at (•) W, (▪) GC, and (▴) Ni electrodes for 30 mM Sn(II) in (a) 40-60 and (b) 25-75 mol %  ionic liquids. The current was sampled at 100 s following each potential step.
The adsorption effect on the oxidation of Sn(II) to Sn(IV) at W and GC electrodes [Ni electrode was not used because it oxidized near the potential where Sn(II) is oxidized to Sn(IV)] was also studied with multiple-scan staircase CV. As shown in Fig. 7a, the CVs recorded at W electrode in the acidic  melt displays hysteresis during the first cycle, and the current response decreased dramatically from one cycle to the next, suggesting rapid depletion of the concentration of Sn(II) in the neighborhood of the electrode. Similar to that observed at a gold electrode in aqueous solutions, the hysteresis can be attributed to inhibition of the oxidation of Sn(II) to Sn(IV) by adsorbed Sn(II); the adsorbed Sn(II) is oxidized at a more positive potential than the freely diffusing Sn(II), which is consistent with a need to overcome the Gibbs energy of adsorption. Once the adsorbed Sn(II) is oxidized, the bulk Sn(II) is oxidizable at less positive potentials. In contrast to the voltammograms recorded at the W electrode, the voltammograms recorded at the GC electrode do not exhibit current hysteresis. This observation indicates that the surface charge distribution on W and GC electrodes could be affected differently by the applied potential. At potentials near the oxidation of Sn(II), the surface charge distribution on GC electrode changed significantly from that at potentials near the reduction of Sn(II) to Sn, and the adsorbed Sn(II) may have desorbed before the potential reaching the oxidation potential of Sn(II). The surface charge distribution on the W electrode may not have enough change and the desorption of Sn(II) did not occur at the potential where oxidation of Sn(II) would take place.
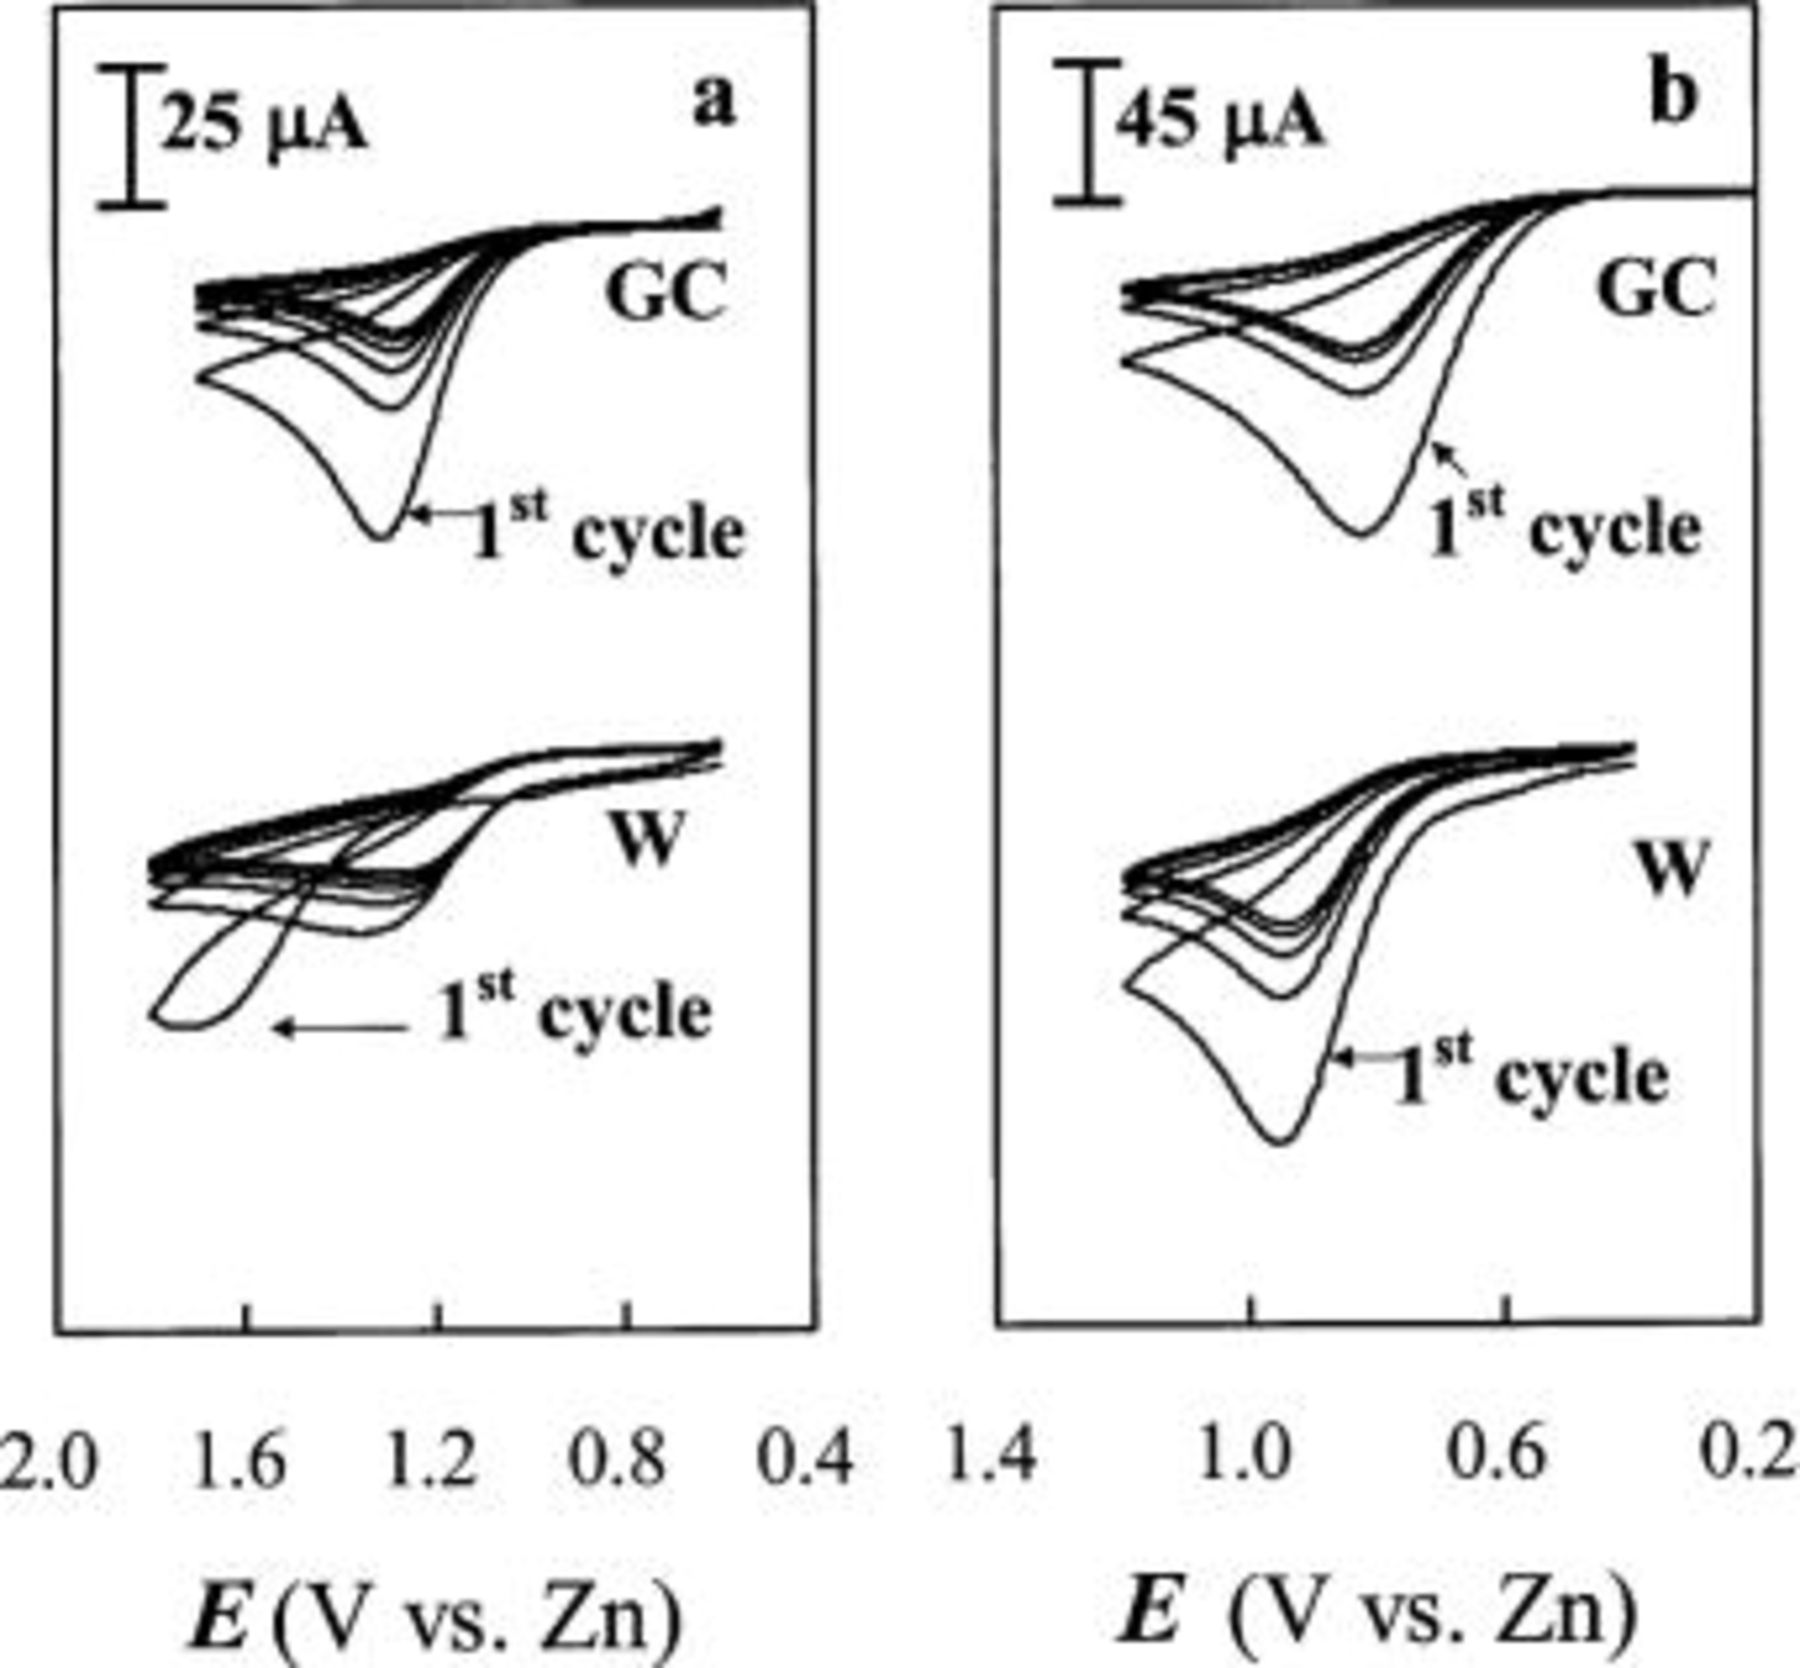
Figure 7. Multiple-scan staircase CVs for the oxidation of Sn(II) at W and GC electrodes in (a) 40-60 mol % and (b) 25-75 mol %  ionic liquids containing 30 mM Sn(II) at 90°C. Scan rate 50 mV/s.
Sampled-current voltammograms and CVs were also recorded for the reduction and oxidation of Sn(II) in basic 25-75 mol %  to verify if adsorption of Sn(II) occurs in this melt. As shown in Fig. 6b and 7b, no indication of adsorption can be observed on both W and GC electrodes in this basic melt. The lack of adsorption in the basic melt can be related to the presence of large amounts of chloride ions in basic melt; studies in aqueous solutions15 have shown that chloride ions may also adsorb on the electrode surface and retard the adsorption of Sn(II) ions. Furthermore, the differences in the solvation of the Sn(II) in acidic and basic melts makes the charge density of the solvated Sn(II) species in the basic melt different from that in the acidic melt.
Nucleation studies of Sn electrodeposition in acidic melt.—
The CVs in Fig. 4 exhibit current loops that are typical of a deposition process requiring nucleation overpotential. The nucleation process at W and GC electrodes in the acidic melt were further investigated by chronoamperometry in unstirred 40-60 mol %  solutions containing Sn(II) by stepping the potential from 0.6 V, where no reduction of Sn(II) would occur, to potentials sufficiently negative to initiate the nucleation/growth process after a short induction time,
  The experimental chronoamperometric current-time transients exhibit the classic shape for a nucleation process, i.e., after the decay of a sharp double-layer capacitive current spike, the faradaic current increases due to the nucleation and growth of the Sn nuclei. At time
  the current reaches a maximum,
  as the discrete diffusion zones of each of the growing Sn crystallites begin to overlap and the diffusion layer begins to thicken. The experimental current-time transients were converted into normalized dimensionless plots of
  vs.
vs.  and fit to the well-known theoretical curves derived for the "instantaneous" and "progressive" 3D nucleation/growth models.22 Before normalization and plotting of the experimental data, the experimental time was corrected for the induction time by redefining the time axis as
  and
and  Figure 8 shows the representative experimental plots for Sn electrodeposition overlaid with the theoretical curves. Clearly, the deposition of Sn on both W and GC electrodes fits well to the model for 3D instantaneous nucleation. Similar behavior has been reported for the electrodeposition of Sn on GC electrodes in acidic
  ionic liquid.17
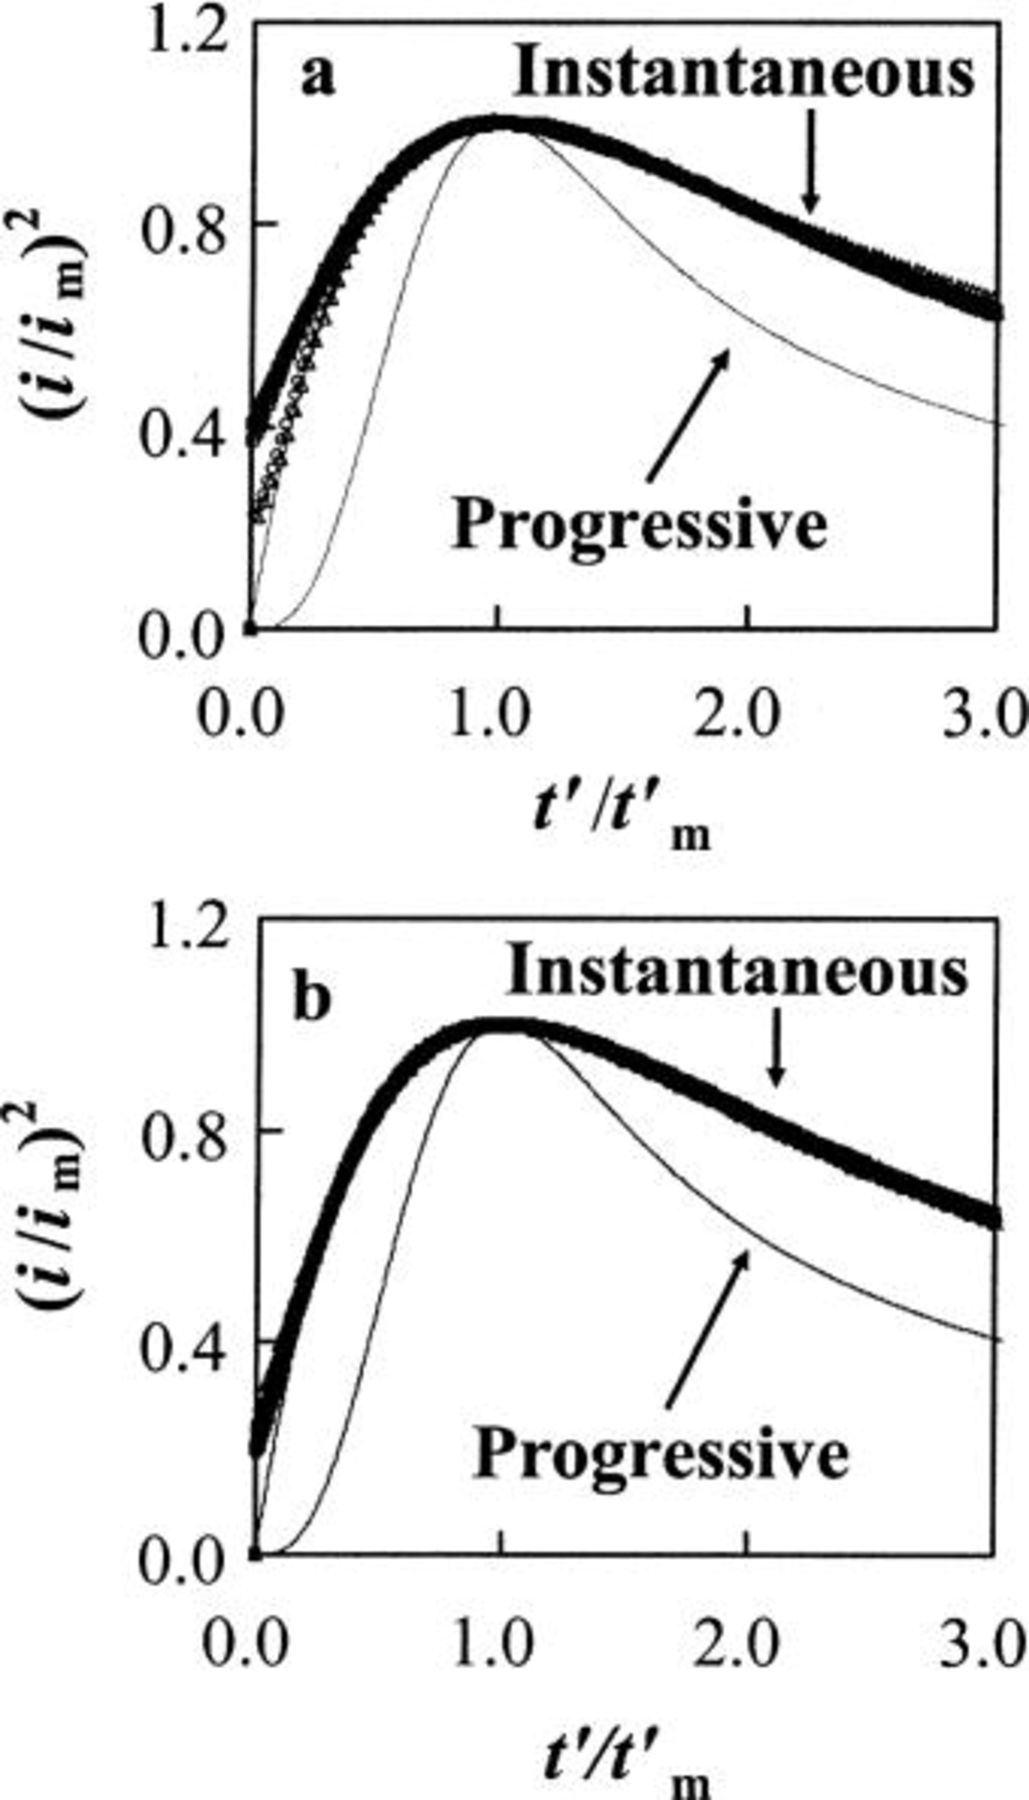
Figure 8. Comparison of the dimensionless experimental current-time transients with the theoretical models for 3D nucleation of the Sn nuclei in an acidic 40-60 mol %  ionic liquid containing 30 mM Sn(II) at 90°C at (a) W electrode: (•) 0.210, (▪) 0.200, (□) 0.190, (○) 0.180, and (▵) 0.170 V, and (b) GC electrode: (•) 0.215, (▪) 0.210, (□) 0.205, (○) 0.200, and (▵) 0.195 V.
Electrodeposition of Sn-Zn codeposit.—
Figure 9 shows the staircase CVs obtained for 30 mM Sn(II) in acidic 40-60 mol %  In these voltammograms the cathodic potential scan was reversed at a more negative potential where the reduction of Zn(II) to Zn metal had occurred. These voltammograms show no extra anodic stripping peak other than those due to the bulk Sn and bulk Zn. According to the phase diagram,23 Sn-Zn is a simple eutectic system; Sn and Zn have very low mutual solubility and do not form any compound at room temperature. Therefore, the Sn-Zn electrodeposit consists of a two-phase mixture of Sn and Zn crystals.
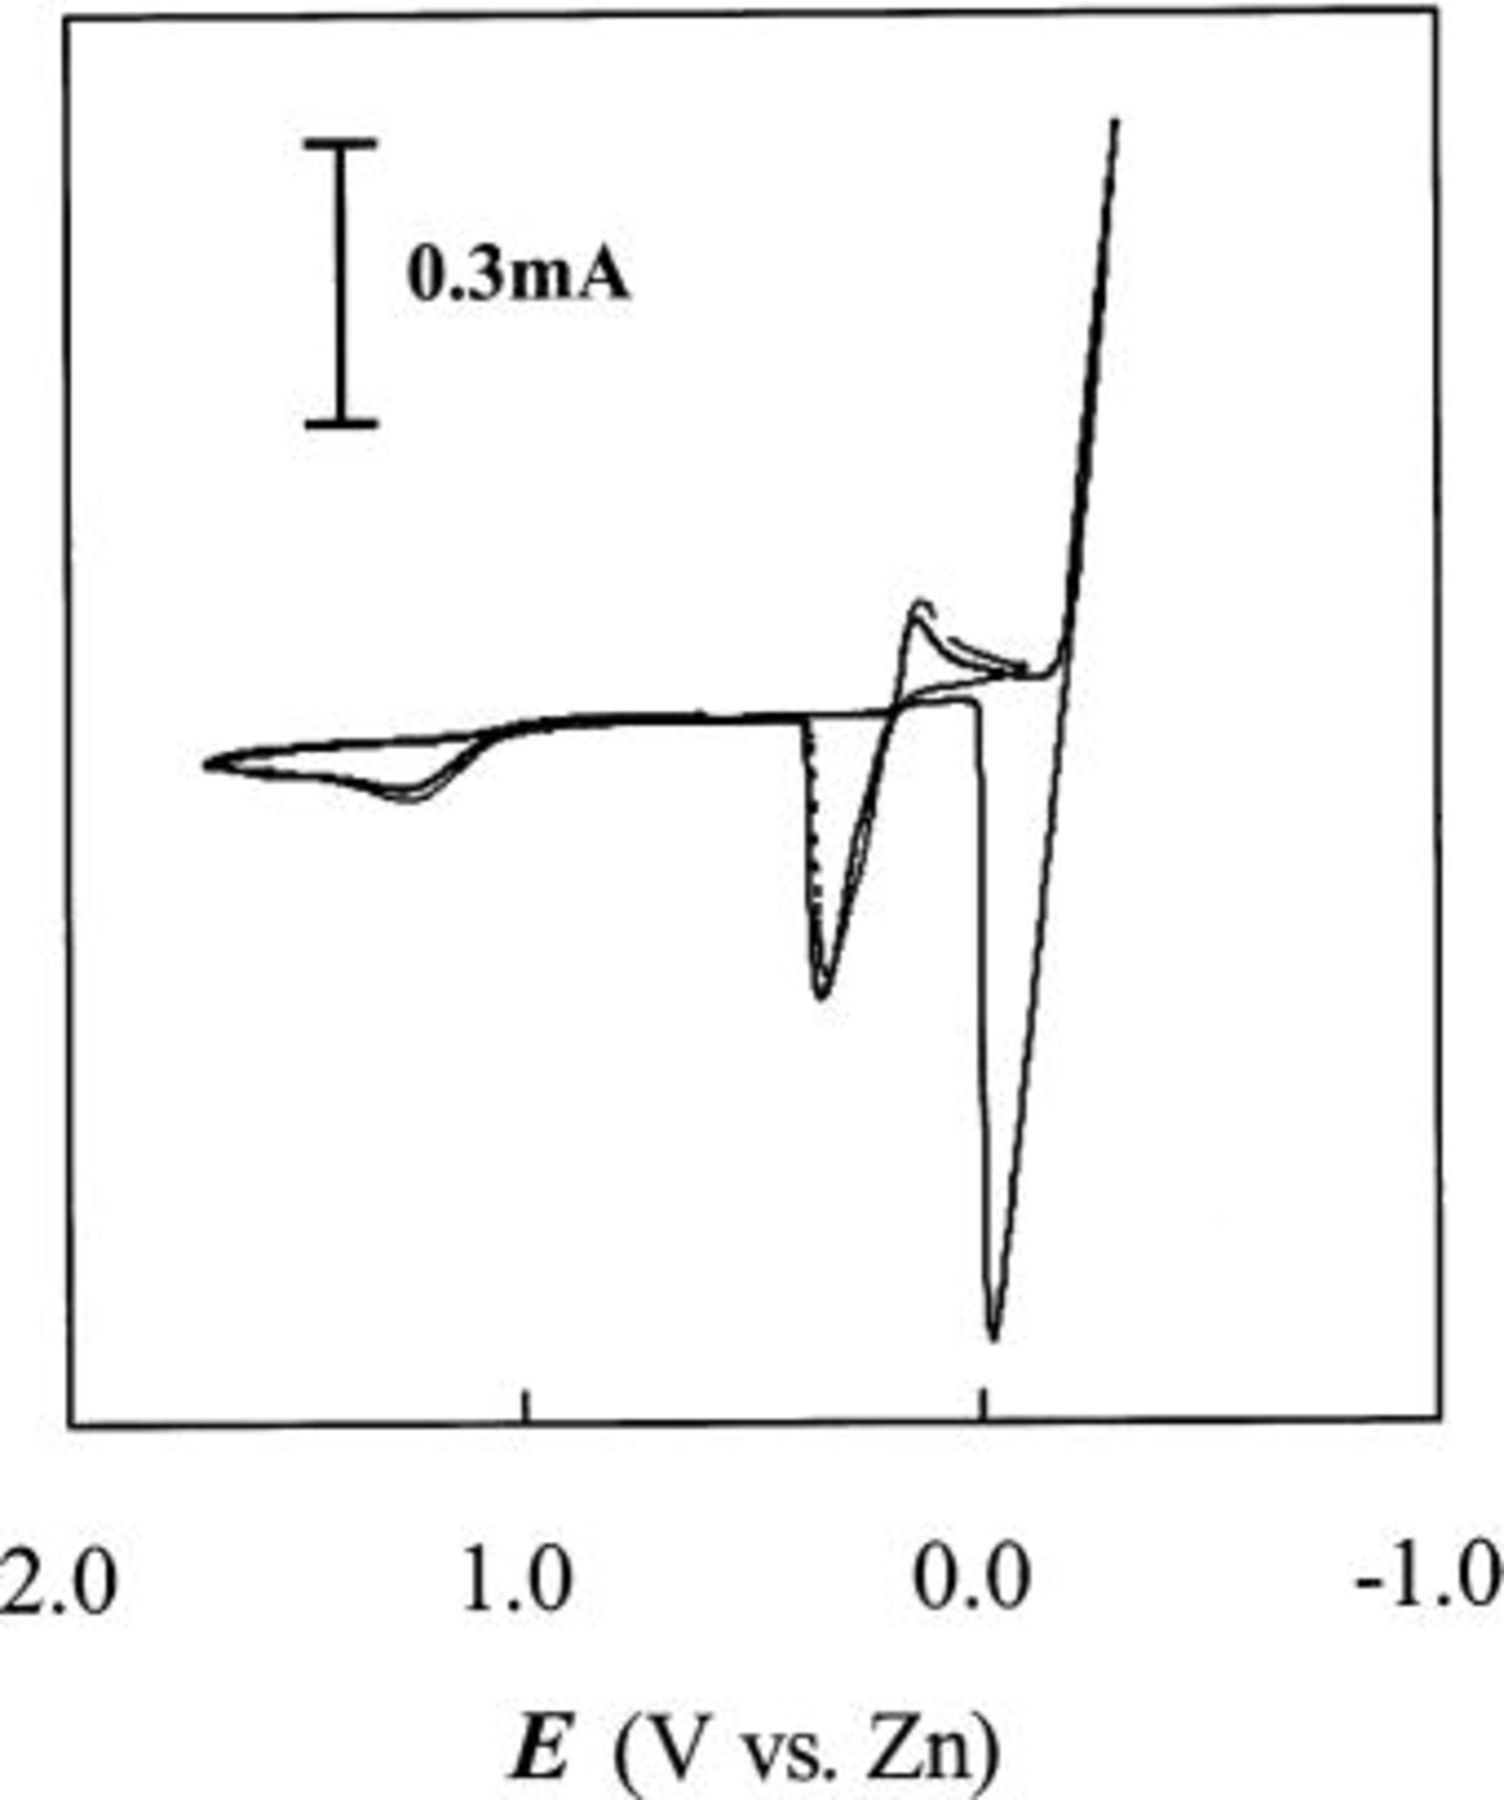
Figure 9. Staircase CVs of Sn(II) at W and GC electrodes in acidic 40-60 mol %  ionic liquid containing 30 mM Sn(II) at 90°C. The potential scan was reversed at (—)
  and (⎯)
  Scan rate was 50 mV/s.
Sampled-current voltammograms contructed from chronoamperometric current-time transients recorded at 90°C on W electrodes in the acidic 40-60 mol %  solutions containing 5, 10, 15, 20, 25, and 30 mM Sn(II) are shown in Fig. 10. Similar to Fig. 6a, the voltammograms acquired in solutions where the Sn(II) concentration was higher than 15 mM display an obvious diminution in current in the potential region extending from about 0.2 to 0.06 V due to the adsorption of Sn(II). However, all these voltammograms do reach the Sn(II) limiting current in the 0.06 to
  potential region. Because these limiting currents scale linearly with Sn(II) concentrations (see inset in Fig. 10), one can estimate the Sn atomic percentage,
  in the Sn-Zn codeposits from the ratio of the Sn(II) limiting current
  to the total current
  in the potential region where the codeposition of Zn with Sn is observed. Because the deposition of Zn occurs after the Sn(II) limiting current has been reached, the presence of a Sn(II) adsorbate should not affect the Sn-Zn codeposit composition calculated from the ratio of
  and
and  The plots of
  vs.
vs.  that were constructed from the ratio of
  obtained from the data taken from Fig. 10 are shown in Fig. 11. These plots show that the
  of Sn in the Sn-Zn codeposits depends on both potential and Sn(II) concentration. With each Sn(II) concentration, the Sn content in the Sn-Zn codeposit decreases as the applied potential becomes more negative. At each applied potential, the Sn content increases with increasing Sn(II) concentration. Similar behavior has been observed for the codeposition of Cd-Zn in the same ionic liquid.11
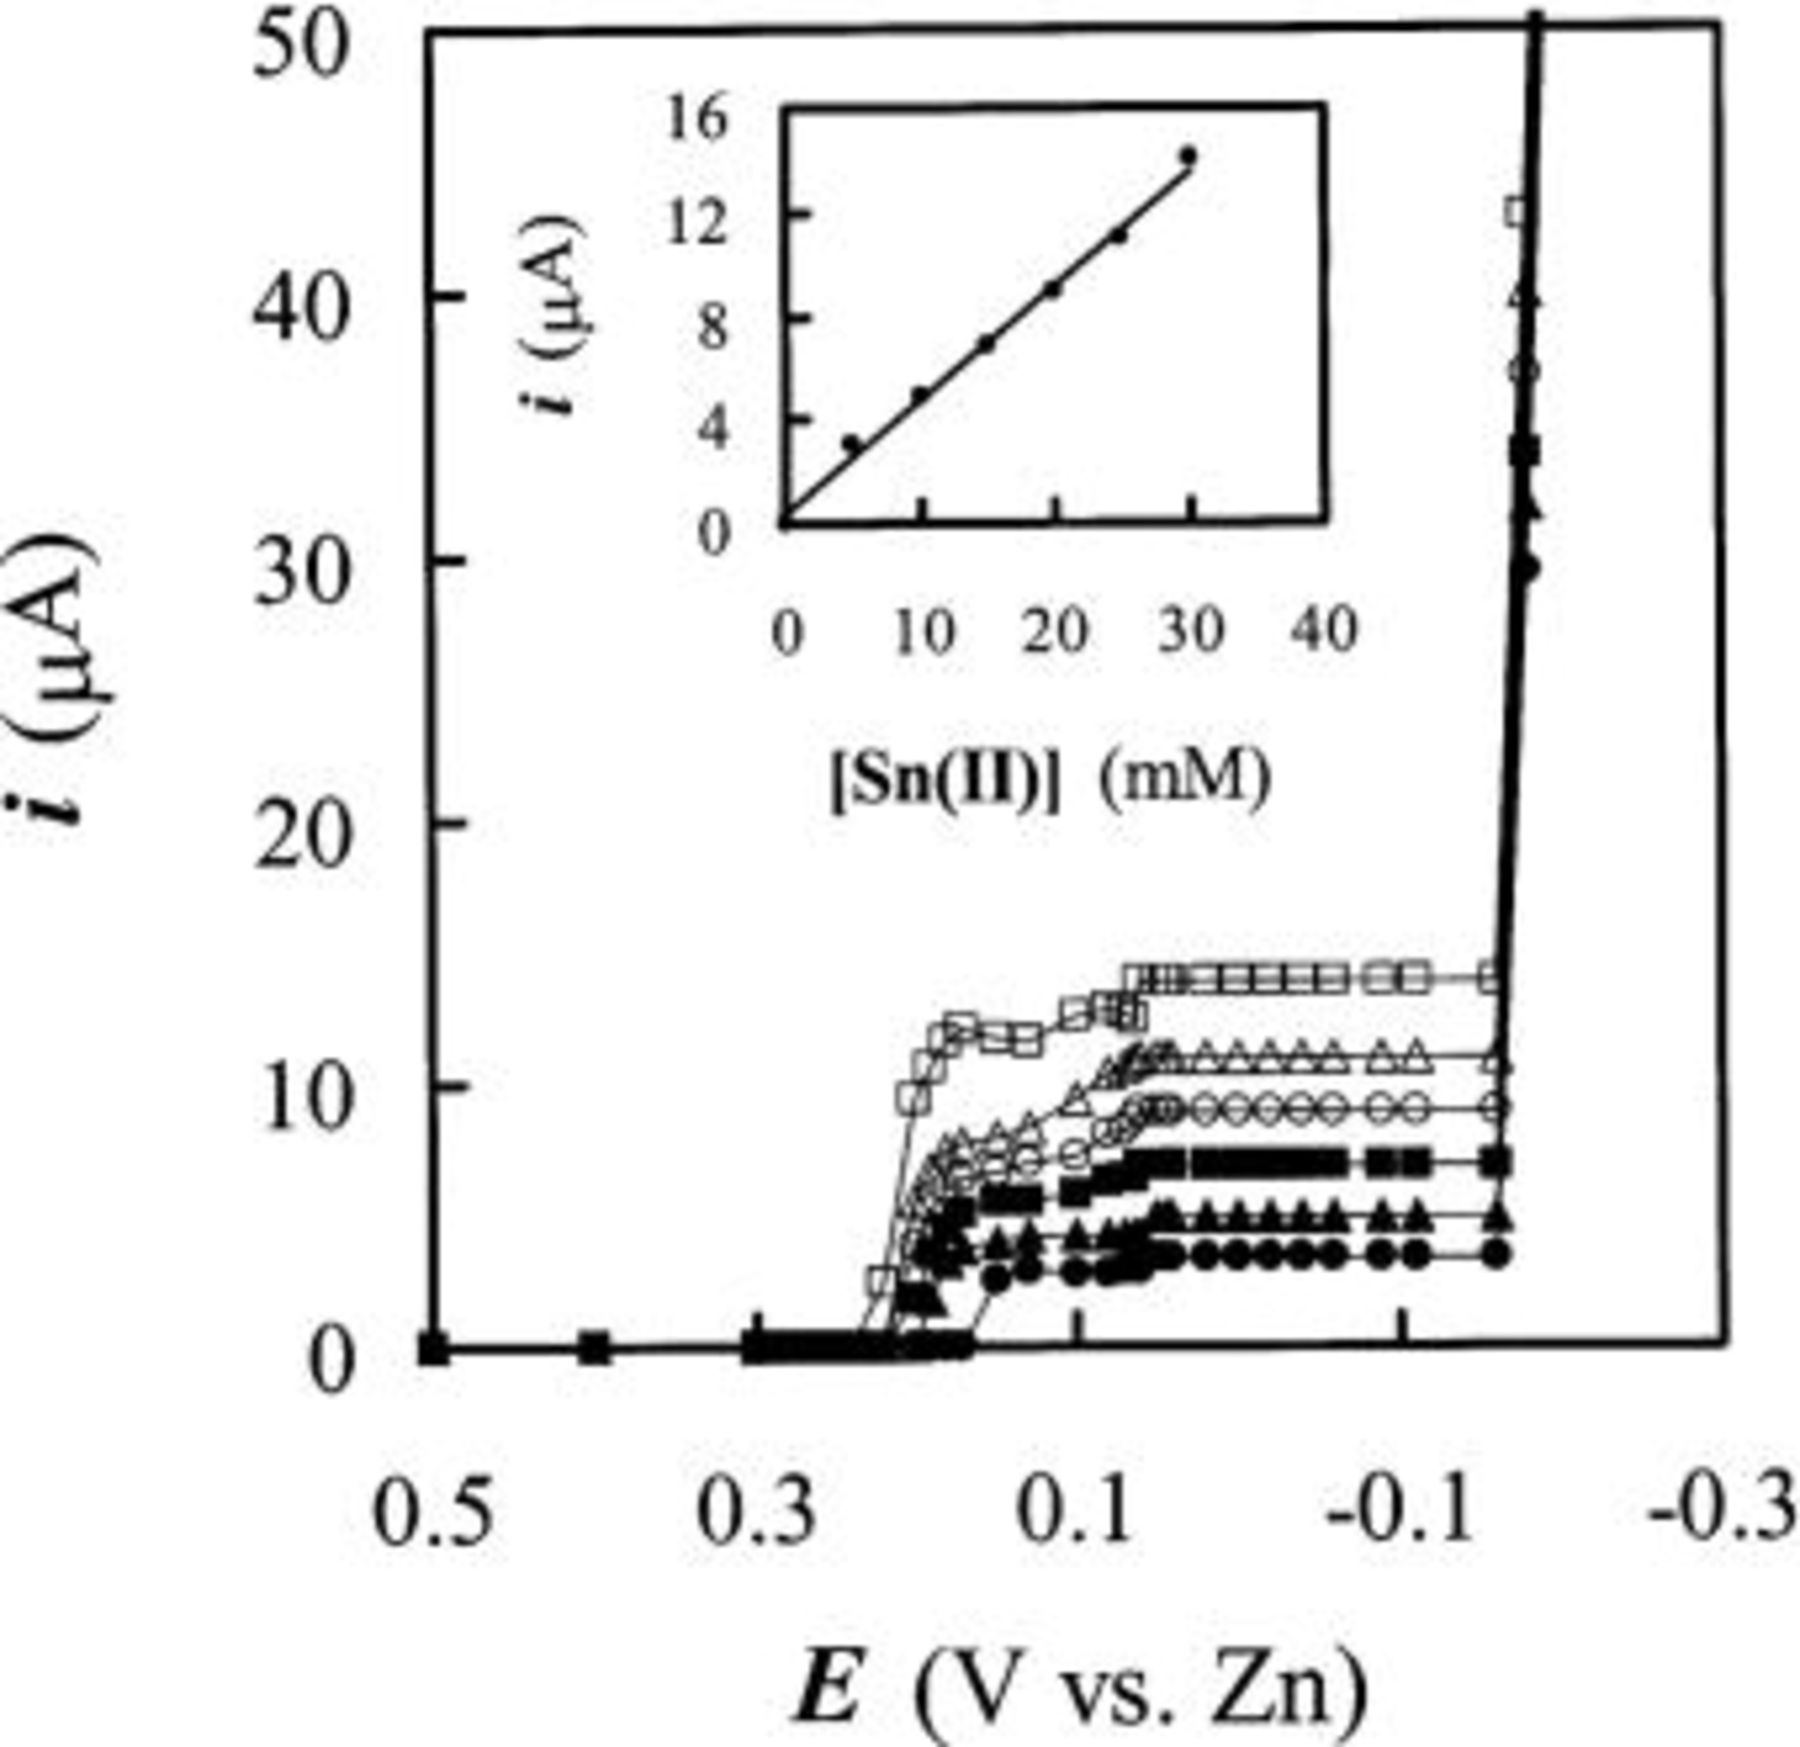
Figure 10. Sampled-current voltammograms constructed from chronoamperometric experiments at W electrode in the 40-60 mol %  ionic liquid containing: (•) 5.0, (▴) 10.0, (▪) 15.0, (○) 20.0, (▵) 25.0, and (□) 30.0 mM Sn(II). The inset plot shows the limiting current vs. Sn(II) concentrations.
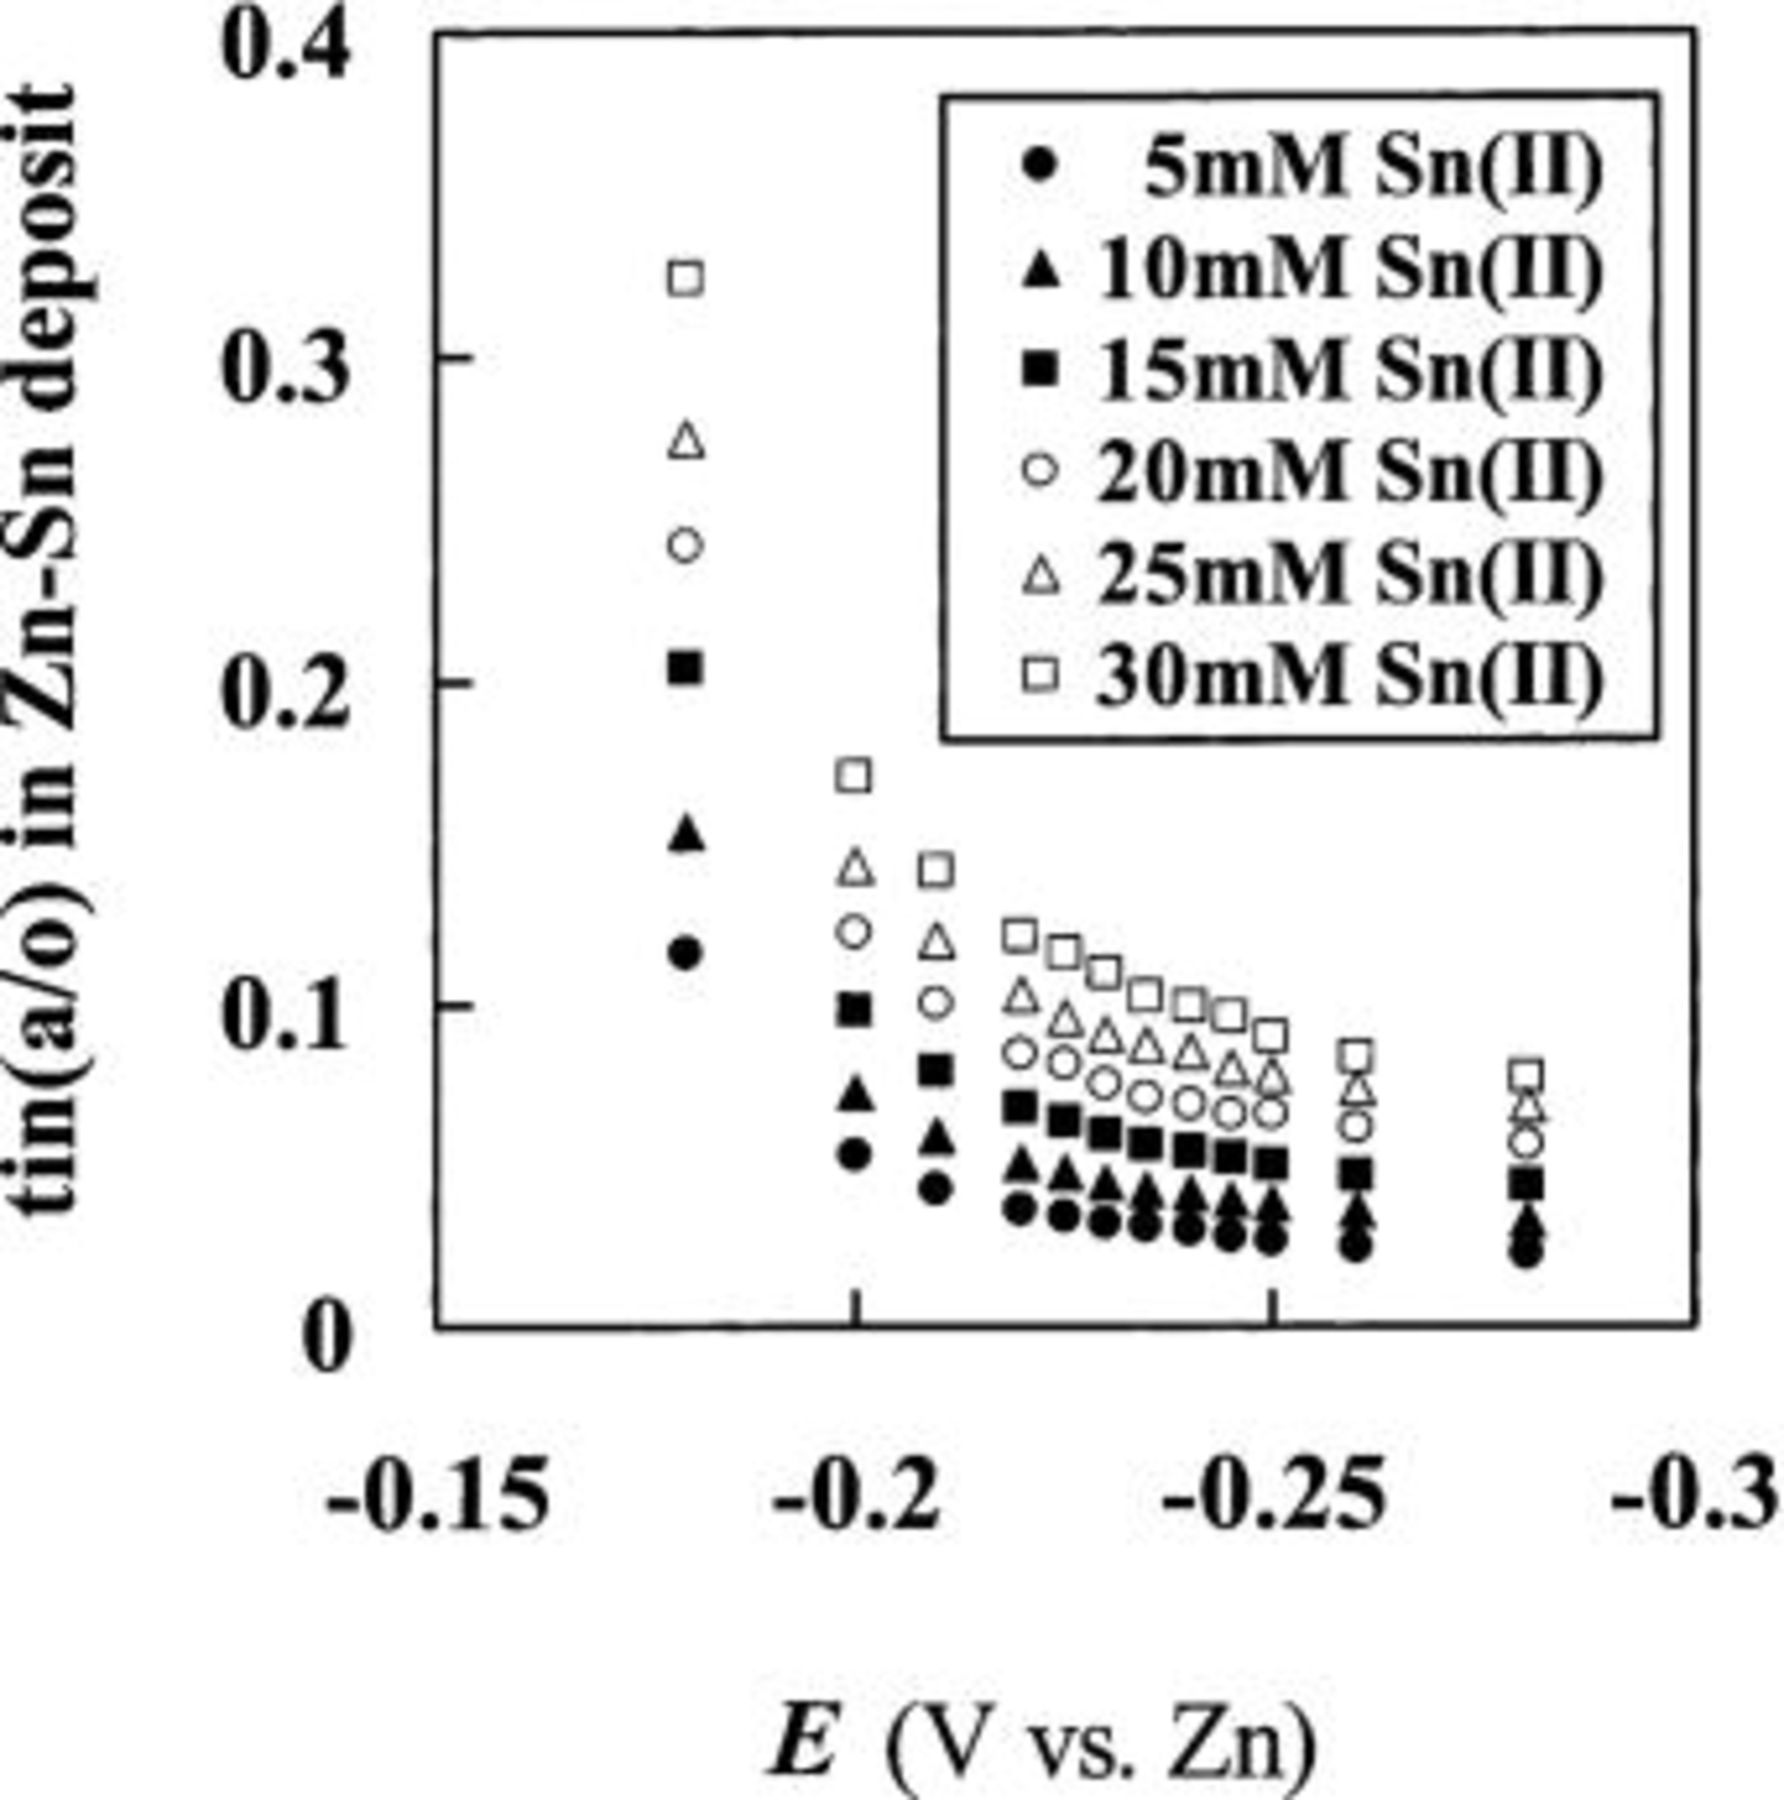
Figure 11. The dependency of the atomic percentage  of Sn in the Sn-Zn codeposits on the deposition potential. The codeposits were prepared at 90°C from 40 to 60 mol %
  ionic liquid solutions containing (•) 5.0, (▴) 10.0, (▪) 15.0, (○) 20.0, (▵) 25.0, and (□) 30.0 mM Sn(II). The
  was calculated from data taken from the sampled-current voltammograms in Fig. 7.
Deposits of Sn and Sn-Zn were prepared with constant potential electrolysis on nickel substrates from solutions of Sn(II) in the acidic 40-60 mol %  melt. Following each deposition experiment, the resulting deposit was rinsed with warm deionized water to remove residual melt and then dried. Two examples of the SEM micrographs of the surface morphologies of pure Sn and Sn-Zn deposits are shown in Fig. 12. The XRD patterns recorded for pure Sn deposit, Sn-Zn codeposit, and pure Zn foil are shown in Fig. 13. This figure confirms that the Sn-Zn codeposits are composed of the distinct Sn and Zn phases. These results are consistent with the phase diagram of the Sn-Zn system, which indicates that the codeposit consists of a two-phase mixture of Sn and Zn crystals.
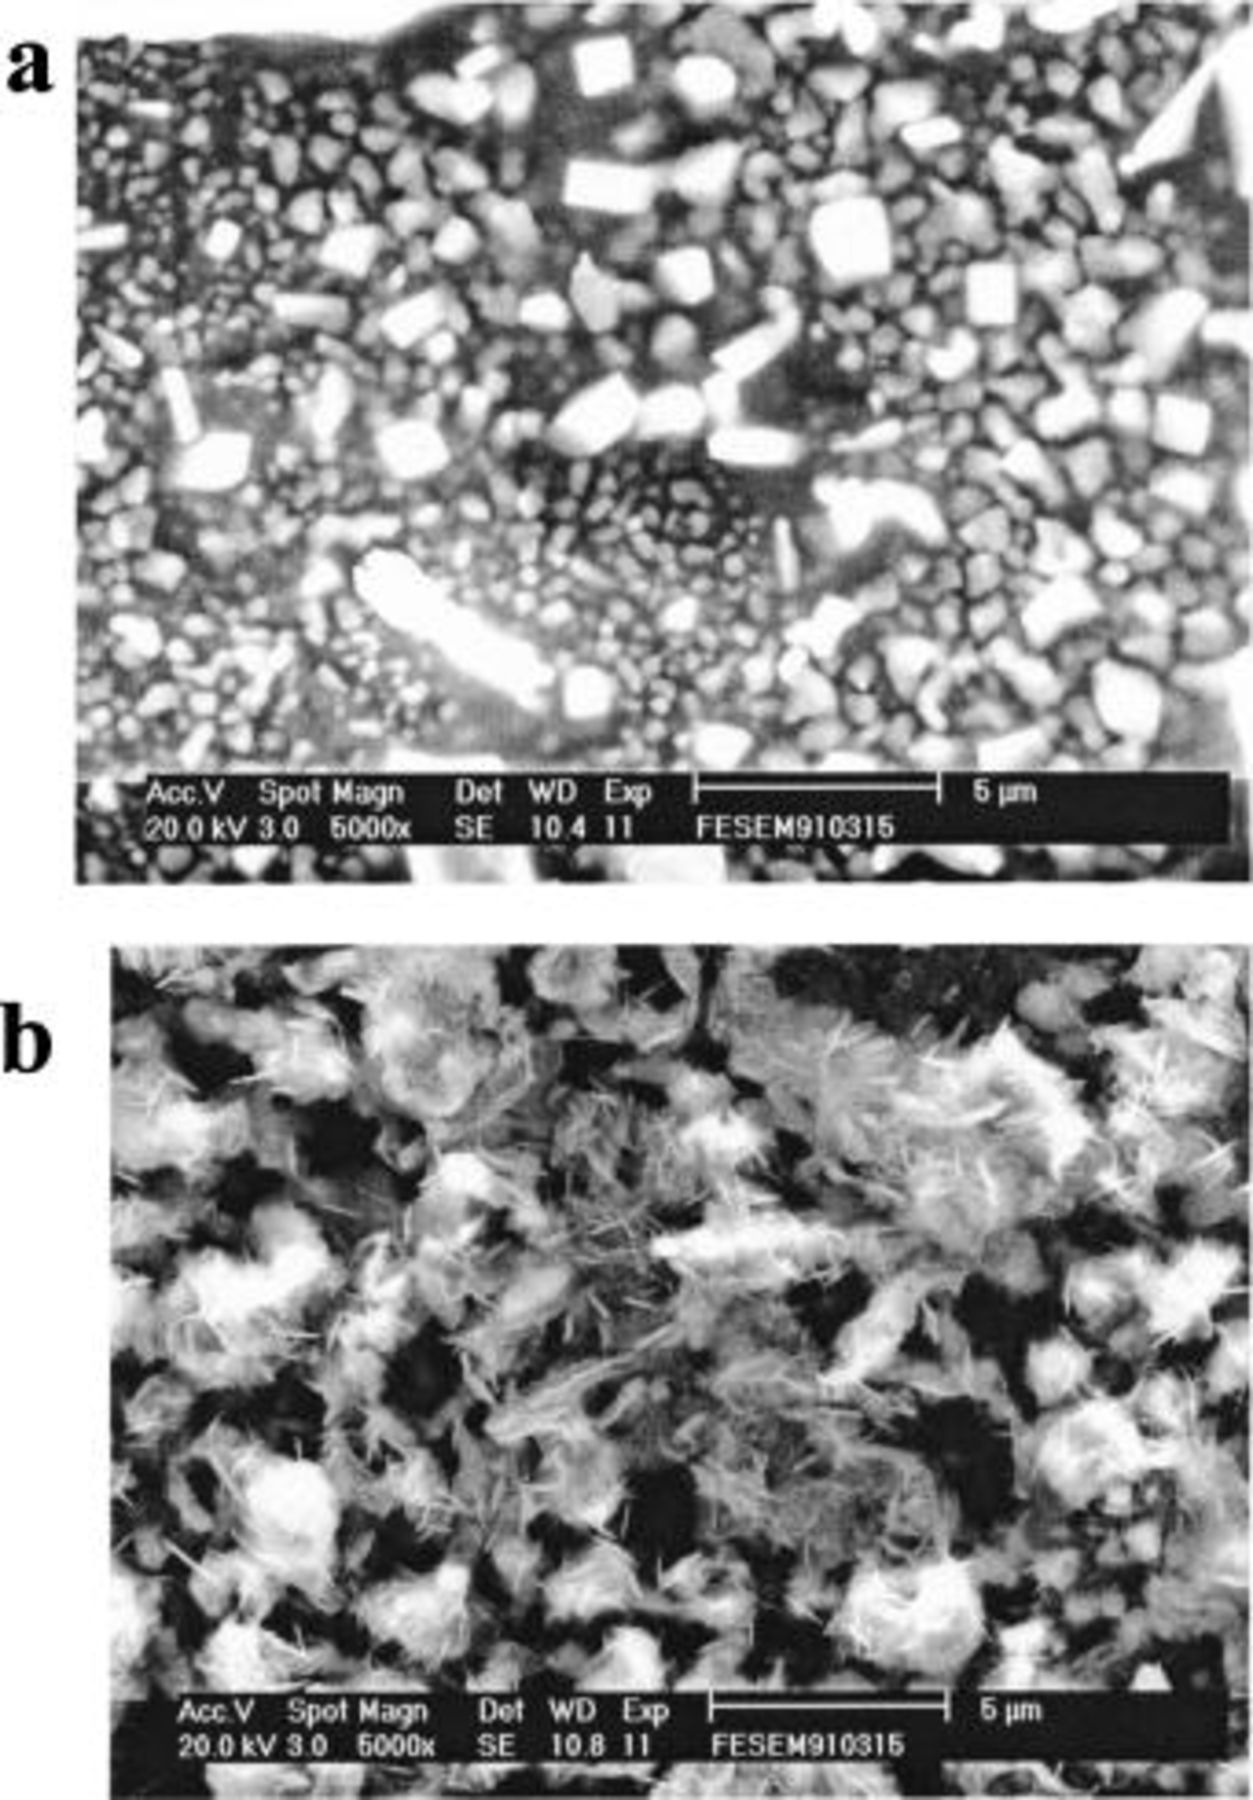
Figure 12. SEM micrographs of (a) Sn and (b) Sn-Zn codeposits that were prepared from the 40-60 mol %  ionic liquid containing 30 mM Sn(II) at 90°C. The deposition potential potentials were (a) 0.07, and (b)
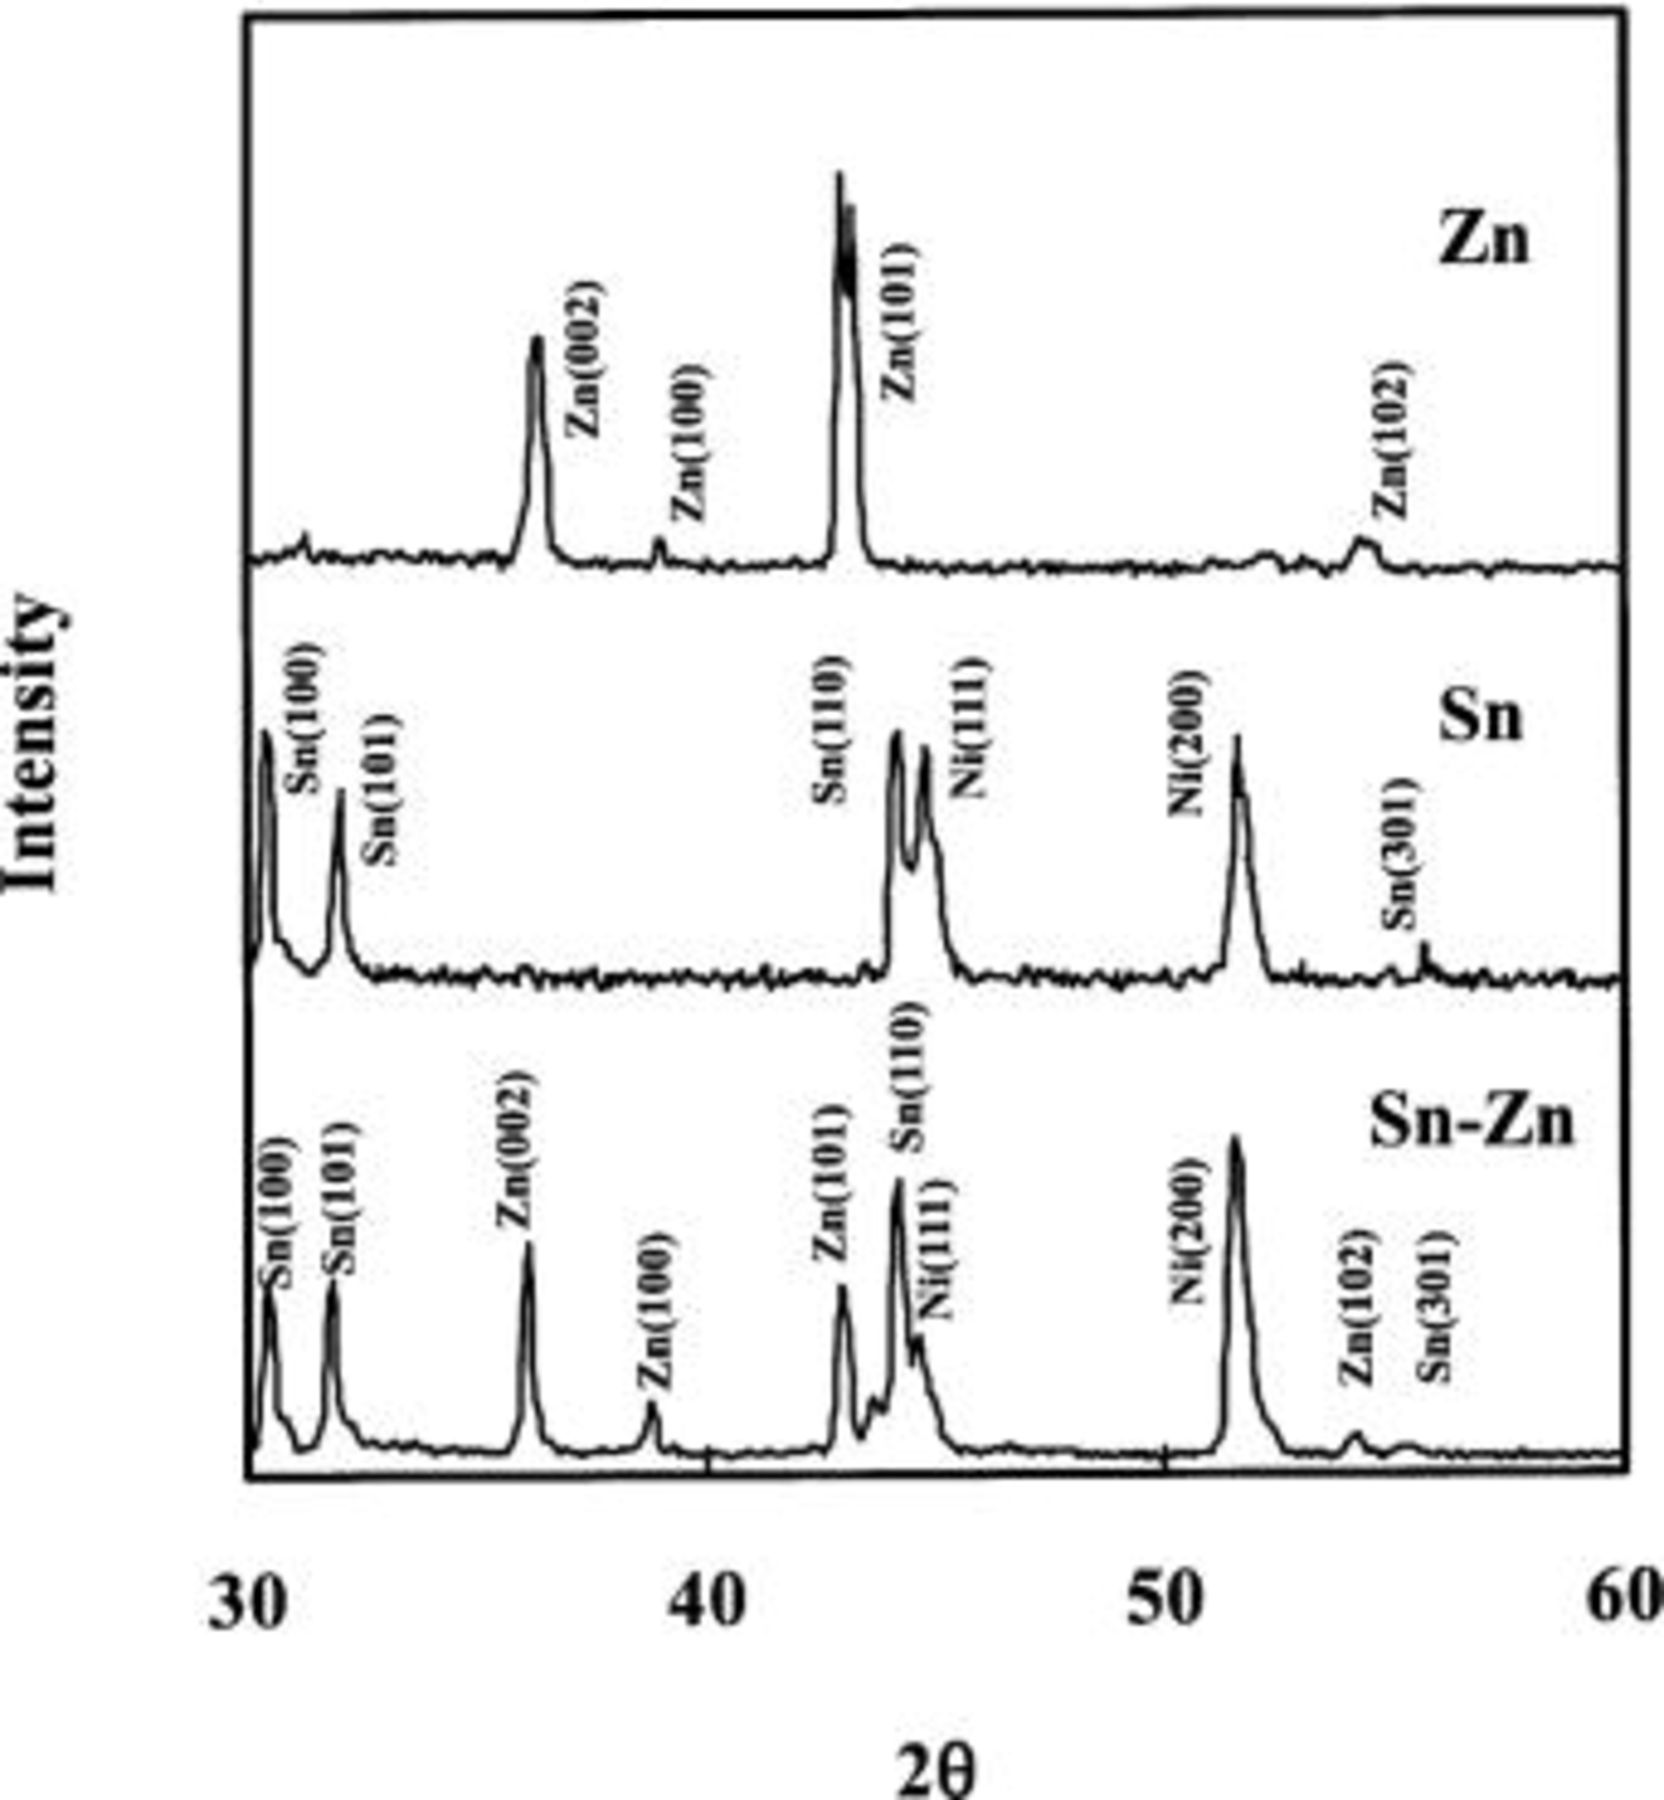
Figure 13. The XRD patterns (Cu Kα) of electrodeposited pure Sn and Sn-Zn codeposit obtained from 30 mM Sn(II) in the 40-60 mol %  ionic liquid at 90°C and of a pure standard Zn foil. The deposition potential potentials were 0.07 V for Sn and
  for Sn-Zn.
Conclusions
The electrodissolution of Sn metal in acidic and basic  ionic liquids produced solutions of Sn(II). Sn(II) can be reduced either to Sn metal or oxidized to Sn(IV). The redox potentials of the Sn(IV)/Sn(II) and Sn(II)/Sn couples shifted negatively as the acidity of the ionic liquid decreased, indicating that the solvation of the Sn(IV) and Sn(II) ions in acidic ionic liquid are different from those in basic ionic liquid. The electrodeposition of Sn exhibits instantaneous 3D nucleation at both W and GC electrodes. Sampled-current voltammograms revealed that the reduction of Sn(II) to Sn metal at W, Ni, and GC electrodes in acidic
  ionic liquid is hindered by the adsorption of Sn(II). The adsorption of Sn(II) also hindered the anodic oxidation of Sn(II) to Sn(IV) at the W electrode. The presence of chloride ions in the basic
  ionic liquid inhibits the adsorption of Sn(II) species on the electrode surfaces. The inhibition of Sn(II) adsorption by chloride ions is similar to that observed in aqueous solution. Overall, the electrochemical behavior of Sn(IV) and Sn(II) species observed in the
  system is similar yet not identical to that observed in the
  system. Codeposits of Sn-Zn could be prepared from the acidic
  ionic liquid. It was found that at a constant Sn(II) concentration, the Sn content in the Sn-Zn codeposits decreased as the deposition potential became more negative. At a constant deposition potential, the Sn content increased with increasing Sn(II) concentration. SEM and XRD data indicated that the Sn-Zn codeposits are composed of a two-phase mixture of Sn and Zn.
Acknowledgments
This work was supported by the National Science Council of the Republic of China, Taiwan.
National Cheng Kung University assisted in meeting the publication costs of this article.