
Abstract
The structural evolution of 
 during charge-discharge cycling is investigated by in situ and ex situ X-ray diffraction (XRD) methods. Rietveld refinements of ex situ XRD patterns for
 taken during the first extraction of lithium show that the transition metal atoms move first to tetrahedral sites in the lithium layers and then to the octahedral sites in the lithium layers. Although previous X-ray absorption near edge and extended X-ray absorption fine structure spectroscopy results showed the migration of Cr, they did not distinguish whether the tetrahedral sites occupied by Cr atoms were located in the transition metal layers or in the lithium layers. The in situ and ex situ XRD measurements reported here show that the transition metal migration process is not fully reversible and that a significant amount of transition metal remains within the lithium layers even after lithium is reinserted during discharge. This is the reason why
 cells have a very large irreversible capacity. The experiments also demonstrate that the first charge of
 cells is different from the following cycles, due to the irreversibility of the transition metal migration. © 2003 The Electrochemical Society. All rights reserved.
Export citation and abstract BibTeX RIS
Recently, a novel layered oxide cathode  was reported and has been widely investigated.1
2
3
4
5
6 In this compound, the Mn atoms are in the 4+ oxidation state while the Cr atoms are in the 3+ oxidation state. When
was reported and has been widely investigated.1
2
3
4
5
6 In this compound, the Mn atoms are in the 4+ oxidation state while the Cr atoms are in the 3+ oxidation state. When  is used as an electrode in a Li cell, the redox reaction is thought to take place on Cr.3
4
5
6
is used as an electrode in a Li cell, the redox reaction is thought to take place on Cr.3
4
5
6
 can be considered as
  substitution for Li and
  in the transition metal layers of
 In Ref. 7, we showed that the solid solution series
 can be synthesized. The transition metal layers contain
 and
and  The structure and electrochemistry of the whole range of
 samples has been reported in Ref. 8. Electrochemical tests show that
  with
with  delivers a reversible capacity of about 130 mAh/g between 2.0 and 4.35 V vs. Li/Li+. Between 2.0 and 4.8 V,
  with
with  delivers a reversible capacity of about 230 mAh/g via a partial loss of oxygen during the first charge process.8 All the
  samples have very large irreversible capacities during the first cycle.
X-ray absorption near edge and extended X-ray absorption fine structure spectroscopy (XANES and EXAFS, respectively), have been performed on  6 These experiments suggest that
  is oxidized to
  when Li is extracted from the compound and the formed
  is found in sites coordinated tetrahedrally by oxygen. These experiments did not determine the position of the tetrahedral site. If
  moves to a tetrahedral site that shares faces with octahedral sites where
  or
or  are already located, there is a strong repulsive interaction between
  and
and  (or
(or  . This repulsion must affect the migration of the
  ions. Furthermore, such a migration should strongly affect the intensities of the X-ray diffraction (XRD) patterns of the electrode. However, we did not observe a strong intensity variation in the in situ XRD results of Whitfield et al.4
In Ref. 1, Pan et al. argue that  consists of
  -like and
  -doped
  regions or domains. However, the Coulomb repulsion between two
  ions in the lattice is larger than the Coulomb repulsion between a
  and a
and a  ion. Thus, one expects the Cr and Mn to be well mixed as Mn should try to get far way from itself. Furthermore, we have shown in Ref. 7 that the entire solid solution series between
  and
and  can be made and that the lattice constants basically follow Vegard's law. This suggests homogeneous mixing of Mn and Cr and we assume that to be the case in our description of the structure of the materials given.
The transition metal migration can be studied by XRD experiments. In the transition metal layer of  the Coulomb repulsion between
  and
and  drives them to form
  a superlattice ordering. When
  substitutes for Li and
  in the transition metal layer of
  to form
 the superlattice ordering is disturbed and becomes short-ranged. In the structure of
 and
and  are believed to be "randomly" distributed in the transition metal sites. In the introduction of Ref. 9, Lu et al. have explained that when the superlattice ordering of
  and
and  becomes short-ranged, the structure of
  can be approximated to be the same as that of
  In fact, in Ref. 3 and 8, it has been shown that the XRD patterns of
  can be well fitted by means of Rietveld refinement based on the structure of
  (In addition, this structure analysis method has successfully explained the XRD and neutron diffraction patterns of a similar series of
  samples.9) If the migration of Cr takes place during the charge of the cell, the electron density distribution changes dramatically and the intensities of the Bragg diffraction peaks change. Therefore, using Rietveld refinement of XRD patterns of
  collected during cycling, we believe that it is possible to determine the position of the migrating transition metals. X-ray studies such as the one described in this paper cannot distinguish between Mn and Cr, however, neutron diffraction experiments could.
It is also important to understand why 
 cells have large irreversible capacities and the experiments reported here shed light on this problem. The composition
 is quite close to
  on which the EXAFS and XANES results6 were made. Therefore, we reinvestigated the
 sample (reported in Ref. 8) by in situ and ex situ XRD.
Experimental
 (98%, Aldrich),
  (99%, Aldrich), and
  (99+%, Aldrich) were used as starting materials. Samples of
 were prepared by the "sol-gel" method.8
10
11 Stoichiometric amounts of
were prepared by the "sol-gel" method.8
10
11 Stoichiometric amounts of 
 and
and  were dissolved in about 100 mL distilled water in a 500 mL beaker while stirring. The pH of the solution was adjusted to about 10 by adding
  solution and precipitation occurred. Then the beaker was placed on a hot plate to evaporate the water slowly while stirring. After most of water evaporated, the beaker was put in a muffle oven and dried in air at 130°C overnight. The dried precipitate was ground in an automatic grinder and heated in air at 480°C for 12 h. After cooling to room temperature, the heated powder was ground in an automatic grinder again and pellets about 5 mm thick were pressed. The pellets were heated in an argon stream at 900°C for 3 h using a Lindberg tube furnace. The oven was heated to 900°C at a rate of 600°C/h. After dwelling at 900°C for 3 h, the oven was cooled to room temperature at a rate of 600°C/h. Before heating, argon was purged through the tube oven for about 3 h to remove residual oxygen from the tube.
XRD was made using a Siemens D500 diffractometer equipped with a Cu target X-ray tube and a diffracted beam monochromator. Profile refinement of the collected data was made using Hill and Howard's version of the Rietveld Program Rietica.12 Pseudo-Voigt peak shape functions were used during the refinements. The thermal factor was set to zero for all atoms.
"Bellcore-type" electrodes were prepared for the electrochemical tests. Z grams of the sample were mixed with ca. 0.1 Z g (by weight) super S carbon black and 0.25 Z g Kynar 2801, poly(vinyl difluoride)-hexafluoropropylene) (PVDF-HFP, Elf-Atochem). This mixture was added to 3.1Z g acetone and 0.4Z g dibutyl phthalate (DBP, Aldrich) to dissolve the polymer. Normally, Z is about 1. After several hours of stirring and shaking, the slurry was then spread on a glass plate using a notch bar spreader to obtain an even thickness of 0.66 mm. When the acetone evaporated, the dry films were peeled off the plate and punched into circular disks with a diameter of 12 mm. The punched electrode was washed several times in anhydrous diethyl ether to remove the DBP. The washed electrode was dried at 90°C overnight before use. Using the positive electrodes, type 2325 coin cells (23 mm diam, 2.5 mm thick) were assembled in an argon glove box  with lithium as the anode, Celgard 2502 membrane as the separator, and 1 M
  in 33% ethylene carbonate (EC) +67% diethyl carbonate (DEC) (Mitsubishi Chemical) as the electrolyte. Usually, the cathode mass was around 20 mg. The cells were tested using constant charge and discharge currents between the desired potential limits.
In situ XRD measurements were made in the same coin-type cells, except the can of the cell had a circular hole that was replaced by a beryllium window.13 The cathode electrode was facing the beryllium so that diffraction patterns with minimal contamination from cell hardware could be obtained. Cells were charged and discharged using constant currents of 10 mA/g and XRD scans were collected sequentially. The Bragg peaks from the in situ XRD experiments were indexed and the lattice parameters were calculated by the least-squares method. A correction for off-axis displacement of the electrode was included.
In order to examine the crystal structure of 
 in a variety of charge/discharge states, electrochemical cells were prepared for ex situ diffraction studies. Cells using electrodes of
 were charged or discharged to the target voltage using a specific current of 10 mA/g by the "signature method." 14 (In this case the "signature method" was used to simulate constant potential charging or discharging.) When the cells reached the target potential they were placed on open circuit for 20 min, then charged (or discharged) to the target potential with reduced current (usually 70% of the previous value). After the current decayed to below 2 mA/g the cells were disassembled in a helium-filled glove box and the positive electrode was recovered. In the glove box, the electrode was washed with dimethylcarbonate (DMC) solvent to remove the dissolved salt and residual EC. Still working in the He-filled glove box, the electrode was placed on a zero background holder (510-cut Si) equipped with an aluminized Mylar window to prevent exposure to air15 and a diffraction pattern was recorded. Rietveld refinement was then used to obtain the structural parameters of the sample.
Results
In situ X-ray diffraction study.—
Figure 1 shows in situ XRD results for electrode 
 between 2.0 and 4.8 V vs.
  In the right panel of Fig. 1, the charge-discharge curve of the cell is given. The specific current used was 10 mA/g. The left panel shows the evolution of the in situ XRD patterns during the cycling. As a comparison, the XRD pattern of the original powder sample of
 is shown in the bottom panel. Comparing the top and bottom panels, there are several extra peaks in the top panel which do not shift during cycling. These peaks are caused by the cell parts, for example, the Be window. The peaks from the electrode shift smoothly during cycling. This implies that structural symmetry of the electrode material does not change and the electrode remains in the
  structure during cycling. The same conclusion can also be reached by considering the shape of charge-discharge curves that do not show distinct plateaus that would indicate structural changes.
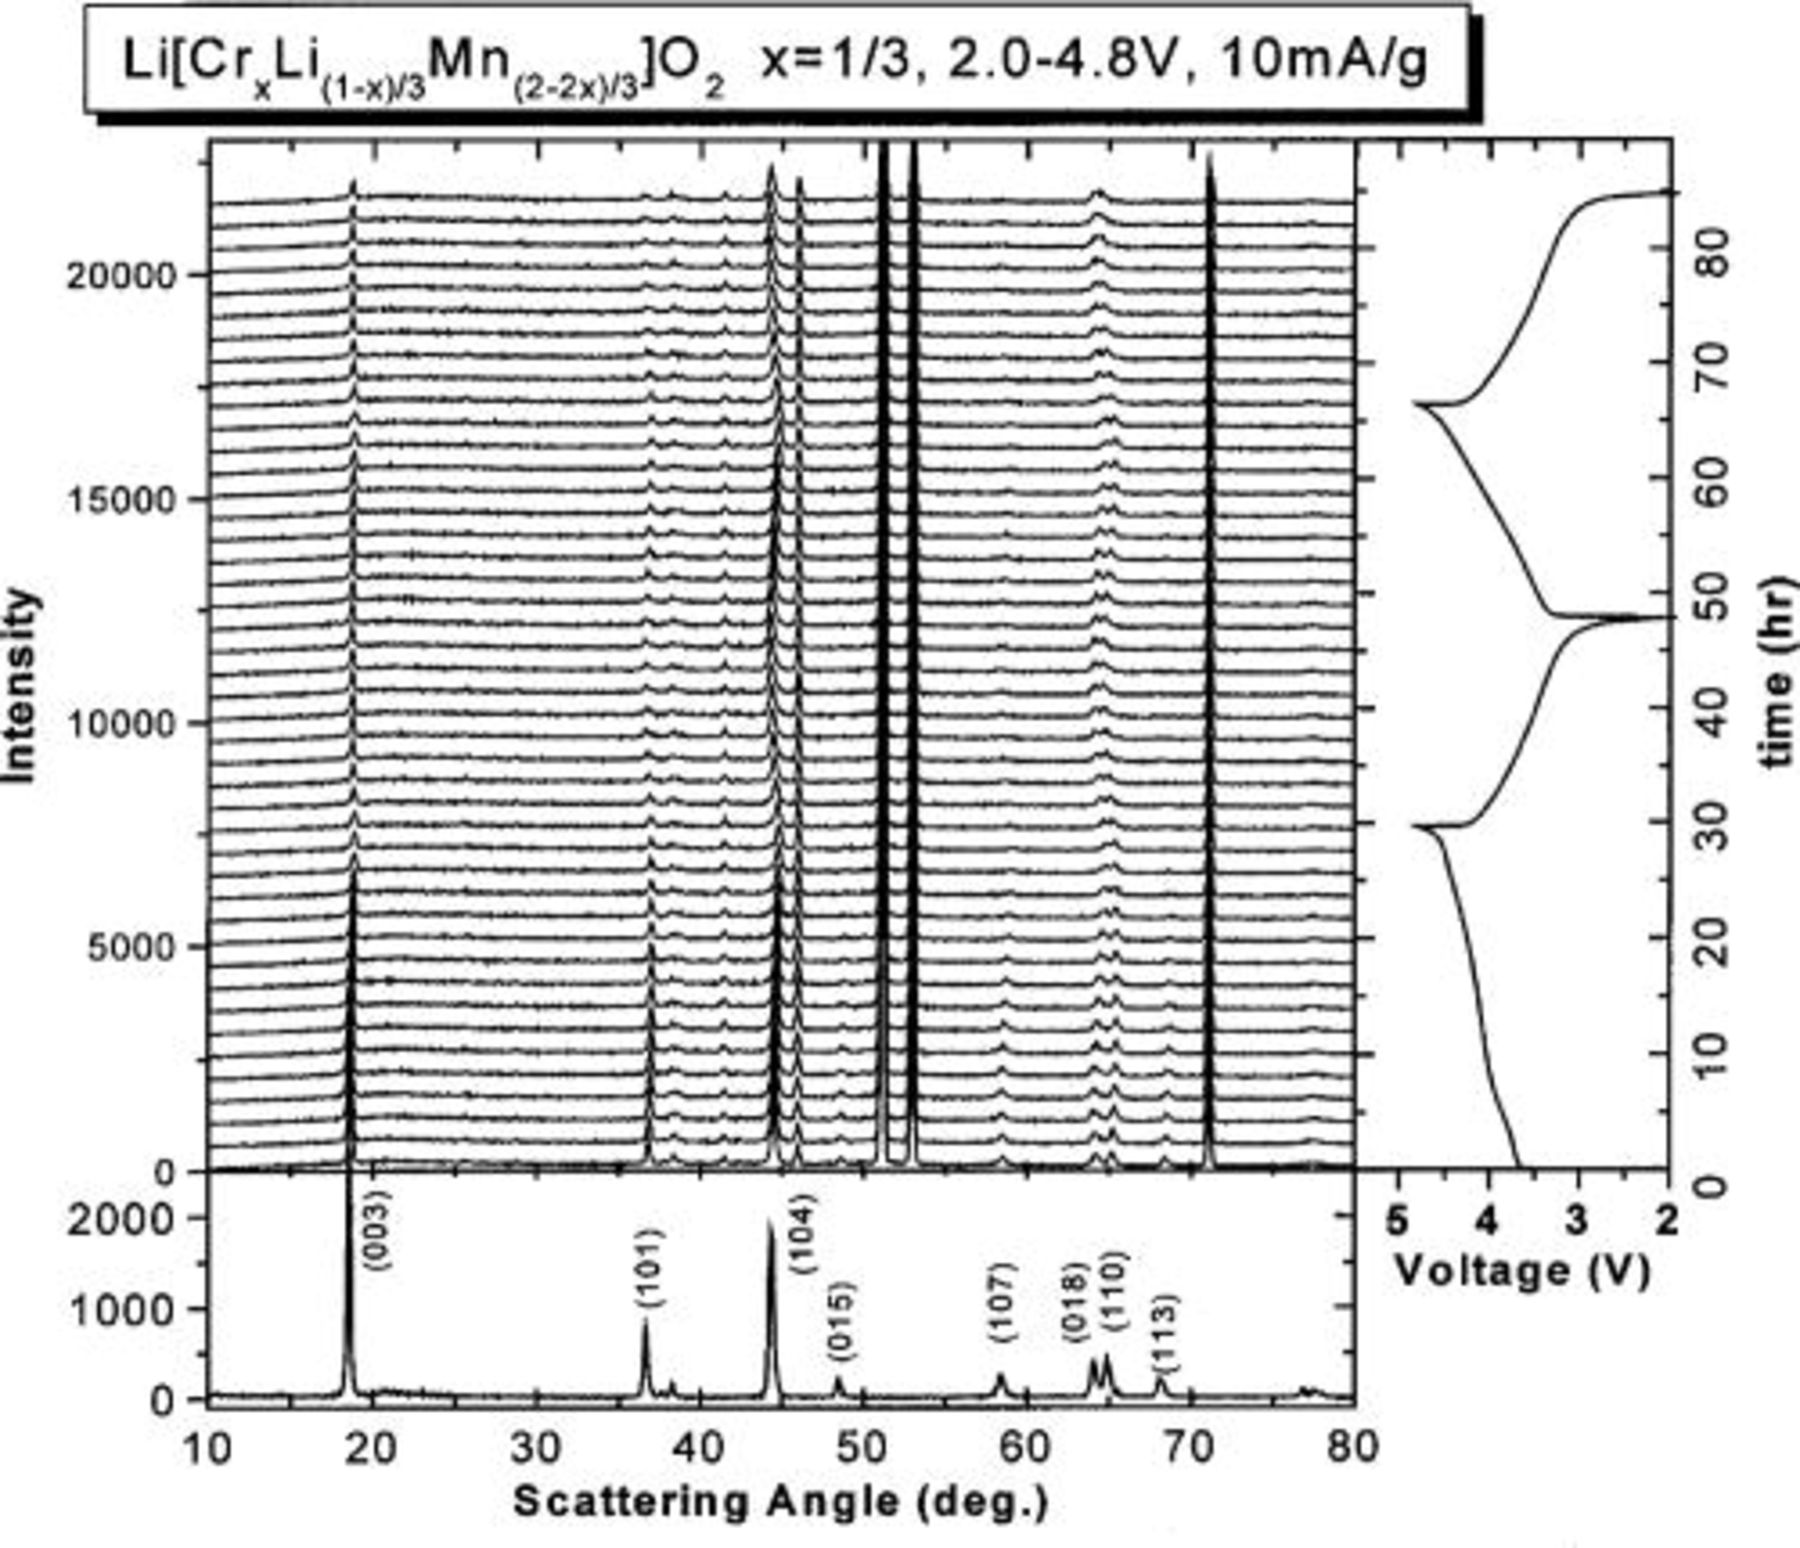
Figure 1. The in situ XRD patterns of 
 between 2.0 and 4.8 V vs. Li/Li+ using a specific current of 10 mA/g. The bottom section is the XRD pattern of the
 powder. The right side is the charge-discharge curve of the
 cell.
cell.
Figure 2 shows the lattice parameters of the electrode and the charge-discharge curve during cycling. The a axis gradually decreases during the first charge process. The c axis increases until about 4.0 V and then dramatically decreases. At the top of the first charge (4.8 V), the c axis is much smaller than that at the starting point. This suggests that most of the lithium has been extracted from the lithium layers of the material. The first charge capacity (∼300 mAh/g) is very close to the theoretical value corresponding to full removal of the lithium atoms in the lithium layer (325.9 mAh/g).
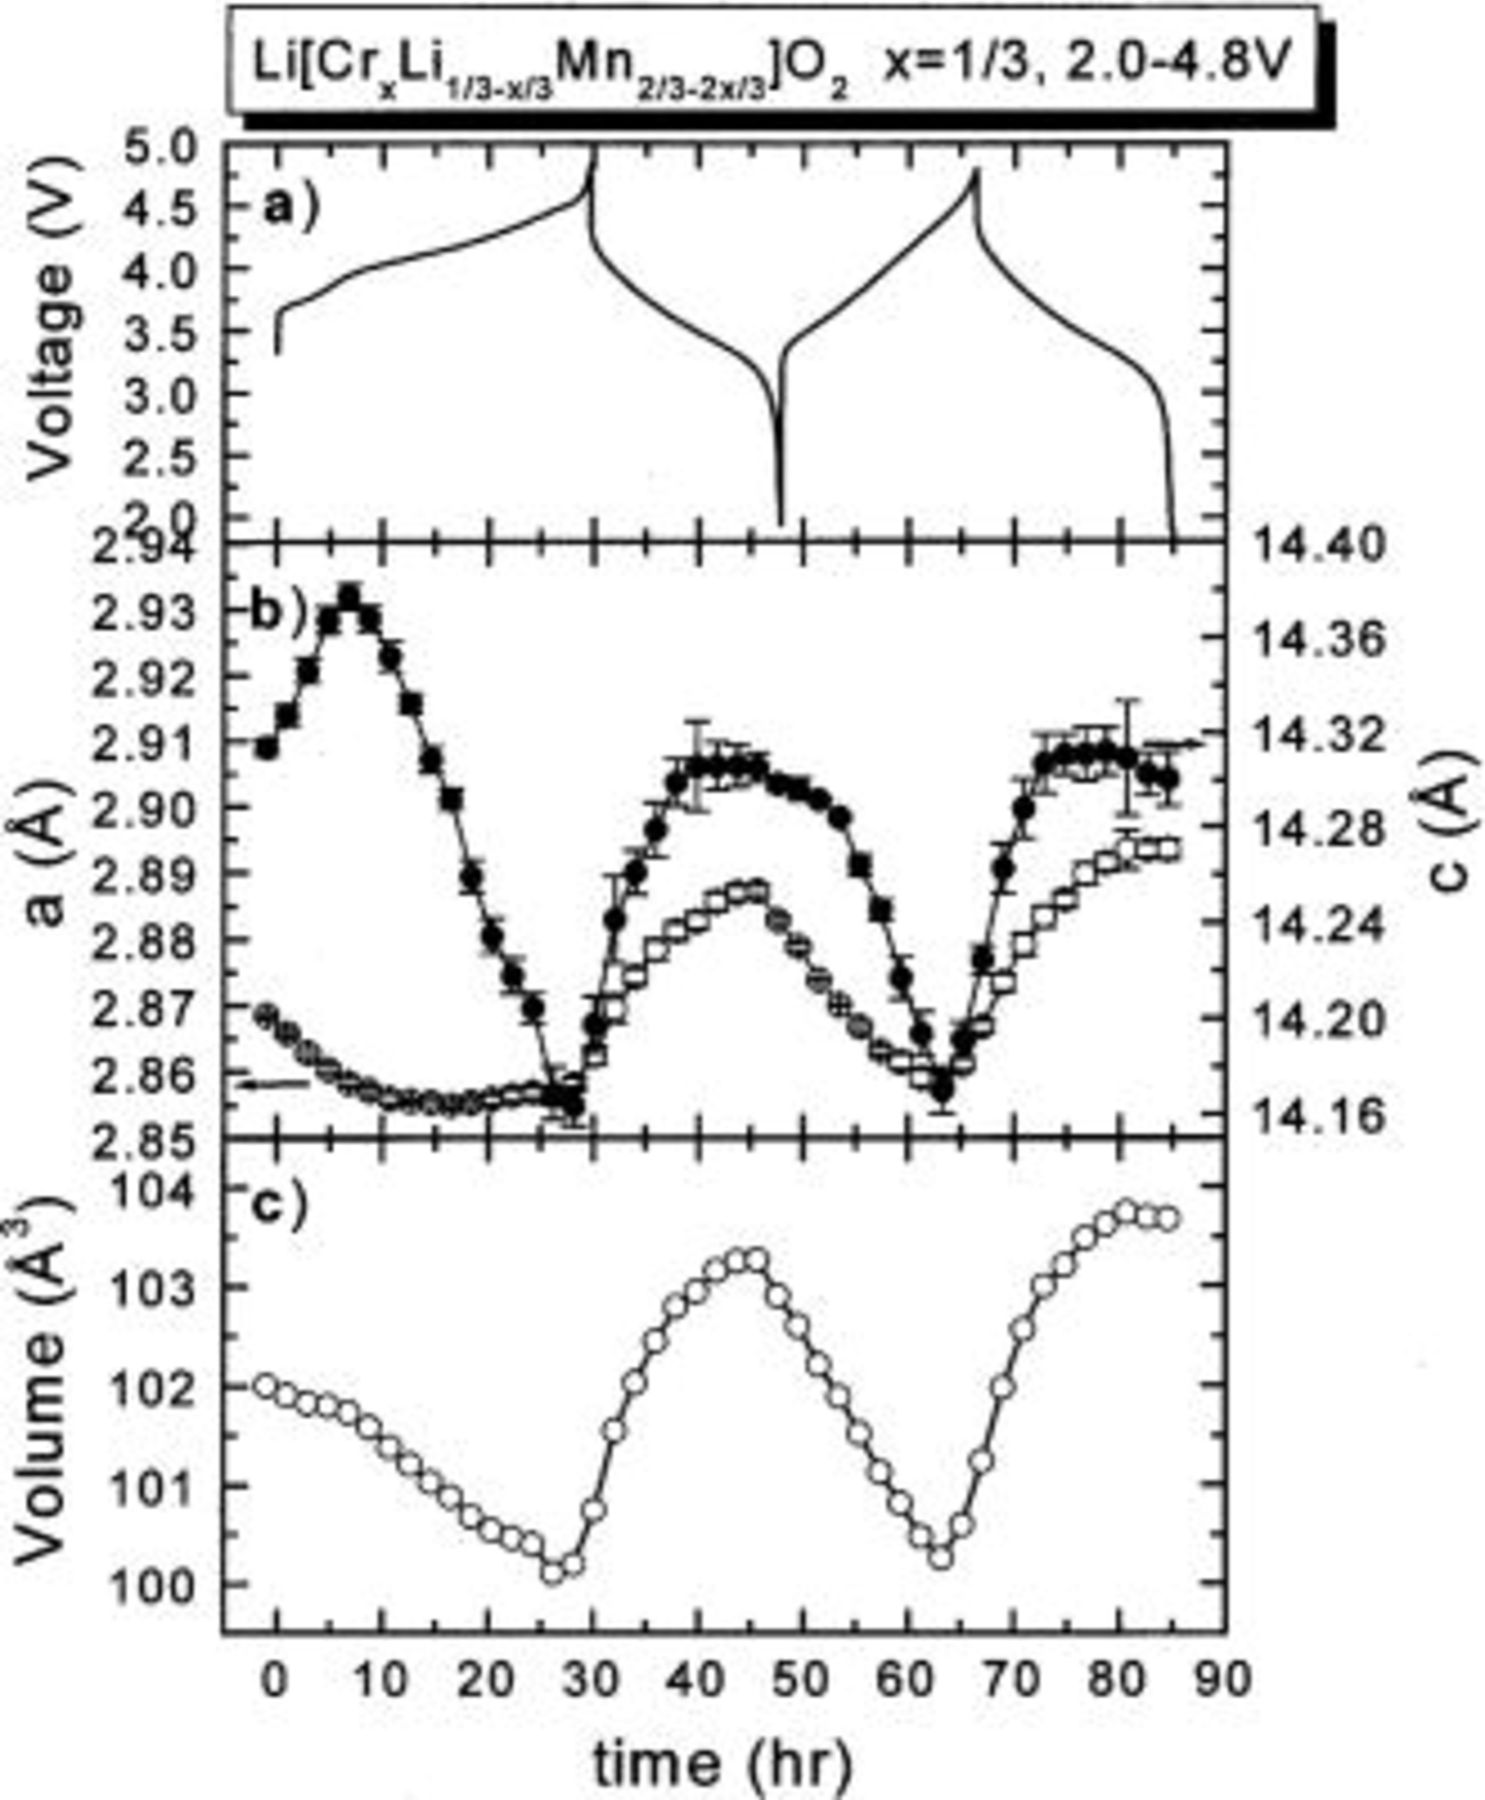
Figure 2. The lattice parameters of 
 between 2.0 and 4.8 V obtained from the in situ XRD measurement of Fig. 1: (a) the charge-discharge curve; (b) (○) a axis, (•) c axis; and (c) the unit cell volume.
After the first charge, the a and c axes both increase during discharge and decrease during charge in a repeatable pattern. Each panel in Fig. 2 shows clearly that the first charge differs from the subsequent cycles. For example, at the bottom of the first discharge, the lattice parameters a and c do not return to their original values. This implies that the structure of the electrode does not return to the original state. This is certainly consistent with the migration of Cr atoms into different sites.
In order to understand the effect of the Cr (or Mn) migration on the peak intensity and shape during cycling, the integrated intensities and widths of the (003), (101), (104), (018), and (110) peaks were obtained by fitting and are shown in Fig. 3 4 5 6 7, respectively. During the first charge the intensities of all the peaks decrease dramatically. Except for the (110) peak, they no longer return to their original values after the first charge. The peak widths of the (003) and (104) peaks are relatively stable during cycling. During the first charge, the widths of the (101), (018), and (110) peaks are relatively stable. During the first discharge, the widths of the (101) and (110) peaks both increase during the discharge and decrease during the charge, while that of the (018) peak decreases during the discharge and increases during the charge. These results also confirm that the first charge is different from the following cycles.
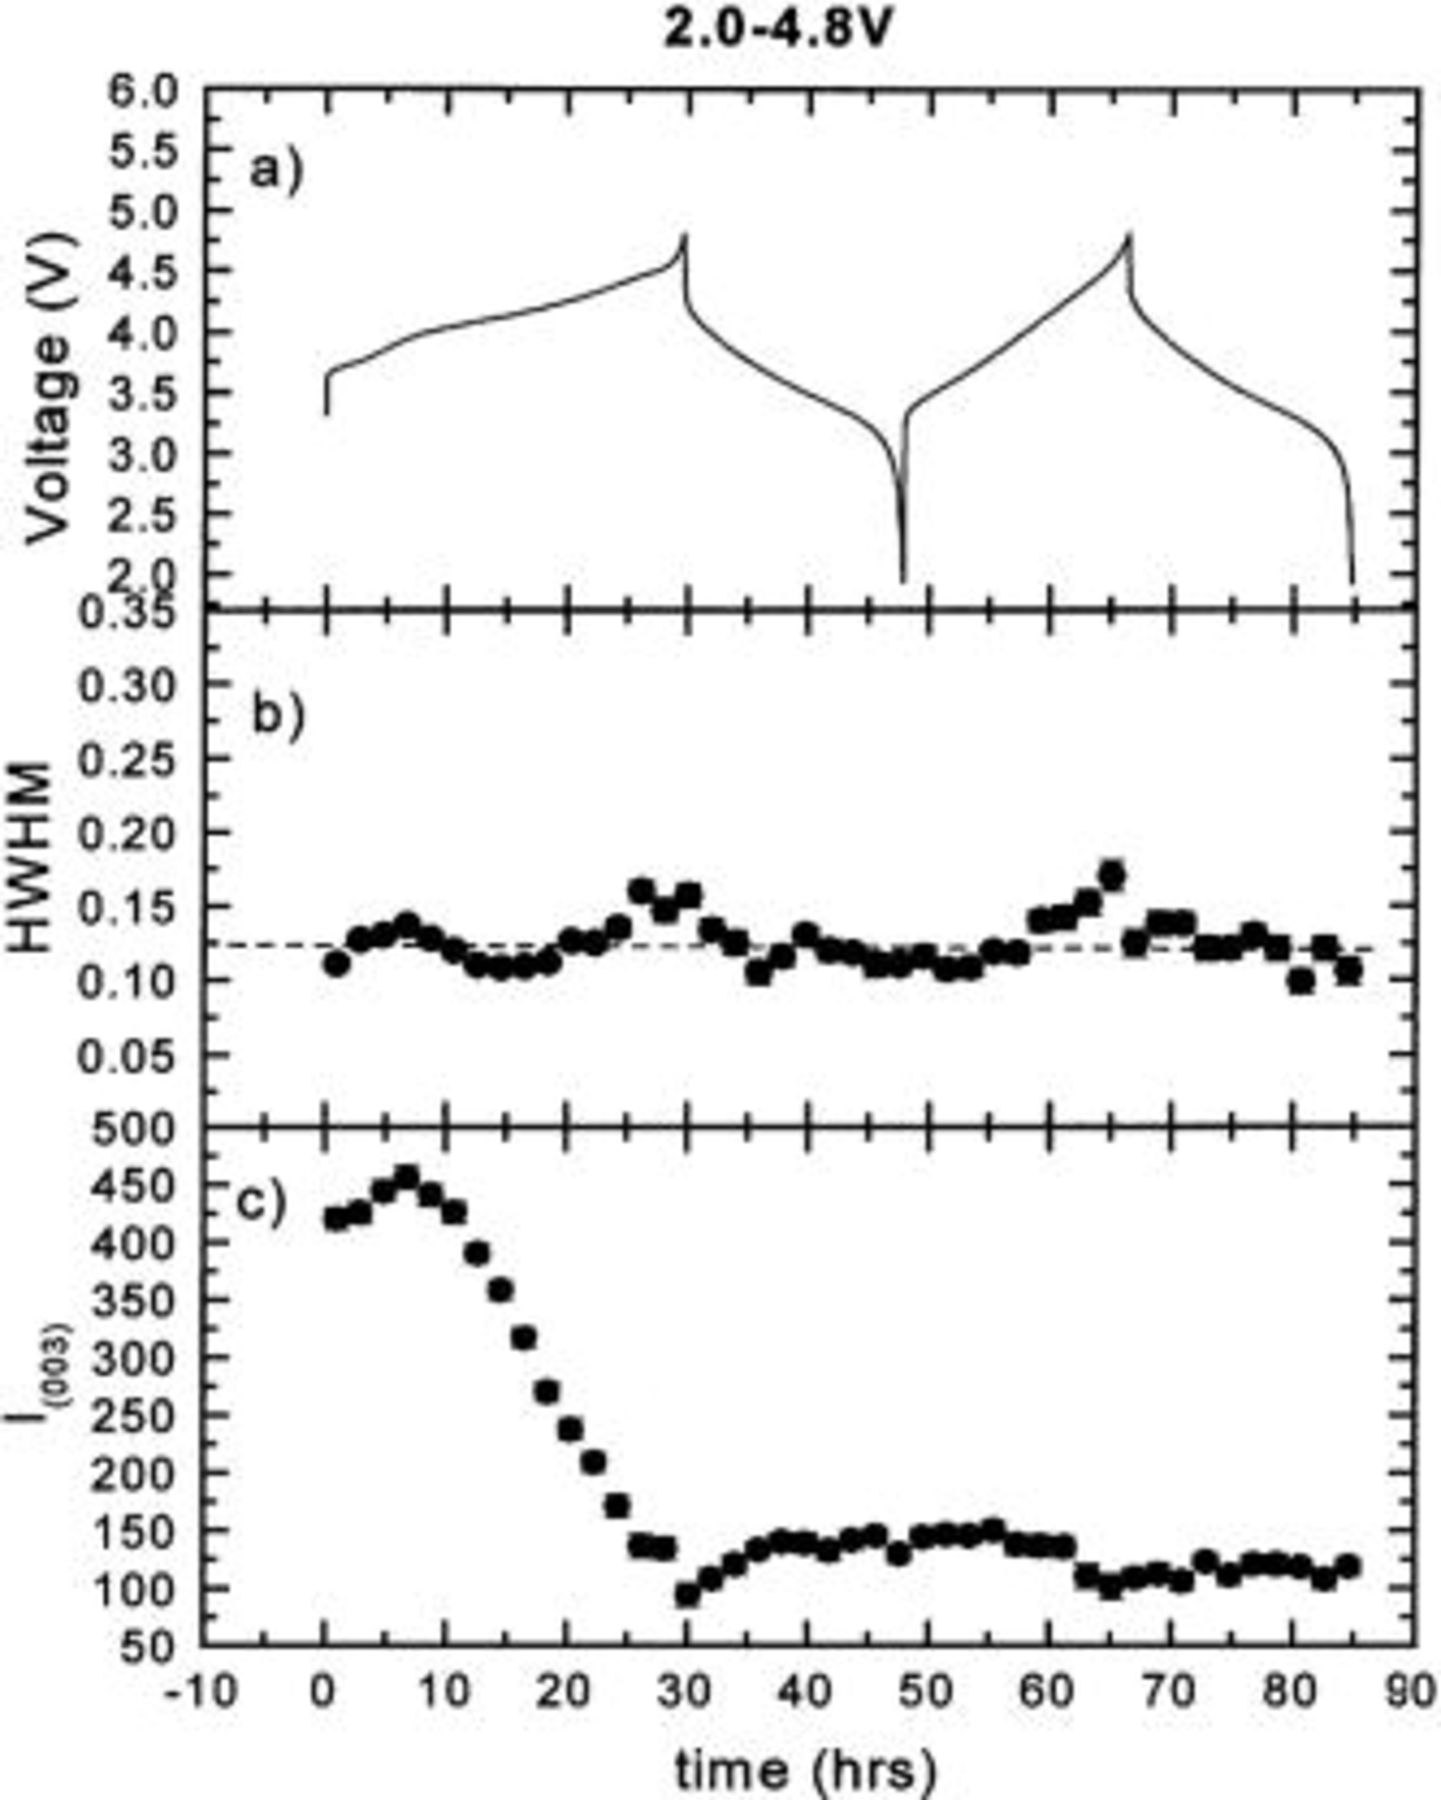
Figure 3. The half width at half maximum (hwhm) and integrated intensity of the (003) peak vs. time: (a) the charge-discharge curve, (b) hwhm vs. time, and (c) intensity vs. time.
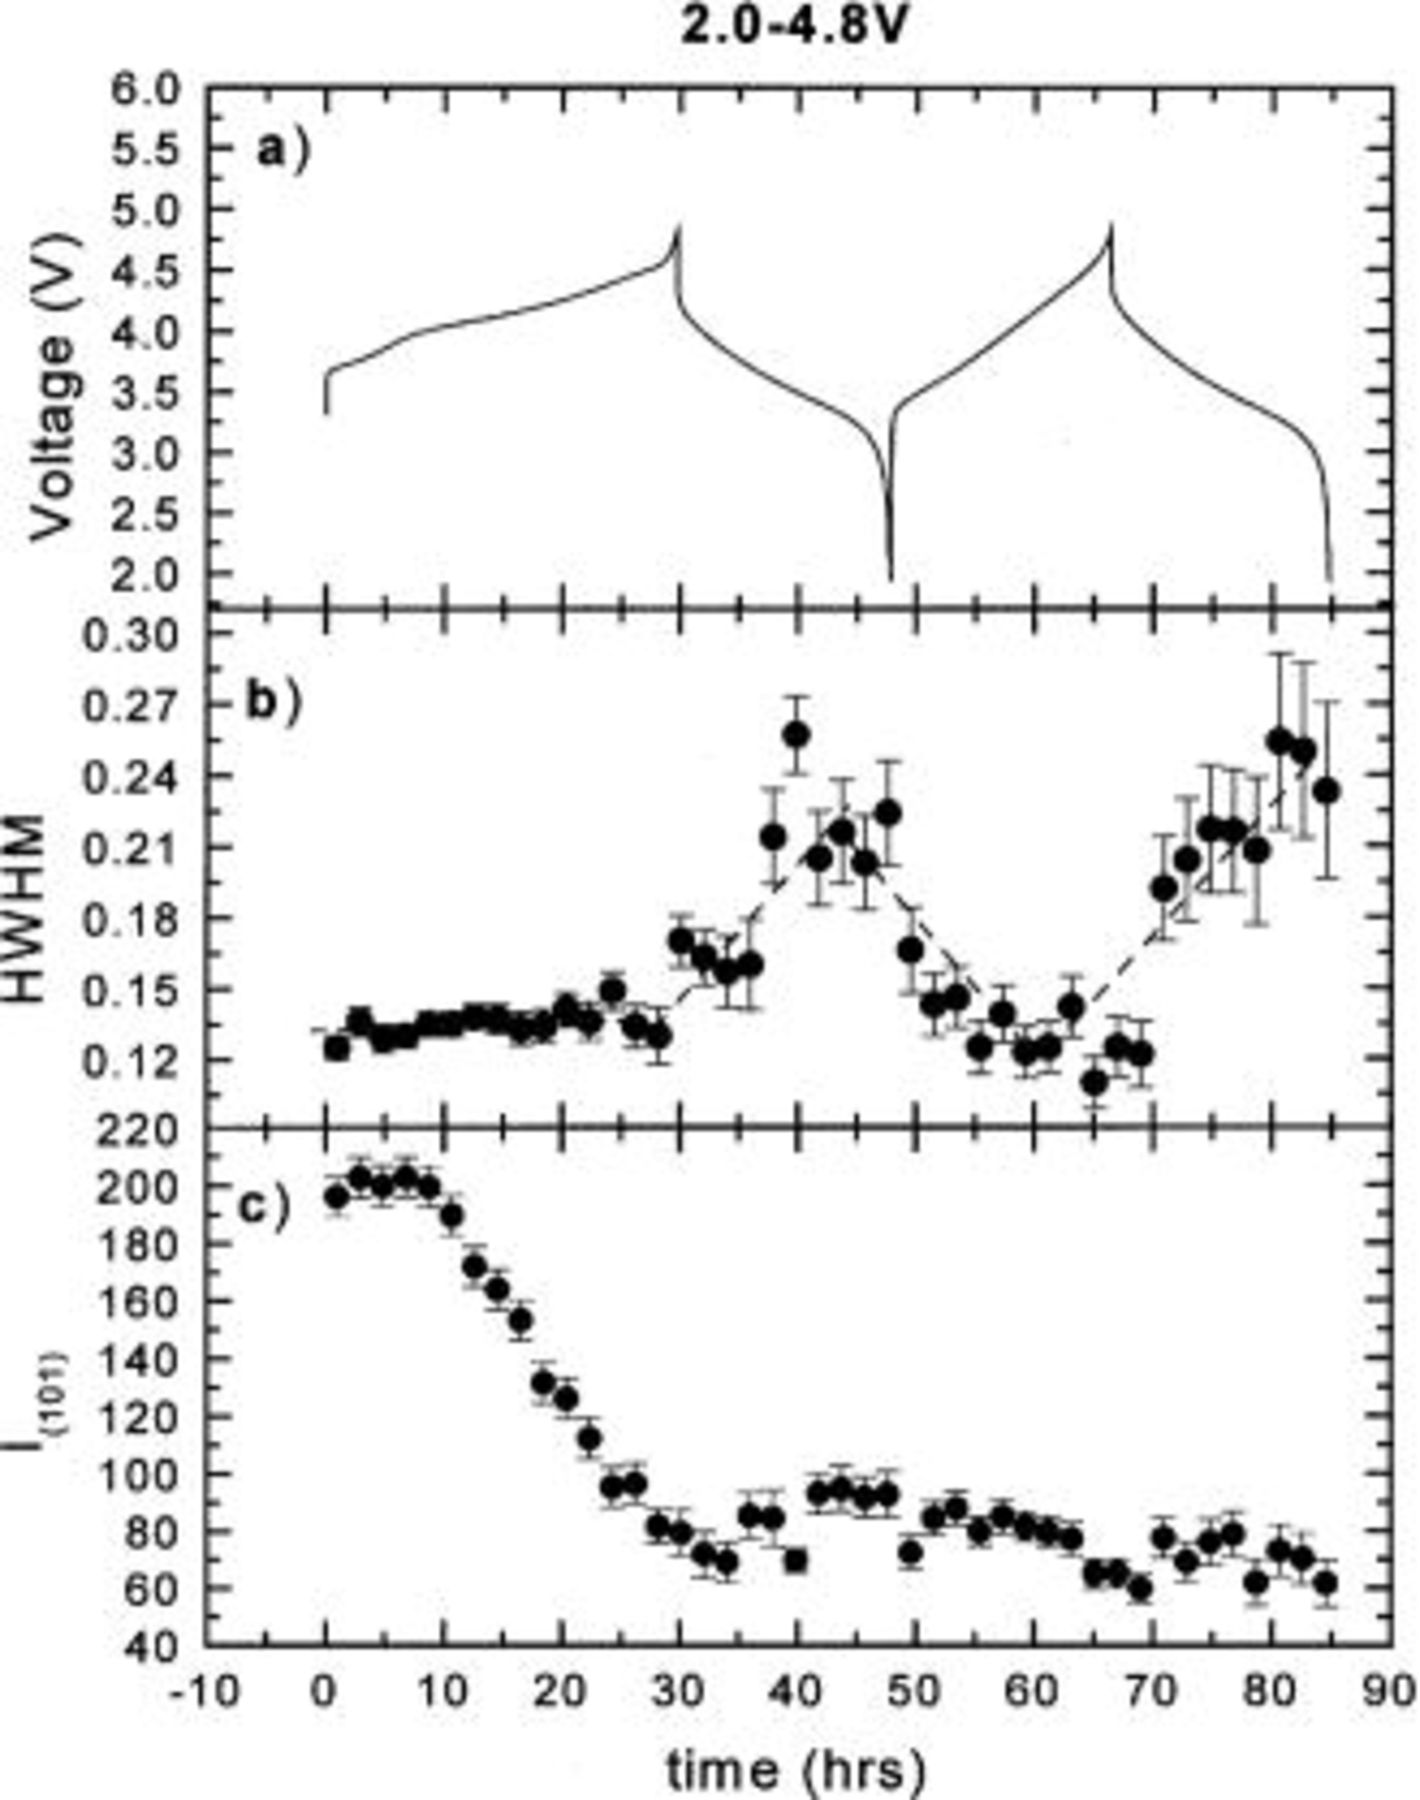
Figure 4. The hwhm and integrated intensity of the (101) peak vs. time: (a) the charge-discharge curve, (b) hwhm vs. time, and (c) intensity vs. time.
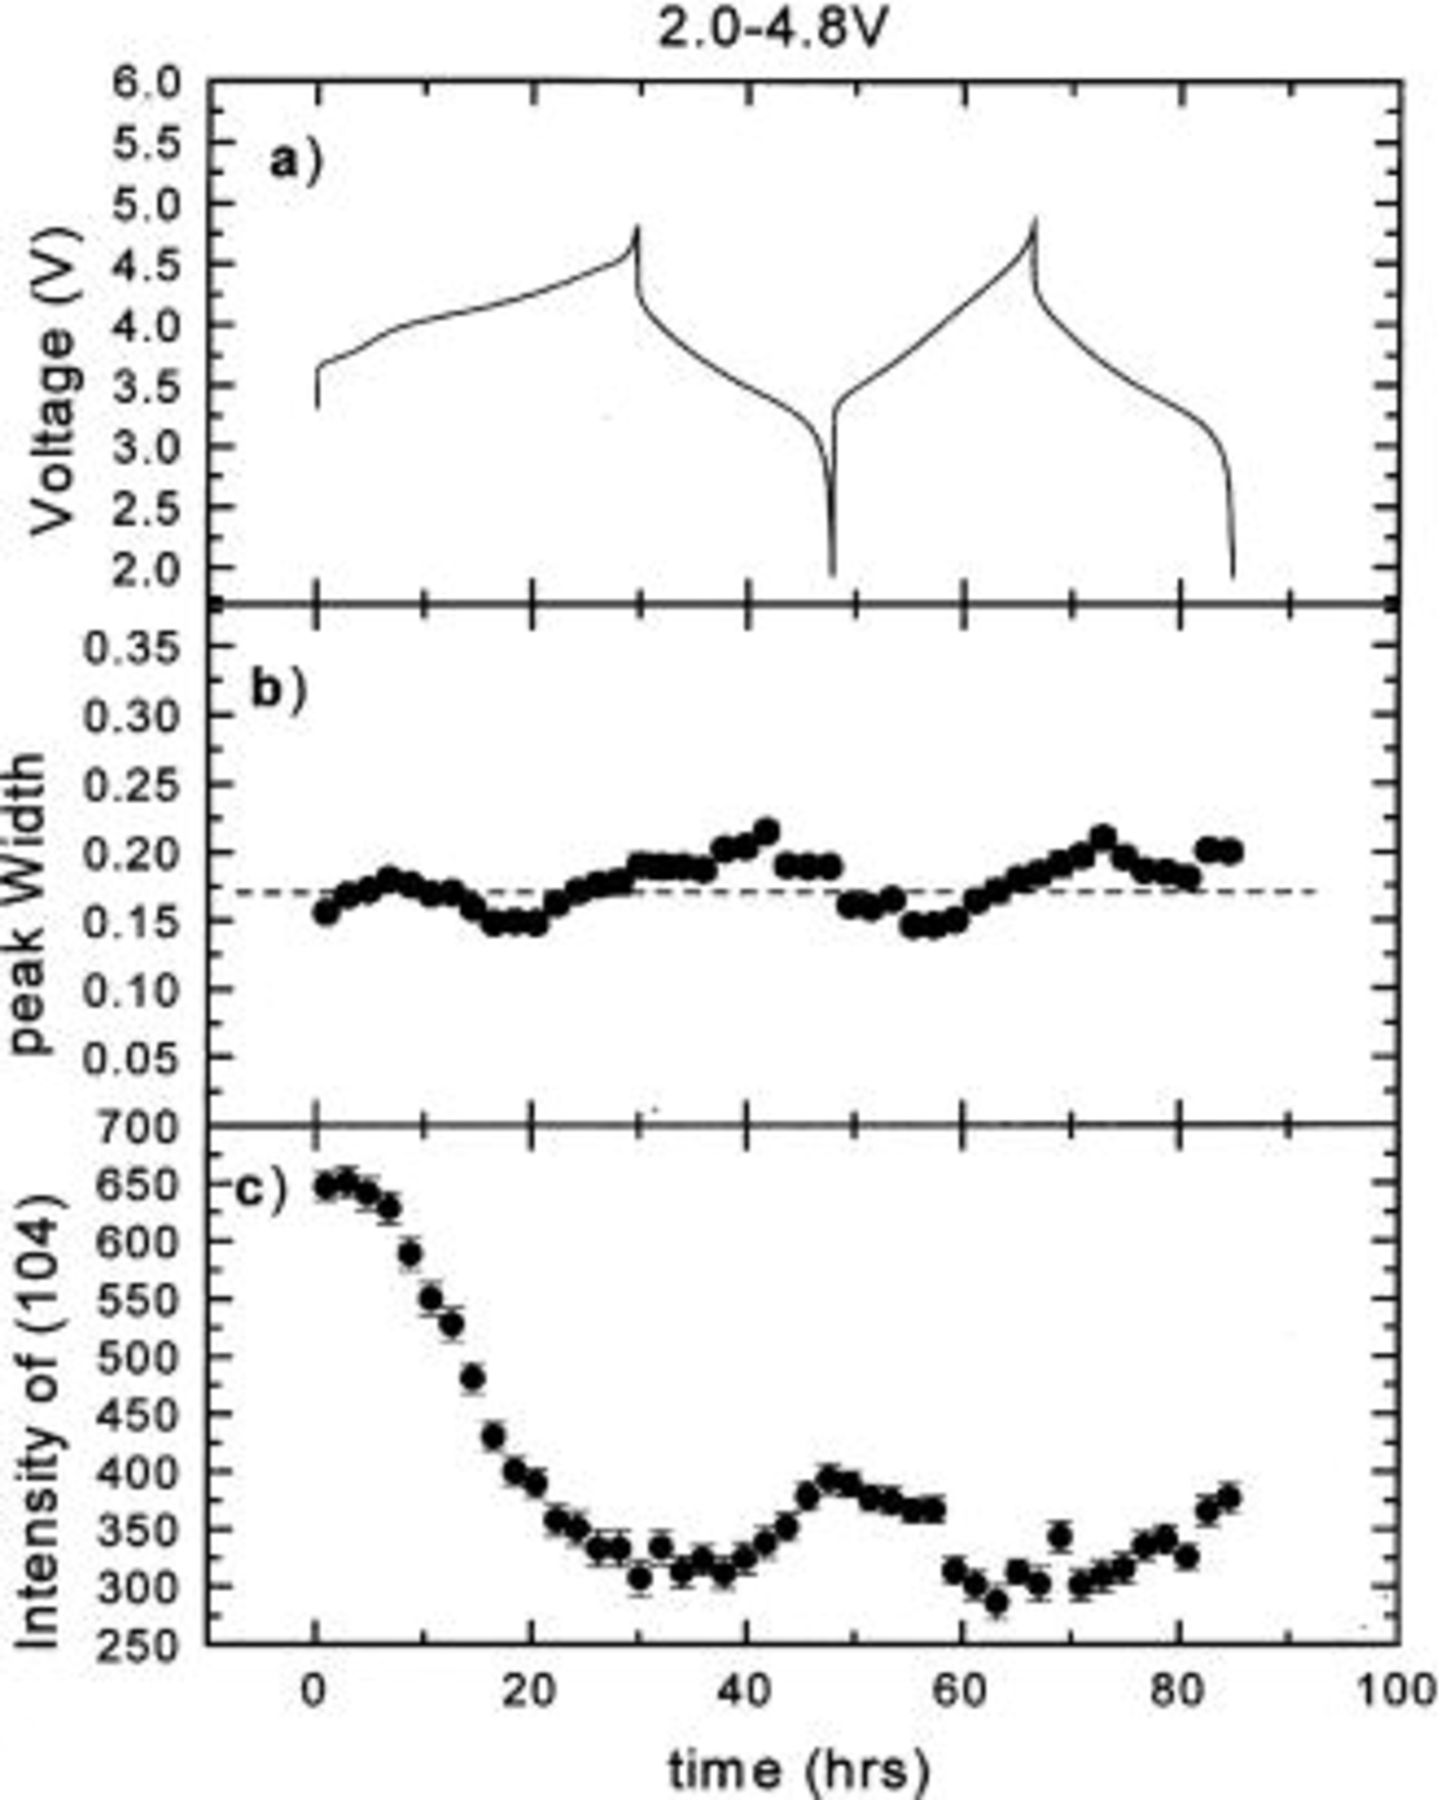
Figure 5. The hwhm and integrated intensity of the (104) peak vs. time: (a) the charge-discharge curve, (b) hwhm vs. time, and (c) intensity vs. time.
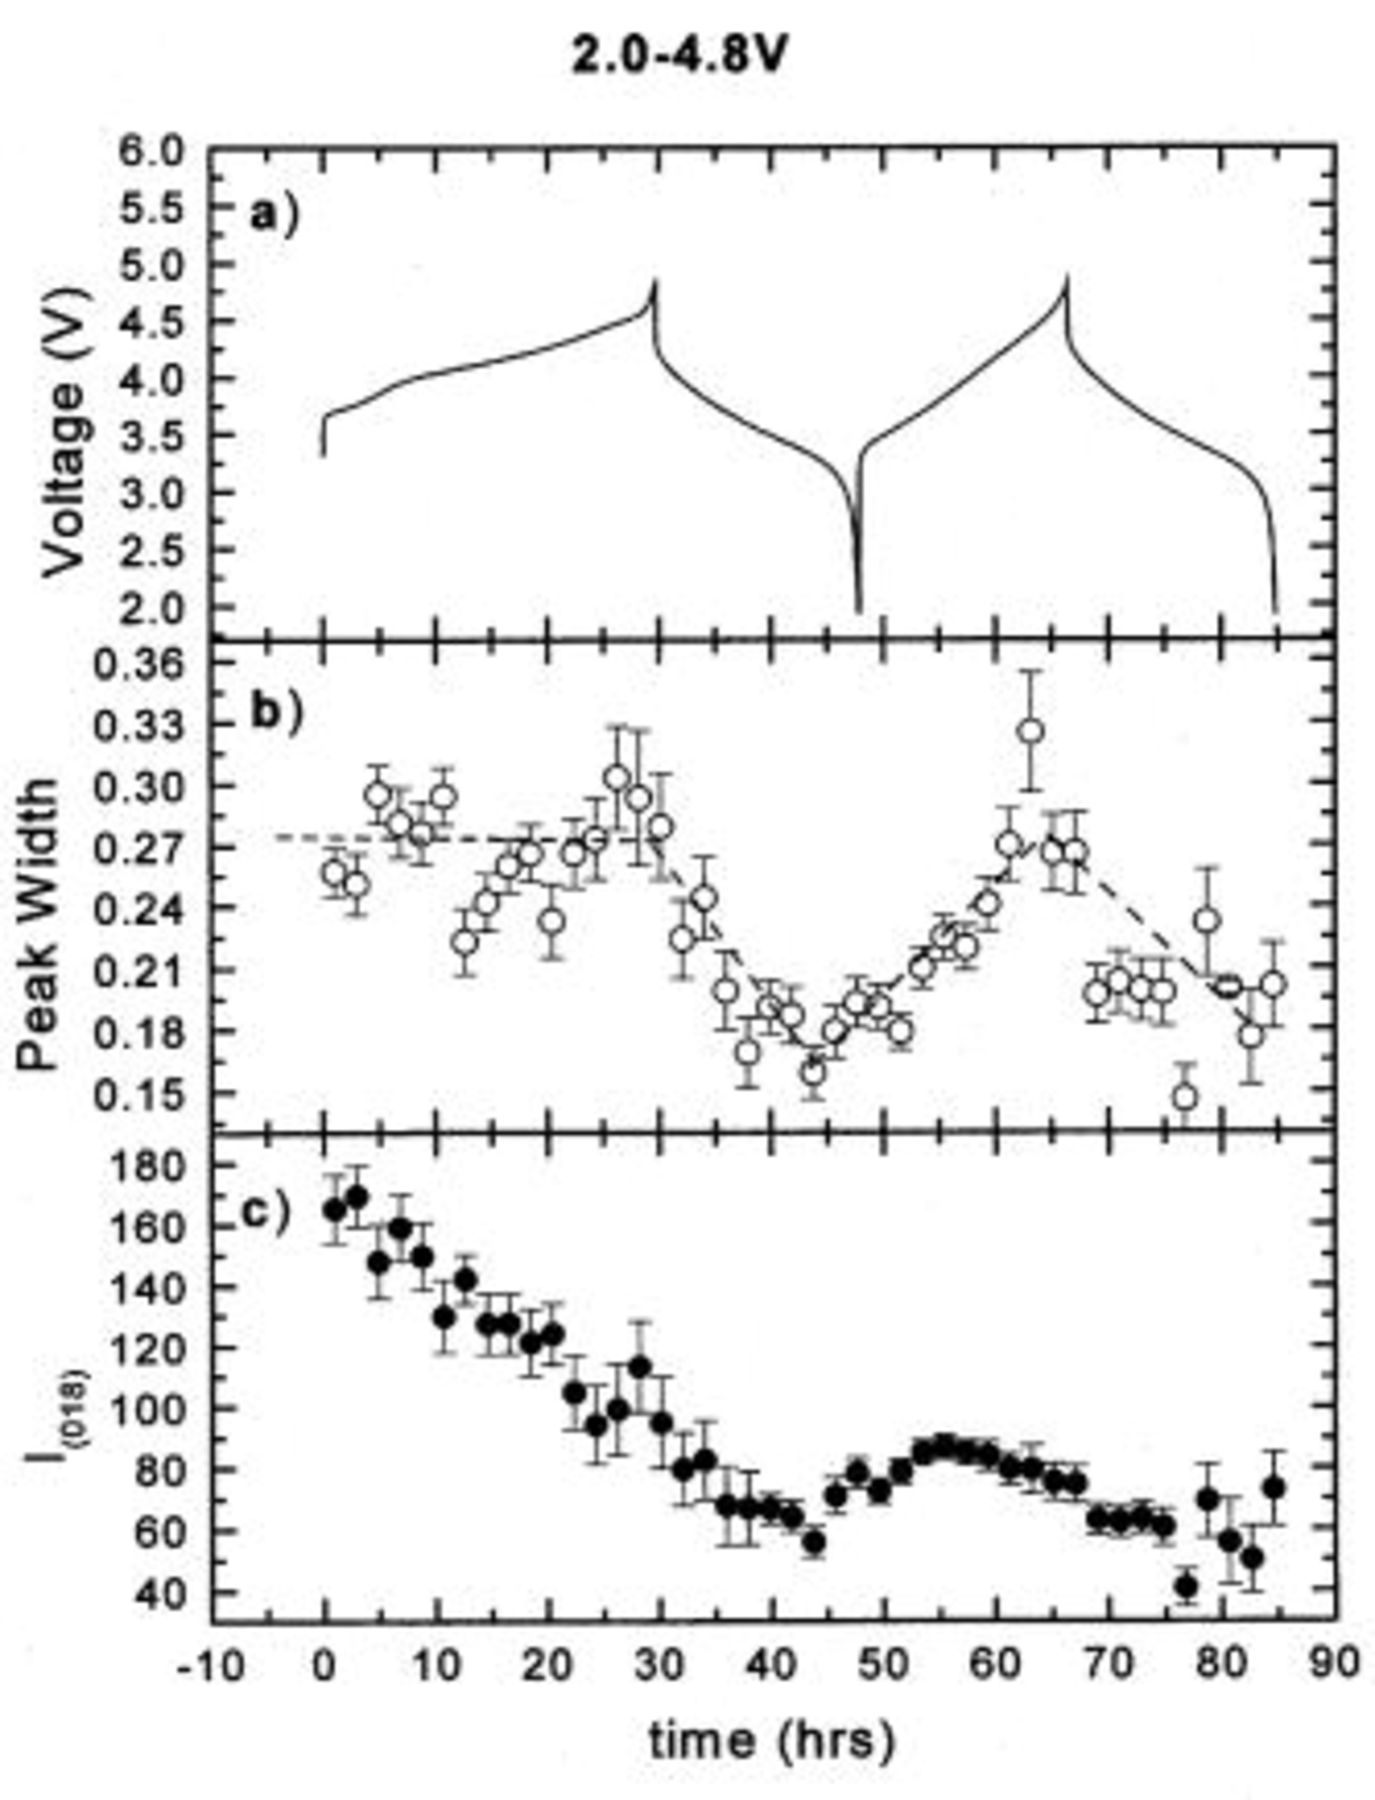
Figure 6. The hwhm and integrated intensity of the (018) peak vs. time: (a) the charge-discharge curve, (b) hwhm vs. time, and (c) intensity vs. time.
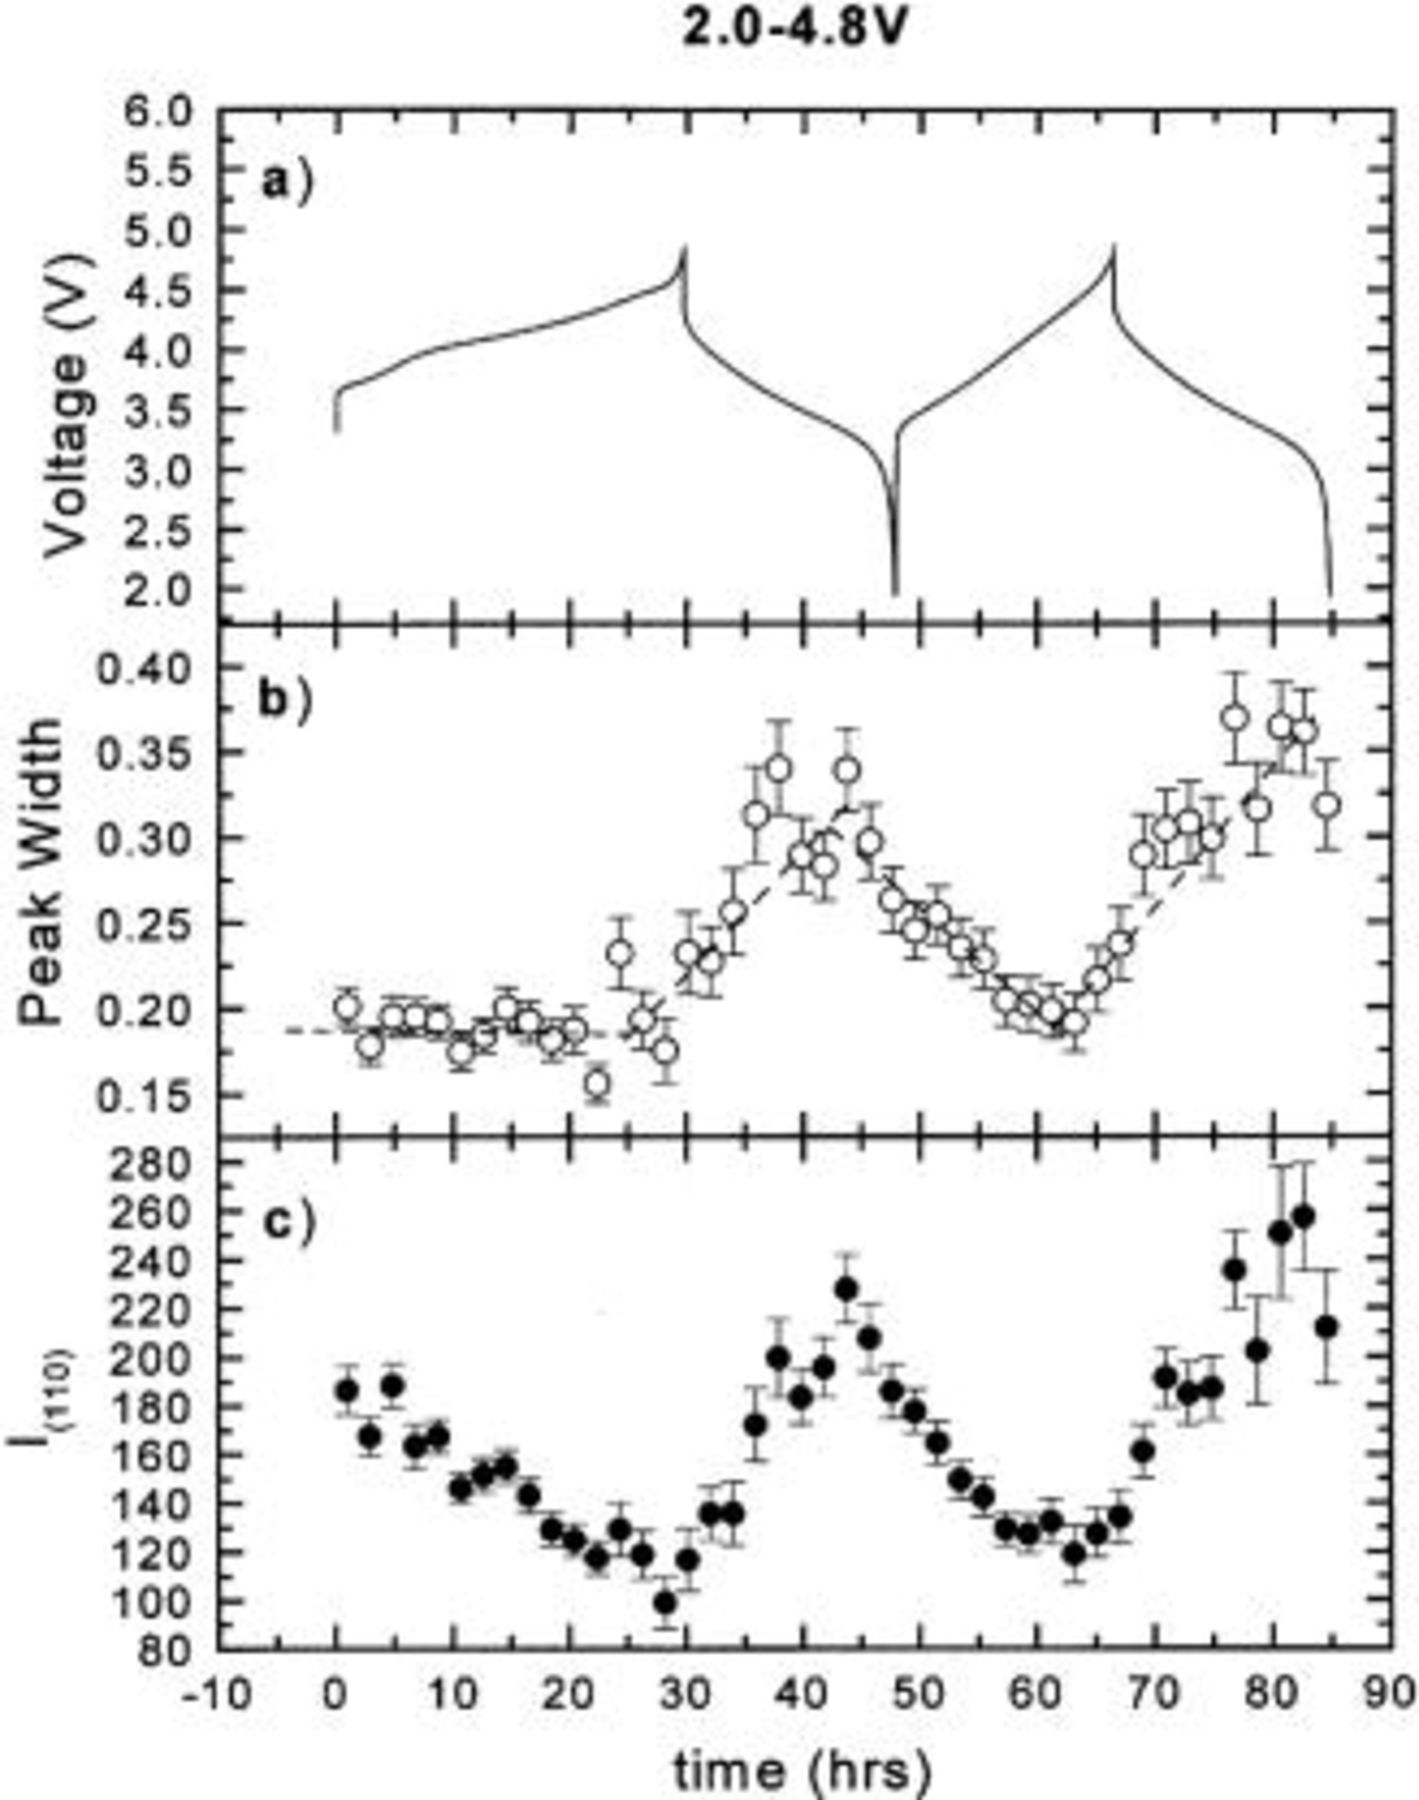
Figure 7. The hwhm and integrated intensity of the (110) peak vs. time: (a) the charge-discharge curve, (b) hwhm vs. time, and (c) intensity vs. time.
A parallel in situ XRD measurement was made on a 
 cell cycled between 2.0 and 4.35 V. Similar results to those in Fig. 1
2
3
4
5
6
7 were obtained. That is, by all measurements, the first charge differs from the subsequent cycles.
cell cycled between 2.0 and 4.35 V. Similar results to those in Fig. 1
2
3
4
5
6
7 were obtained. That is, by all measurements, the first charge differs from the subsequent cycles.
How can we understand these phenomena? Can reversible migration of Cr (or Mn) atoms between octahedral sites and tetrahedral sites explain the results in Fig. 1
2
3
4
5
6
7? What is the exact position of  that is thought to migrate? To answer these questions, ex situ XRD measurements were made so that Rietveld profile refinements could be used to determine the positions of the transition metal atoms.
Ex situ X-ray diffraction.—
Figure 8 shows three cubic close-packed (CCP) oxygen layers. The oxygen layers are stacked along the [001] direction of 
 in the sequence, ABCABC.... The small sphere represents a Cr atom initially in an octahedral site in the transition metal, M, layer. If Cr migrates from its octahedral site to a nearest-neighbor tetrahedral interstitial site, it has two options: (i) the tetrahedral site in the Li layer and (ii) the tetrahedral site in the transition metal layer. If the Cr moves to the tetrahedral site in the transition metal layer which shares faces with the neighboring octahedral sites where
  or
or  are located, a very strong repulsive interaction results. If
  moves to the tetrahedral site in the lithium layer, the repulsive interaction between
  and
and  is much weaker. Hence, we believe that
  prefers the tetrahedral site in the lithium layer. When the Li layer is partially empty this repulsion is reduced.
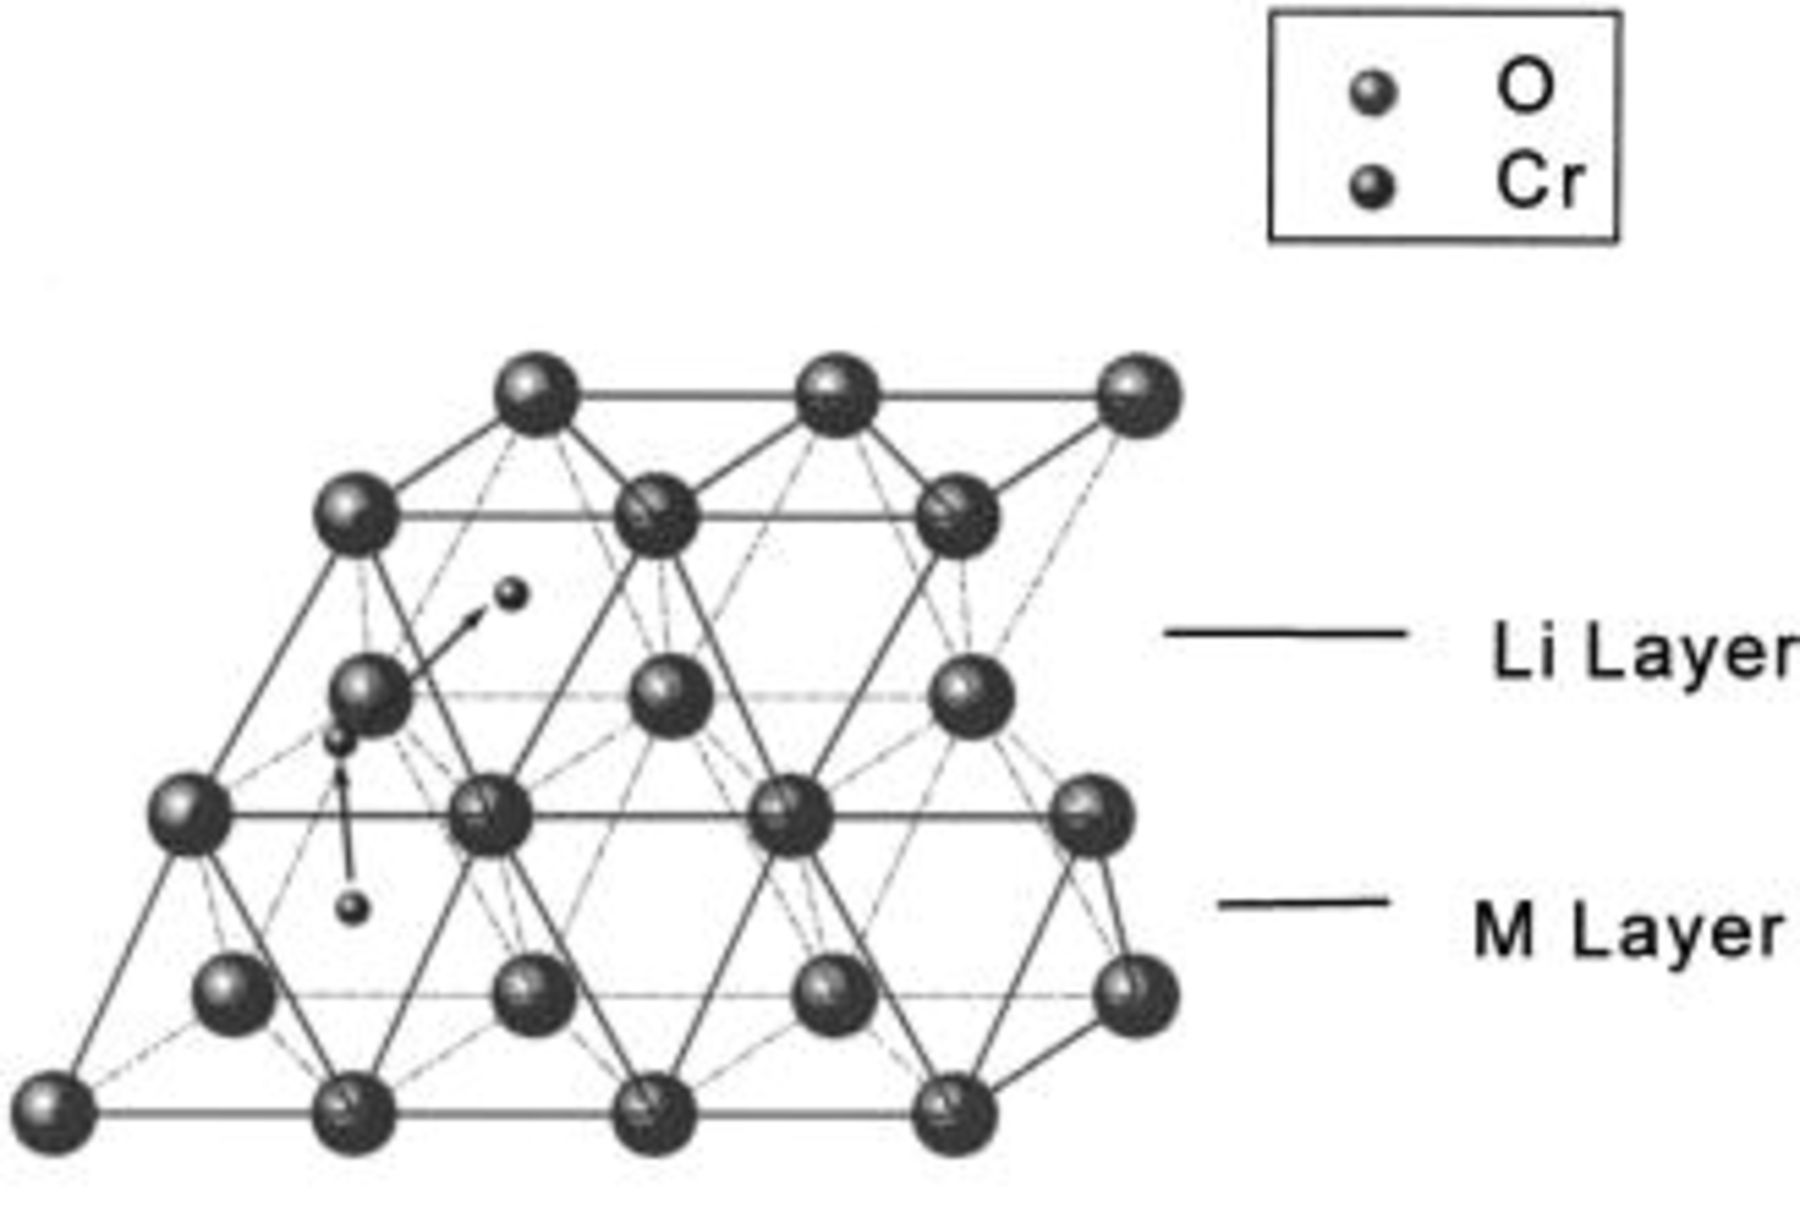
Figure 8. The possible migration path of Cr (or Mn) atoms in the CCP oxygen layers. The oxygen layers are stacked along the [001] direction in the ABCABC.. sequence.
It is also possible that some of the  or Mn could move to the octahedral site in the Li layer as shown by the arrows in Fig. 8. It is well known that Mn can move from one octahedral site to a neighbor, for example, as occurs in the conversion of
  to the spinel phase during cycling.16
17
18 (In
to the spinel phase during cycling.16
17
18 (In 
 Mn is in the 4+ oxidation state and Mn does not take part in the redox reaction during the lithium extraction. Based on the first-principles calculation on layered
  by Reed et al. ,19 it is unlikely that
  migrates to the octahedral site in the lithium layer. However, XRD cannot distinguish between Cr and Mn, so the experiments reported here cannot determine which of these atoms moves to the octahedral sites in the lithium layer.)
In our Rietveld refinements, we have allowed the Cr atoms to occupy the octahedral and tetrahedral sites in both the lithium layers and in the transition metal layers. (Recall that we cannot distinguish between Mn and Cr atoms or ions.) The refined structural parameters of the ex situ XRD patterns of 
 charged to 3.95, 4.35, and 4.8 V are given in Table I. The space group used was
  (no. 166), and it was assumed that Li atoms in the lithium layer occupy the 3a sites, the transition metal atoms and the lithium in the transition metal layer are on the on 3b sites, and the oxygen atoms are on the 6c sites. The tetrahedral sites for
  are also 6c sites which have a different fractional atomic coordinate, z, compared to the oxygen atoms. The Li content in the lithium layer was determined from the cell capacity and fixed during the refinement. We allowed the Cr atoms to distribute among the 3b (transition metal layer), 3a (Li layer), and 6c sites (the tetrahedral sites).
Table I.
The structural parameters of   during the first charge measured at three potentials.a during the first charge measured at three potentials.a | ||||||
|---|---|---|---|---|---|---|
| Potential (vs. Li/Li+) | Structural parameters | |||||
| 3.95 V |
  | |||||
| Site | Element | X | Y | z | Occ. | |
| 3a | Li | 0 | 0 | 0 | 0.7472* | |
| 3a | Cr | 0 | 0 | 0 | 0 | |
| 3b | Mn | 0 | 0 |
 | 0.4444 | |
| 3b | Li | 0 | 0 |
 | 0.2223 | |
| 3b | Cr | 0 | 0 |
 | 0.3333 | |
| 6c | O | 0 | 0 |
 | 2.0 | |
| 6c | Cr(T)* * | 0 | 0 | 0.39 | 0 | |
  goodness of fit 1.6; goodness of fit 1.6;  | ||||||
| 4.35 V |
  | |||||
| Site | Element | X | Y | z | Occ. | |
| 3a | Li | 0 | 0 | 0 | 0.2400* | |
| 3a | Cr | 0 | 0 | 0 |
 | |
| 3b | Mn | 0 | 0 |
 | 0.4444 | |
| 3b | Li | 0 | 0 |
 | 0.2223 | |
| 3b | Cr | 0 | 0 |
 |
 | |
| 6c | O | 0 | 0 |
 | 2.0 | |
| 6c | Cr(T)* * | 0 | 0 |
 |
 | |
  goodness of fit 2.7%; goodness of fit 2.7%;  | ||||||
| 4.80 V |
  | |||||
| Site | Element | X | Y | z | Occ. | |
| 3a | Li | 0 | 0 | 0 | 0.1160* | |
| 3a | Cr | 0 | 0 | 0 |
 | |
| 3b | Mn | 0 | 0 |
 | 0.4444 | |
| 3b | Li | 0 | 0 |
 | 0.2223 | |
| 3b | Cr | 0 | 0 |
 |
 | |
| 6c | O | 0 | 0 |
 | 2.0 | |
| 6c | Cr(T)* * | 0 | 0 |
 |
 | |
  goodness of fit 2.5%; goodness of fit 2.5%;  | ||||||
a The space group used was  no. 166. no. 166. | ||||||
| * 3a sites represent Li layers. The lithium content in the lithium layers was determined from the cell capacity and fixed during the refinement. | ||||||
| (T)* * the tetrahedral site for Cr. | ||||||
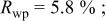
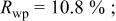
Figures 9 and 10 show the refined ex situ XRD patterns of 
 charged to 4.35 and 4.8 V. Figures 9 and 10 show that the structural model we propose can fit these X-ray patterns well. Table I shows a significant migration of Cr (or Mn) has occurred by 4.35 V. At 4.35 V, a large amount of Cr (or Mn) has moved to the tetrahedral sites and further to the octahedral sites in the lithium layers. At 4.8 V, when the lithium layer has almost no lithium, there are even more Cr (or Mn) atoms on the octahedral sites in the lithium layers. The amount of Cr in the tetrahedral sites is about 30-33% of the total. This is quite close to the results from EXAFS.6 It can be concluded that the occupancy of Cr (or Mn) atoms in the octahedral sites of the transition metal layer is reduced during the charge process and the Cr (or Mn) atoms move to the tetrahedral sites and further to the octahedral sites in the lithium layer.
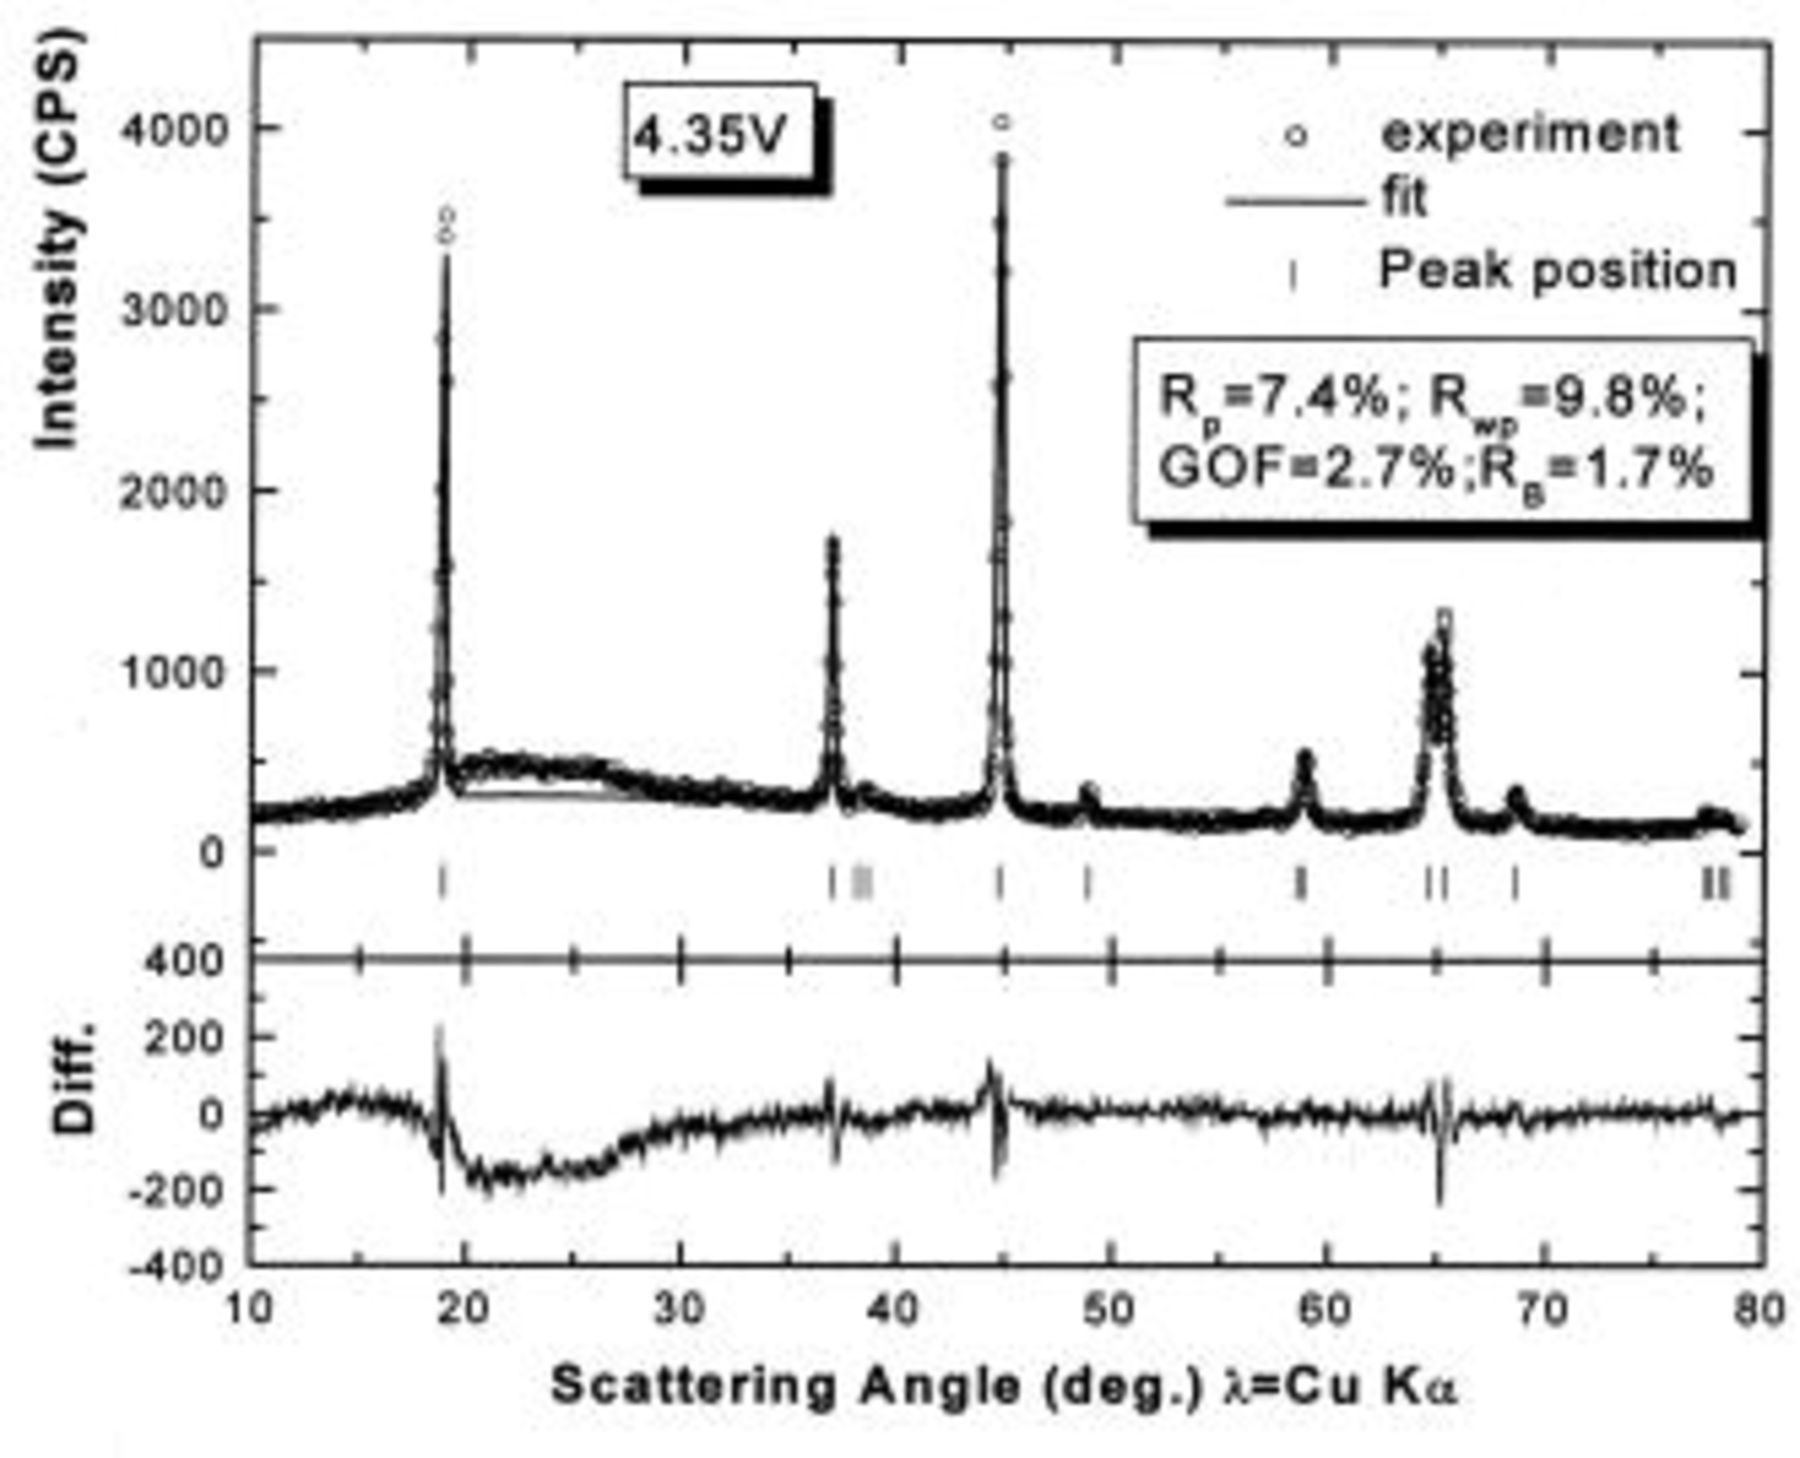
Figure 9. Rietveld refinement of the ex situ XRD pattern of 
 charged to 4.35 V: (○) the experimental data, (⎯) the fit, and (|) the expected peak positions. The lower section shows the difference between the fit and the experiment.
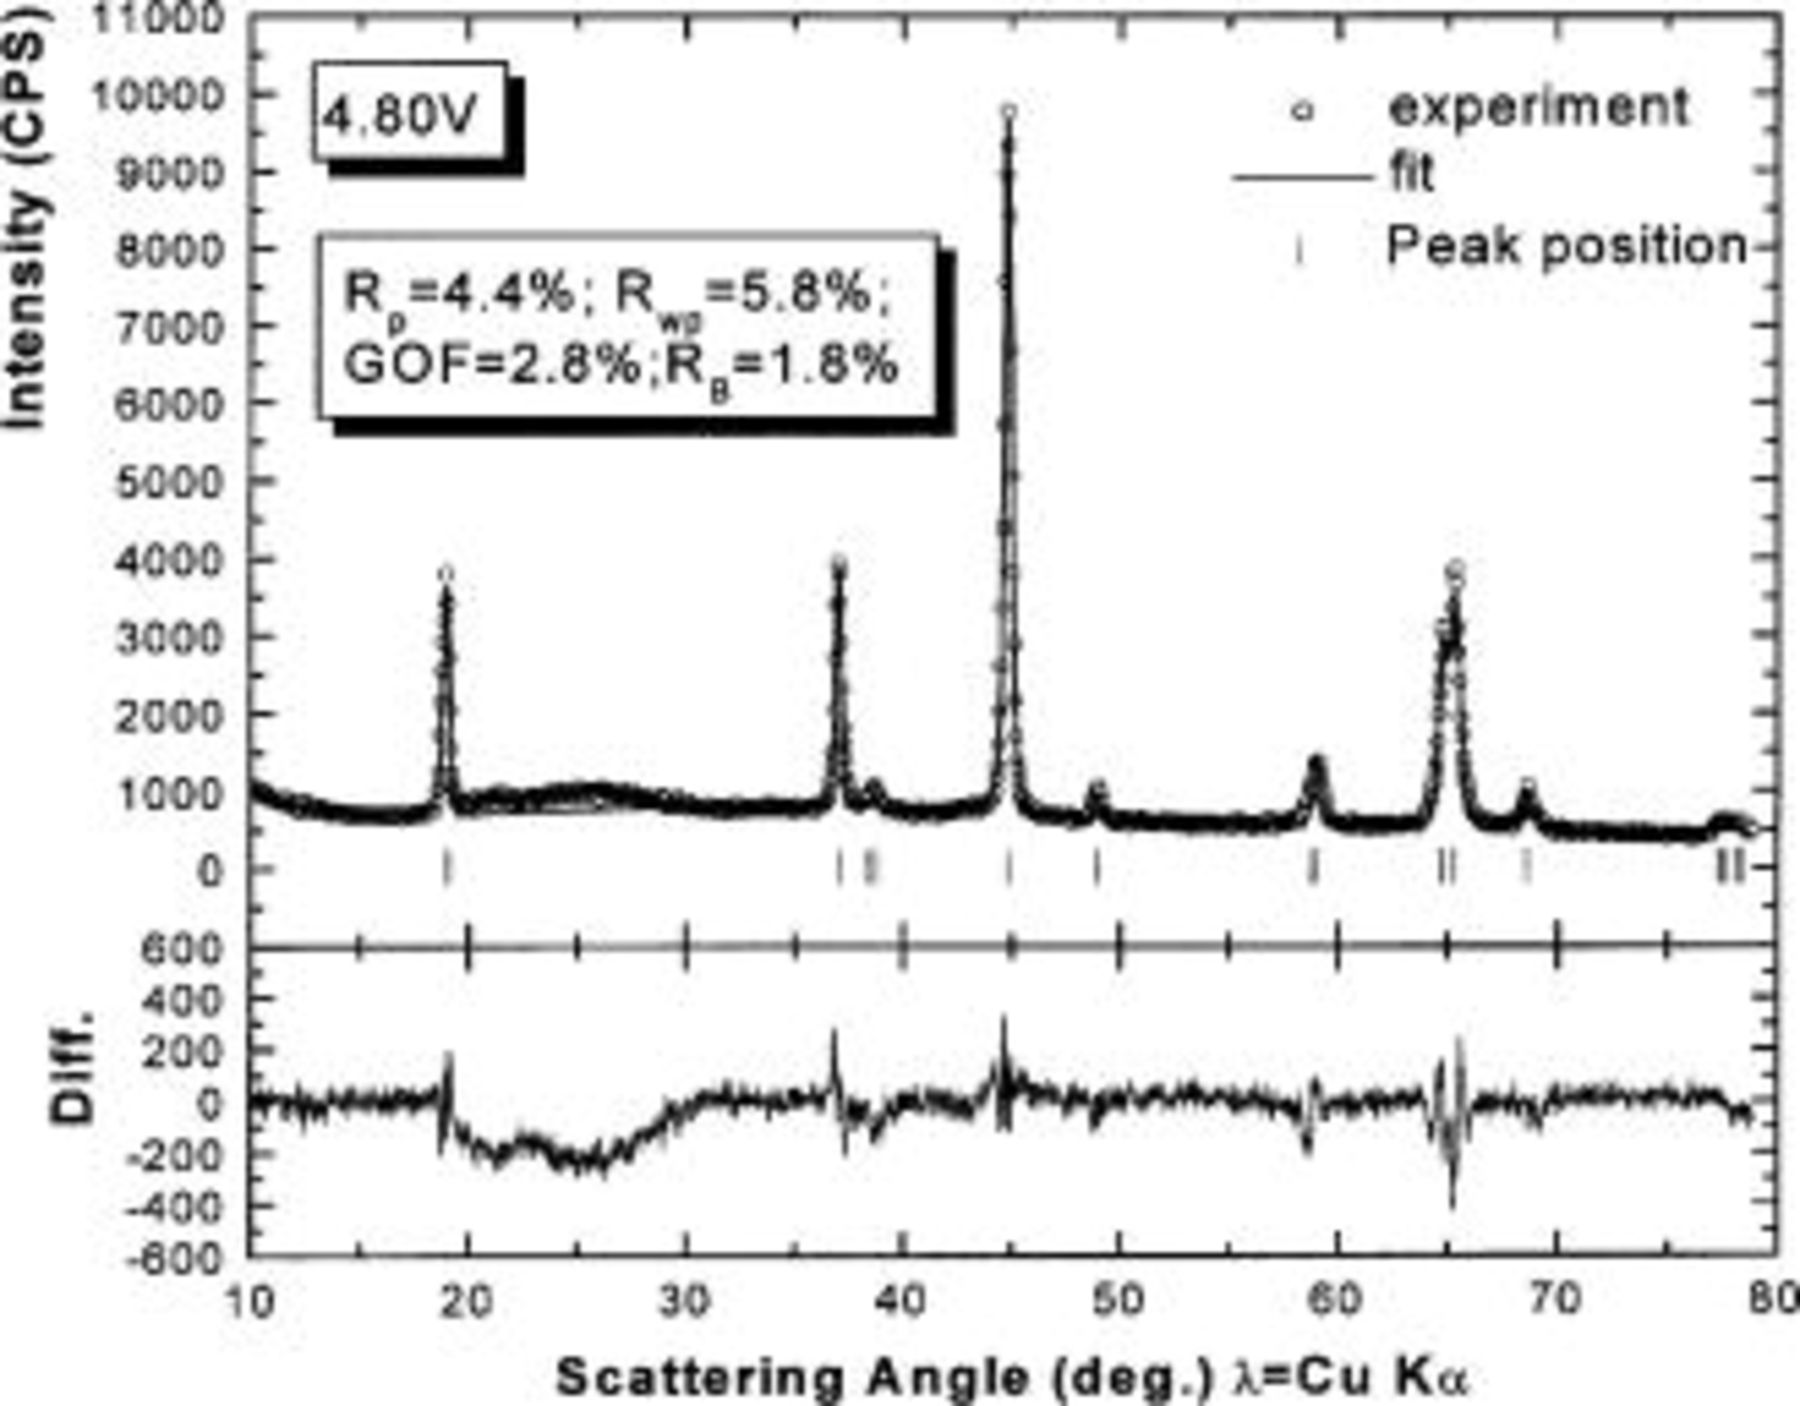
Figure 10. Rietveld refinement of the ex situ XRD pattern of 
 charged to 4.8 V: (○) the experimental data, (⎯) the fit, and (|) the expected peak positions. The lower section shows the difference between the fit and the experiment.
Figure 11 shows a sketch of the tetrahedral coordination proposed for  based on the refinements made here. The oxygen atoms
 and
and  are in the shared plane between the lithium and transition metal layers. Table II shows the
  bond lengths for Cr in the tetrahedral site when
 is charged to 4.35 and 4.8 V. Tables I and II suggest that the position of the tetrahedral
  is not fixed during the charge process. The
  bond lengths in Table II are longer than those determined by EXAFS, ca. 1.64 Å.6 However, considering the very large structural disorder parameters used in Ref. 6, one could claim reasonable agreement.
Figure 11. The tetrahedral coordination of  by oxygen. The oxygen atoms
 and
and  are in the shared plane between the lithium and transition metal layers.
Table II.
The  bond lengths for Cr in the tetrahedral site of bond lengths for Cr in the tetrahedral site of   charged to 4.35 and 4.8 V. charged to 4.35 and 4.8 V. | ||
|---|---|---|
| Charge state | Bond | Length (Å) |
| 4.35 V |
 | 2.069 |
 | 1.725 | |
 | 1.725 | |
 | 1.725 | |
| 4.80 V |
 | 1.755 |
 | 1.827 | |
 | 1.827 | |
 | 1.827 | |
Table III gives the refined structural parameters of the ex situ XRD patterns for 
 which was discharged to 3.5 and 2.0 V after first charging to 4.35 V. Figure 12 shows the agreement between the refined pattern and the data collected for the electrode at 2.0 V. The fit is good based on the same structural model. Comparing Tables I and III, it can be seen that much of the Cr (or Mn) returns to its original site, the octahedral site in the transition metal layers, during the discharge process. However, there is a significant amount of residual Cr (or Mn) on the tetrahedral and octahedral sites in the lithium layers. Thus, the transition metal migration is not fully reversible.
Table III.
The structural parameters of   during the first discharge measured at two potentials.a during the first discharge measured at two potentials.a | ||||||
|---|---|---|---|---|---|---|
| Potential (vs. Li/Li+) | Structural parameters | |||||
| 3.50 V |
  | |||||
| Site | Element | X | Y | z | Occ. | |
| 3a | Li | 0 | 0 | 0 | 0.6395* | |
| 3a | Cr | 0 | 0 | 0 |
 | |
| 3b | Mn | 0 | 0 |
 | 0.4444 | |
| 3b | Li | 0 | 0 |
 | 0.2223 | |
| 3b | Cr | 0 | 0 |
 |
 | |
| 6c | O | 0 | 0 |
 | 2.0 | |
| 6c | Cr(T)* * | 0 | 0 |
 |
 | |
  goodness of goodness of   | ||||||
| 2.00 V |
  | |||||
| Site | Element | X | Y | z | Occ. | |
| 3a | Li | 0 | 0 | 0 | 0.8097* | |
| 3a | Cr | 0 | 0 | 0 |
 | |
| 3b | Mn | 0 | 0 |
 | 0.4444 | |
| 3b | Li | 0 | 0 |
 | 0.2223 | |
| 3b | Cr | 0 | 0 |
 |
 | |
| 6c | O | 0 | 0 |
 | 2.0 | |
| 6c | Cr(T)* * | 0 | 0 |
 |
 | |
  goodness of fit 2.1%; goodness of fit 2.1%;  | ||||||
a The space group used was  no. 166. no. 166. | ||||||
| * 3a sites represent Li layers. The lithium content in the lithium layers was determined from the cell capacity and fixed during the refinement. | ||||||
| (T)* * the tetrahedral site for Cr. | ||||||
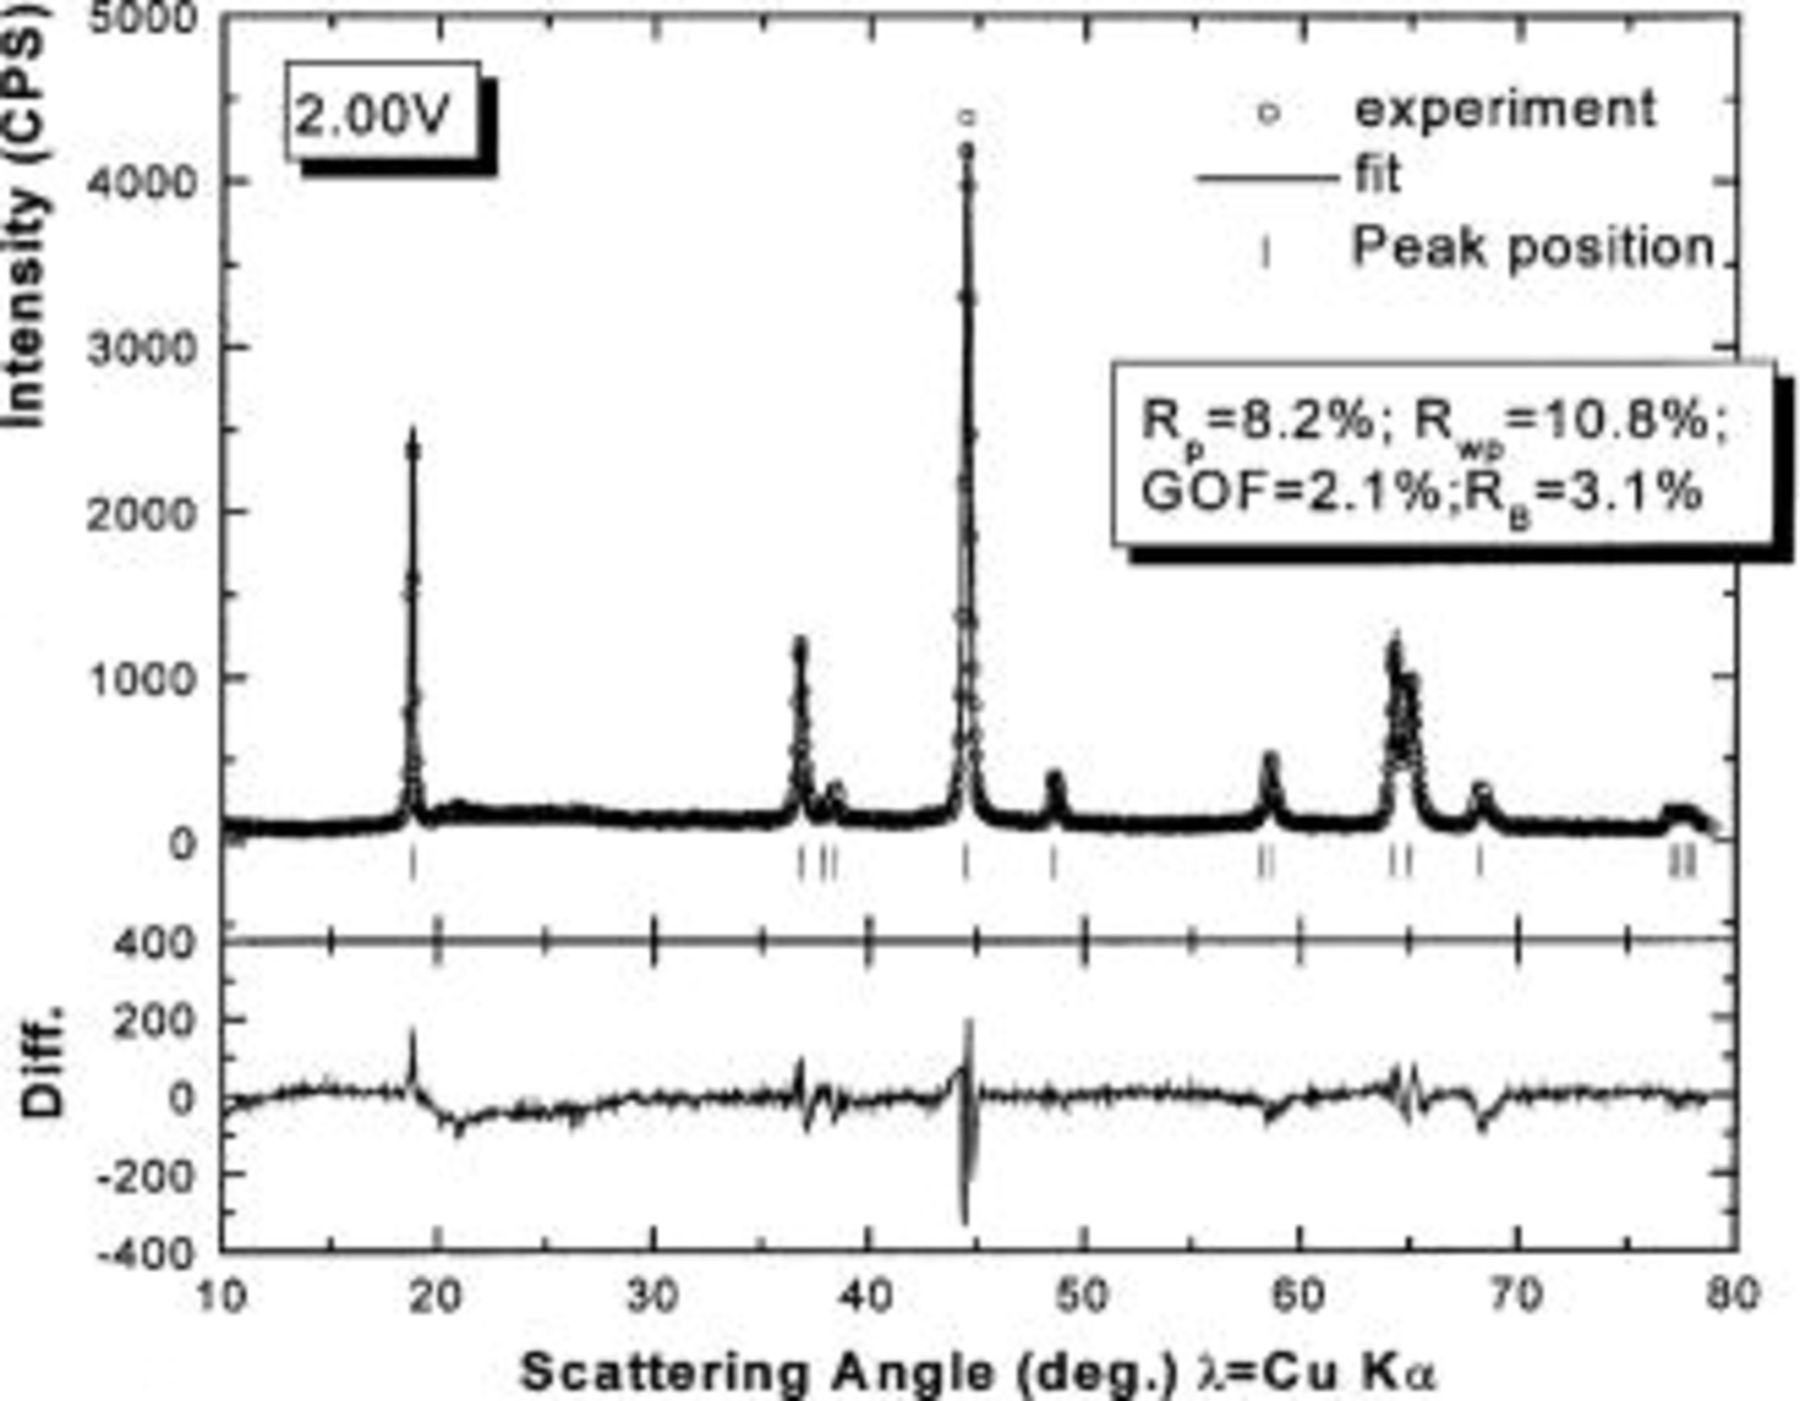
Figure 12. Rietveld refinement of the ex situ XRD pattern of 
 charged to 4.35 V and then discharged to 2.0 V: (○) the experimental data, (⎯) the fit, and (|) the expected peak positions. The lower section shows the difference between the fit and the experiment.
Figure 13 shows the refined ex situ XRD pattern of 
 at 2.0 V after a charge to 4.8 V. The fit quality looks very good; however, the inset in Fig. 13 shows that the (101) peak, located at about 36.5°, cannot be fitted well. There is a tail on the high-angle side of the (101) peak. A similar tail appears on the high-angle side of the (110) peak. These tails are not observed in the ex situ XRD pattern of
 at 2.0 V after a charge to 4.35 V. We do not understand the reason for these tails.
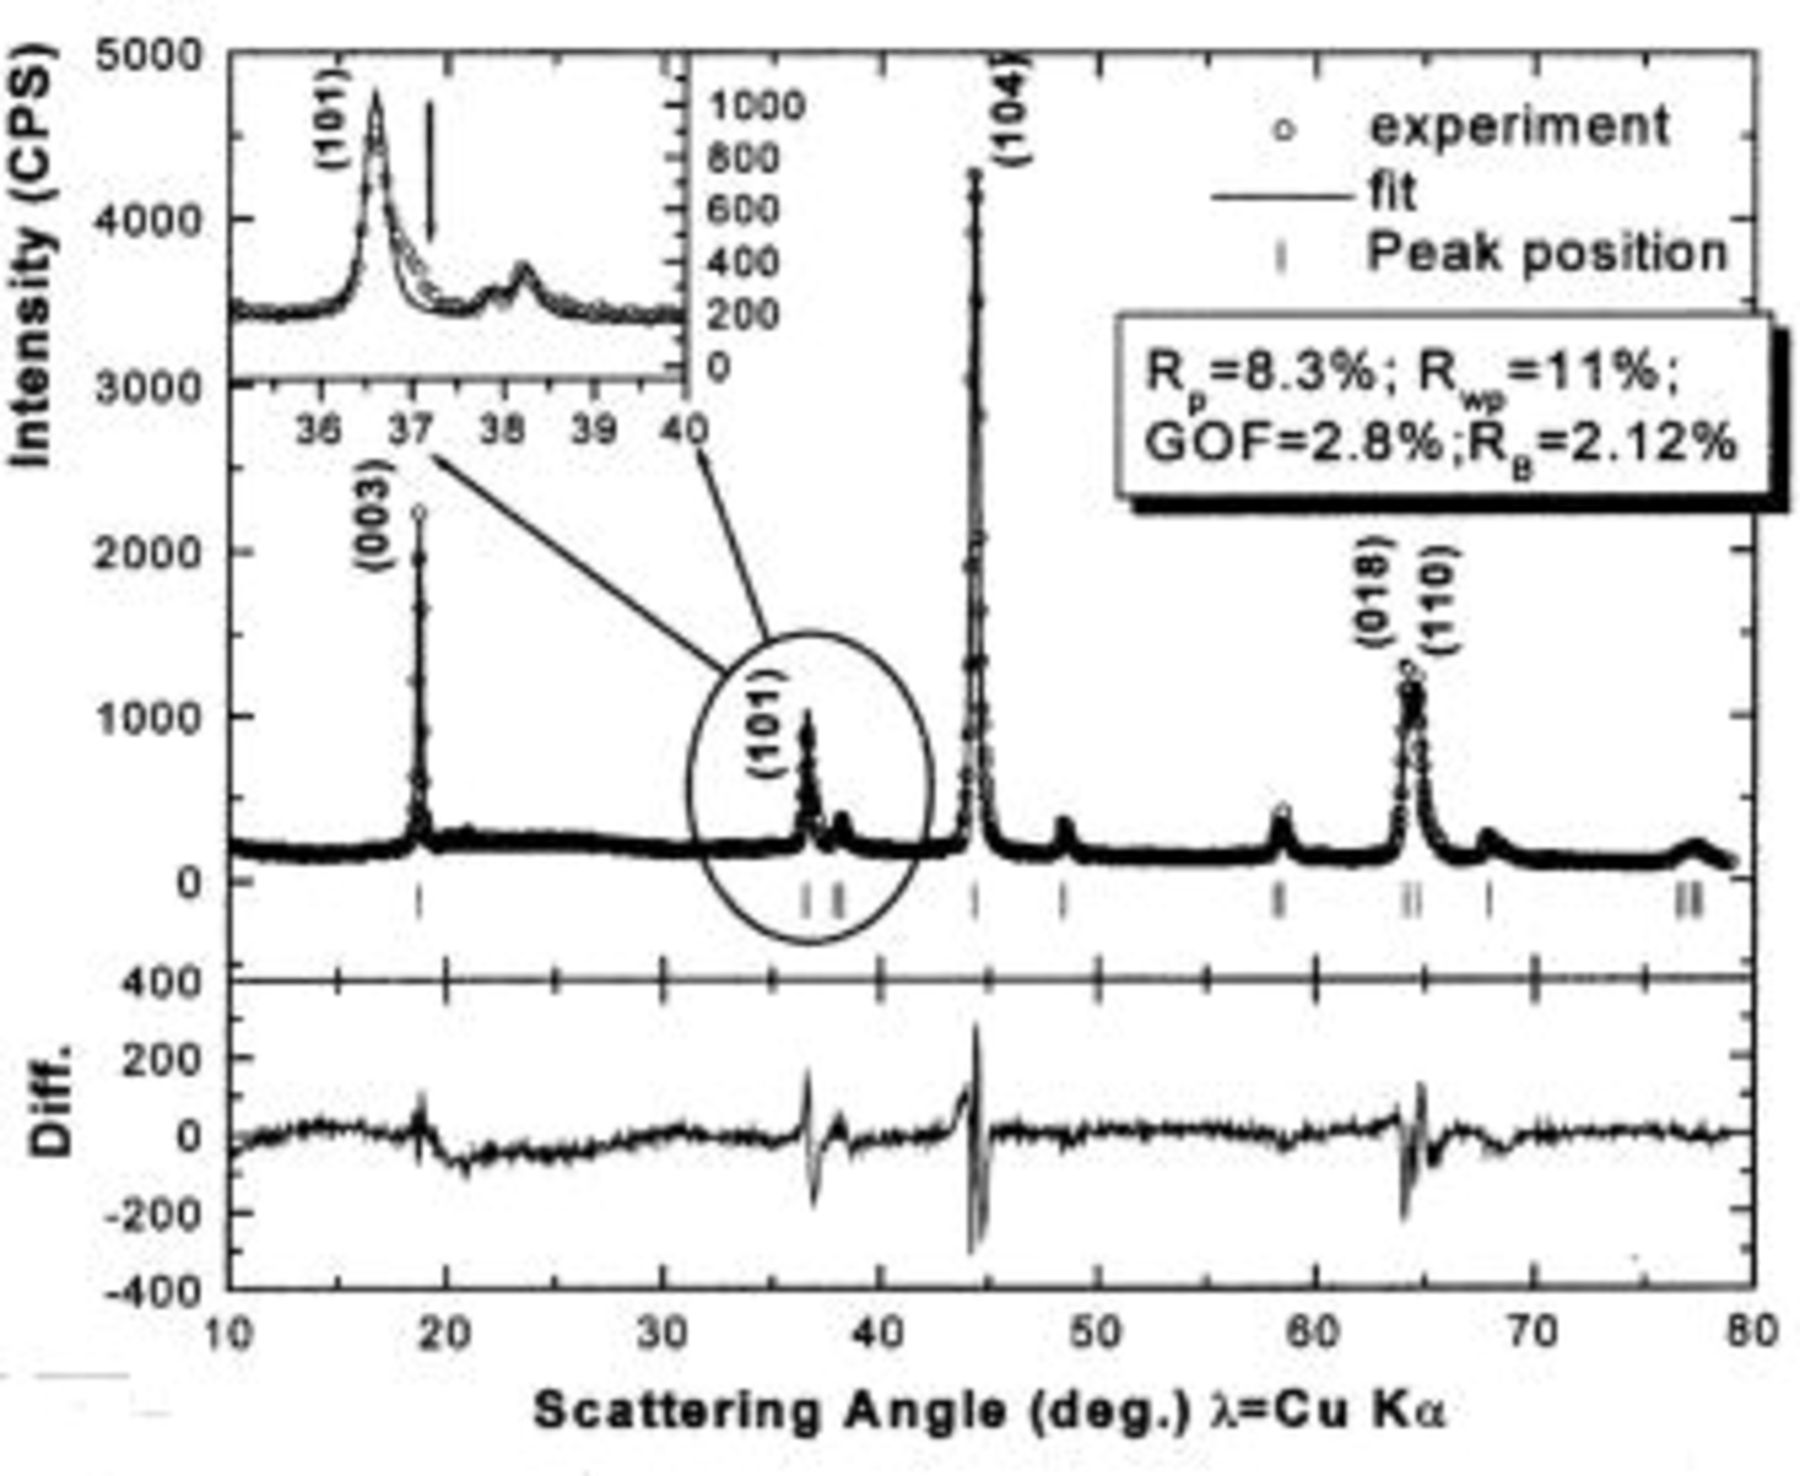
Figure 13. Rietveld refinement of the ex situ XRD pattern of 
 charged to 4.8 V and then discharged to 2.0 V: (○) the experimental data, (⎯) the fit, and (|) the expected peak positions. The lower section shows the difference between the fit and the experiment. The inset shows an enlargement of the (101) peak.
Discussion
Based on the results, we believe that the Cr atoms move to neighboring tetrahedral sites in the lithium layers and then either they or Mn atoms move to the octahedral sites in the lithium layers during the first charge. Can this explain the evolution of the peak intensities of the in situ XRD patterns (Fig. 3
4
5
6
7) during the charge-discharge process? Figure 14 shows a comparison of calculated integrated intensities of the XRD patterns for 
 with Cr (or Mn) in the Li layer (both octahedral and tetrahedral sites) and Cr in the transition metal layer (octahedral sites). In the calculation when the Cr (or Mn) is in the Li layer, we assume that the Cr (or Mn) homogeneously distributes on the tetrahedral and octahedral sites. Figure 14 shows that the Cr (or Mn) migration affects the intensities of the (003), (101), (104), and (018) peaks. In particular, the (003) peak intensity is reduced when transition metal atoms move within the Li layer, in agreement with the dramatic reduction in the intensity of this peak shown in Fig. 3. If the transition metal atoms remain in the transition metal layer, such a reduction in (003) peak intensity would not occur.
Figure 14. A comparison of the Bragg peak intensities of 
 before and after the Cr (or Mn) migrates to the tetrahedral and octahedral sites in the lithium layers.
The (110) peak intensity is not affected as long as the transition metal atoms are placed on the centers of octahedral or tetrahedral sites. [All atoms on A, B, or C sites scatter in phase for the (110) peak.] This is to be contrasted with the results shown in Fig. 7. We have attempted to model the ex situ XRD patterns in Fig. 9, 10, 12, and 13, allowing the Cr atoms to move off the center of the sites. Agreement between data and calculation worsens, suggesting the Cr is actually at the site centers. Another possible cause for the (110) intensity variation might be related to the oxidation state change of Cr, but this would not cause the factor of two variation shown in Fig. 7. Further experiments are needed to understand the behavior of the (110) peak.
Figure 14 shows that the transition metal migration from the octahedral site in the transition metal layer to the tetrahedral site and then to the octahedral sites in the lithium layer reduces all the peak intensities {except (110)}. The in situ XRD measurements also show this behavior during the first charge when the migration occurs. The intensities of all the peaks do not return to their original values [except for the (110) peak], which implies that the transition metal migration is not completely reversible. This irreversibility was confirmed by the ex situ XRD measurement. It is believed that the irreversible transition metal migration is the factor that makes the first charge curve of the electrode 
 different from the following ones. We also believe that the irreversible transition metal migration is the reason why this compound has a very large irreversible capacity. Transition metal atoms left in the Li layer block the reinsertion of lithium atoms, leading to the observed irreversible behavior.
Conclusion
Rietveld refinements of the ex situ XRD patterns of 
 show that Cr (or Mn) atoms move to the tetrahedral site and then to the octahedral site in the lithium layer when
  is oxidized to
  during Li extraction. Such a transition metal migration is only partially reversible. This irreversibility makes the first charge different from the following cycles. The presence of these transition metal atoms in the Li layer leads to large irreversible capacity.
Acknowledgment
The authors acknowledge the support of NSERC, 3M Corporation, and 3M Canada Corporation for funding this work.
Dalhousie University assisted in meeting the publication costs of this article.