
Abstract
The theoretical contributions to overall cell voltage in a proton exchange membrane fuel cell (PEMFC) were calculated, accounted for, and compared to measured IR free cell voltage as relative humidity  was varied from 30-110%. The intrinsic oxygen reduction reaction (ORR) kinetics in a PEMFC, with regards to water and proton activity, were shown to be independent of
  above 50-60%, but significant losses in ORR kinetics were observed at lower
  values. The losses amounted to ca. 20 mV at
  , corresponding to an approximate two-fold decrease in the ORR exchange current density. The dependence of ORR kinetics on water and proton activity is consistent with reduced
  activity at low
  .
.
Export citation and abstract BibTeX RIS
Proton exchange membrane fuel cells (PEMFC) that can operate simultaneously at high temperature  and low relative humidity
  are desired to improve water management and facilitate the removal of waste heat.1, 2 For the desired low
  PEMFC system operation, however, it is necessary to understand the impact of low
  operation on the electrode kinetics, particularly on the oxygen reduction reaction (ORR) kinetics, which is the major focus of this study.
Previously this concept was discussed by Uribe et al. , who proposed that slower ORR kinetics at low water content were due to ionomer surface restructuring, where hydrophobic components of the inonomer would come into contact with the Pt surface.3 Uribe et al. went on to conclude that this configuration is what lead to poor ORR reactivity at low  . More recently an experiment by Xu et al. found there to be an increase in overpotential of
  as
as  was lowered from 100% to 40%.4 Xu et al. proposed that the increase in overpotential at low
  was due to a lowering of the proton activity coefficient, the use of an alternate reaction pathway, or some combination of the two. However, in their analysis, Xu et al. failed to correct for protonic resistance in the catalyst layer, which can account for an appreciable portion of the change in overpotential.5 To ensure an accurate assessment of ORR kinetics with respect to
  , consideration must be given to all cell voltage contributions that vary with
  , including membrane resistance, protonic resistance in the catalyst layer, as well as kinetic and thermodynamic variations.
The present work examines the effect of  on ORR kinetics (i.e., how do water and proton activities effect the exchange current density of the ORR). A differential cell (a cell with uniform reactant concentration,
  and current density over the plane of the active area) is used to achieve a steady state and provide mass-transport-free operating conditions. Our approach is to compare the corrected empirical voltages, measured as
  is varied, to the anticipated voltage variations predicted by thermodynamics and gas partial pressure dependent kinetics. Having corrected and accounted for all other variables, the difference between these two sets of voltages will be solely due to the impact changing water and proton concentrations have on ORR kinetics.
Theoretical Background
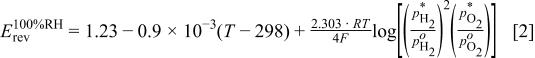
To elucidate the effect of  on the ORR kinetics, the overall cell voltage
  , in the absence of mass transfer losses, may be described as a summation of the various voltage terms and voltage losses in a PEMFC

where  is the thermodynamic cell potential at
  is the change in thermodynamic potential as water activity
  decreases (accompanied by an increase in gas partial pressures if the total pressure is maintained constant),
  is current density,
  is the
  -dependent cell resistance (the sum of the
  -dependent membrane resistance and the
  -independent contact and bulk electronic resistances),
  and
and  are the
  -dependent protonic resistances in the anode and cathode catalyst layer respectively,
  is the anode overpotential,
  is the cathode overpotential at
  is the change in cathode overpotential resulting from oxygen partial pressure variations that accompany operating at
  as opposed to
  , and
, and  is the change in cathode overpotential due to alterations in water and proton activity that arise from operating at
  as opposed to
  . Note that the last two kinetic terms were assumed to be separable, as
  does not affect
  or
or  . Finally, operating with pure oxygen at a low current density allows for the omission of a mass transport overpotential term as a contributor to overall cell voltage (see the discussion of the tafel slope in the Results and Discussion section). Clearly, operating a cell at low
  has thermodynamic, kinetic, and resistive consequences, which must be considered when assessing a fuel cell's efficiency. Quantification of these different terms in Eq. 1 will be outlined in the following.
The first term on the right-hand side (RHS) of Eq. 1, the reversible equilibrium potential at  , is a function of temperature
  and the partial pressures of
  and
and  at
at  6
6
where  is the reference partial pressure of 101.3 kPa for gas
  . Below
  , the above equilibrium potential changes by the term
  (second term on the right side of Eq. 1) which can be described as
where  is the partial pressure of gas
  at
at  and temperature
  , while
  refers to the actual
  and
and  partial pressures at the given temperature and
  condition.
The ohmic resistance of the cell (third term of the right side of Eq. 1),  , can be measured directly via ac impedance (i.e., high-frequency resistance (HFR) measurements) or current-interrupt methods.
The value of protonic resistance in the cathode catalyst layer (fourth term on the right side of Eq. 1) which is a function of  as well as a resistive contributor to cell voltage, can be approximated by
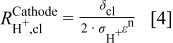
where  is the catalyst layer thickness,
  is the protonic conductivity of the electrolyte, ε is the volume fraction of ionomer present in the electrode, and n is taken to be unity (i.e., tortuosity is negligible).7 The factor of 2 in the denominator results from the average current through the entire catalyst layer being approximately one-half of the total current. This shows good agreement with a more intricate analytical solution for
  up to a current density of
  , and consequently will be sufficiently accurate for this discussion.8 Protonic resistance is related to the potential drop in the electrolyte phase through Ohm's law
  , and for state-of-the-art membrane electrode assemblies (MEAs) can be as much as 50 mV at
  and a current density of
  .5 Furthermore, because
  is a function of
  , the contribution of
  to
to  must be considered as
  changes to achieve a completely
  free cell voltage given by

The protonic resistance in the anode catalyst layer,  (fifth term on the right side of Eq. 1), can be neglected, as the exchange current density for the HOR is very large, on the order of
  ,9 meaning that the HOR occurs almost exclusively at the anode-electrode/membrane interface, thereby leading to negligible protonic resistance. Furthermore, the overpotential from the hydrogen oxidation reaction,
  (sixth term on the right side of Eq. 1), has been shown to be a negligible contributor to overall cell voltage and consequently its kinetic contribution to
  as
as  varies can be ignored.9 While these arguments are quite reasonable, a hydrogen pump experiment (see the discussion on quantifying the anode overpotential and proton resistance in the Results and Discussion section below) was performed to validate the assumption of negligible
  and
and  .
.
However, this is not the case for the overpotential of the oxygen reduction reaction (seventh term on the right side of Eq. 1) given by10
where  is the Tafel slope
  ,
,  is the cathode Pt loading,
  is the electrochemically available Pt surface area in the MEA, and
  is the exchange current density for the ORR which depends on temperature, oxygen partial pressure and perhaps water and proton activity. The exchange current density can be related to a normalized exchange current density as defined by Newman11 in
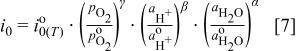
where the value of the exchange current density,  , is normalized to a standard
  partial pressure of
  , a standard proton activity of
  , a standard water activity of
  , and
, and  , and α are kinetic reaction orders. The activities from Eq. 7 are simply products of species concentration
  and species activity coefficient
  as shown in
where  is any species. Furthermore, because
  is proposed to be a function of proton and water activity, as well as a known function of oxygen partial pressure, Eq. 6 can be broken up into two types of overpotential below
  , that which is dependent solely on oxygen partial pressure, i.e., the eighth term on the right side of Eq. 1, and overpotential which is dependent on water and proton activity, i.e., the last term on the RHS of Eq. 1. The former,
  , is given by
and the latter,  , is given by
As discussed above, the major term of interest in this study is the dependence of the intrinsic ORR kinetics on proton and water activity,  . This term can be quantified by applying the above corrections for
  while neglecting
  and
and  for the outlined reasons. These assumptions together with Eq. 1, 5 allow for the determination of
  -induced changes in the ORR kinetics,
  , as
, as  is being reduced below 100%

A nonzero value of  in Eq. 11 would therefore imply that the ORR kinetics depend on water and proton conductivity (i.e.,
  ).
).
It has been suggested previously4 that a decrease in  would result in a decrease in proton and/or water activity, leading to an increase in cathode overpotential
  , i.e., a positive value for
  . However, in their experiments Xu et al.4 provided no compensation for the potential drop in the electrolyte phase
  , even though
  would be expected to be quite substantial due to the rather thick cathode electrode used in their study. Although this oversight may lead to questions about the validity of their claim, it does not make it unfeasible. To resolve this question, we will present a study in which we attempted to minimize the voltage loss terms in Eq. 1 which are difficult to quantify, demonstrating indeed that the dependence of the ORR kinetics in a PEMFC is negligible between 50 and
  and only becomes substantial at
  .
.
Experimental
Cell preparation and operating conditions
A low EW membrane ( ;
;  ) with a thickness of
  was hot pressed between two
  electrode decals. The decals had loadings of
  (anode) and
  (cathode). The electrodes were constructed with an ionomer
  mass fraction of 0.2 and a carbon supported Pt catalyst with a high Pt loading of 50 wt % Pt (Tanaka, Japan) to minimize the cathode electrode thickness and thereby its proton resistance (see Eq. 4). Gas diffusion media (DM) were treated in-house and are based on carbon fiber paper substrates (Toray Inc., Japan). Both anode and cathode DMs were hydrophobized with PTFE (polytetrafluoroethylene) and additionally processed using a proprietary surface treatment. A Teflon gasket was used to seal the DM and MEA between two graphite serpentine flow fields. Neat
  and
and  were used as reactant gases, and were passed through humidifiers, whose temperatures were varied to correspond with inlet RHs from 30% to 110% (in 20% increments). Current density was held at
  for 15 min, as a conditioning step, and then changed to
  for 2 h to allow the cell to reach a steady-state. This current cycling was done for each inlet
  . The cell was operated at 55°C,
  with stoichiometric
  flows of
  at
at  and
and  at
at  . Due to the high stoichiometric flows at
  , the maximum
  was only 10%, helping to ensure uniform
  across the membrane and uniform current distribution across the plane of the electrode (i.e., differential flow conditions).
AC impedance
Cell resistance was measured using ac impedance spectroscopy taken at a frequency of 1 kHz using a Solartron 1255 HF frequency response analyzer (Solartron Instrument, Houston, TX). High frequency resistances (HFRs) were measured every 20 s throughout the testing period and used to correct for membrane, contact and electronic resistances.
Quantifying cell electronic resistance
A completely identical cell, less a membrane, was built to determine the sum of the experimental cell's electronic resistances, i.e., contact resistances between the flow fields and DMs as well as bulk electronic resistances of the DMs and microporous layers. A power supply was used to pass a current of 50 A  through the dummy cell. The voltage drop across the cell was then measured to determine the cell's electronic resistance according to Ohm's law. Note that a cell build including a membrane would have two additional contact resistances between the electrodes of the MEA and the DM, as well as two electrode bulk resistances, but would not include a contact resistance between the two DM. However, ex situ measurements of contact and bulk electrical resistances have shown that the above mentioned MEA-DM and DM-DM contact resistances are an order of magnitude smaller than DM-flow field contact resistances; similarly, the electrode's electronic bulk resistance is negligible.10, 12 Therefore, the measurement of the overall ohmic resistance of this dummy cell is a reasonably accurate measure of the cell's electronic resistance during fuel cell operation.
Quantifying anode overpotential and proton resistance
A hydrogen pump test was conducted to confirm the assumption of negligible anode overpotential and proton resistance in a operating hydrogen fuel cell. In a hydrogen pump,  is supplied to both the anode and cathode side, with the hydrogen oxidation reaction (HOR) occurring at the anode and the hydrogen evolution reaction (HER) taking place at the cathode. The observed voltage was defined as the difference between the cathodic and anodic reactions. Hydrogen was provided to the anode at a constant rate of 1000 standard cubic centimeters per minute (sccm). The anode outlet was connected to the cathode inlet so that the exhaust hydrogen was fed into the cathode outlet. High stoichiometric flow rates, ranging from 7 at
  to 140 at
  , allowed for differential conditions and nearly identical gas compositions on both sides of the cell. The cell was kept at
  while current was swept from 0.02 to
  over a period of 100 s, with data taken every half second. This process was repeated for four different average RHs (100, 75, 50, and 35%). The cell HFR was measured simultaneously to compare with the slope of an
  vs.
vs.  curve in order to determine the significance of
  and
and  .
.
Electrochemical surface area
Hydrogen adsorption/desorption data was collected via cyclic voltammetry (CV) for the purpose of determining the cathode catalyst's electrochemically available surface area (ECA). The cell was kept at 25°C and ambient pressure while over-humidified gases (50°C dew points), hydrogen to the anode and nitrogen to the cathode, where provided at flow rates of 500 and 20 sccm, respectively. Voltage was swept at a rate of  from 0.075 to 0.6 V and plotted vs. the corresponding current. After correcting for cross-over current, the electrochemical surface area was determined by integrating the H-adsorption charge in the cathodic sweep (shaded area in Fig. 2).
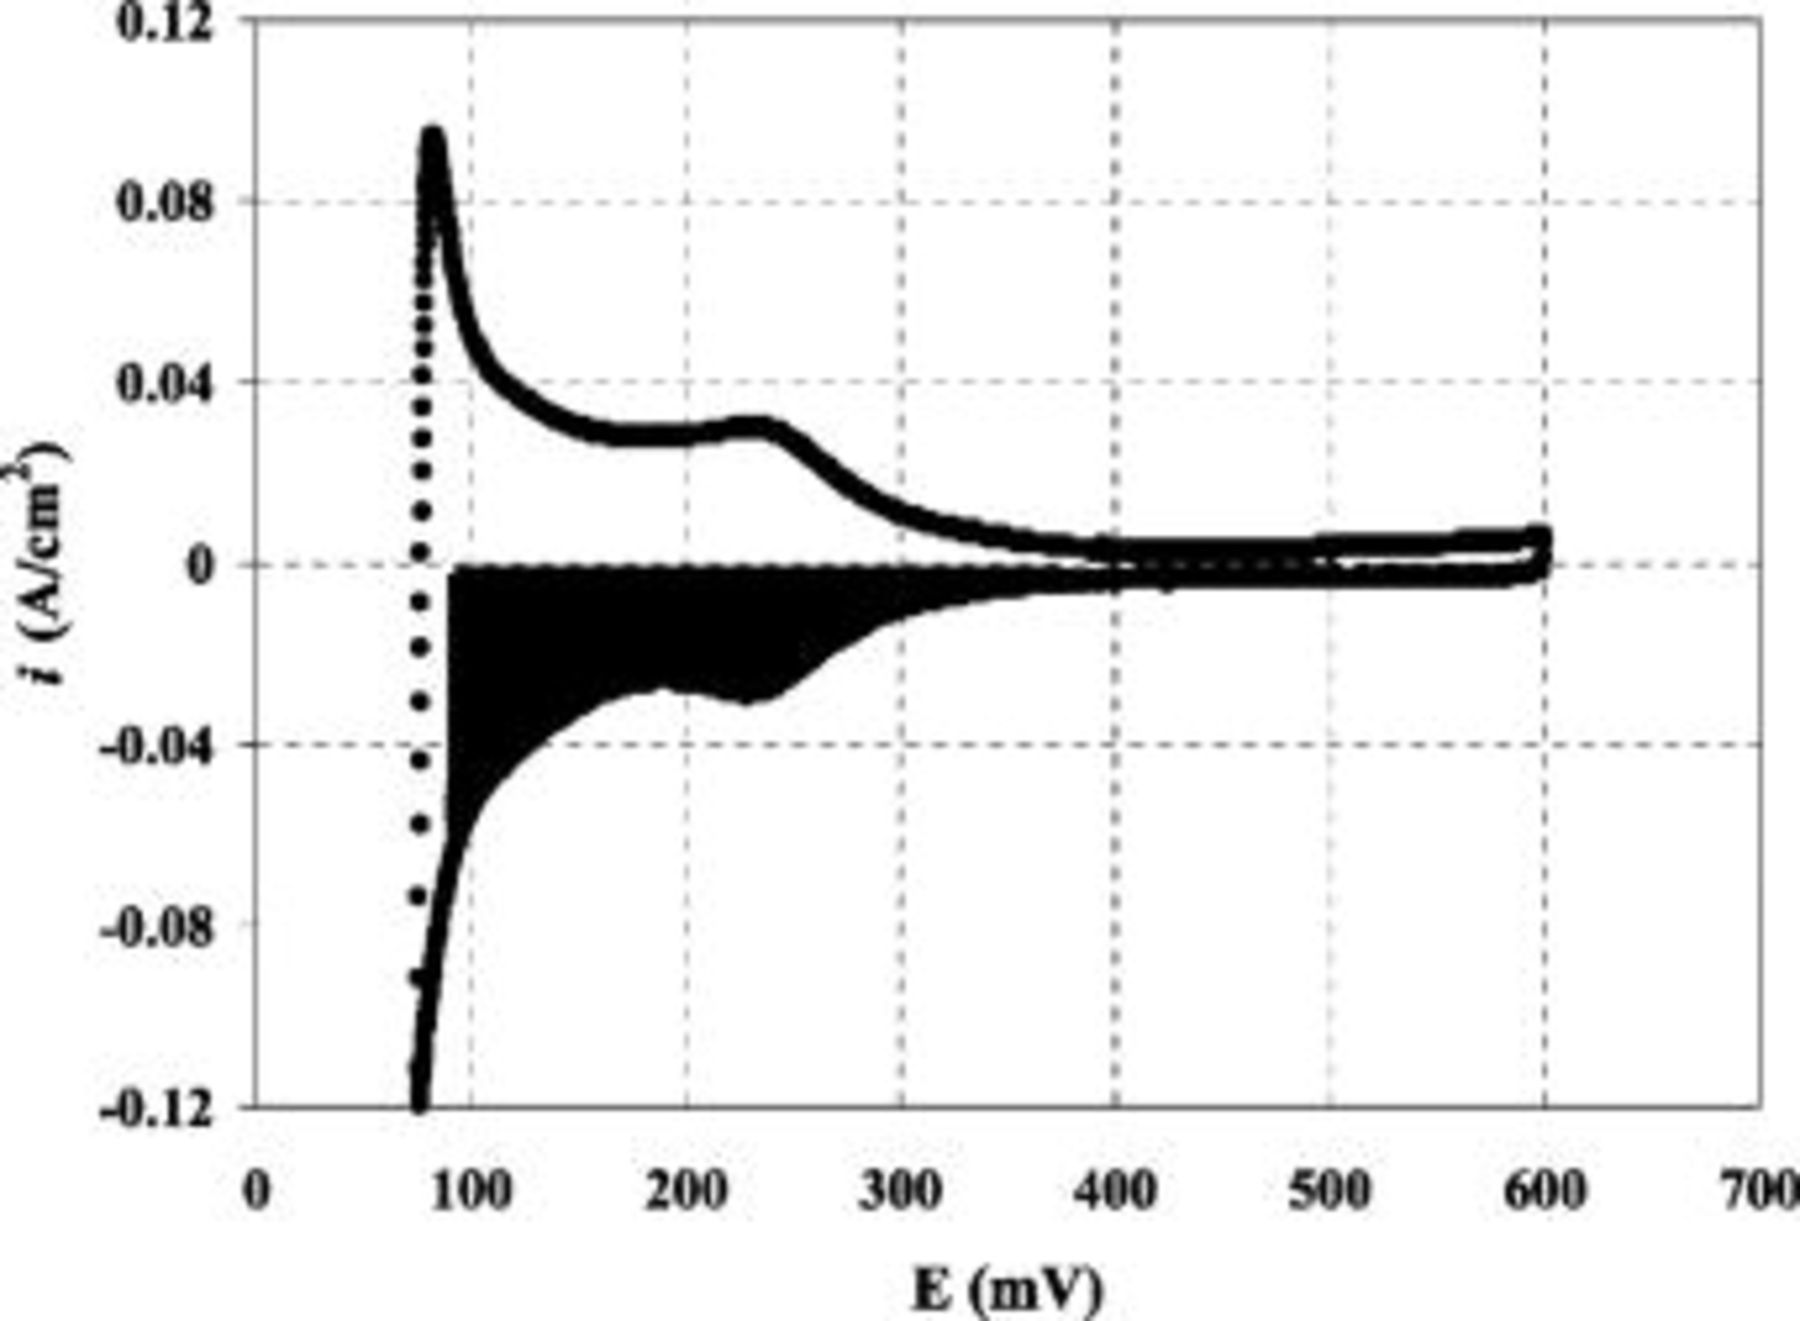
Figure 2. Hydrogen adsorption/desorption data taken from 0.075 to 0.6 V after cross-over current correction. Shaded portion represents the cathode catalyst's electrochemically available surface area. CV was performed at 25°C with overly humidified gas flows of 500 sccm  and 20 sccm
  on the anode and cathode sides, respectively.
Tafel slope
A Tafel slope was determined for a cell operating at 55°C and  and
and  , with flows of 1000 and 2000 sccm for hydrogen and oxygen, respectively. The cell was operated in constant current mode and voltage was measured at current densities of 0.03, 0.05, 0.1, 0.2, 0.3, and
  . The cell was held constant at each current for a period of 15 min, to ensure steady state, and the last 5 min were averaged and plotted vs. the IR-corrected cell voltage. The slopes of the
  vs.
vs.  curves were then compared to the theoretical Tafel slope value of
  .
.
Ex situ membrane conductivity
Membrane conductivity was measured in the through plane direction using the four point probe method. Two 0.5 by 4.0 cm membrane sections were punched out with a die, and held in position over the four point probe with a PTFE hold down over the current carrying electrodes. Three membranes were tested simultaneously; two samples of the material in question and Nafion-112, used as a reference. The testing cell was placed in a reaction vessel with temperature and  monitoring. Placing the entire apparatus in a mechanical oven and monitoring the temperature on the probe itself with a Pt thermistor allowed for temperature control.
  was measured with a calibrated Vasiala HMP 243 humidity probe, which fed back to mass flow controllers that varied the ratio of wet/dry gas feed to the system. A Parstat 2263 measured the impedance spectrum from 1 to 200 kHz, and membrane resistance was taken as the real component at minimum phase angle. A multiplexer switched the Parastat to each membrane. Conductivity was measured at 30, 60, 80, 95, 110, 120, 130, and 140°C in
  intervals by holding temperature constant and scanning
  in 10% increments for 1 h at each
  . However, it is generally observed that the membranes reach equilibrium within the first few minutes.
Ex situ hydrogen permeability
A  membrane was sandwiched between two
  carbon fiberpapers and PTFE gasketing materials. Hydrogen was humidified through a saturator to the desired level and kept at a differential pressure of 10 psi across the cell. Water in the hydrogen permeate was condensed and separated and the dried hydrogen was collected and measured volumetrically by displacement of water. The membrane was characterized at 30, 60, 80, and 95°C in
  intervals.
Water uptake in the membrane
Water uptake was measured using a Rubotherm magnetically isolated balance. An  sample is placed on the hang-down wire and placed in an isolated furnace.
  was measured with a calibrated Vasiala HMP 243 humidity probe, which fed back to mass flow controllers that varied the ratio of wet/dry gas feed to the system. Gas flow rates were compensated according to water activity such that the volumetric flow rate of humidified gas past the sample was constant. The membranes were characterized at 30, 60, 80, and 95°C in
  intervals, for 30 min at each
  , though generally equilibrium occurred in the first 10 min.
Results and Discussion
Quantifying anode overpotential and proton resistance
To quantify the contribution of anode overpotential and anode proton resistance to cell voltage in an operating fuel cell, a hydrogen pump experiment was performed as described above. The observed voltage for a hydrogen pump can be described by
where  in this context refers to the anodic potential less the cathodic potential,
  is the overpotential for the hydrogen evolution reaction, and all other symbols are consistent with their previous definitions. The coefficient of two in front of the protonic resistance term is due to the fact that one has to consider the transport of protons on both sides of the MEA.
As current density approaches zero, the observed cell voltage for a hydrogen pump should approach its thermodynamic potential (first term in Eq. 12). Because one flow services both the anode and cathode simultaneously, and this flow is considered to be differential, the partial pressure of hydrogen on the two sides should be roughly equal and, hence, the thermodynamic contribution to cell voltage will be approximately zero. For cases where current density is greater than zero and where concentration overpotentials are negligible (i.e., fast  diffusion),
  and
and  should be linearly related to current density in regions of low overpotential (via a Maclaurin series expansion (linearization) of the Butler-Volmer equation13) and one would expect
  to increase linearly with current density.
As shown in Fig. 1a, the relationship between  and
and  is indeed linear with correlation coefficients approaching unity and intercepts near zero (see Table I), regardless of
  . For a straight line with a zero intercept, the relationship in Eq. 12 can be represented via

where  and
and  are the linearized kinetic resistances for the HOR and HER.
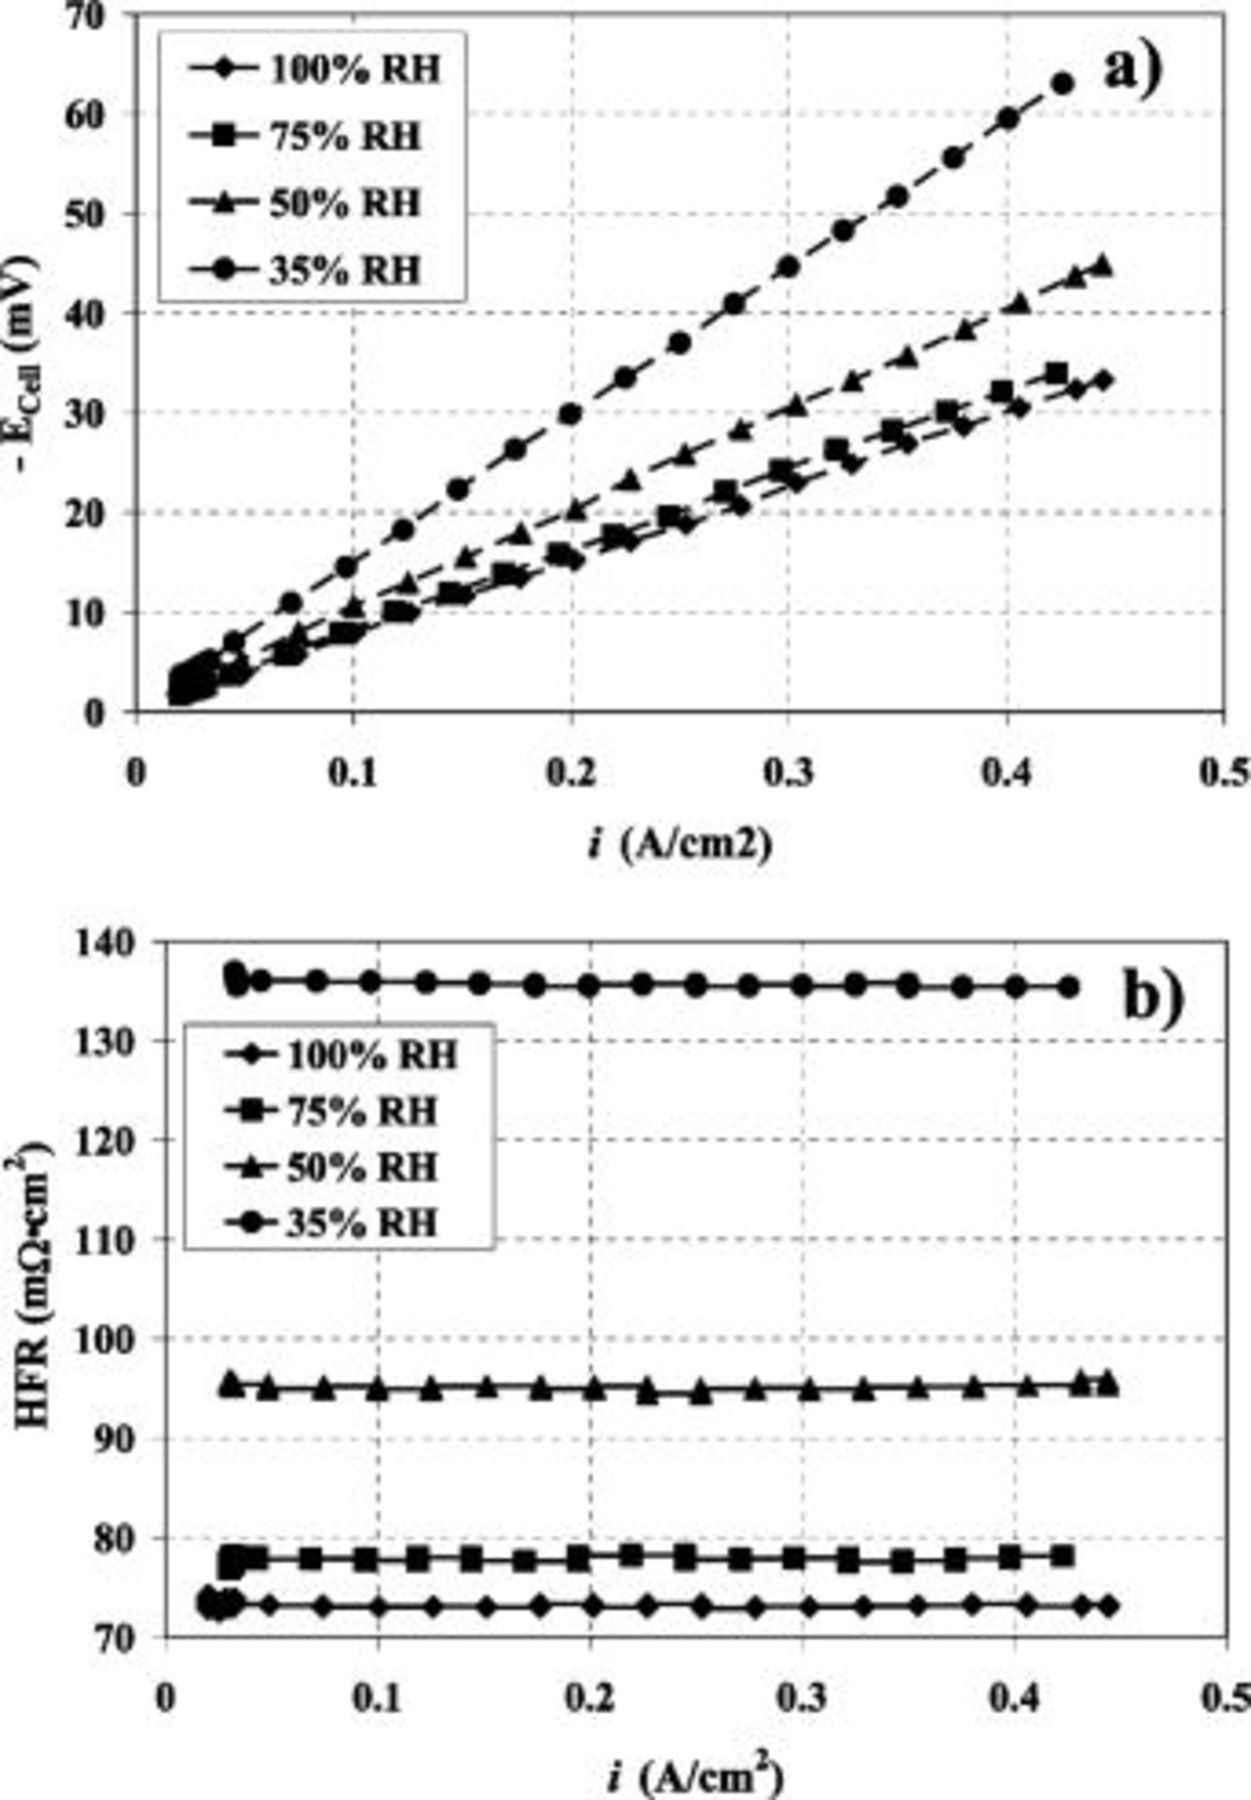
Figure 1. (a) Cell voltage vs. current density for a hydrogen concentration cell operating at  and 55°C with a flow rate of 1000 sccm of
  for four different
  values. (b) HFR vs. current density. (Same conditions as 1a.)
Table I. Parameters derived from the results of a hydrogen pump experiment, where the intercept, slope and correlation coefficient values are derived from the data presented in Fig. 1,  is the high frequency resistance, comprised of membrane, contact and bulk electronic resistances, and
  represents the maximum possible error in our experiments, which arise from neglecting contributions of the HOR and HER overpotentials and their associated protonic resistance in the electrode.

| Intercept [mV] | Slope 
|

| Correlation coefficient |
 at at 
|
|---|---|---|---|---|---|
| 100 | 0.30 | 0.074 | 0.073 | 0.9998 | 0.1 |
| 75 | 0.30 | 0.80 | 0.078 | 0.9997 | 0.2 |
| 50 | 0.23 | 0.101 | 0.095 | 0.9967 | 0.6 |
| 35 | 0.26 | 0.148 | 0.136 | 0.9999 | 1.2 |
If it is assumed that protonic resistance in the electrode  and both overpotential terms (
 and
and  ) are negligible, then the value of the measured slope should be the same as the measured high-frequency resistance (measured HFRs are displayed in Fig. 1b).
Table I displays the intercept, slope and  values obtained from the hydrogen pump experiment for each
  condition. Indeed, the slope and measured HFR
  data agree across the
  range with only minor differences at decreasing
  . As shown by Eq. 13, any difference between the actual measured HFR
  and the determined slope, is attributed to nonzero contributions from HOR and HER kinetics (
 and
and  ), as well as proton resistance terms in the electrodes
  . Operating at
  , the resulting voltage term
  due to
  oxidation/evolution reactions is displayed in Table I and shown to be not more than
  for the worst case. This error is considered to be a maximum possible error because in an operating PEMFC there is no contribution from
  (last term in Eq. 13) or from the proton resistance associated with that reaction. As a result, anode protonic resistance loss (i.e.,
  ), and HOR contributions (i.e.,
  ) to the overall cell voltage are negligible
  in our experiments.
Electrochemical surface area
Hydrogen adsorption/desorption data was collected via cyclic voltammetry for the purpose of determining the cathode catalyst's electrochemically available surface area. Figure 2 shows the relationship between  and
and  as cathode voltage was swept from 0.075 to 0.6 V and back down to 0.075 V using driven cell mode (i.e.,
  anode serving as counter and reference electrode, while sweeping the potential of the
  -purged cathode electrode). The shaded portion of Fig. 2 is the electrochemically available surface area on the cathode side, whose value of
  , when normalized for Pt loading, agrees well with previously established values of
  for
for  .14 This concurrence of ECAs assures that the thin low Pt loaded electrode has good overall catalyst utilization, allowing for performance comparisons between MEAs of different Pt loading (discussed below).
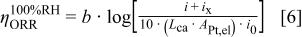
Tafel slope
To confirm the assumption that the cell followed Tafel kinetics (i.e., that the Tafel slope was  @ 55°C) cell voltage was measured at operating current densities of 0.03, 0.05, 0.1, 0.2, 0.3, and
  . Figure 3 shows a semi-log plot of
  free voltage vs. log of corrected current density
  , available after corrections for HFR (membrane, contact, and bulk electronic resistances) and crossover current are made. The solid line in Fig. 3 represents a linear regression for the observed
  vs.
vs.  data. The
  slope received from the linear regression is in very good agreement with the theoretical Tafel slope of
  . This agreement verifies the assumption of no oxygen diffusional losses (i.e., transport losses) for a fuel cell operating at
  with differential flows of pure oxygen. Furthermore, the value of 833 mV received at
  and
and  is identical to the voltage received at
  during the protocol to investigate the effect of
  on cell voltage (see Fig. 6b), demonstrating the excellent consistency between the Tafel slope and
  data.
data.
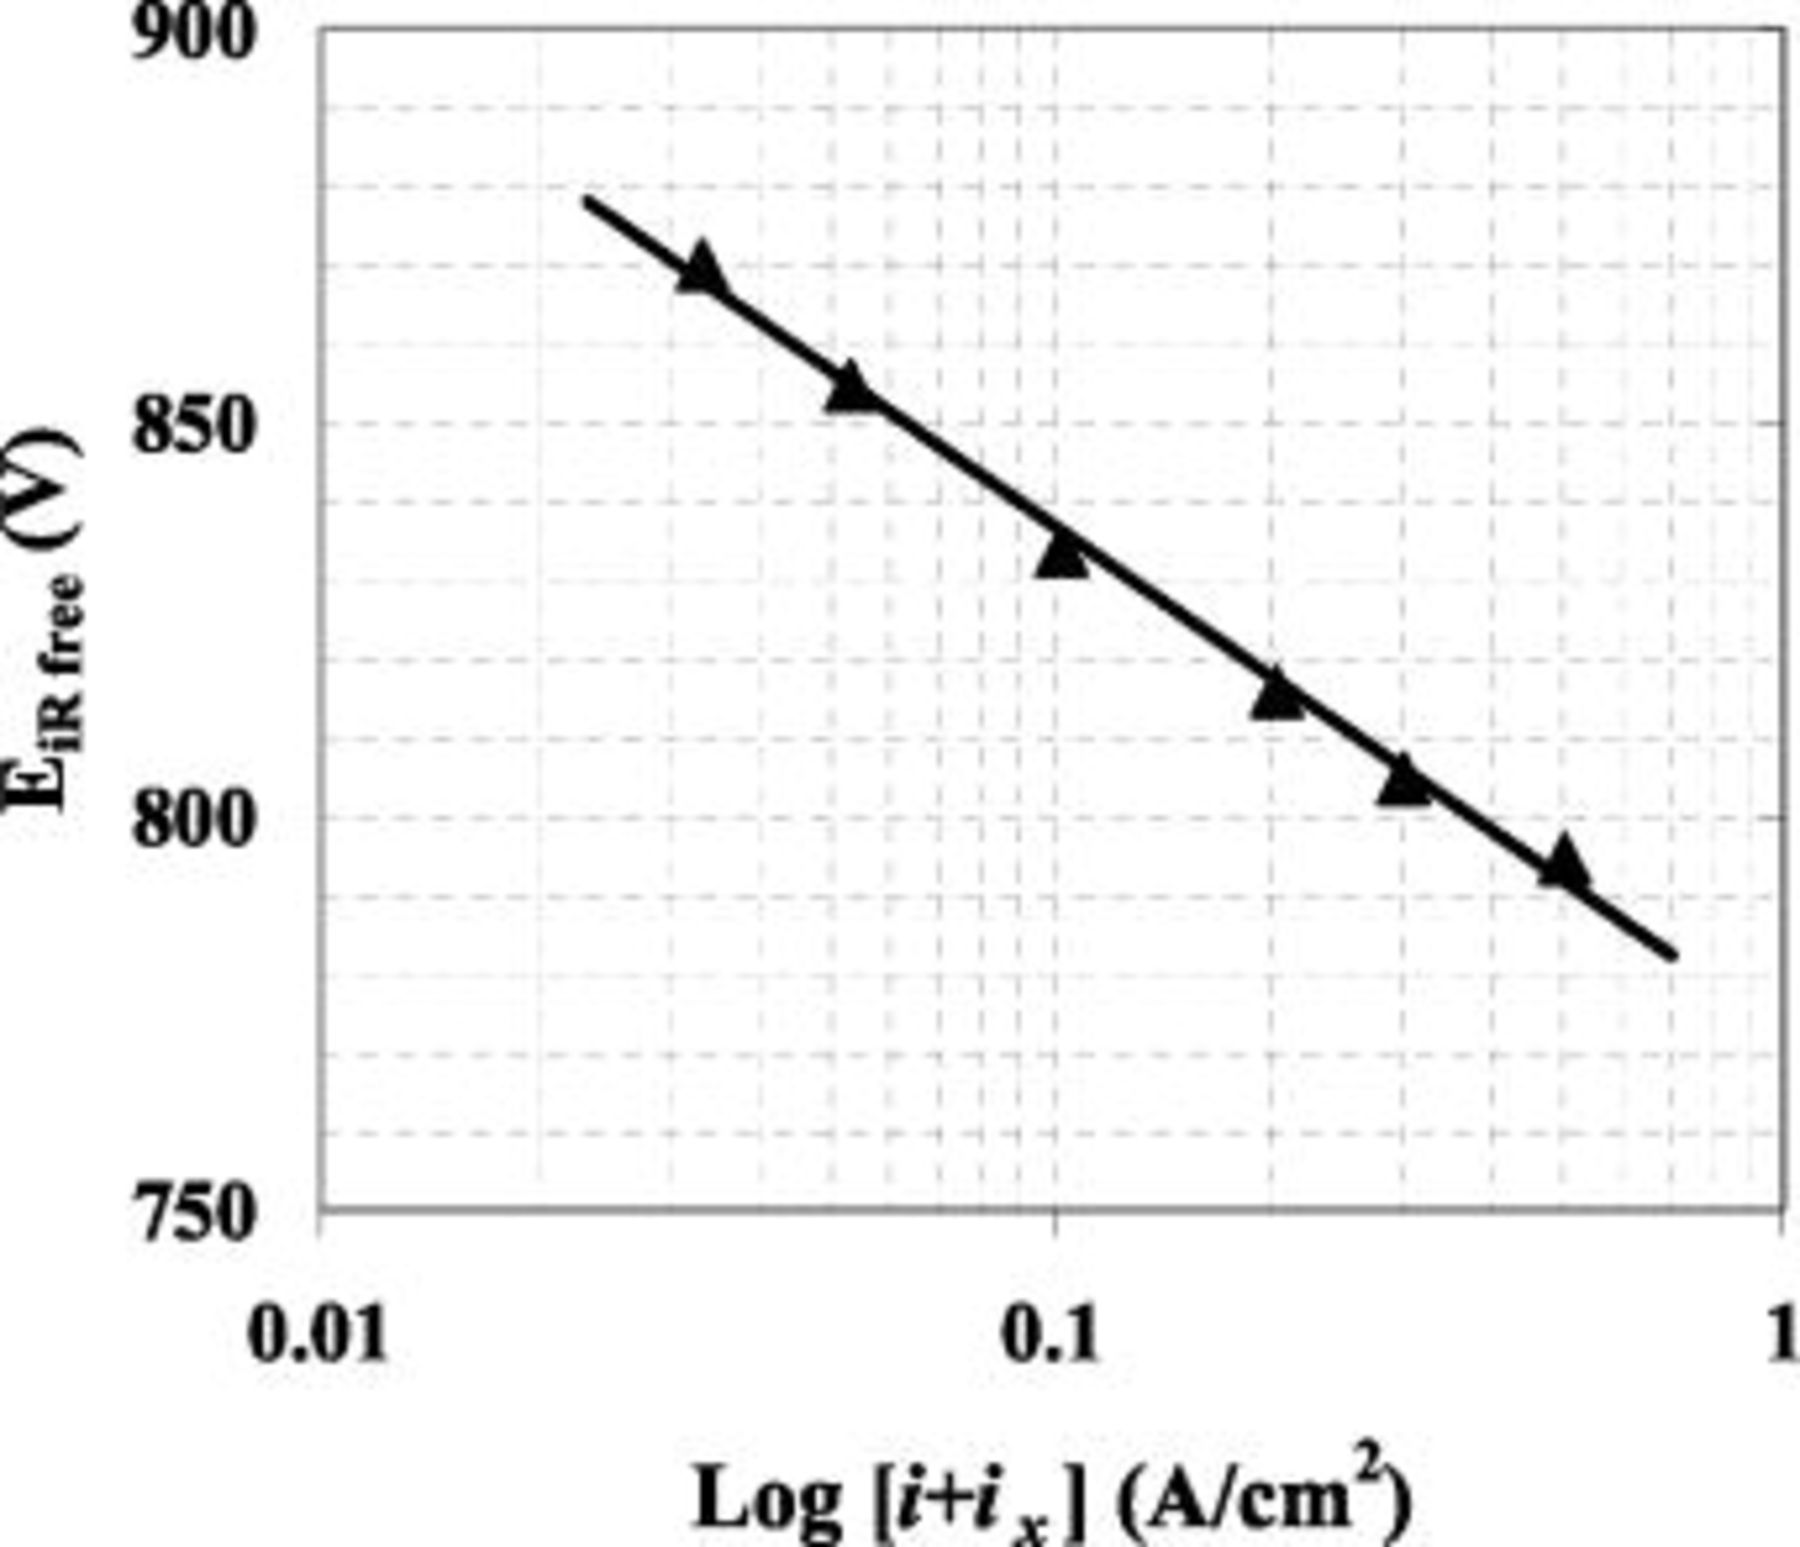
Figure 3.
 vs.
vs.  for
for  . Cell was operated in constant current mode at
  and 55°C with fully saturated flow rates of 1000 and 2000 sccm for
  and
and  , respectively. The solid line represents a linear regression of the observed data, whose slope of
  is apparently identical to
  @ 55°C. The triangular points represent an average of the last five minutes of operation at a given current density.
Figure 6. (a) Uncorrected observed voltages taken at  (solid line) and observed HFR (dashed line) vs.
  (operating conditions are the same as in Fig. 4). Standard deviations and
  uncertainties are shown as error bars in the y and x- directions respectively; though for HFR the error bars are minimal. (b) Observed IR corrected cell voltages taken at
  (dashed line, see Eq. 5) and theoretical voltage (solid line, see Eq. 14 and explanation therein) vs.
  . Observed voltages plotted were averaged over the last 15 min of cell operation at a given
  . Voltage standard deviations are plotted as error bars in the y-direction and
  uncertainties plotted as error bars in the x-direction.
Membrane/flow-field  gradients

To assess the effect of  (water activity) on ORR kinetics, inlet cell
  was increased from 30-110% in
  increments. Following an initial membrane-conditioning step of 15 min at
  , current density was held constant at
  for 2 h to ensure steady-state operation. Use of a thin
  low EW membrane and a low current density
  also aided in assuring that the
  of the membrane,
  , was equal to the
  of the gas in the flow field,
  . To confirm this assumption, the electronic resistance of
  , whose value was determined ex situ as described above, was subtracted from the on-line HFR measurement to yield the in situ membrane resistance which then can be compared to the membrane resistance calculated from the ex situ conductivity measurements, as is shown in Fig. 4. Note that the calculation of through-plane membrane resistances from in-plane conductivity measurements assumes isotropic membrane conductivity properties, a fact recorded by many authors (see, for example, Refs. 15, 16), with few exceptions (see, for example, Ref. 17). The excellent agreement between ex situ measured membrane conductivity at a given
  and the in situ membrane resistance at
  in Fig. 4 validate that
  (at low current density) and confirms that the cell has reached steady-state and is operating under equilibrium conditions.
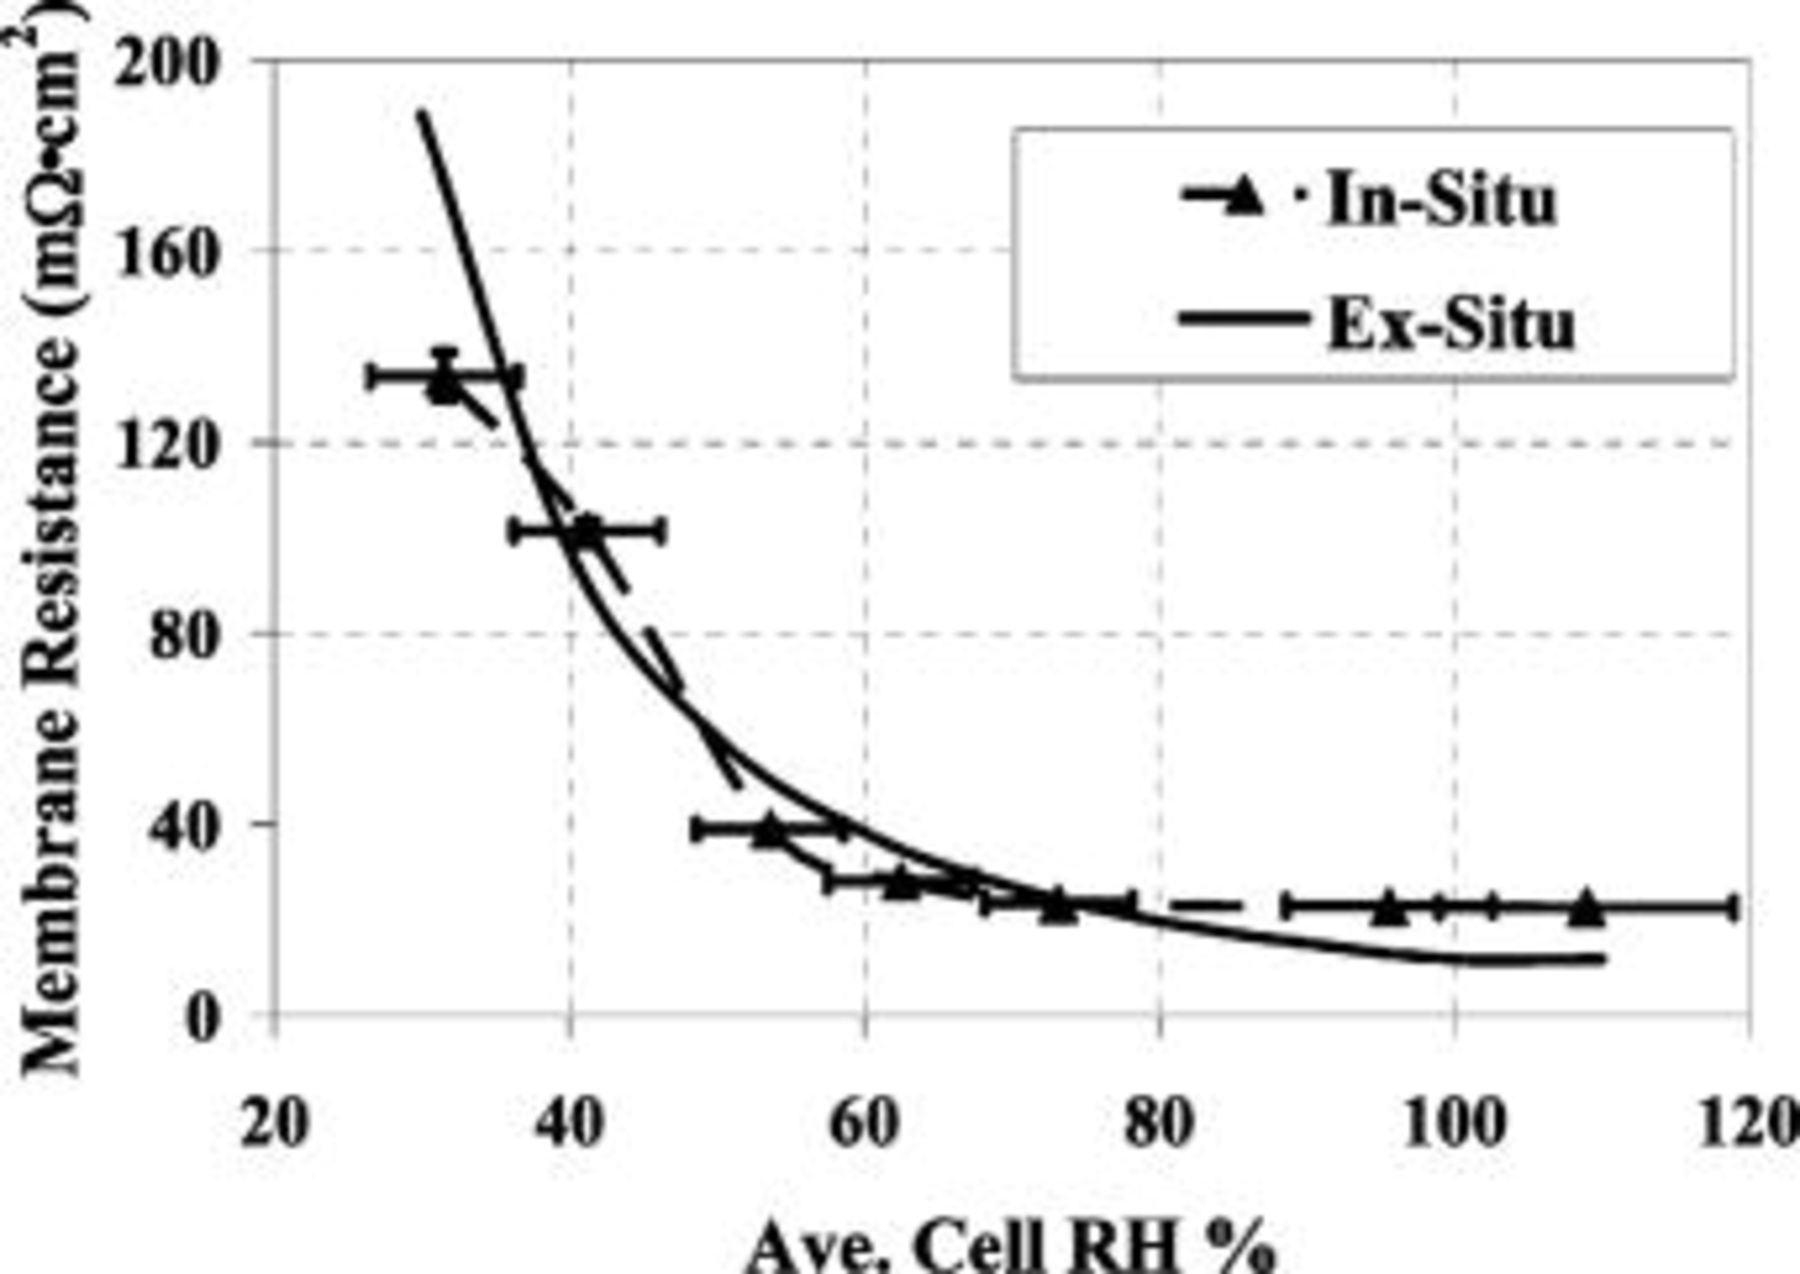
Figure 4. Membrane resistance vs. average cell  for a cell operating at
  , 55°C,
  , with stoichiometric
  flows of
  . Plotted resistances are values averaged over the last 15 min of cell operation at a given
  and their standard deviations are plotted as error bars in the y direction.
  uncertainties are plotted as error bars in the x-direction.
Electrolyte potential gradient in the electrode
A low EW ionomer (i.e., highly  conductive) in combination with a thin cathode electrode (ca.
  ) was used to minimize the protonic resistance across the cathode electrode,
  (see Eq. 4). In addition, kinetic measurements were conducted at low current density
  to minimize the potential drop in the cathode electrolyte phase,
  . This is illustrated in Fig. 5, showing the cathode electrode potential drop,
  , vs. current density for different ionomers and catalyst layer thicknesses at
  . For a conventional catalyst layer
  thick made with 1100 EW ionomer operating at
  a value of
  is calculated. Assuming Tafel kinetics and using Eq. 6, one may estimate the ratio of current density at the membrane/cathode catalyst layer interface
  to current density at the cathode catalyst layer/DM interface
  as shown by

Figure 5. Relationship between potential drop in the cathode catalyst layer's electrolyte phase  and
and  . Values plotted correspond to an ionomer fraction of 0.2, an
  of 30% and are derived from Eq. 4.
For the aforementioned high EW ionomer where  (Fig. 5, solid line) and using
  at 55°C, the current density across the cathode electrode is estimated to vary by a factor of 4, a result similar to that received by a more involved analytical approach.8 This means that the current distribution is far from uniform inside the cathode catalyst layer and, consequently, the ORR kinetics cannot be easily assessed without elaborate mathematical modeling of the current distribution within the cathode electrode. For a low EW ionomer with the same electrode thickness operating at the same current density,
  (Fig. 5, long dashed line) and the ratio of currents across the catalyst layer drops to 2.2, significantly lower, but still far from uniform. For the performed experiment, using a low EW ionomer and a
  thick cathode electrode,
  drops to
  (Fig. 5, short dashed line), producing a variation of the current density across the cathode electrode of only
  and thereby enabling a relatively accurate assessment of the ORR kinetics. Therefore,
  gradients across the cathode catalyst layer are minimal for our experimental MEAs, and the only factors affecting
  (see Eq. 5) with respect to
  variations are
  -induced changes in partial pressure of reactant gases, water activity, and protonic activity.
crossover induced errors

From Fig. 5 it is evident that a lower current density is preferred, as it yields a lower  . However, the current density must be high enough that any
  crossover current does not represent more than a negligible percentage of the operating current density, and most importantly does not vary significantly across the range of
  being tested. The
  crossover current
  at 55°C and 300 kPa ranged from
  at
at  to
to  at
at  , making
  only 3-4% of the total current and varying by only 1% of the total current in the experimental
  -range. Hydrogen permeability
  , used to calculate crossover current, showed the same trends with respect to
  as those observed by Broka and Ekdunge for Nafion-117.18 Values for
  permeability received from the previously described experiment (see Experimental section) ranged from
  at
at  and 60°C to
  at
at  and 60°C.
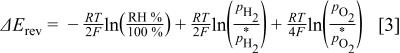
Partial pressure induced thermodynamic and kinetic voltage changes
To minimize error and isolate the kinetic effects of proton and water activity on the ORR, the partial pressure of water  , and consequently
  and
and  must not be strong functions of
  . This precaution arises from debate over the correct kinetic reaction order
  for the ORR (evaluated at constant overpotential rather then constant cell voltage). Published values for γ (see Eq. 7, 9) range from 0.75 (see Ref. 8 and references therein), used in this paper, to 0.60.19 Minimizing the voltage correction for the partial pressure of oxygen allows for minimization of any possible error and/or debate over the correction. This minimization is accomplished by operating at low
  and high
  where the water vapor mole fraction is small. Operating at 80°C and
  yields a total voltage difference,
  , of
, of  from
from  . When the cell-operating pressure at 80°C is increased to
  , this difference decreases to around 26 mV for the same range of
  . However, if the temperature is lowered to 55°C and the cell is operated at
  as in our experiments, the anticipated change in voltage drops to about 18 mV from 30 to
  , only 2 mV of which is attributed to the kinetic contribution from a partial pressure change of oxygen. The remaining 16 mV can be attributed to thermodynamic contributions, illustrated in Eq. 3, the majority of which comes from a change in water activity.
Because all of the possible voltage contributions, besides those from an alteration of proton or water activity on ORR kinetics, have been accounted for, it is reasonable to assume that any deviation from the calculated/theoretical  is due to a change in the ORR kinetics by the variation of
  and/ or
  (i.e.,
  ).
).
MEA voltage variation vs

Figure 6a displays the uncorrected observed cell voltage (solid line), along with the observed cell HFR (dashed line). As previously shown in Eq. 5, the observed HFR, along with the protonic resistance in the cathode catalyst layer, allows for the determination of a completely  -free cell voltage. This
  -free cell voltage is shown as a function of
  in Fig. 6b (dashed line). The observed cell voltage of 825 mV at 55°C,
  and
and  oxygen (see Fig. 6b) is in reasonable agreement with the 845 mV received by Gasteiger et al.10 for a cell operating at 80°C,
  , and
, and  oxygen, when adjustments are made for the difference in operating temperature: at the same mass-specific current density
  of
of  and at negligibly different reactant partial pressures, using
  20, 21 results in approximately a 20 mV improvement when temperature is increased from 55 to 80°C, making it near perfectly consistent with the observed voltage difference between the two conditions.
Figure 6 also displays the calculated decline in theoretical  -free cell voltage, obtained from a rearrangement of Eq. 11, shown

The  -free voltage at
  , i.e., the first term in Eq. 15, is taken to be an average of the experimentally observed
  -corrected voltages at 90 and
  . The solid line in Fig. 6b is the summation of the aforementioned
  -free voltage at
  , the thermodynamic change in cell potential
  , and the change in the ORR overpotential with respect to oxygen partial pressure
  . The change in the ORR overpotential with respect to water and proton activity (
 , last term in Eq. 15) is taken to be zero. Therefore, any deviation of the observed (dashed line in Fig. 6b) from the theoretical (solid line in Fig. 6b) can be attributed to a change in water and/or proton activity.
The agreement shown above between theorized voltage and observed voltage at 100%, where observed voltage is really an average of the voltages at 90% and  , allowed us to extrapolate back from this point, correcting only for
  and
and  , to establish a theoretical prediction of voltage behavior from 100 to
  . Because observed and theoretical voltages (accounting only for thermodynamic and
  partial pressure induced voltage changes) agree within 5 mV between
  and
and  , it is reasonable to state that the kinetic contributions from water and proton activity
  are either nonexistent or negligible in this region. However, the deviation of the observed voltage from that predicted by thermodynamics and
  partial pressure below
  suggests that
  does indeed play an increasing role in this very low
  region, amounting to ca. 20-25 mV at
  (see Fig. 3).
The reduced ORR kinetics at  values below 50-60% may be rationalized by learnings derived from molecular modeling studies of the
  hydration/dissociation mechanism for perfluorosulfonic acid groups
  which indicate that
  becomes rapidly more available/active in the vicinity of
  22–24
22–24  . Although the exact uptake at which protons are believed to increase in activity or availability is both in dispute and not definitive, the range of values presented in literature (
 ,22 2.5,23 3 24) are consistent with each other within a reasonable range. This range of λ-values, below which there would be reduced
  availability/activity, corresponds to an
  range in which the observed voltage deviates from that predicted by theory (Fig. 6). Figure 7 shows the relationship between
  and λ for a low EW membrane at 60°C, a correlation which is consistent with Kreuer's uptake for Nafion-117.23 It is reasonable to believe that below
  , where λ is below 3.5-4,
  availability/activity for the sulfonic acid group is reduced, thereby lowering either the bulk concentration of available protons in the membrane
  or its activity coefficient, both of which would result in a decrease of proton activity (see Eq. 8). In other words, when
  is high
  the proton activity is high and nearly independent of
  so that it does not affect the ORR kinetics, i.e.,
  . However, because there exists such a good correlation between the
  at which observed voltage deviates from predicted voltage and the
  at which
  is suspected to have a lower activity (i.e.,
  ) it is evident that
  , and consequently
  , are functions of water and/or proton activity as presented conceptually in Eq. 7.
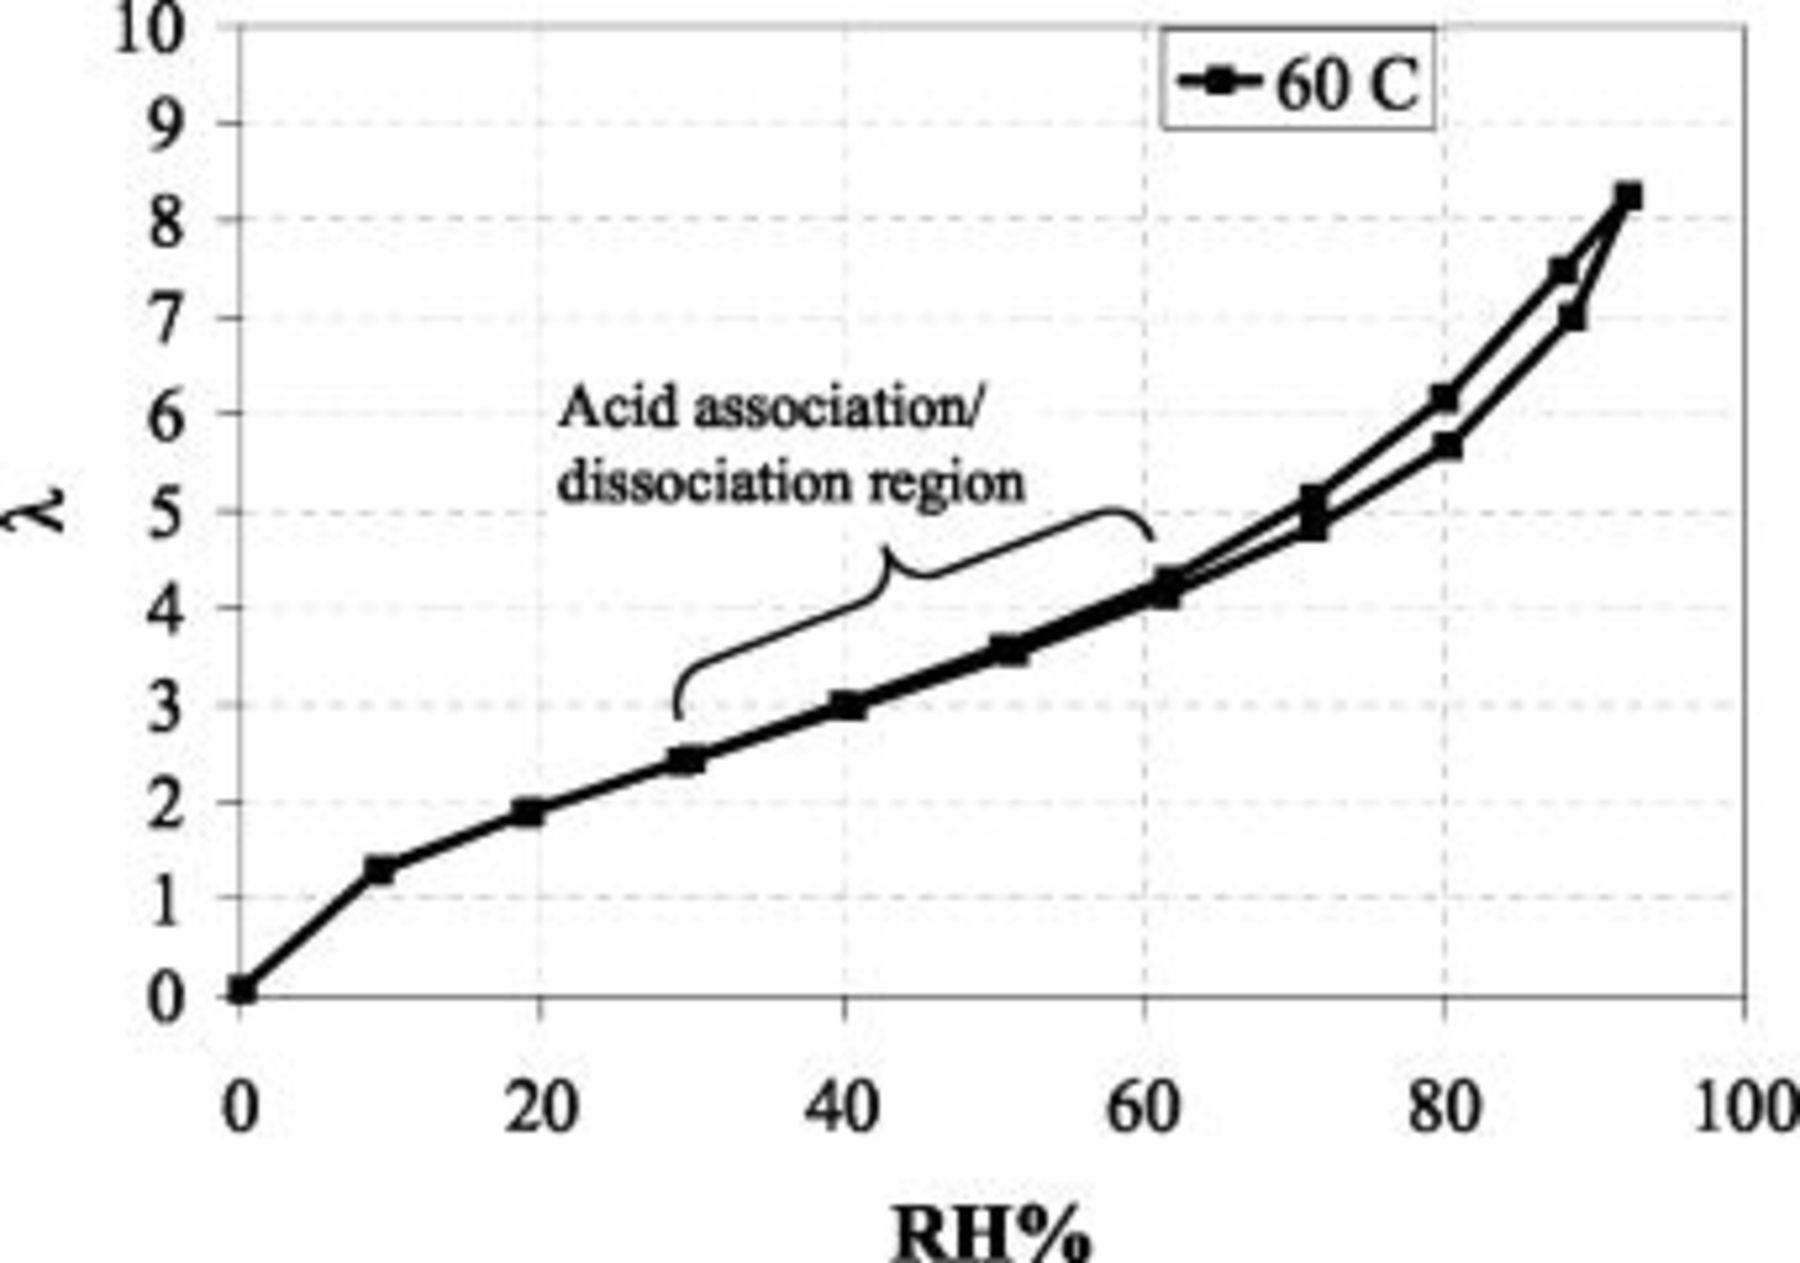
Figure 7. Hydration number/water uptake  vs.
vs.  for a low EW
 membrane at 60°C.
Conclusion
The intrinsic ORR kinetics in a PEMFC, with regards to water and proton activity, are independent of  values above
  , but significant losses in ORR kinetics are observed at lower
  values, amounting to ca. 20 mV at
  which is approximately equivalent to a lowering of the exchange current density by a factor of 2 (estimated from Eq. 14). The reduction of ORR kinetics at low
  is most likely due to a lowering of the proton activity and therefore only indirectly related to the lowering of the water activity, via hydration of acidic groups and the sequestering of protons at low
  .
.
List of Symbols

|
in situ specific Pt surface area in the electrode of an MEA, 
|

| proton activity |

| standard proton activity, assigned an arbitrary value of 1 |

| water activity |

| standard water activity, assigned an arbitrary value of 1 |

| activity of species 
|

| Tafel slope of the ORR, V/decade |

| concentration of species i, mol/cm3 |

| observed cell voltage, V |

|
 -free voltage at 100% RH, observed cell voltage plus corrections from protonic resistance in the cathode catalyst layer and high frequency resistance, V -free voltage at 100% RH, observed cell voltage plus corrections from protonic resistance in the cathode catalyst layer and high frequency resistance, V |

|
 -free voltage at -free voltage at  , observed cell voltage plus corrections from protonic resistance in the cathode catalyst layer and high frequency resistance, V , observed cell voltage plus corrections from protonic resistance in the cathode catalyst layer and high frequency resistance, V |

| reversible cell potential at constant  and 100% RH (function of and 100% RH (function of  and and  ), V ), V |

| thermodynamic change in cell potential (function of  , ,  , and , and  ), V ), V |

| maximum possible error associated with neglecting contributions from HOR and HER overpotentials and their associated protonic resistance in the electrode, V |

| Faraday constant, A s/equiv |

| current density, A/cm2 |

| exchange-current density based on geometric Pt surface area, A/cm2 |

| temperature dependent exchange-current density based on Pt surface area, A/cm2 |

| mass-specific current density, A/mg |

| current density associated with  crossover (crossing through the membrane), A/cm2 crossover (crossing through the membrane), A/cm2
|

| local ORR current density at the membrane/cathode catalyst layer interface, A/cm2 |

| local ORR current density at the cathode catalyst layer/DM interface, A/cm2 |

| hydrogen permeability through the membrane, 
|

| cathode Pt loading of the MEA, mgPt/cm2 |

|
 partial pressure, kPa partial pressure, kPa |

| reference  partial pressure (101.3 kPa), kPa partial pressure (101.3 kPa), kPa |

|
 partial pressure at temperature partial pressure at temperature  and and  , kPa , kPa |

|
 partial pressure, kPa partial pressure, kPa |

| reference  partial pressure (101.3 kPa), kPa partial pressure (101.3 kPa), kPa |

|
 partial pressure at temperature partial pressure at temperature  and and  , kPa , kPa |

| universal gas constant, J/(mol K) |

| protonic resistance in the anode or cathode catalyst layer, Ω cm2 |

| linearized charge transfer resistance to the hydrogen evolution reaction, Ω cm2 |

| linearized charge transfer resistance to the hydrogen oxidation reaction, Ω cm2 |

| high frequency resistance of the cell, comprised of membrane, contact and bulk electronic resistances, Ω cm2 |
Greek
| α | reaction order for the contribution of water activity to ORR kinetics |
| β | reaction order for the contribution of proton activity to ORR kinetics |

| catalyst layer thickness, cm |
| ε | ionomer volume fraction in cathode catalyst layer |

| potential drop in the cathode catalyst layer, V |
| γ | oxygen reduction reaction order with respect to  partial pressure at constant overpotential partial pressure at constant overpotential |

| activity coefficient for species  , cm3/mol , cm3/mol |

| overpotential of the HER ( evolution reaction), V evolution reaction), V |

| overpotential of the HOR ( oxidation reaction), V oxidation reaction), V |

| overpotential of the ORR at  , V , V |

| change in overpotential of the ORR at  with respect to with respect to  partial pressure, referenced to an partial pressure, referenced to an  partial pressure at partial pressure at  , V , V |
| change in overpotential of the ORR with respect to water and proton activity, referenced to water and proton activities at  , V , V |
| λ | hydration number/ water uptake of membrane, 
|

| protonic conductivity in the cathode catalyst layer, S/cm |
Acknowledgments
A sincere thanks to John Doyle for making the MEAs used in this experiment and to Steve Jefferson for the many hours of technical support.
The University of Rochester assisted in meeting the publication costs of this article.