
Abstract
A study was carried out to examine copper immersion deposition on AZ91 magnesium alloy in a hydrofluoric acid-containing bath. The role of fluoride and the effect of bath temperature were investigated. The study was performed by measuring the ac impedance and open-circuit potentials in combination with X-ray photoelectron spectroscopy and scanning electron microscopy surface analysis. Results showed that the effect of both HF concentration and temperature on copper immersion deposition is significant, via affecting the surface film formation on the magnesium surface. A model for understanding the copper immersion deposition process is depicted based on surface characterization and the electrochemical measurements.
Export citation and abstract BibTeX RIS
Magnesium alloys fulfill many technical requirements for engineering applications with a combination of high specific strength, good machinability and excellent castability, and high recycling potential. The automotive industry leads the way in the growing interest in magnesium alloys for further reduction of emissions to lower the growing environmental impact.1
However, poor wear and corrosion properties of magnesium alloys hinder their wide use. In fact, magnesium is intrinsically highly reactive and its alloys usually have poor corrosion resistance,2–4 particularly with the internal galvanic corrosion caused by second phases,5 poor stability of the quasi-passive hydroxide surface film,4 and film imperfections.6 Surface coatings are therefore needed for the effective application of magnesium alloys in industry.7
Generally, electroless deposition of magnesium is a good candidate with combined advantages such as excellent uniformity, high corrosion and wear resistances, and excellent scalability.7 A number of studies have reported on the plating techniques, including direct and indirect electroless plating.8–12 For direct electroless plating on magnesium alloy, dissolution of magnesium causes contamination, which leads to the decomposition of electroless plating solution, a major challenge for its industrial application. Special pretreatment sequences were therefore introduced in the indirect electroless plating, which includes a zinc immersion deposition process, followed by cyanide strike, prior to electroless plating.9 However, this indirect procedure has also been criticized for the requirement of precise control to ensure adequate adhesion. In many cases nonuniform coverage on the surface is seen with spongy, nonadherent zinc deposits on the intermetallic phase of the base alloys. A copper cyanide strike that must follow has also been of concern.13
In order to replace the zinc immersion deposition and to eliminate the cyanide step in the indirect electroless coating, our recent study focuses on a simple copper immersion deposition on AZ91 magnesium alloy in a hydrofluoric acid-containing bath.14 This process has an advantage with respect to reduced cost, simple operation, and excellent scalability. In addition, a preliminary study showed that the copper immersion-coated magnesium surface was feasible for subsequent electroless coating. It was reported that copper immersion deposition could be applied on aluminum alloys by using a slightly acidic bath containing the copper partly or completely in complex bonding to oxalic group15, 16 and to tartrate.17, 18 However, this approach has not been reported on magnesium alloy, to the best of our knowledge. Our previous paper14 shows that the presence of fluoride in the immersion bath is essential, as it plays a dominating role in controling the copper immersion deposition process.
This paper explores the mechanism of copper immersion deposition processes with regard to the role of fluoride and the effect of bath temperature. The study was performed by measuring the ac impedance and open-circuit potential (OCP) in combination with X-ray photoelectron (XPS) and scanning electron microscopy (SEM) surface analysis.
Experimental
The pretreatment procedure for magnesium alloy substrates
The magnesium alloy substrates used throughout the experiments were AZ91 magnesium alloy (including AZ91D and AZ91E). Their nominal compositions are shown in Table I. The substrate was cut into  pieces. The pretreatment of the substrate was subsequently carried out using the following precedure
Table I. The nominal chemical compositions of the AZ91D and AZ91E magnesium alloy used in the experiments.
| %Al | %Zn | %Mn | %Ni | %Cu | %Si | %Fe | %Be | Other total | |
|---|---|---|---|---|---|---|---|---|---|
| AZ91D | 8.5-9.5 | 0.45-0.90 | 0.17-0.40 | 0.001 | 0.015 | 0.05 | 0.004 | 0.0005-0.003 | NS |
| AZ91E | 8.3-9.2 | 0.45-0.90 | 0.15-0.50 | 0.001 | 0.015 | 0.2 | 0.005 | 0.03 |
aAZ91D was supplied by Norsk Hydro Canada. bAZ91E was supplied by Haley Industries Limited, Canada.
In this pretreatment precedure the substrate of magnesium alloy was glass-beaded for 10 s at a pressure of 450 kPa. The stream of glass beads bombarded the substrate in the normal direction to the surface from a distance of about 10 cm. The substrate was then cleaned in isopropanol for 6 min with sonication. Finally, alkaline degreasing was performed in a solution containing  at 75°C for 6 min, followed by thoroughly rinsing in deionized water.
After the pretreatment of the substrate, two parallel processes, including copper immersion deposition and HF etching was followed (see below).
Copper immersion deposition
Following the pretreatment, the copper immersion deposition was immediately performed by transferring the pretreated substrate into a bath containing  in various concentrations, unless specified otherwise. The immersion-coated samples were then examined by SEM using the mode of backscattered electron (BSE). The resultant BSE images were processed with Image–pro Plus software (Media Cyberhetics, Inc.) to obtain the surface coverage of the copper deposition.
HF etching process
After pretreatment, the HF etching process was performed by immersing the pretreated substrate into a solution that only contains hydrofluoric acid in various concentrations. It is believed that during the HF etching process, a surface film containing fluoride is formed. The characterization of such film is expected to benefit the understanding of copper immersion deposition.
Open-circuit potential and electrochemical impedance spectroscopy
OCP measurements were performed during both the copper immersion deposition and the HF etching process, while electrochemical impedance spectroscopy (EIS) was only carried out during the HF etching process. For both OCP and EIS measurements, the substrate surfaces were sealed using epoxy resin, except for a  effective working area exposed to solutions. The working areas were polished using 320 grit wet emery paper followed by the pretreatment procedure as specified previously. After thoroughly rinsing in deionized water the specimens were immediately transferred into solutions for the OCP or EIS measurements.
OCPs were recorded vs. time in a cell with two electrodes, a working electrode and a reference electrode. For EIS a cell fitted with three electrodes, working electrode, counter electrode (Pt gauze with large surface area of ca.  ), and reference electrode, was employed. The reference electrode used was
  (3 M), 0.21 V vs. a reference hydrogen electrode (RHE) at 25°C, connected to the electrolyte through a salt solution bridge of 3 M KCl. The distance between the reference electrode and the working electrode was maintained at
  . In this paper, all potential values reported are referenced against the
  (3 M), unless specified otherwise.
The EIS measurements were performed in a frequency range from 100 kHz to 1 Hz, with a bias potential of 0.0 V (vs. OCP) and a 5 mV ac perturbation. An EG&G 273A potentiostat was used, coupled with a M5210 lock-in amplifier.
X-ray photoelectron spectroscopy
XPS analyses were carried out using a Kratoes Axis Ultra instrument. Monochromatic Al  X-rays were used and the pressure in the spectrometer was
  . Binding energy was referenced to the C 1s peak at 285 eV and the spectrometer was calibrated with Cu
  at 932.62 eV and Au
  at 83.96 eV. Spectral deconvolutions were performed after a Shirley background subtraction.
Chemicals
All the chemicals [analytical reagent (AR) grade], including NaOH,  ,
,  , HF, and
  , were supplied by Sigma. In this study, deionized water
  prepared with a Millipore Elix 10 water deionization system was used for solution preparations.
Results
Open-circuit potential
The change in potential with time was monitored to study the electrochemical behavior of magnesium alloy during the HF etching process and the copper immersion deposition, respectively.
HF etching process
Figure 1 illustrates the results obtained during the HF etching process in solutions only containing HF in various concentrations between 2.2 and 5.5 M. Generally, after immersing the sample into solution, the measured OCP gradually shifts to a more noble value (the plateau potential), attributed to the buildup of a surface film on magnesium alloy.19 While the time for the potential to reach the plateau value is little affected by the HF concentration, the plateau potential is increased with the increase of HF concentration. In the higher hydrofluoric-containing bath (e.g., 5.5 M HF) the plateau potential was  . In 2.2 M HF, however, it only attained approximately
  . Shown in Fig. 2 is the effect of temperature on OCP for 3.3 M hydrofluoric acid. It is observed that the plateau potential during the HF etching process increases with increasing bath temperature.
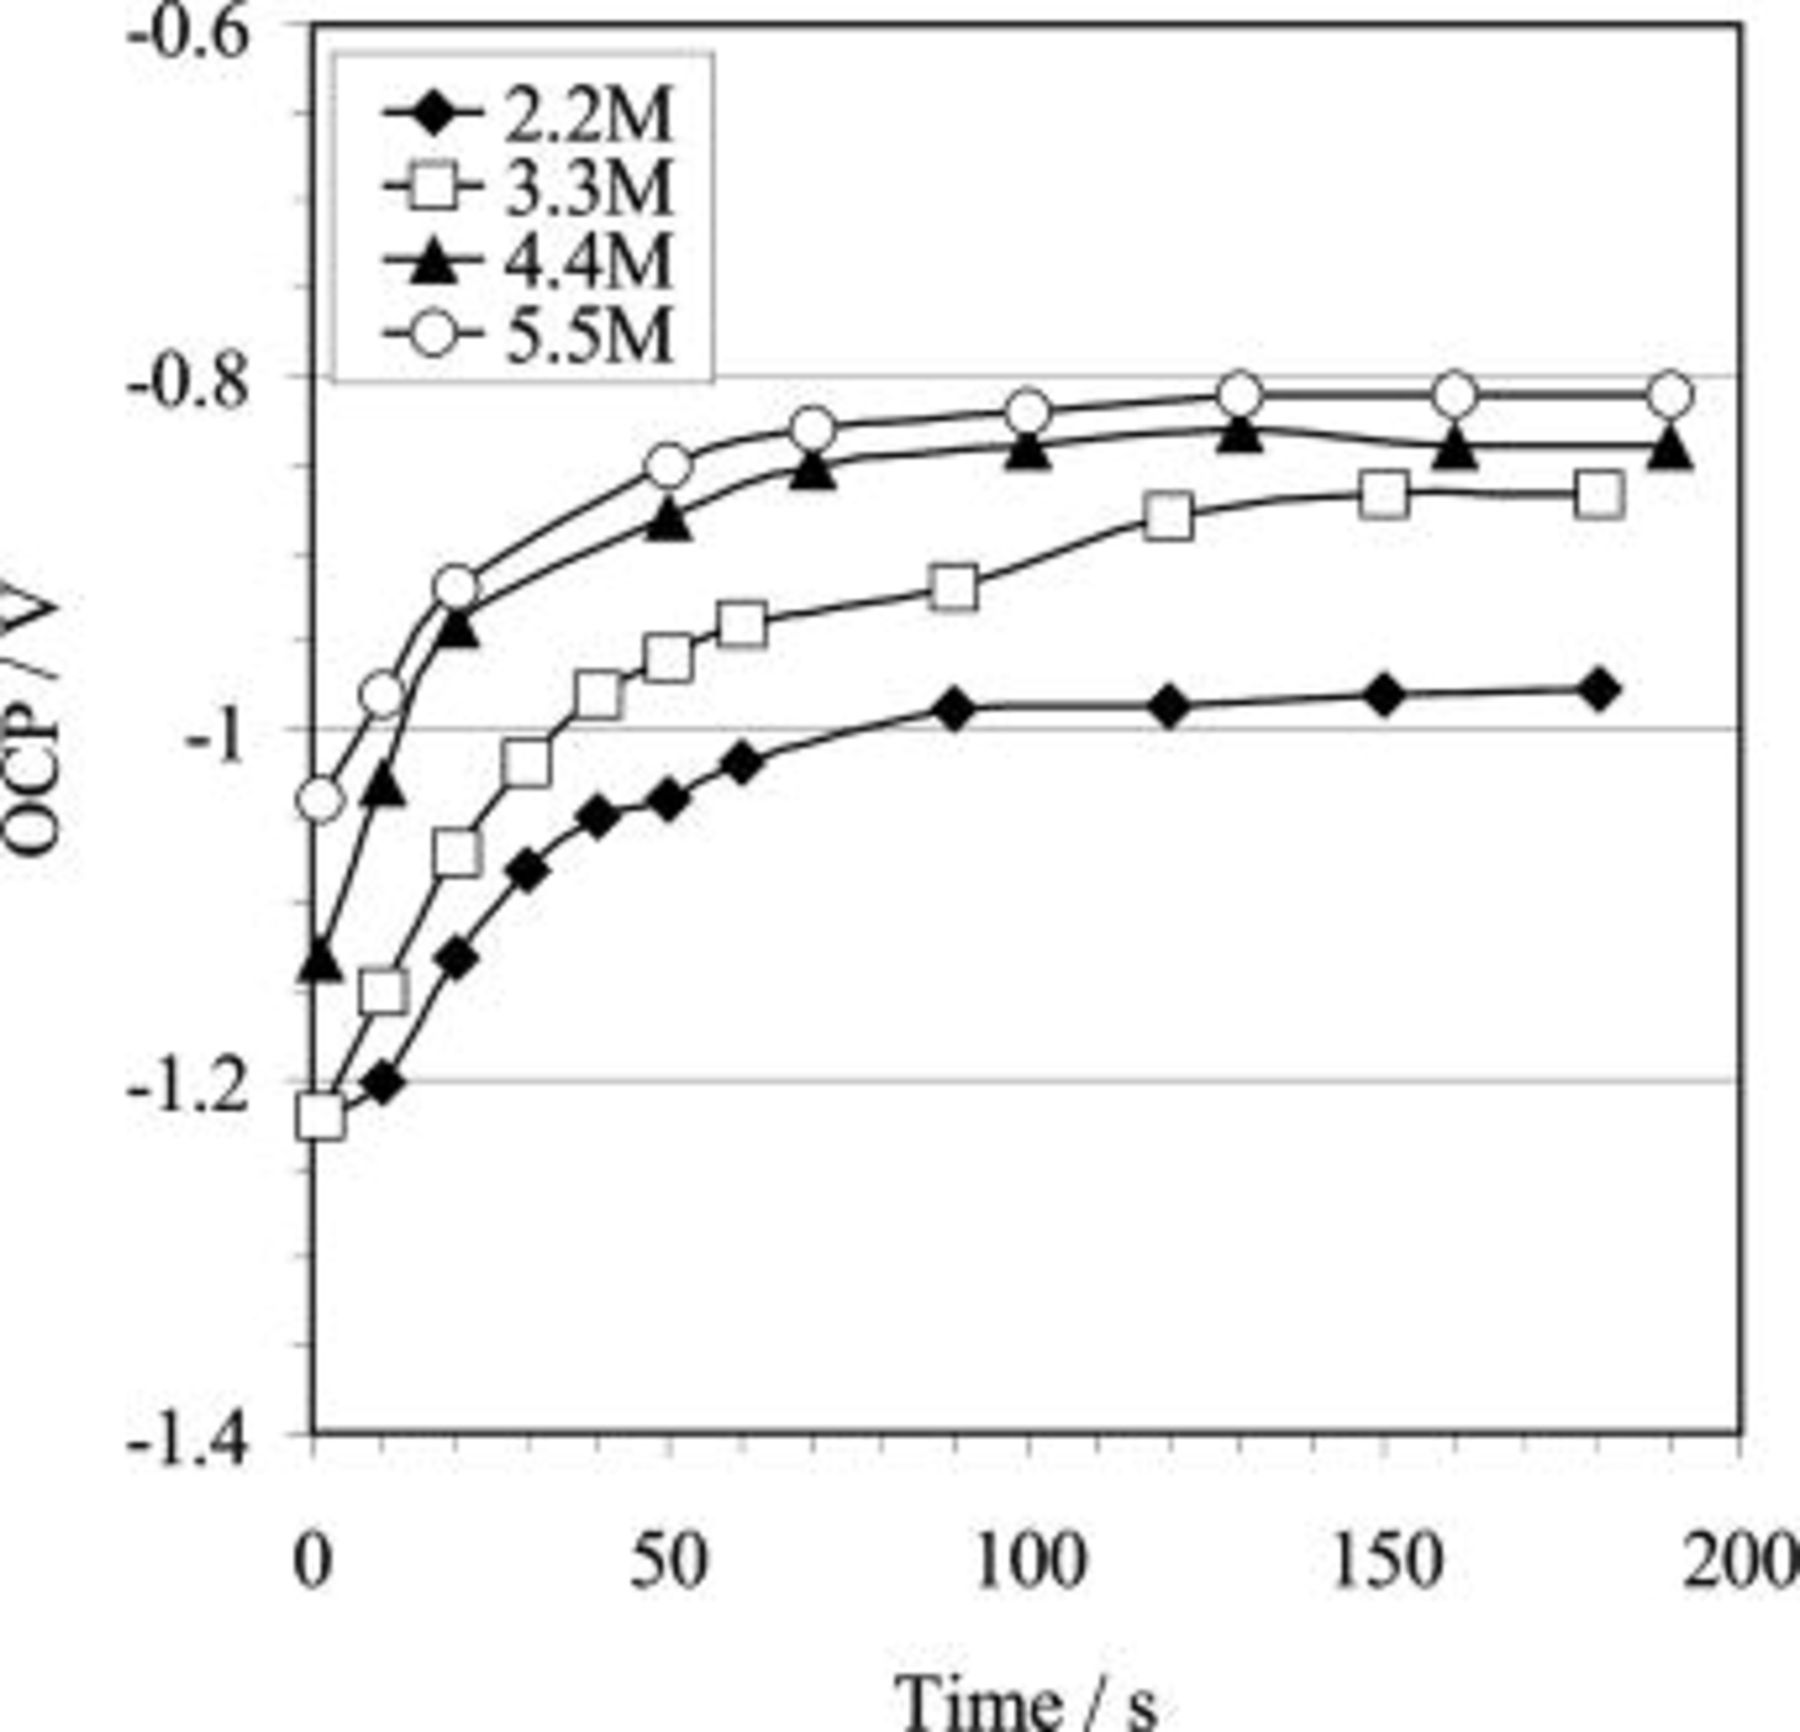
Figure 1. OCP / time curves recorded for AZ91 magnesium alloy during the HF etching process in solutions containing HF in various concentrations (25°C) showing the effect of HF concentration on OCP.
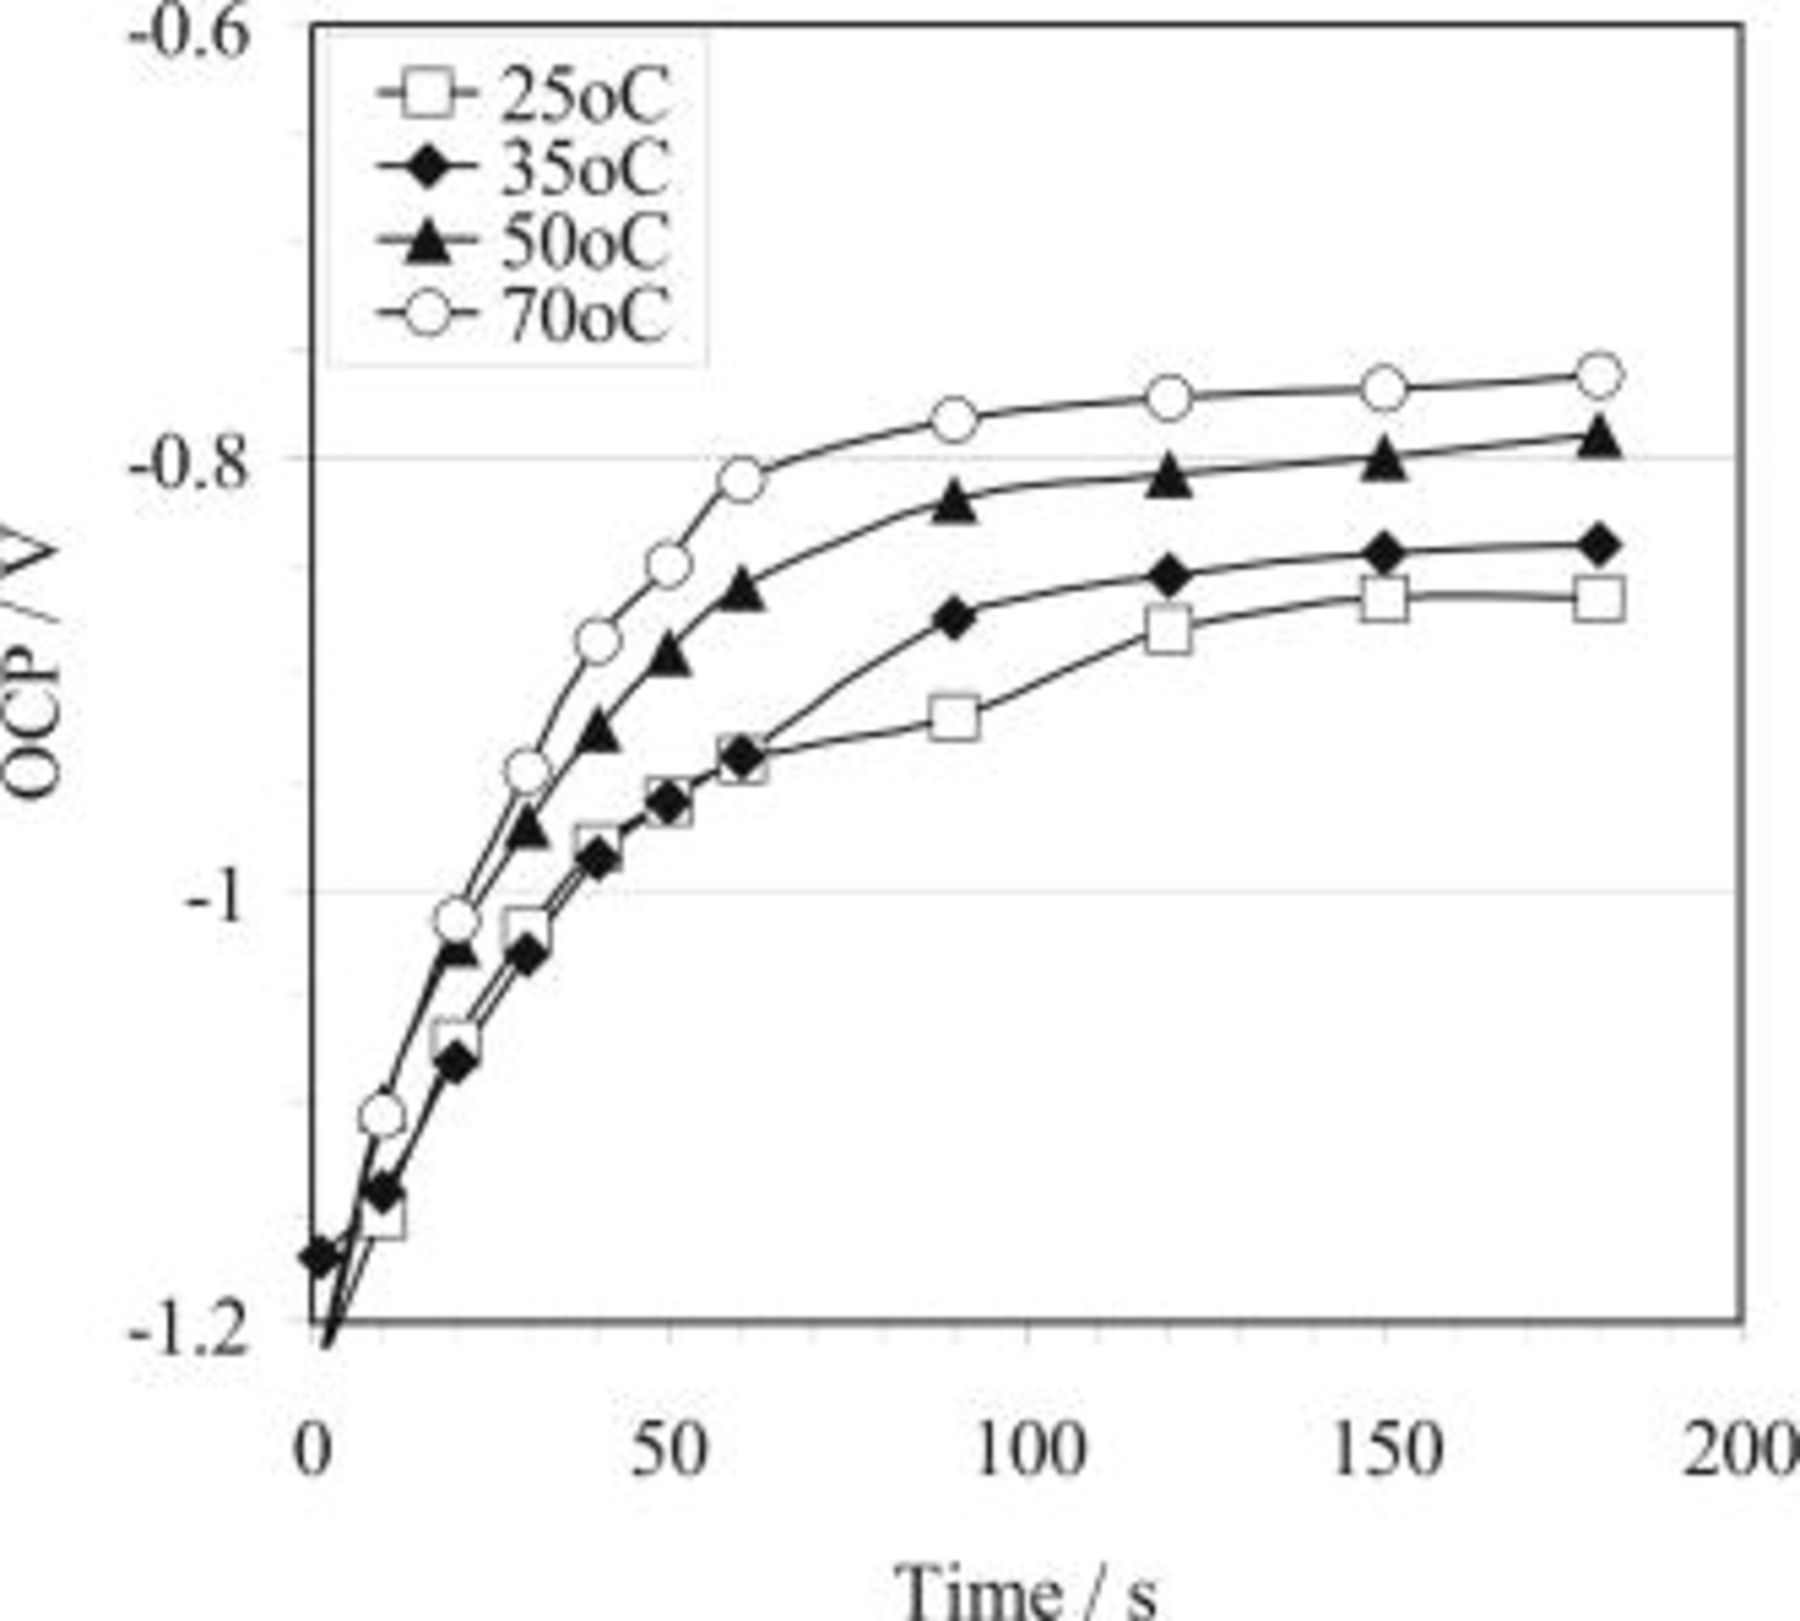
Figure 2. OCP/time curves recorded for AZ91 magnesium alloy during the HF etching process in a solution containing 3.3 M HF showing the effect of temperature on OCP.
Copper immersion deposition
OCP–time curves were also collected during copper immersion deposition in solutions containing  in various concentrations, as shown in Fig. 3, 4 and 5. Similar to the HF etching process, the OCP during copper immersion deposition shifts to a more noble value with increasing deposition time at the initial stage and subsequently plateaus. However, the time for the potential to reach the plateau value during copper immersion deposition (e.g., Fig. 3) is much shorter than that recorded during the HF etching process (Fig. 1). More significantly, the plateau potentials for copper immersion deposition jumped to approximately 0.1 V vs.
  or
or  vs. RHE, close to a potential of
  redox reaction (
 vs. RHE),20 indi cating the presence of surface coatings.9, 21
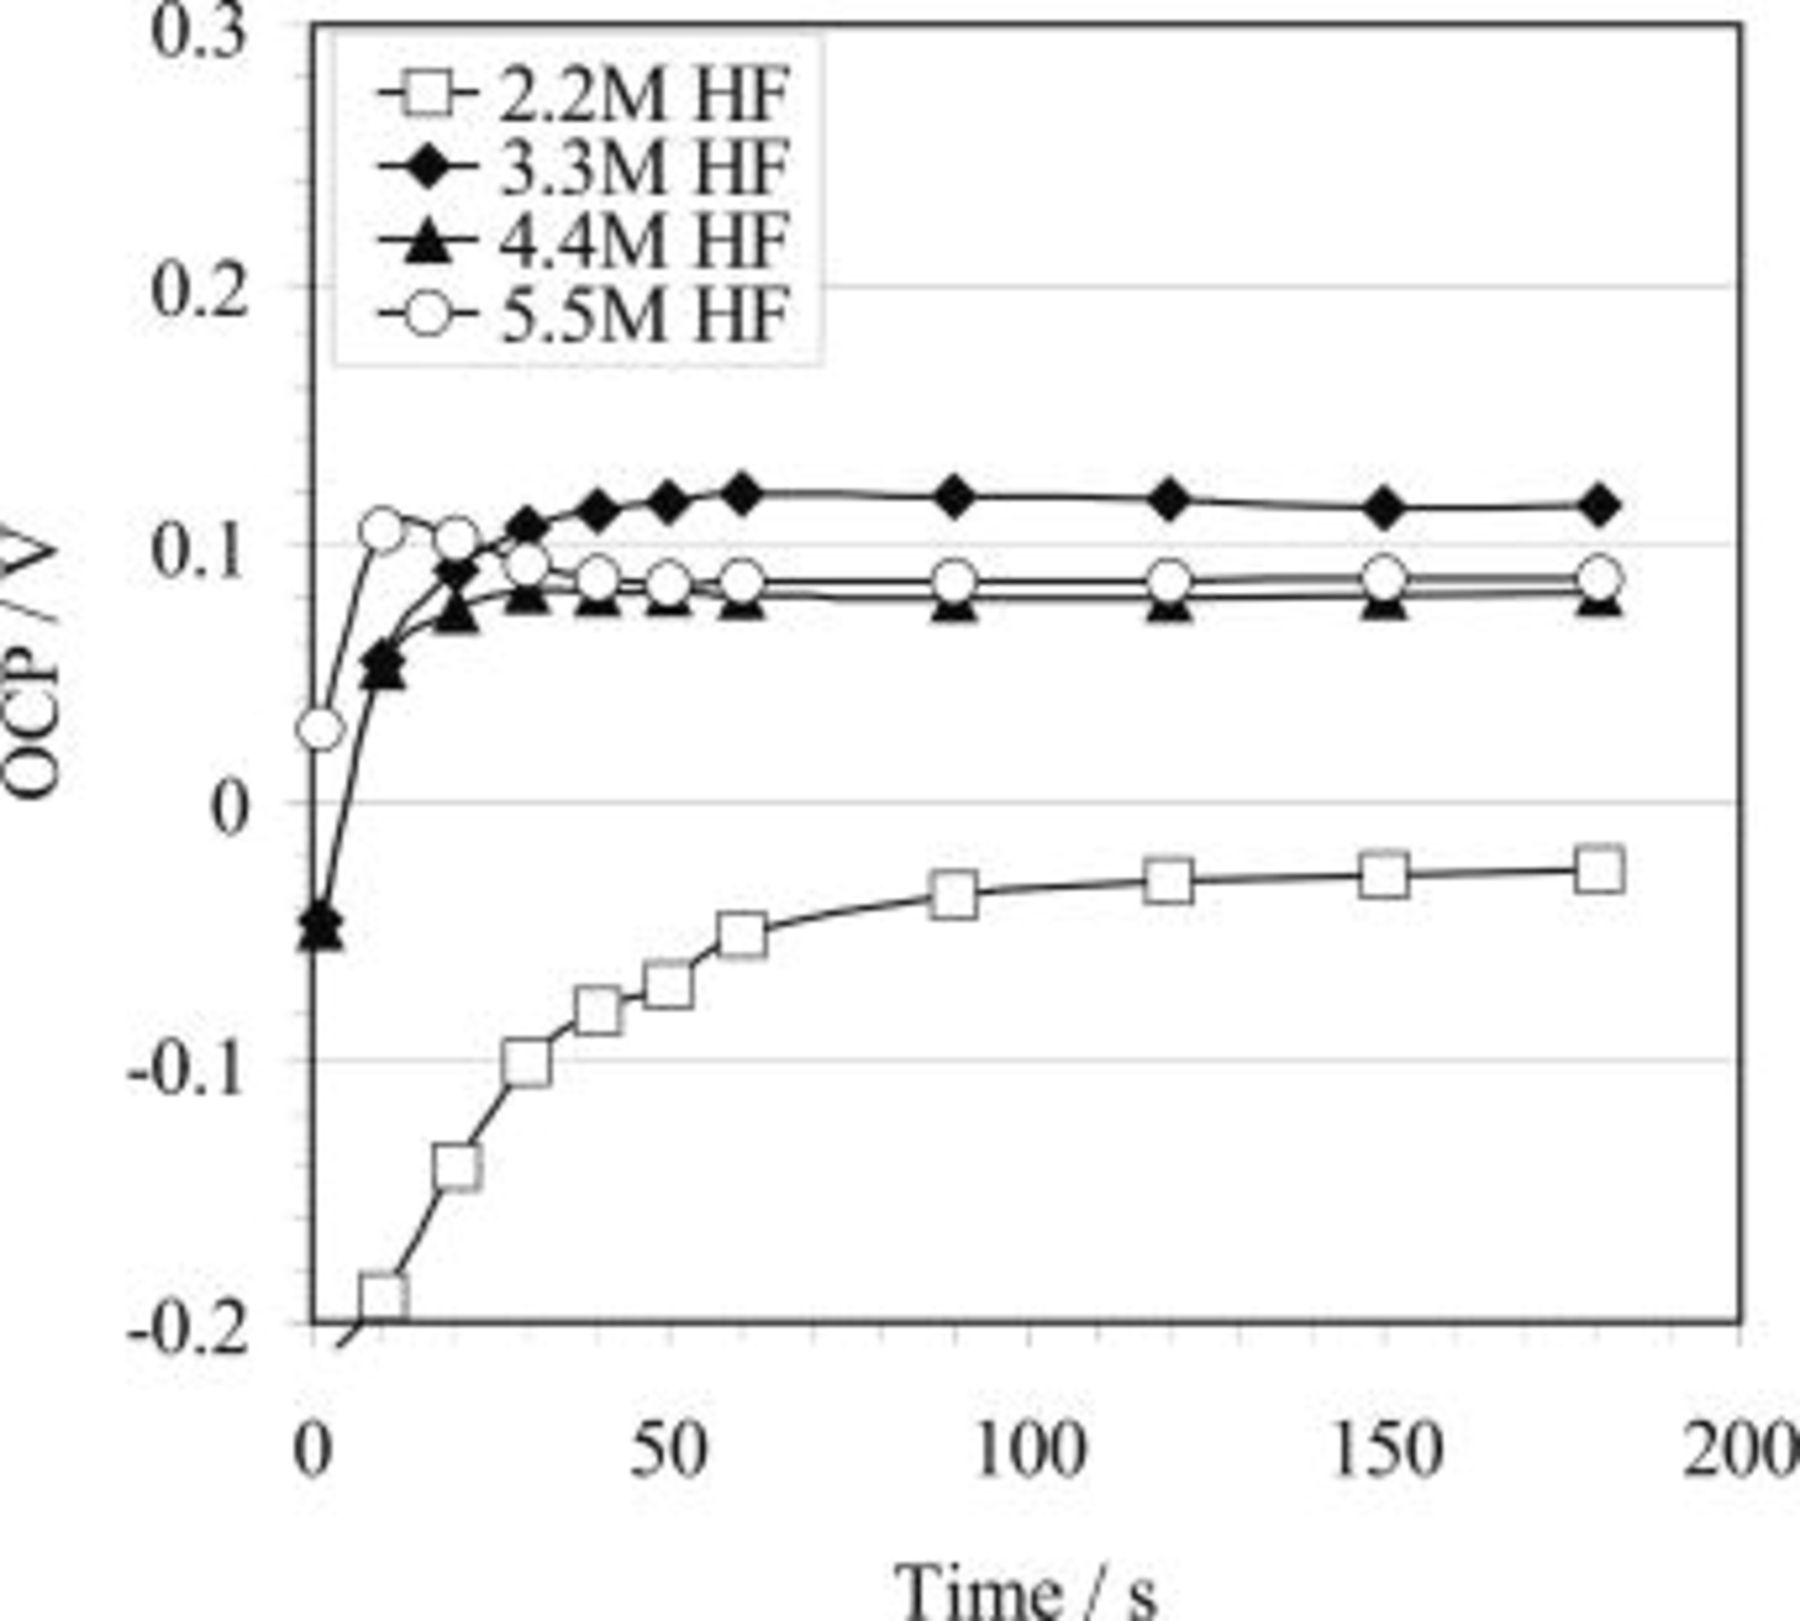
Figure 3. OCP/time curves recorded for AZ91 magnesium alloy during copper immersion deposition in solutions containing  in various concentrations (25°C) showing the effect of HF concentration on OCP.
The effect of HF concentration is significant in terms of both the plateau potential and the time for the potential to reach the plateau value, as observed by comparing the plot for 2.2 HF concentration bath with the curves for the other concentrations (Fig. 3). In addition, the plateau potential attained during copper immersion deposition is also related to the copper ion concentration in the bath, as shown in Fig. 5. It seems that the OCP is not significantly affected by temperature (Fig. 4).
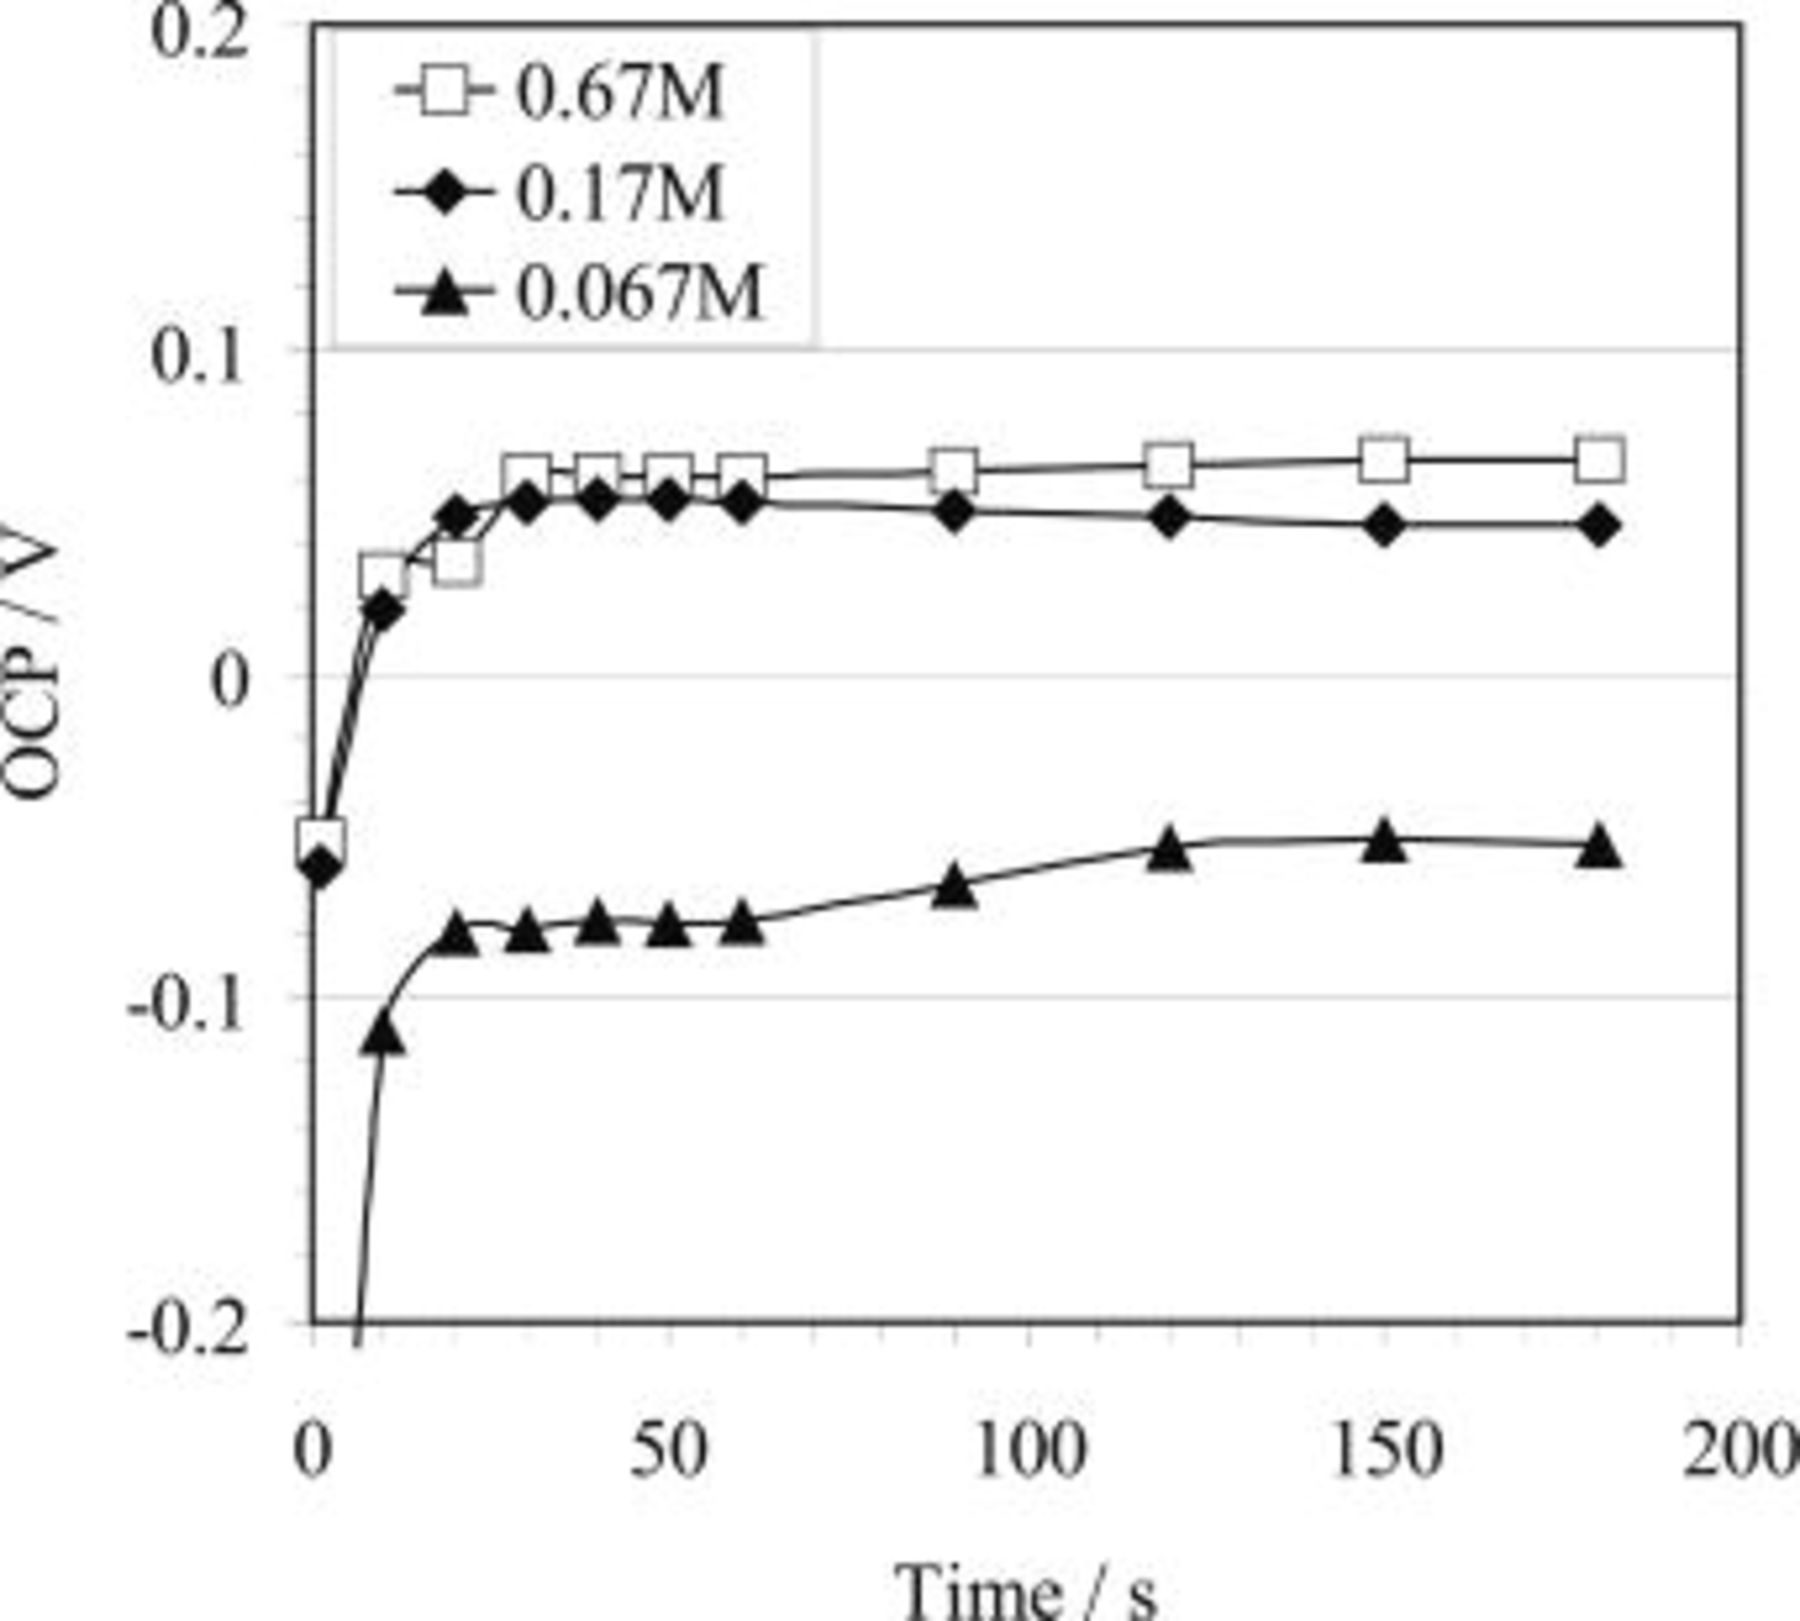
Figure 5. OCP/time curves recorded for AZ91 magnesium alloy during the copper deposition process in solutions containing  in various concentrations (25°C) showing the effect of copper ions concentration on OCP.
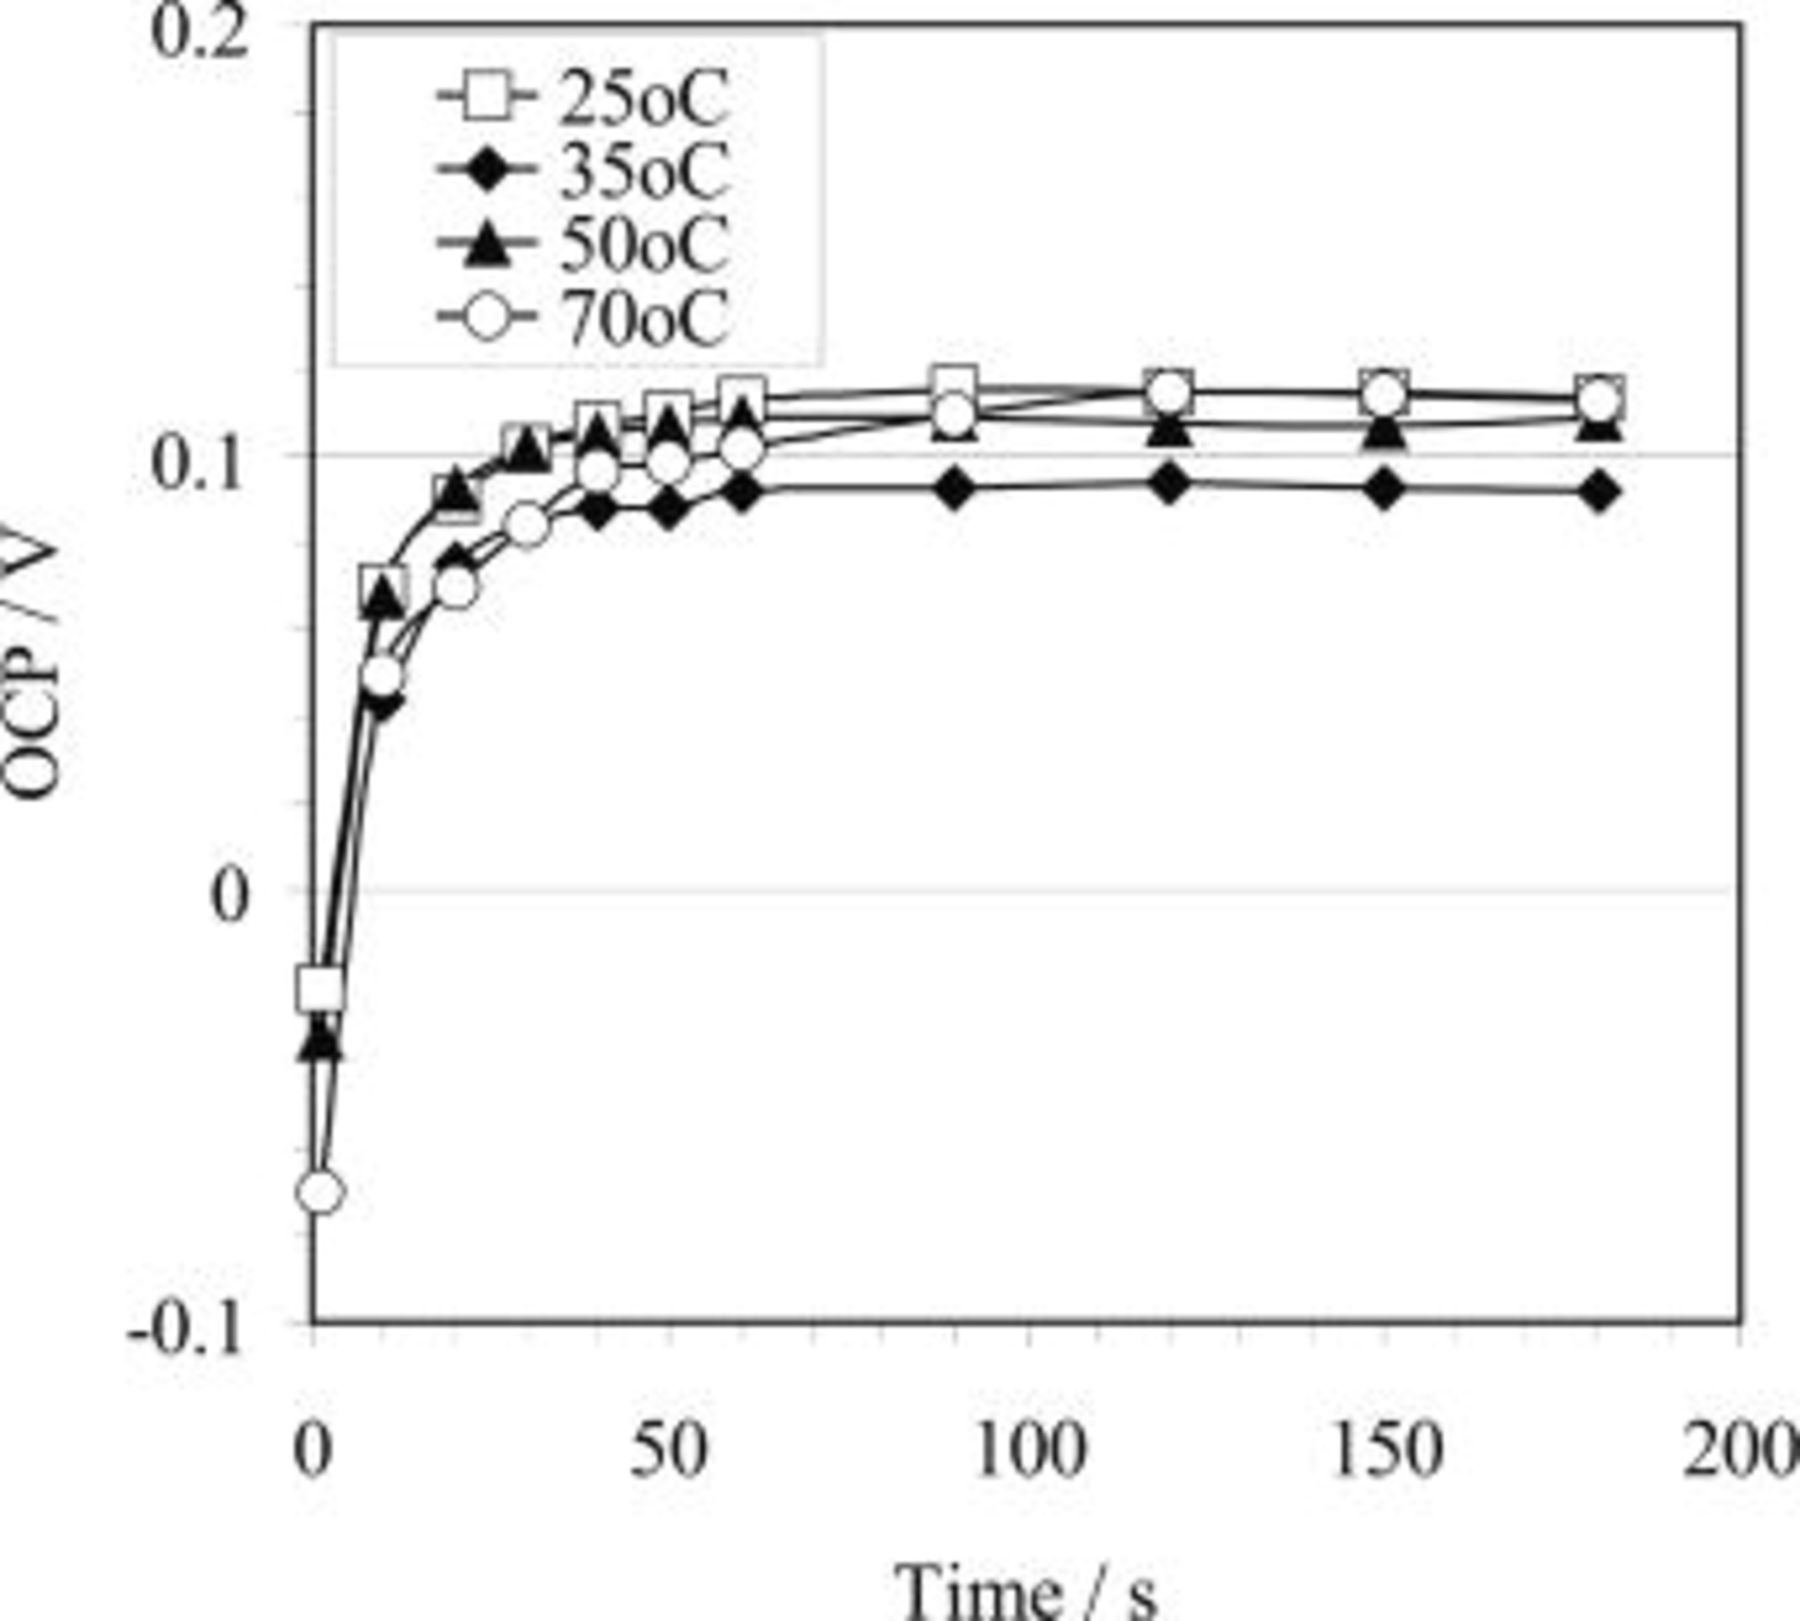
Figure 4. OCP/time curves recorded for AZ91 magnesium alloy during copper immersion deposition in a solution containing  showing the effect of temperature on OCP.
Overall, for both HF etching process and copper immersion deposition, the OCP results show significant changes in the plateau potential under various conditions. These changes reflect information originating from the surface film formation and deposition process. However, a realistic interpretation of such information requires input from other experiments (e.g., EIS, XPS, SEM, etc.).
Electrochemical impedance spectroscopy
EIS measurements were conducted to obtain more information during the HF etching process. Shown in Fig. 6 are the impedance spectra in a solution containing 3.3 M HF at various temperatures between 25 and 70°C. The spectra are characterized by a capacitive loop in the frequency range studied. A simple, one time constant equivalent circuit (insert, Fig. 6) may be applied to represent the capacitive loop, i.e., a solution resistance,  , in series with a parallel RC circuit with a resistance,
  , and a capacitance,
  . The capacitive spectra were fitted using a simple Powersine EIS software (EG&G Instruments, Inc.). The fitting process only gives the values of resistance
  with the fitted circle. The capacitance values
  were therefore obtained by
  , where
  is the angular frequency at the maximum point of the Nyquist plot. The values of
  and
and  are plotted against HF concentration or bath temperature, as shown in Fig. 7 and 8.
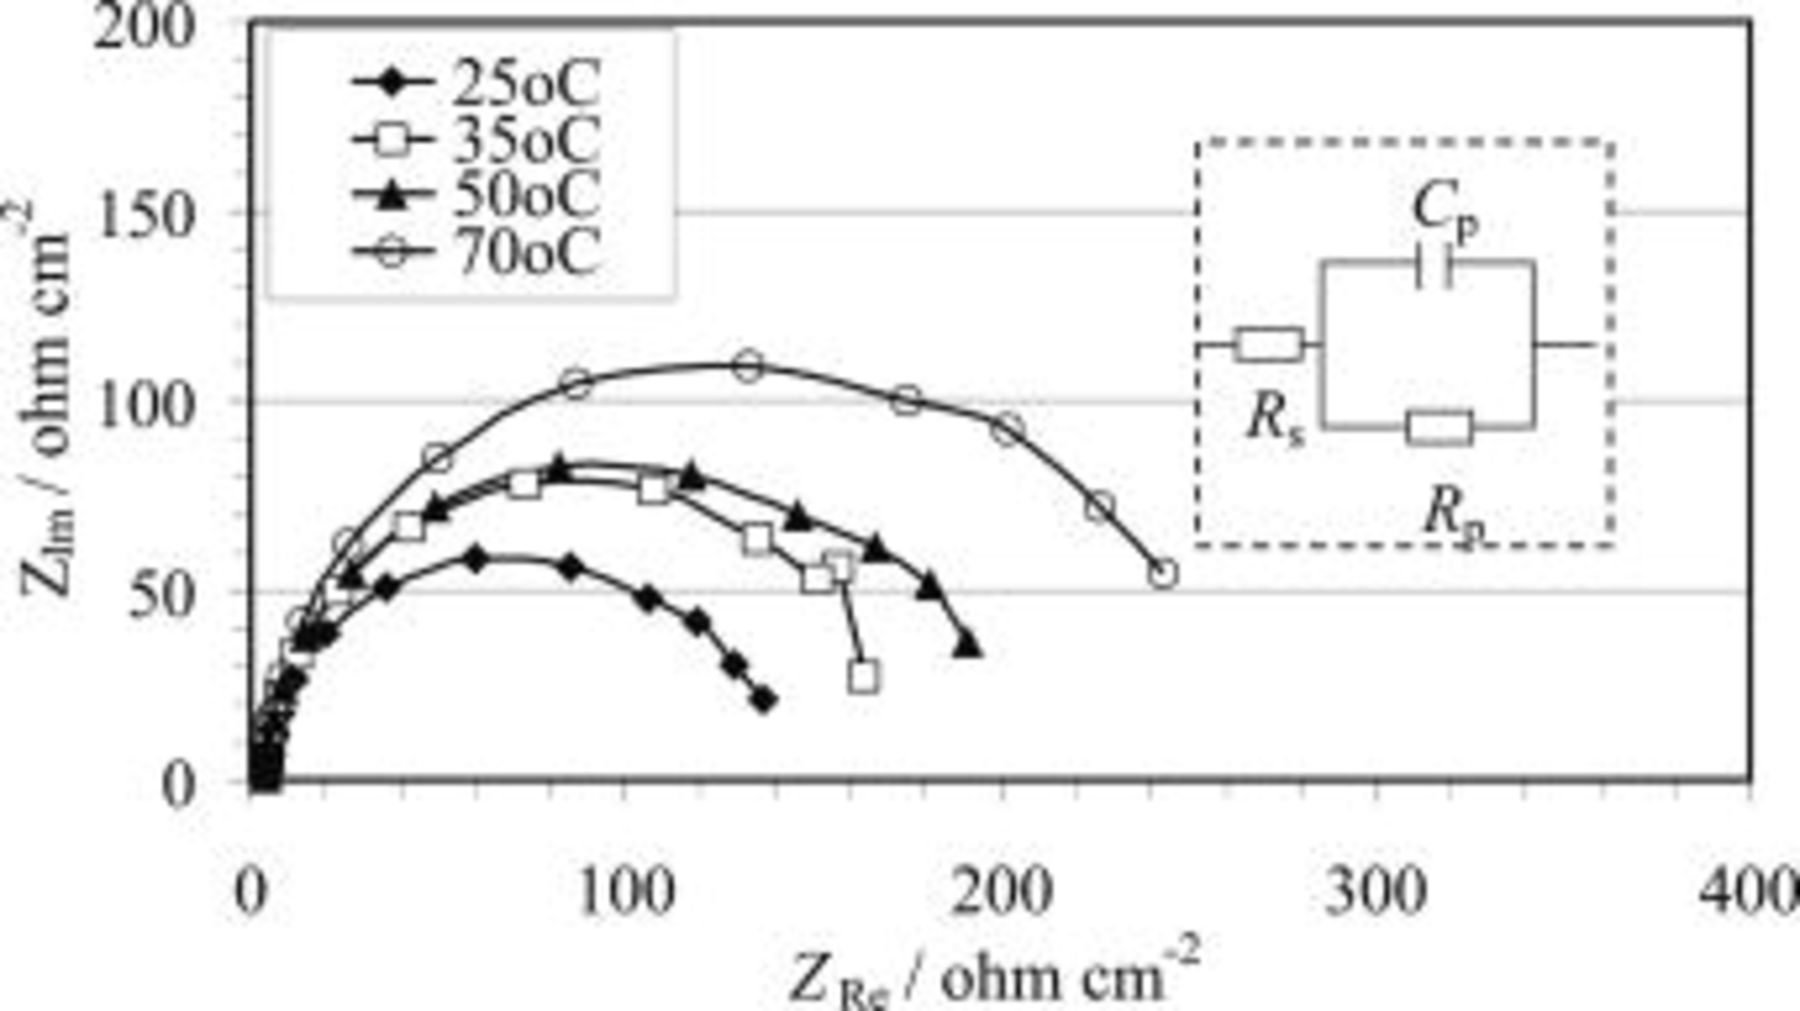
Figure 6. Typical Nyquist plots recorded for AZ91 magnesium alloy during the HF etching process in a solution containing 3.3 M HF at various temperatures. During the experiments the EIS measurement was not started until 90 s after the sample was immersed in the solution. A proposed equivalent circuit was depicted as the insert in this figure.
Capacitances  obtained in this study, range between 8 and
  (Fig. 7 and 8). The values are below that anticipated for a double-layer capacitance (around
  ).22 Generally, such capacitance values were attributed to both a charge transfer and a film effect.22, 23 In this study, the impedance measurements were performed after the magnesium samples were immersed in the solution for 90 s. The period for the impedance measurement coincided with the plateau stage on the OCP plots (Fig. 1 and 2). During this period, the surface film had already built up. The capacitance obtained was therefore mostly attributed to the film effect and the associated
  essentially represents the film resistance. As such, the data show that with increase of both temperature (Fig. 7) and HF concentration (Fig. 8), the film resistance,
  , is increased.
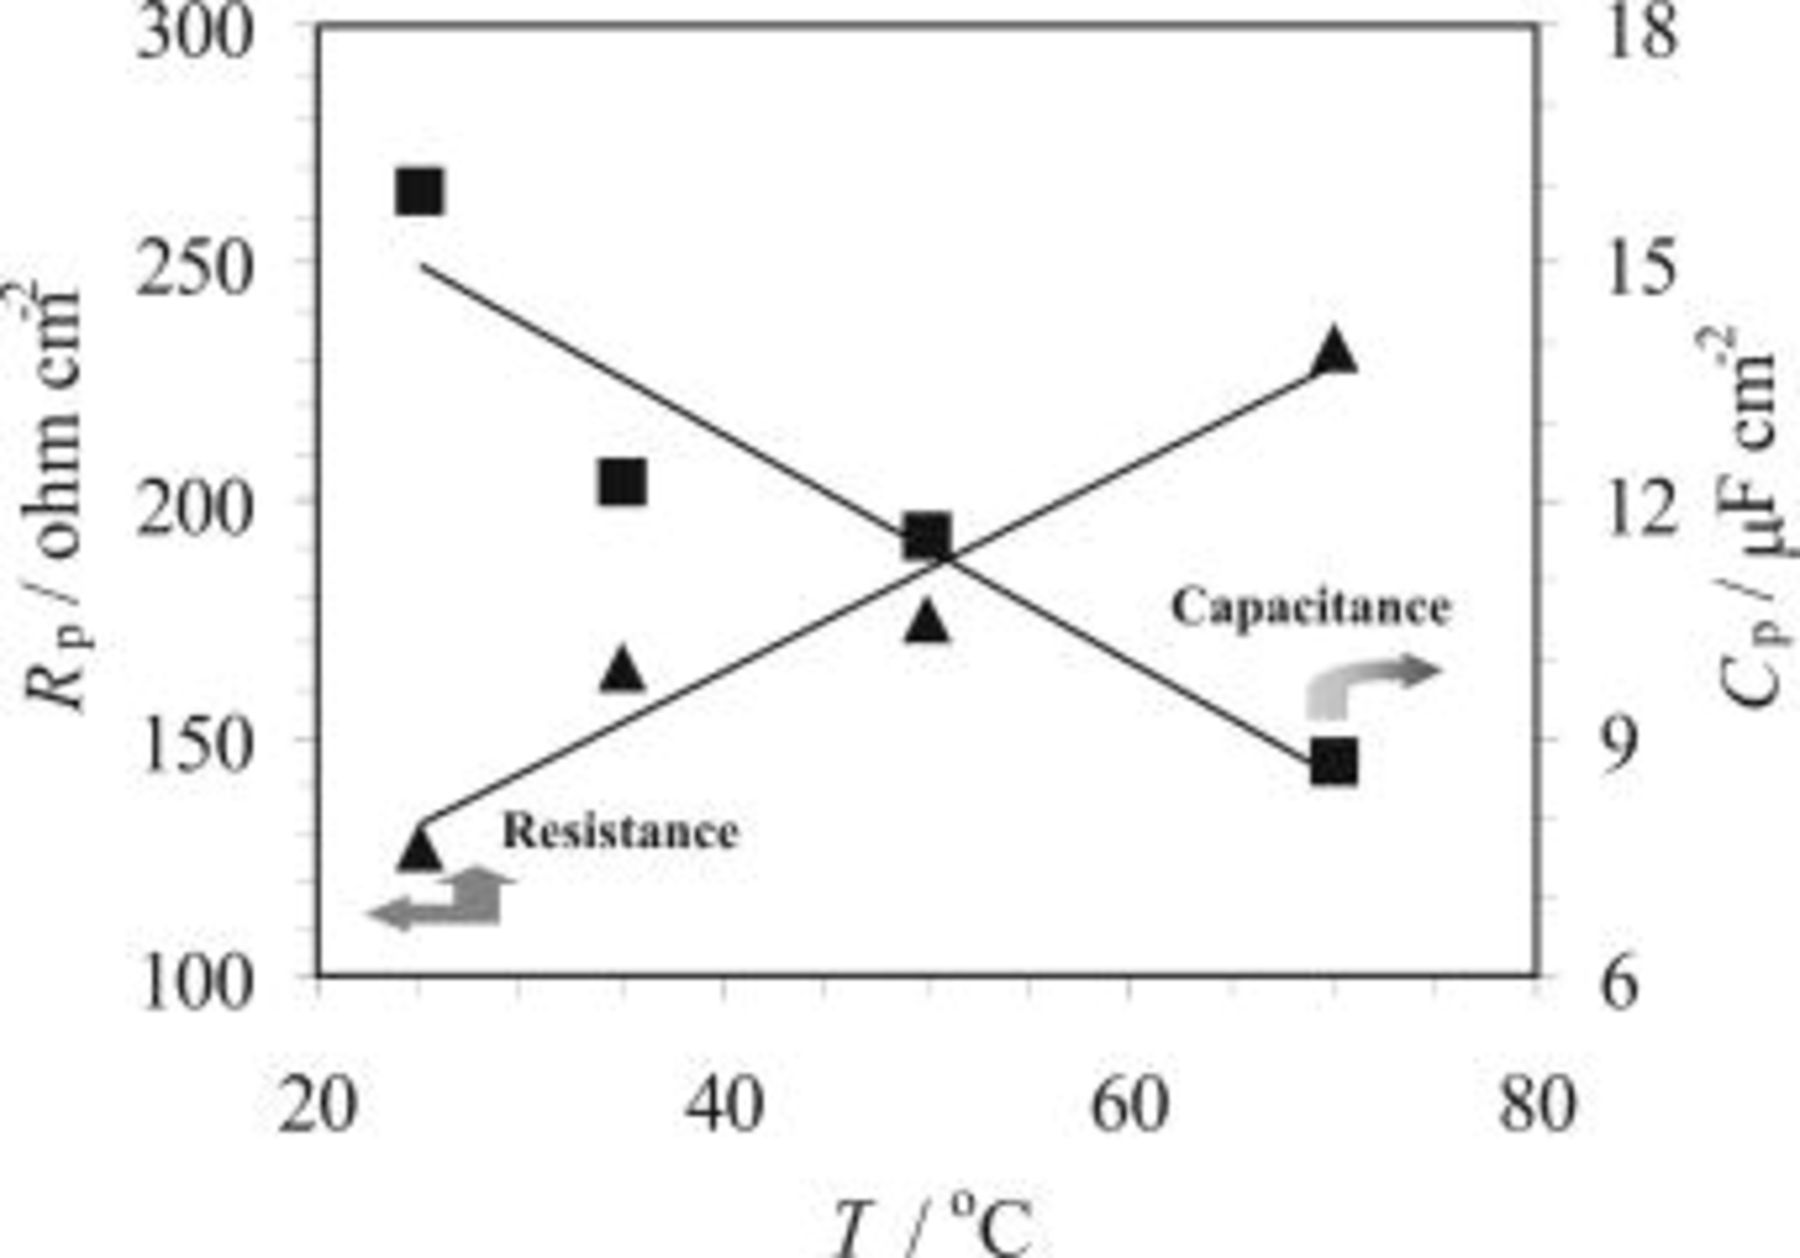
Figure 7. Effect of temperature on resistance,  , and capacitance,
  , obtained for AZ91 magnesium alloy during the HF etching process in a solution containing 3.3 M HF at various temperatures. During the experiments the EIS measurement was not started until 90 s after the sample was immersed in the solution.
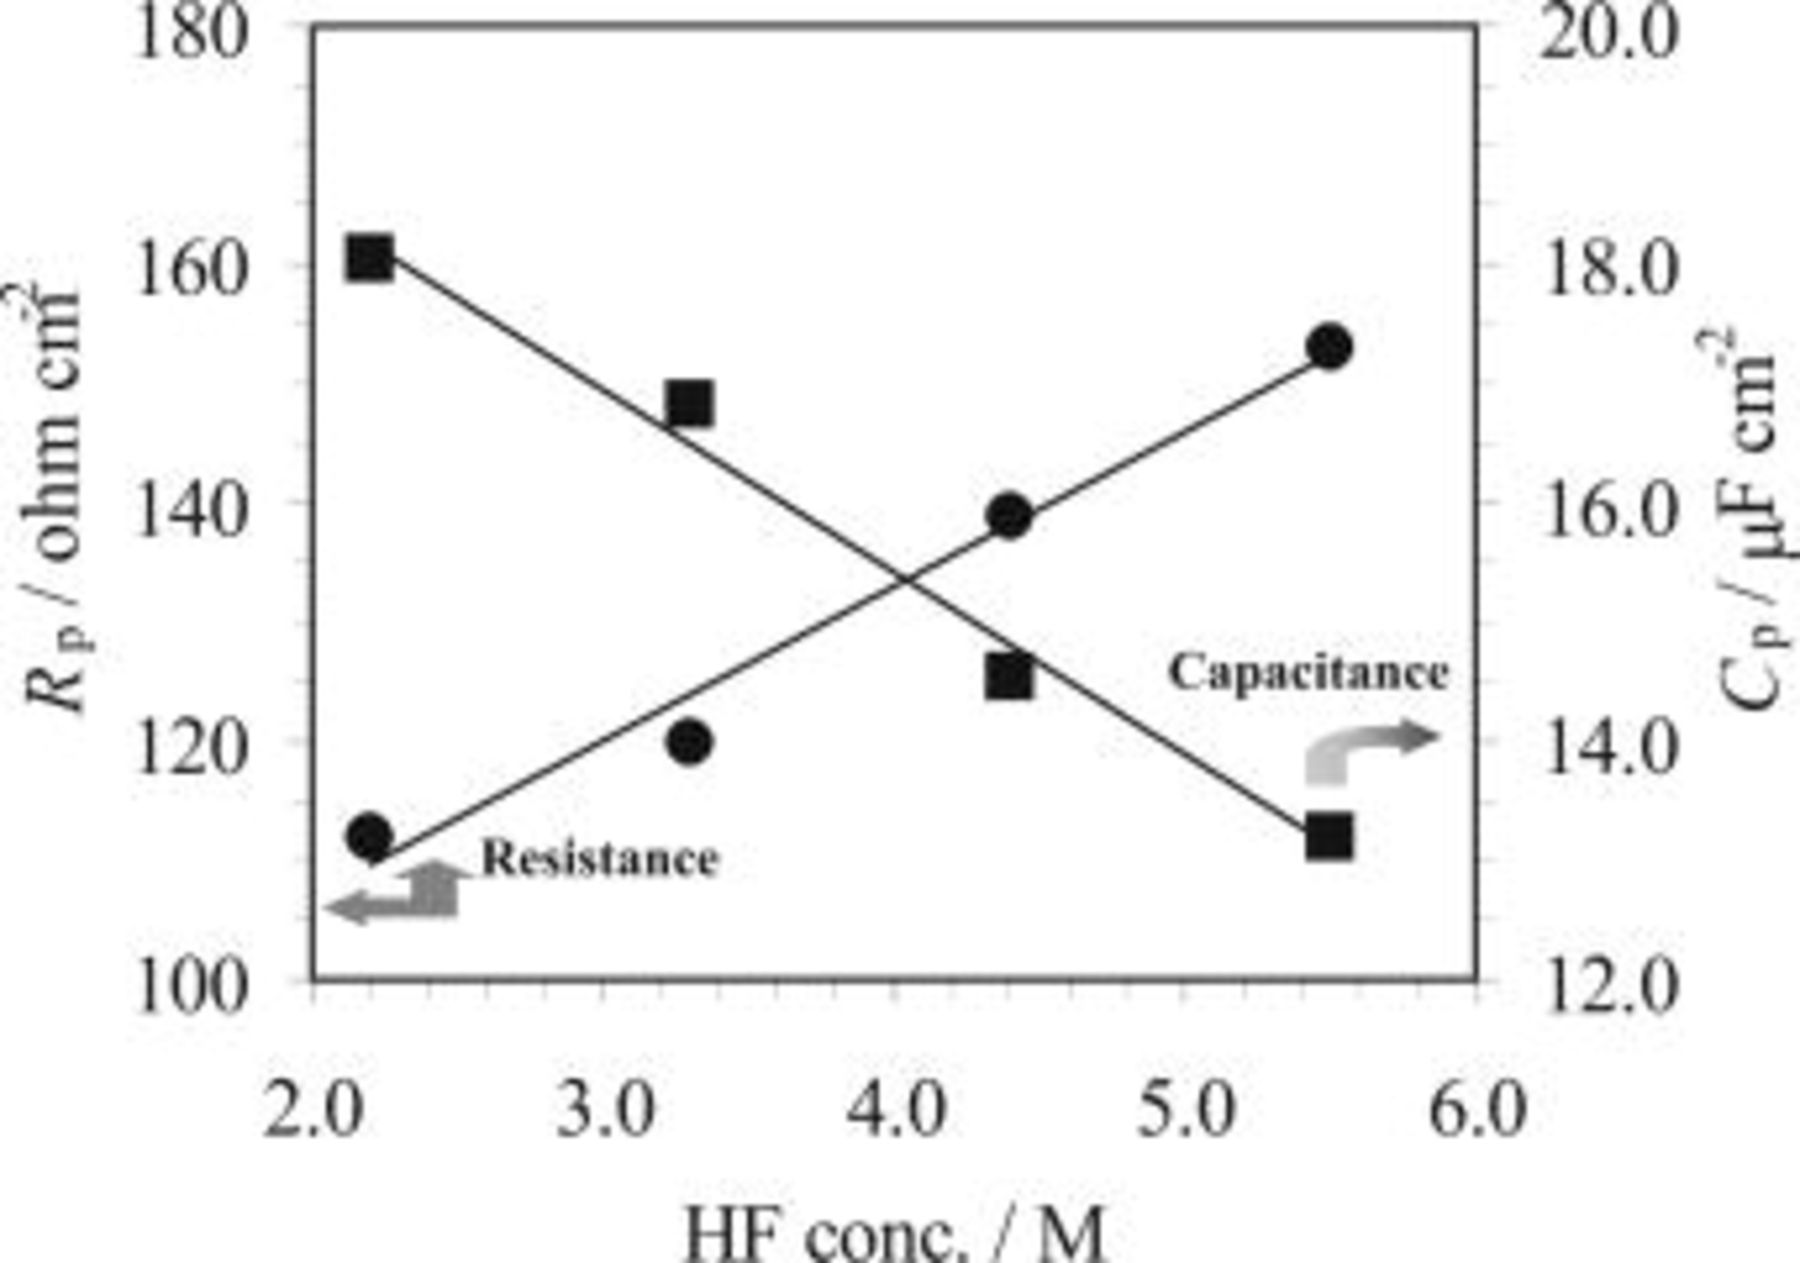
Figure 8. Effect of HF concentration on the film resistance,  , and capacitance,
  , obtained for AZ91 magnesium alloy during the HF etching process in solutions containing various HF concentrations (25°C). During the experiments the EIS measurement was not started until 90 s after the sample was immersed in the solution.
The EIS analysis indicates a possible film formation on the magnesium alloy surface during the HF etching process, consistent with OCP results.
X-ray photoelectron spectroscopy
General survey spectra from XPS measurements of the magnesium surface treated before and after the HF etching process are shown in Fig. 9. It detected magnesium, aluminum, fluorine, and oxygen as the main composition of the surface film. The presence of sodium, chlorine, sulfur, and silicon is attributed to a glass beading process or to possible surface contamination. From the general survey spectra, it is obvious that before HF etching, the magnesium surface consists of magnesium and aluminum oxide/hydroxide. After the HF etching process, a fluorine peak appeared at approximately 686 eV, indicating the presence of fluoride. The surface concentration of the different elements measured from the XPS is listed in Table II.
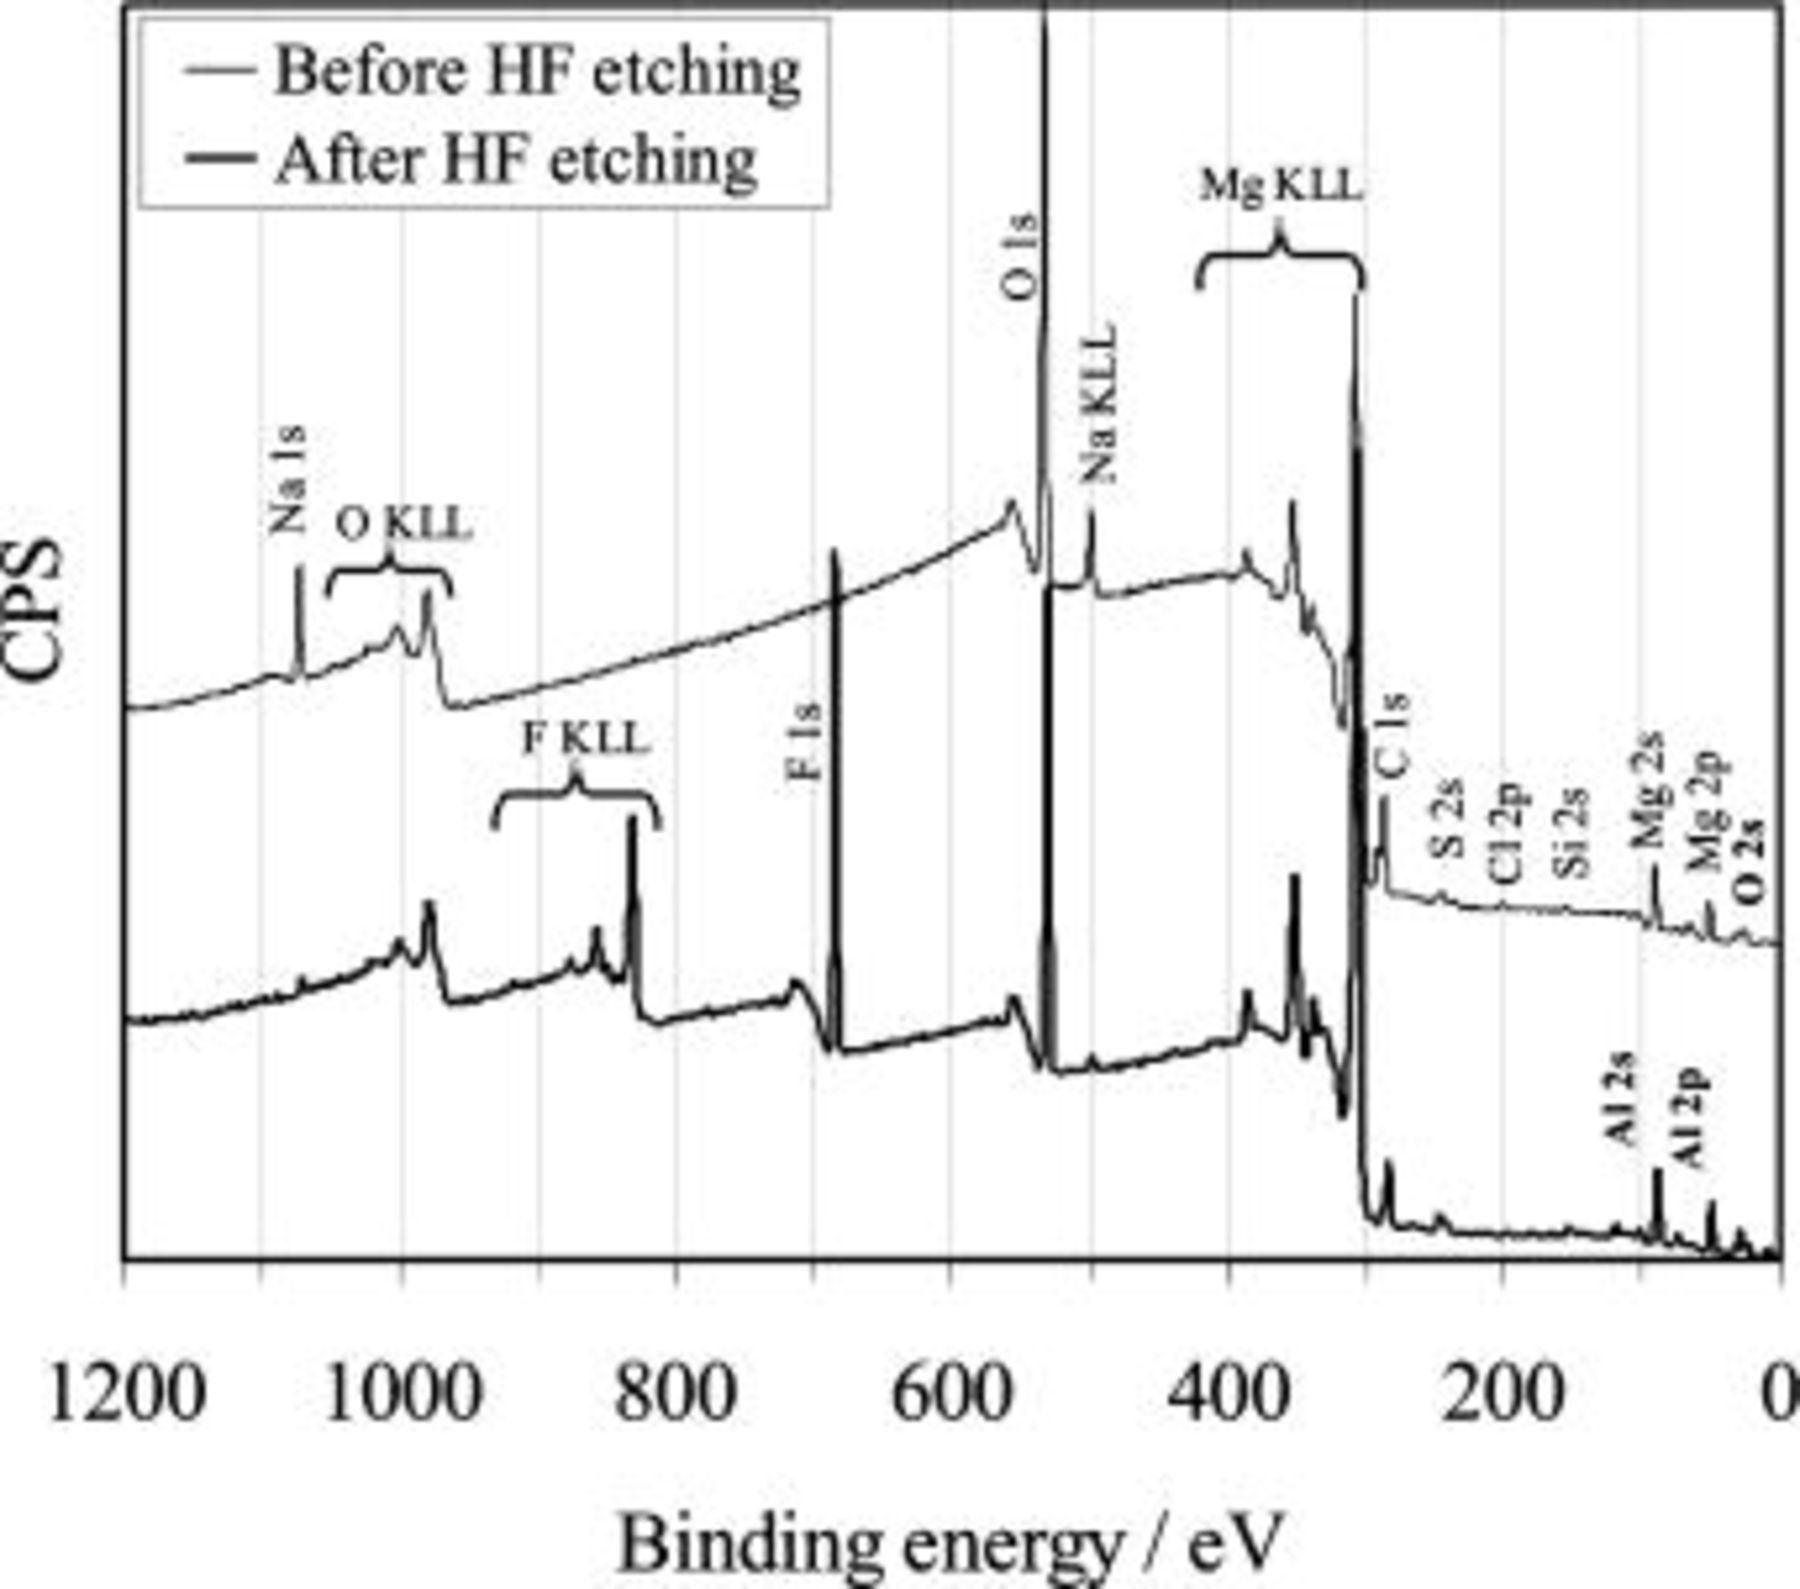
Figure 9. Survey scans of XPS on AZ91 magnesium alloy surface before (sample 00) and after (samples 01) HF etching (see Table II for the sample treatment conditions).
Table II. XPS concentration of Mg, Al, F, and O in the surface film of magnesium alloy with various pretreatment conditions.
| Sample | Atom % | |||
|---|---|---|---|---|
| Mg | Al | F | O | |
| 00 | 27 | 0.6 | 0 | 72 |
| 01 | 23 | 2.0 | 34 | 41 |
| 02 | 24 | 1.8 | 37 | 37 |
| 03 | 20 | 1.7 | 61 | 17 |
| 04 | 22 | 1.8 | 43 | 33 |
00: AZ91D - glass beading - isopropanol cleaning.01: AZ91D - glass beading - isopropanol cleaning - 3.3 M HF etching for 10 s at room temperature.02: AZ91D - glass beading - isopropanol cleaning - alkaline degreasing - 3.3 M HF etching for 10 s at room temperature.03: AZ91D - glass beading - isopropanol cleaning - alkaline degreasing - 5.5 M HF etching for 10 s at room temperature.04: AZ91D - glass beading - isopropanol cleaning - alkaline degreasing - 3.3 M HF etching for 10 s at 70°C.
In order to analyze the chemical states in the surface film, peak fittings for the high-resolution XPS spectra of Mg 2p, O1s, and F 1s core level regions were carried out as shown in Fig. 10. To perform the fitting process, only one peak was needed to fit the spectra for F 1s, but three peaks of Mg 2p BE(I), Mg 2p BE(II), and Mg 2p BE(III) were required for Mg 2p, and two peaks of O1s BE(I) and O1s BE(II) were used for O 1s.24 Table III summarizes the fitting results, which give not only the absolute binding energy (BE) of different core levels at various conditions, but also the difference of BEs between the levels. By using the difference of BEs, many problems in choosing an appropriate reference level can be avoided when comparing the results from various experiments and the literature.
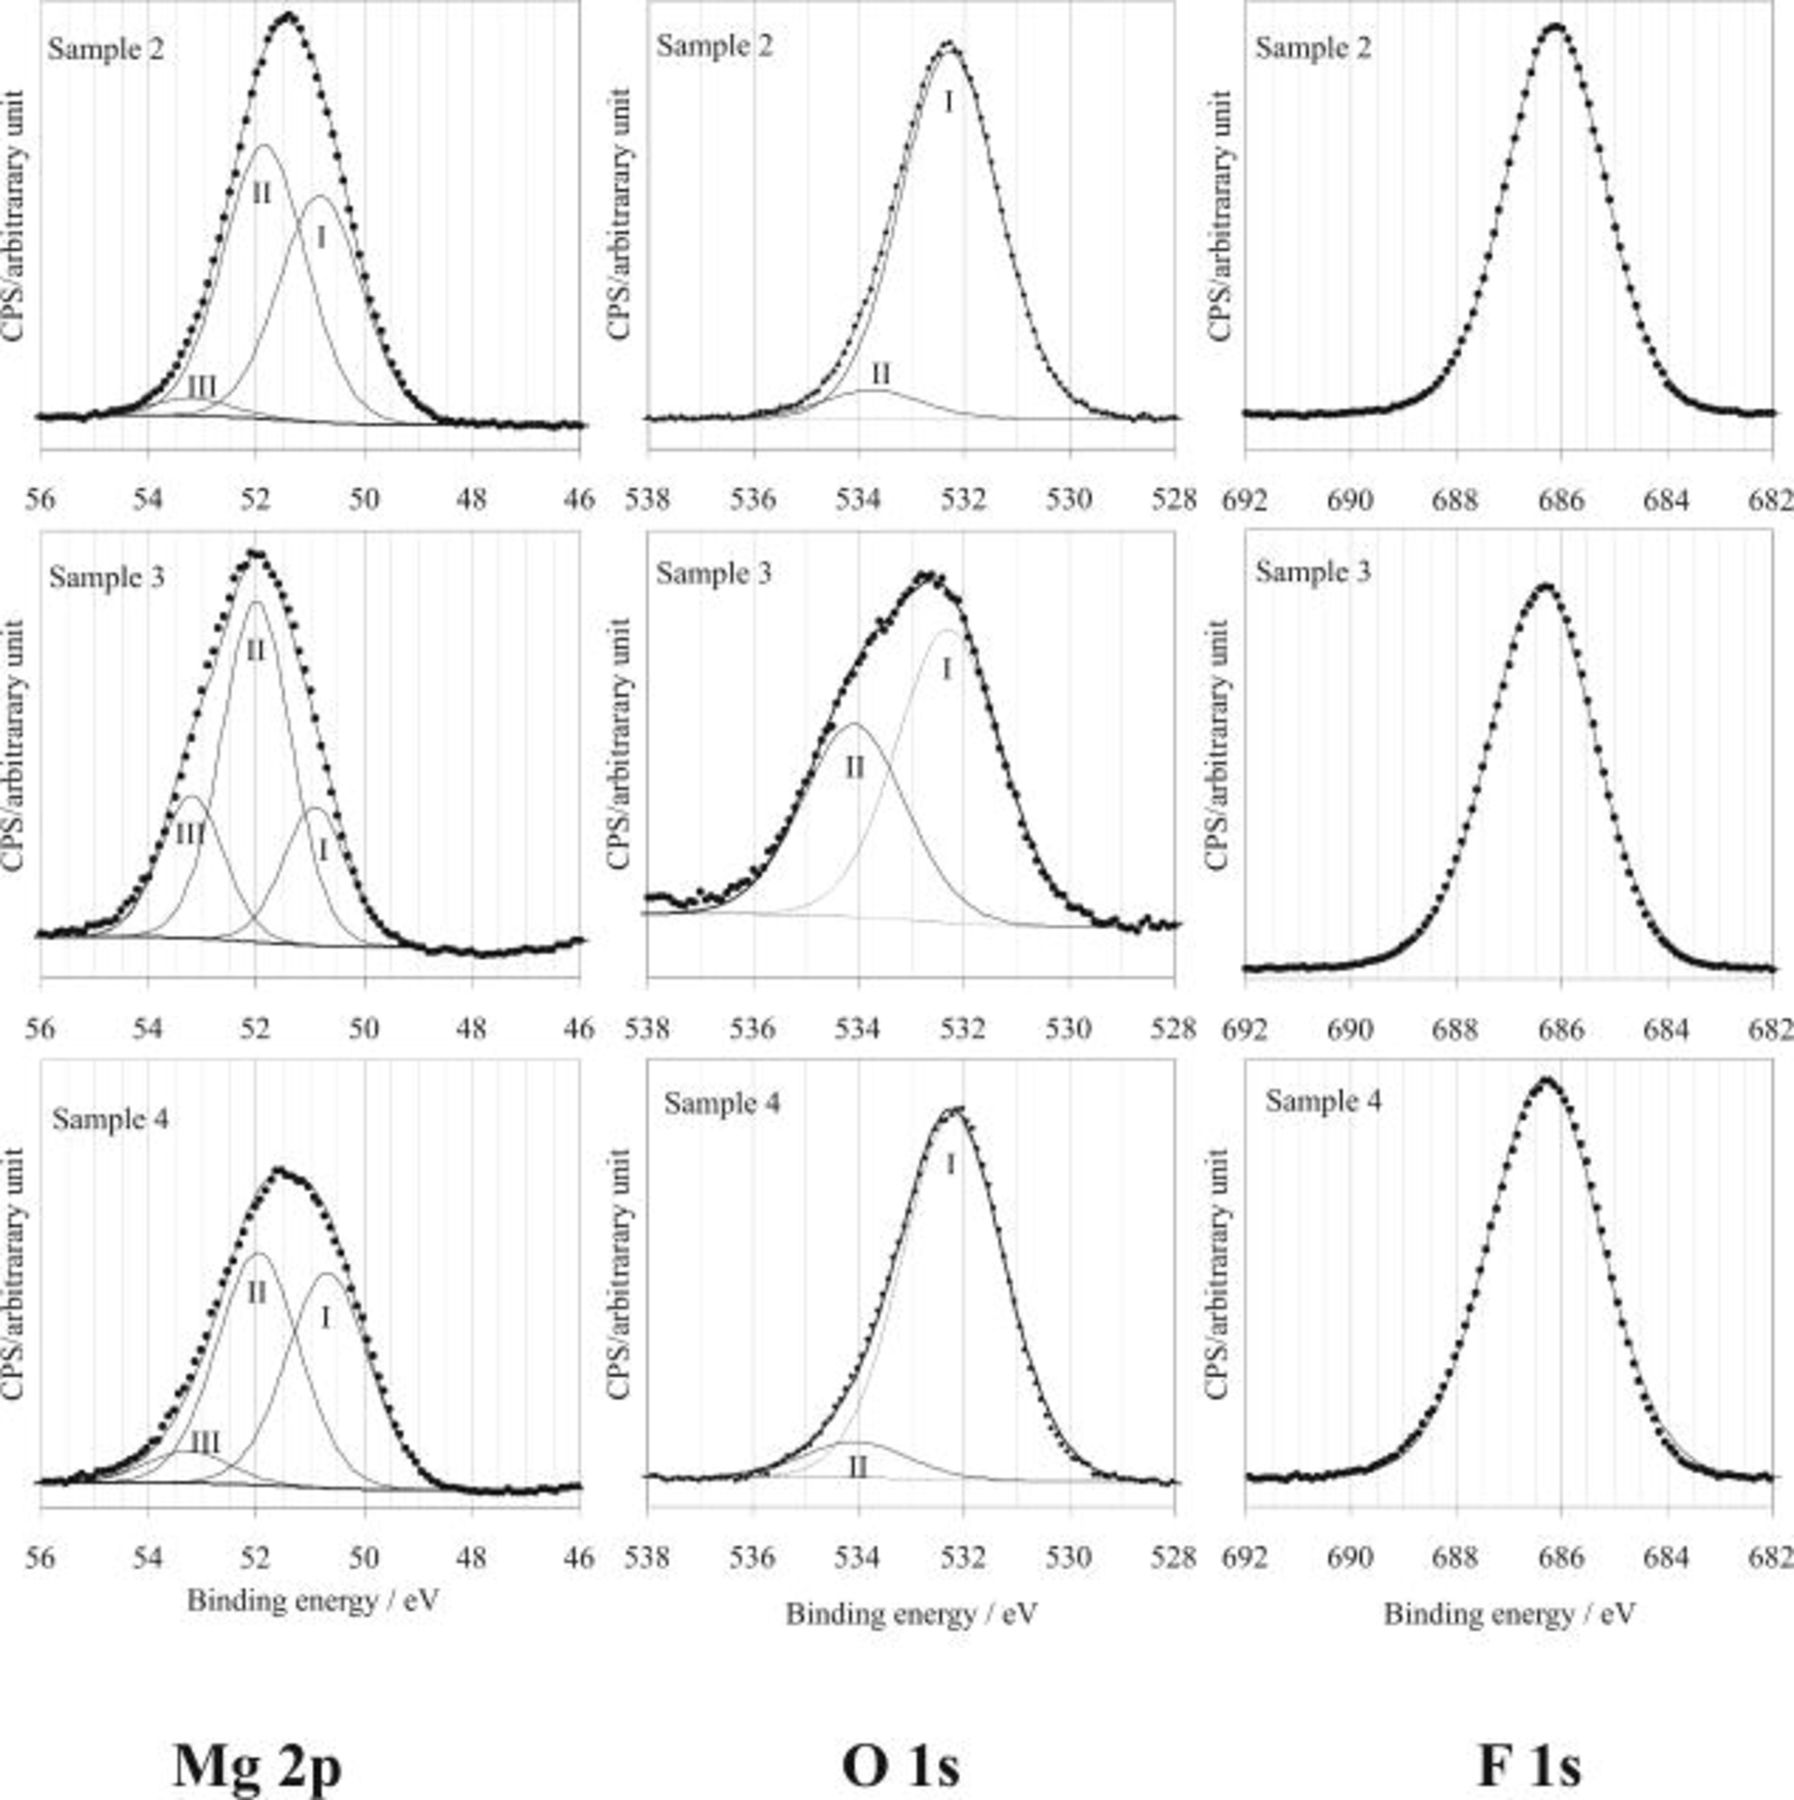
Figure 10. High-resolution scans of XPS for Mg 2p, O 1s, and F 1s on AZ91 magnesium alloy surface after HF etching in solutions containing HF in various concentrations (samples 02, 03, and 04, see Table II for the sample process conditions).
Table III. Chemical shifts (in electron volts) for Mg 2p, O 1s, and F 1s core level regions for samples 02, 03, and 04 (see Table II for the sample treatment conditions).
| Sample | M 2p BE(I) | M 2p BE(II) | M 2p BE(III) | O 1s BE(I) | O 1s BE(II) | F 1s | O 1s BE(I)-Mg 2p BE(I) | F 1s-Mg 2p BE(II) | F 1s-Mg 2p BE(III) |
|---|---|---|---|---|---|---|---|---|---|
| 02 | 50.8 | 51.9 | 53.1 | 532.2 | 533.8 | 686.3 | 481.4 | 634.4 | 633.2 |
| 03 | 50.9 | 52 | 53.3 | 532.3 | 534.1 | 686.3 | 481.4 | 634.3 | 633 |
| 04 | 50.8 | 52 | 53.2 | 532.1 | 534 | 686.3 | 481.3 | 634.3 | 633.1 |
| Data from Ref. 24 | 481.3 to 481.7 | 634.5 to 634.7 | 632.9 | ||||||
| Ascribed to |

|
|

| ||||||
According to Verdier et al. ,24 the Mg 2p BE(I) is related to O 1s BE(I). The difference,  , measured between the O 1s BE(I) and Mg 2p BE(I), ranges from 481.3 to 481.4 eV (Table III), which is in good agreement with the previously reported values24 for a magnesium hydroxide,
  . This suggests that instead of MgO,
  was present at the surface of different samples. For the higher BE, Mg 2p BE(II), its binding energy difference from the fluorine core level,
  , is between 634.3 and 634.4 eV (Table III). They could be ascribed to
  -type magnesium hydroxyfluoride, consistent with Verdier et al.24 Furthermore, another peak, Mg 2p BE(III), was measured, having a BE of 53.1-53.3 eV. Its BE difference from fluorine core level,
  , is 633-633.2 eV, suggesting the presence of
  at the surface film according to the BE difference reported for a standard
  .24
.24
The oxygen spectra (Fig. 10) also shows a high BE peak, O1s BE(II), at approximately 534 eV for the different samples, which could be ascribed to oxygen atoms bound to carbon atoms in the contamination layer.25, 26
Surface morphology
HF etching process
SEM was employed to examine the surface morphology of magnesium alloy treated under various conditions. Shown in Fig. 11 and 12 are the secondary electron images obtained after the HF etching process. For comparison, the image obtained from a sample before the HF etching process is also presented (Fig. 11f). It shows that the surface morphologies formed by the HF etching process exhibit a typical "mud-like" texture. "Mud-like" texture is usually produced by precipitation of corrosion products. As corrosion products dehydrate, the precipitate contracts, forming cracks.
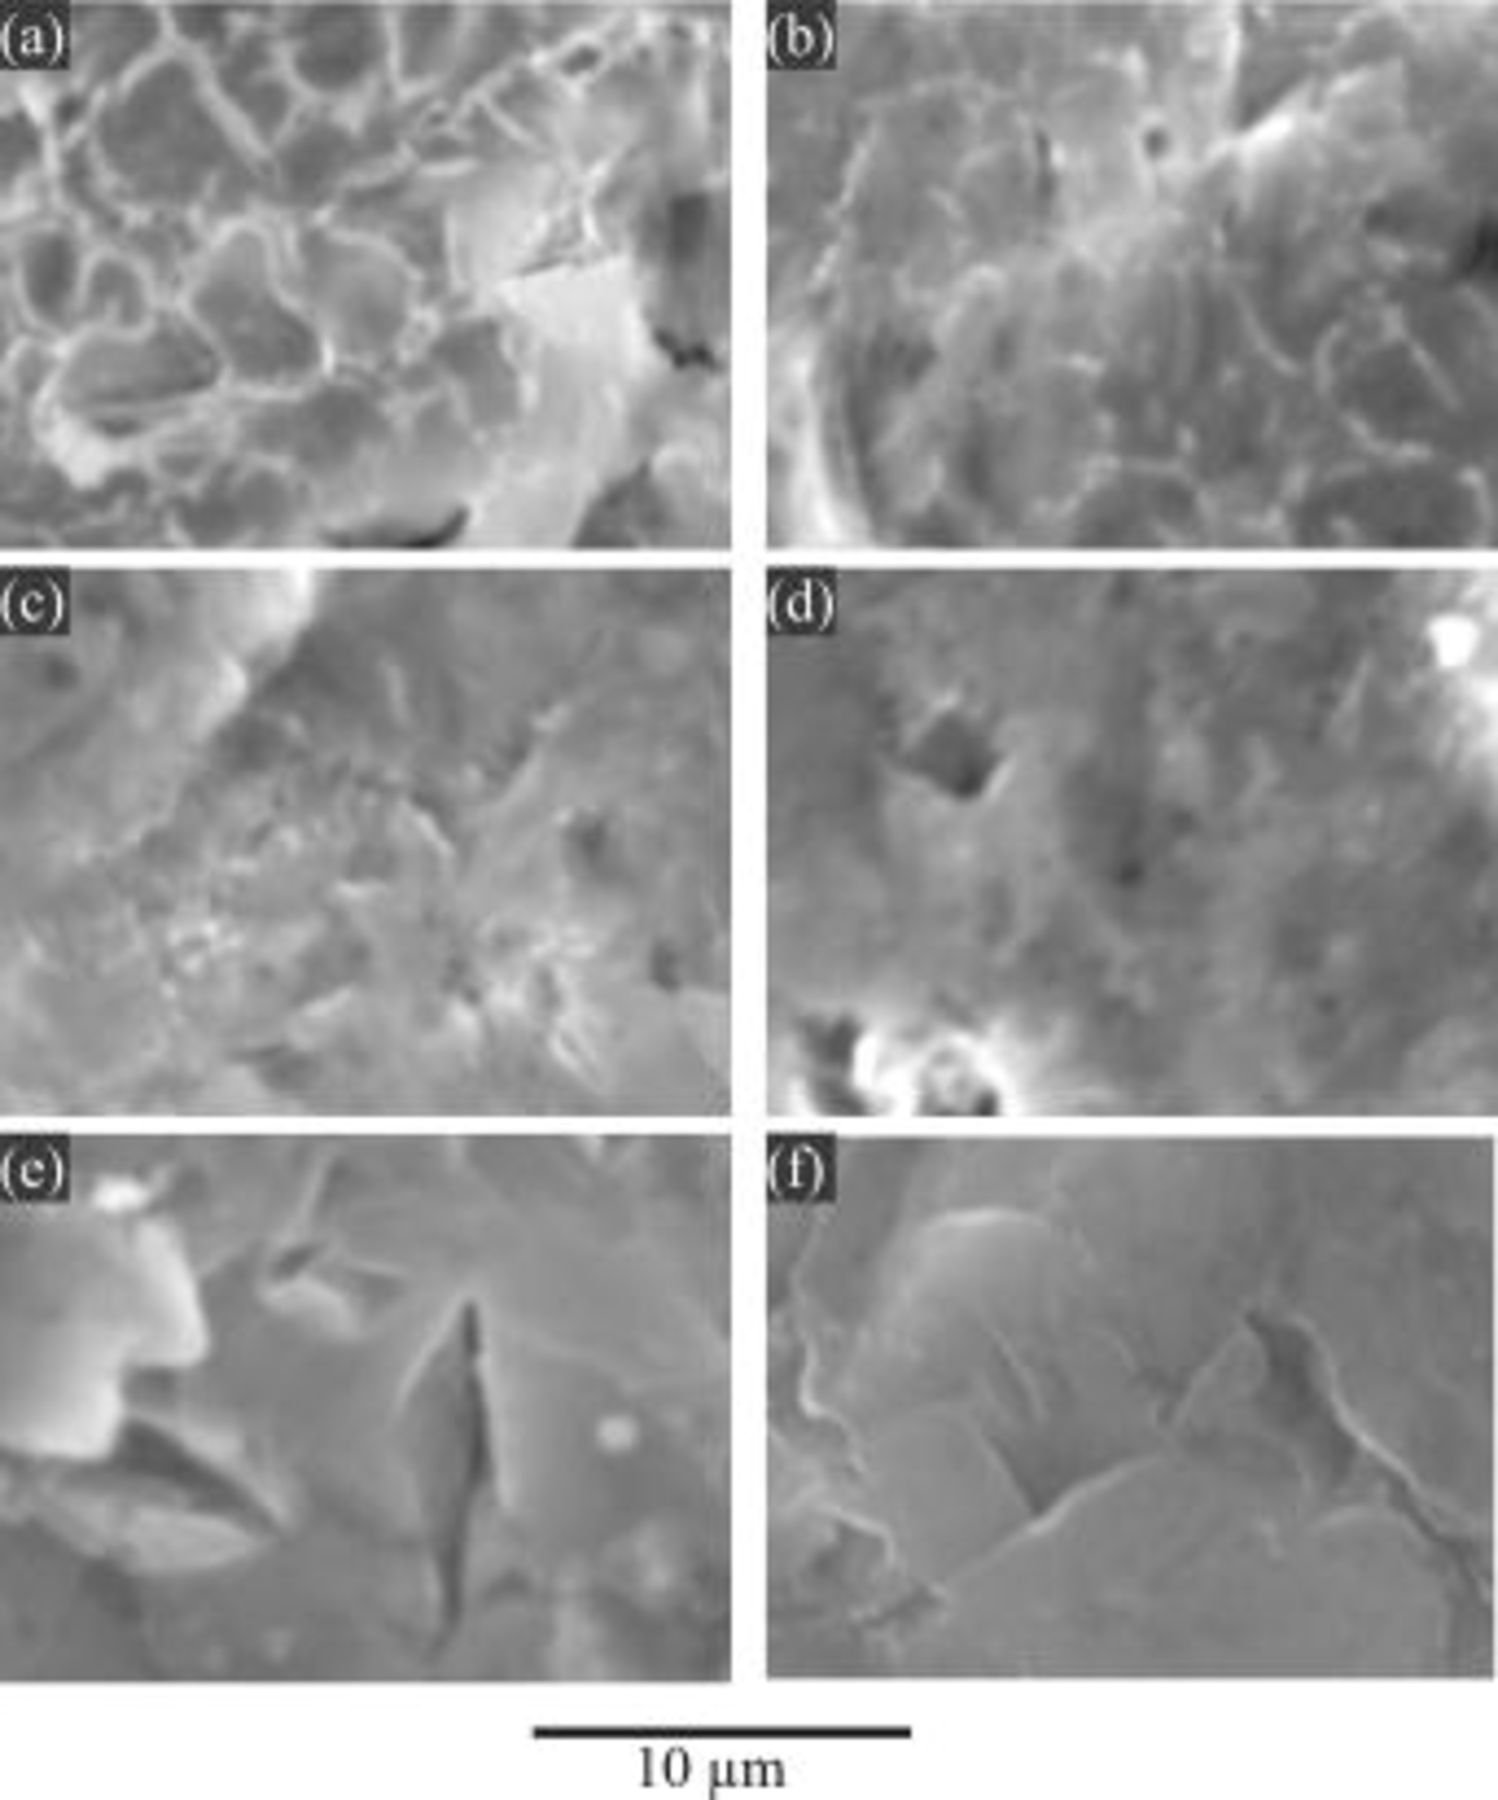
Figure 11. Secondary electron (SE) images for AZ91 magnesium alloy after the HF etching process for 10 min in a solution containing 3.3 M HF at various temperatures: (a) 25, (b) 35, (c) 50, (d) 60, and (e) 70°C, and (f) before HF etching.
In this study the observed mud-like texture was formed by the precipitation of magnesium-fluoride species generated during the HF etching process. This may give an indication of the significance of magnesium dissolution. Thus, the effect of temperature on the surface texture of magnesium after the HF etching process is significant: more dissolution of magnesium is observed at lower temperature (e.g., 25°C) than higher temperature (e.g., 70°C). In particular, there is little difference between the images of Fig. 11e, HF-treated at 70°C, and 11f, before HF treatment, which is evident that magnesium dissolution at 70°C rarely occurs. With regard to the HF concentration effect (Fig. 12), it is also clear that the dissolution of magnesium in the higher HF concentration (e.g., 5.5 M HF) is less observable than that in lower HF concentration (e.g., 1.1 M HF).
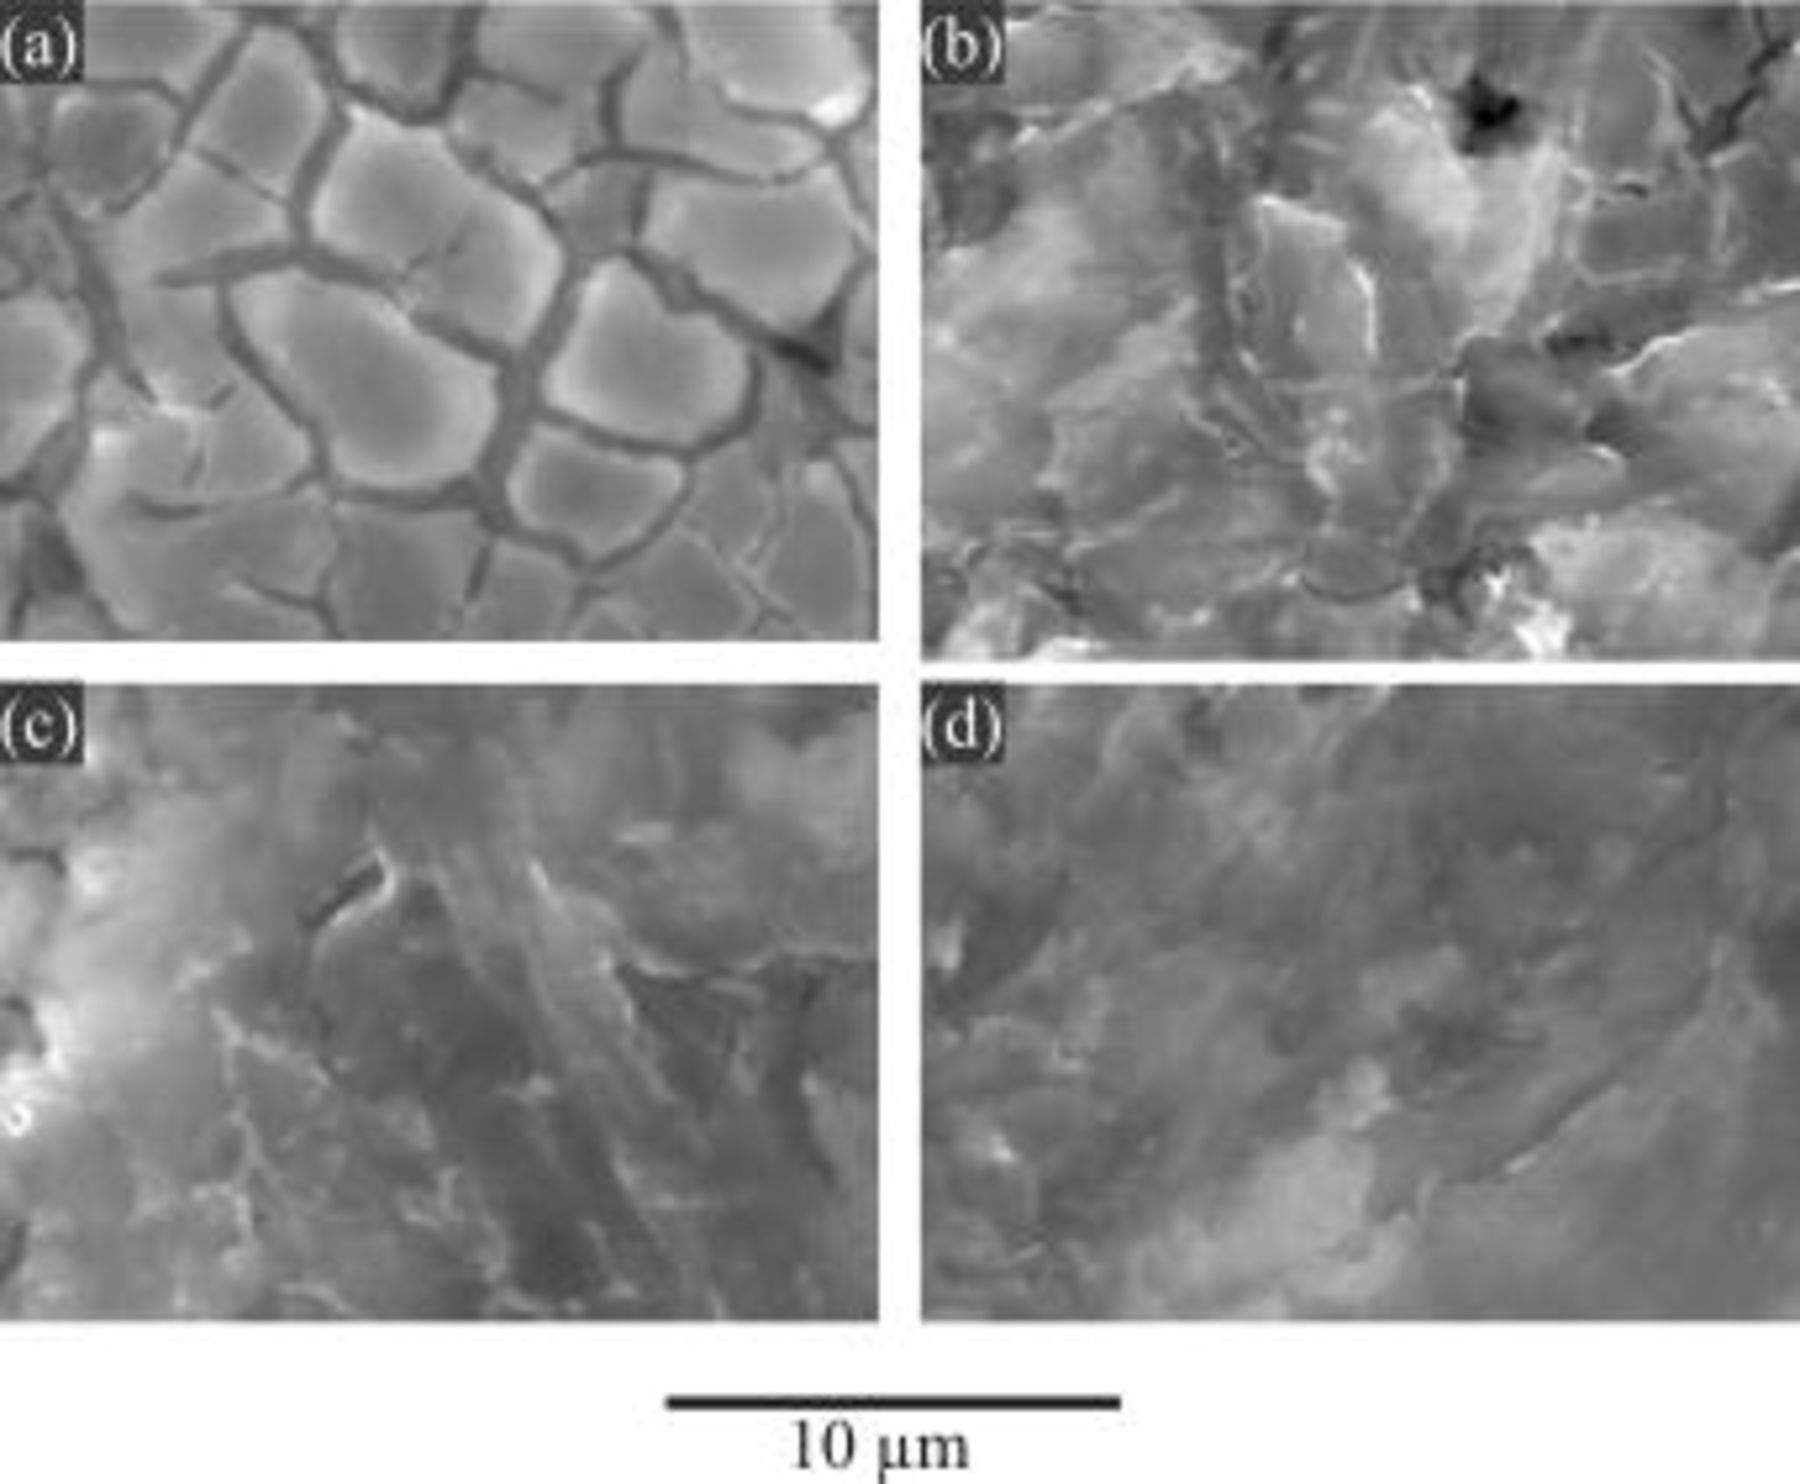
Figure 12. Secondary electron (SE) images for AZ91 magnesium alloy after the HF etching process for 10 min in solutions containing various HF concentrations (25°C): (a) 1.1, (b) 3.3, (c) 4.4, and (d) 5.5 M HF.
Copper immersion deposition
The BSE images of copper immersion deposition are presented in Fig. 13 and 14, showing the effects of HF concentration and bath temperature, respectively. The surface coverage of copper deposition derived from these images is shown as the inserts in the corresponding figures. Figure 13 indicates that surface coverage first increases with increasing HF concentration and then decreases after reaching a maximum point at 2.2 M HF. With regard to temperature effect it is clear that the copper surface coverage decreases with increasing bath temperature (Fig. 14).
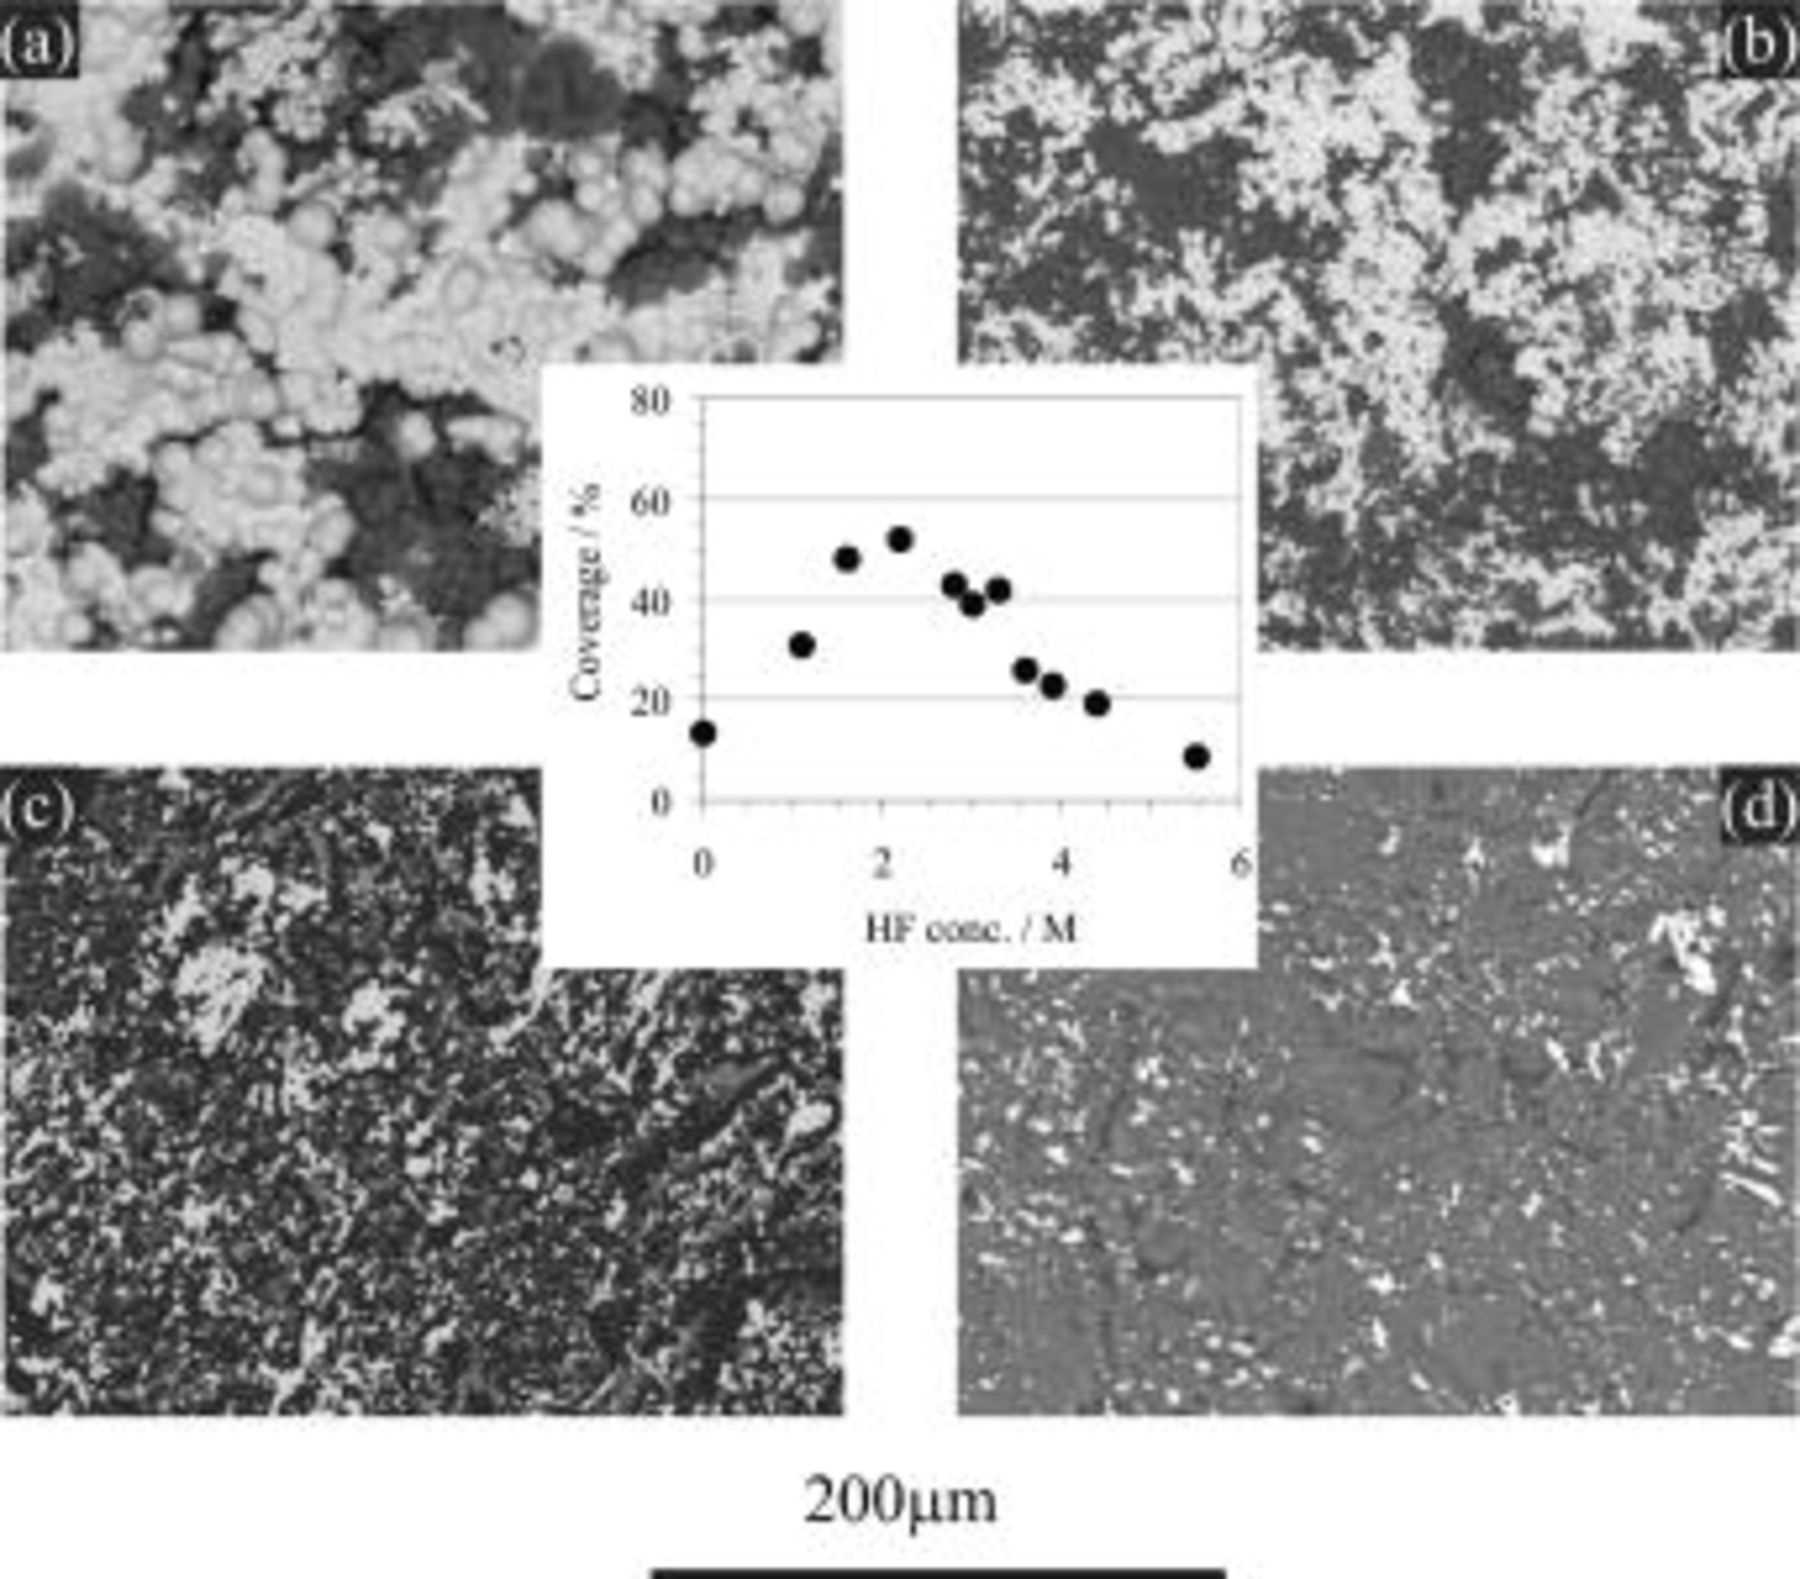
Figure 13. BSE images for AZ91 magnesium alloy after the copper immersion deposition for 10 min in solutions containing  in various concentrations (25°C): (a) 2.2, (b) 3.3, (c) 4.4, and (d) 5.5 M HF. (Insert) Plot of copper surface coverage - HF concentration derived from BSE images.
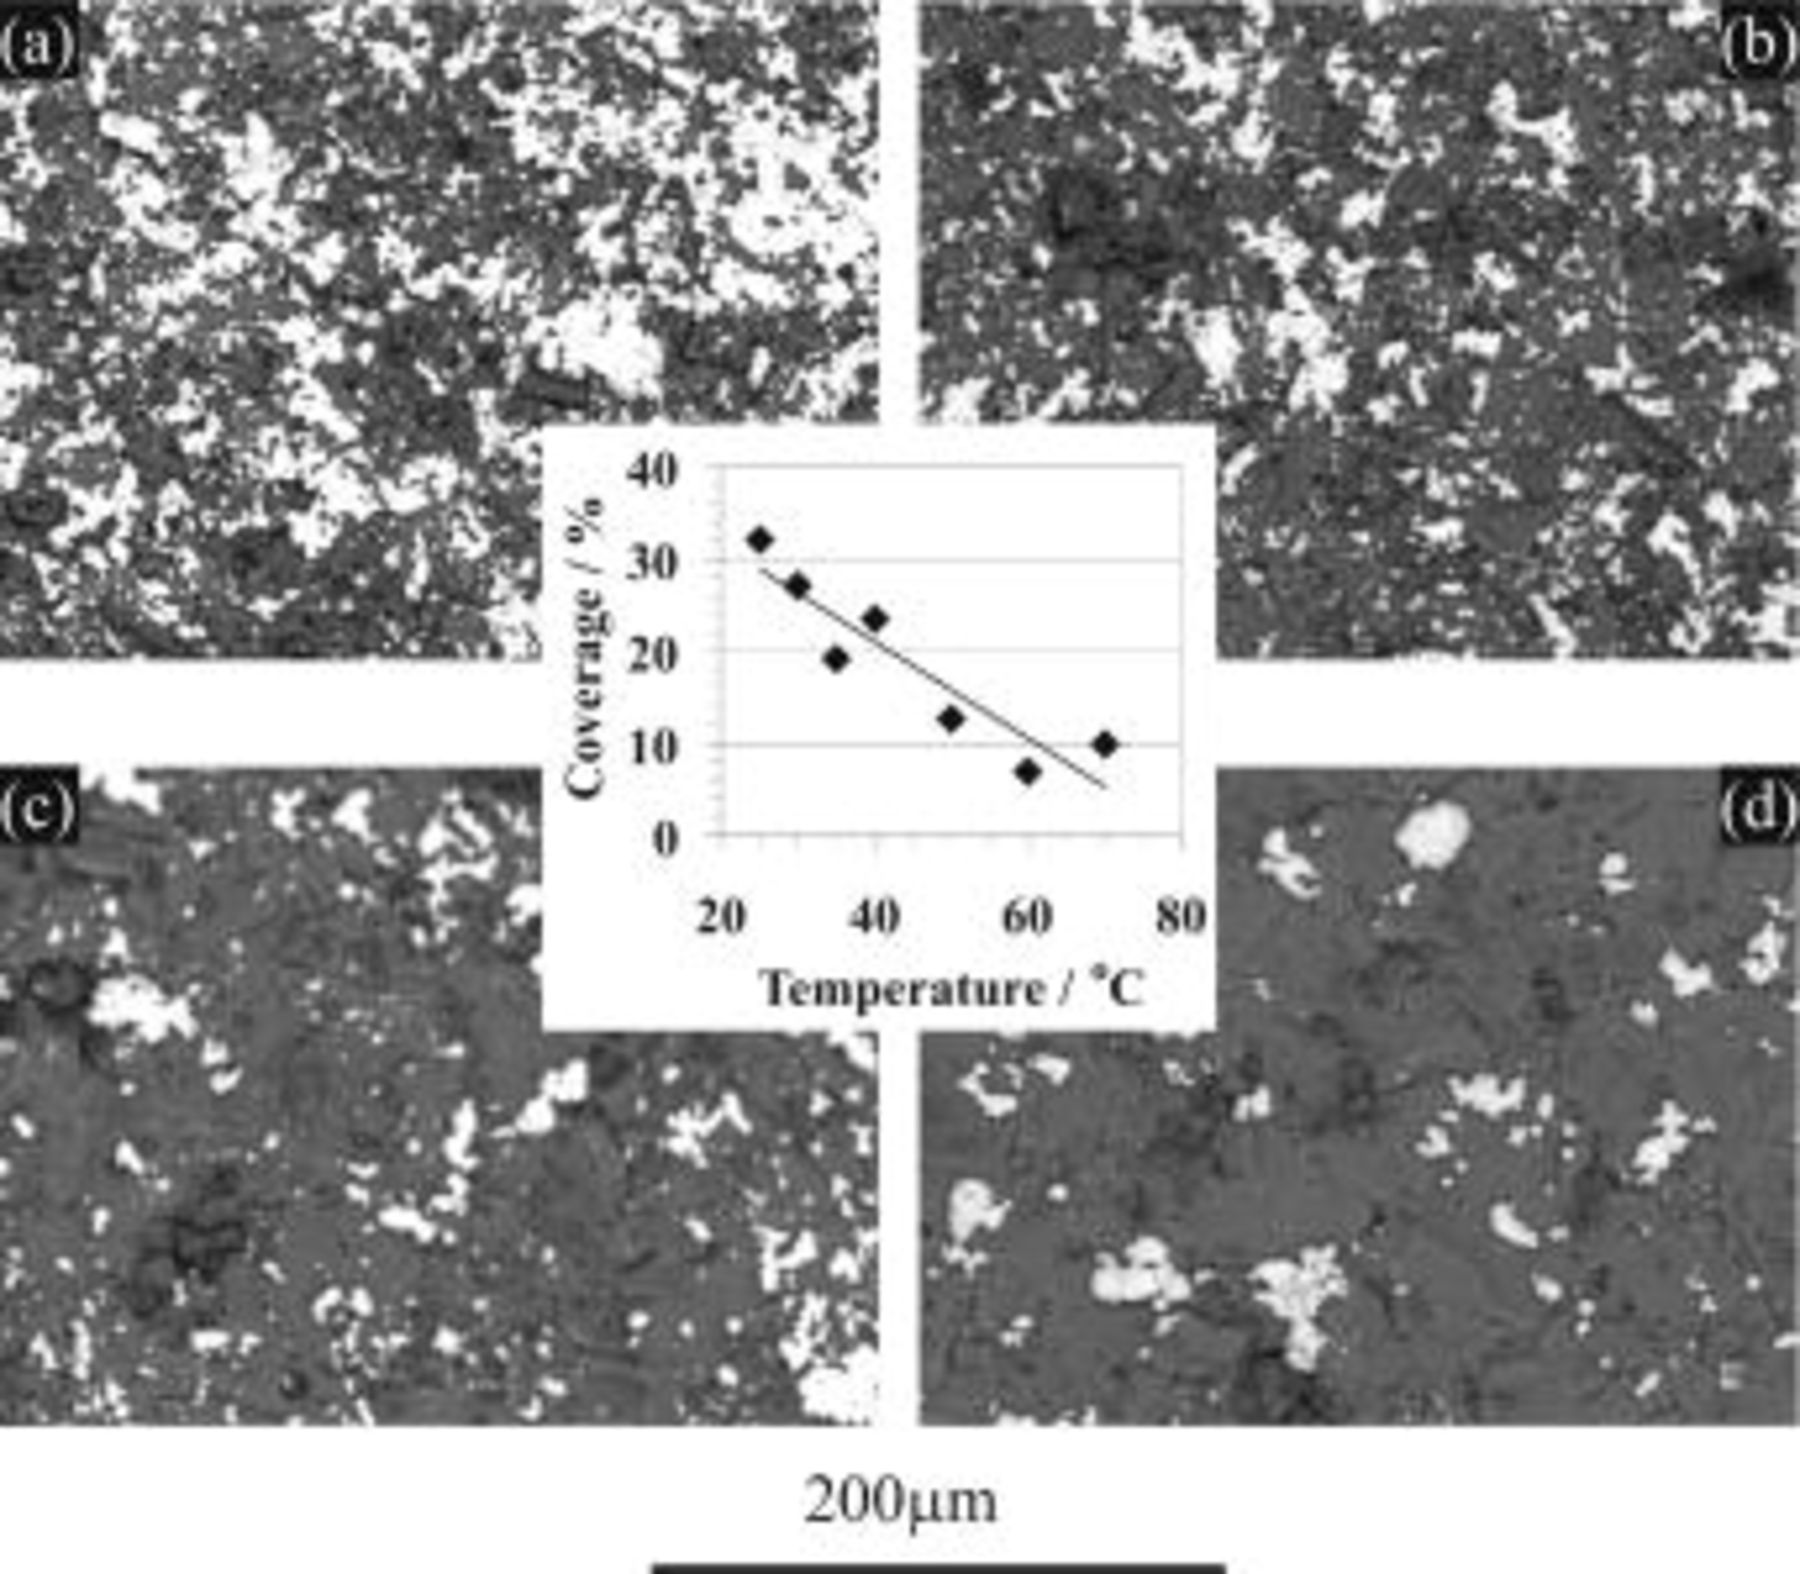
Figure 14. BSE images for AZ91 magnesium alloy after the copper immersion deposition for 10 min in solutions containing  at various temperatures: (a) 25, (b) 35, (c) 50, and (d) 70°C. (Insert) Plot of copper coverage vs. temperature derived from BSE images.
Discussion
Surface film formation during the HF etching process
From the experimental results, it is clear that both temperature and HF concentration significantly affect the film formation on the magnesium surface during the HF etching process.
According to the OCP results (Fig. 1 and 2), the value of plateau potential ranges from  to
to  , depending on HF concentration and bath temperature. The standard potential of electrode reaction for
  is
is  vs. the saturated hydrogen electrode (SHE).20 In chloride aqueous solutions the actual corrosion potential of magnesium is usually increased to
  to
to  vs. SHE, attributable to the formation of a surface film of
  or MgO.27, 4 In this study, the further increase in OCP in the presence of fluoride instead of chloride is due to the fluoride-containing species in the film.
In the literature, a film formation on magnesium alloy surface is frequently reported3, 28 although the exact film structure and composition may be different under different surface treatment conditions. In this study, the XPS analysis results show that the surface films formed by the HF etching process are rich in fluorine (Table II) and presumably have a structure of  (Table III). The aluminum content in the film is relatively low, consistently for all samples, after the HF etching process. This may be attributed to the stability of magnesium and aluminum in hydrofluoric acids. In HF solutions, aluminum is reported to be unstable and may form
  complexes, dissolving into the solution.29, 30 In contrast, magnesium may form
  to develop a surface film.19, 27 The resultant
  may also be followed by a
  exchange or hydration process, leading to the formation of a more stable surface film containing
  .27
.27
SEM observations confirmed such a film formation on the magnesium surface. The films are more compact at higher temperatures (Fig. 11) or in solutions with higher HF concentration (Fig. 12). Both trends are also reflected by the OCP results, in terms of the plateau potential (Fig. 1 and 2), and the EIS results where the resistance,  , increases as HF concentration or temperature increases (Fig. 7 and 8). It is notable from Table II that fluorine content in the surface film was increased with the increase of either HF concentration (sample 02 to 03) or temperature (sample 02 to 04). The higher fluoride content in the film could be one reason for the observed compact surface film. Based on the above discussion it is expected that the HF concentration or bath temperature could render control of the magnesium dissolution for achieving a good quality coating during the copper immersion deposition.
Copper immersion deposition — HF concentration depen dence
The copper immersion deposition on magnesium involves charge transfer between reacting chemical species of  . More specifically20, 31


When magnesium substrate is immersed in a solution containing copper ions, magnesium atoms (less noble) dissolve as the anodic reaction and spontaneously are replaced by copper atoms from the solution (copper deposition). As soon as the copper deposition begins, the surface of the magnesium substrate becomes a mosaic of anodic (magnesium) and cathodic (copper) sites. Theoretically, the process continues until almost the entire substrate is covered with copper.
However, it was observed that in a simple aqueous solution only containing copper ions, the copper deposition process was accompanied by violent magnesium dissolution, impeding the development of good quality coating. According to the previous discussion, hydrofluoric acid is beneficial to the surface film formation on magnesium, which protects magnesium from violent dissolution. It is therefore added to the immersion-deposition bath to render a control of the magnesium dissolution, hence copper deposition. After adding hydrofluoric acid to the copper immersion bath (e.g.,  ), the deposition process continues until the entire substrate is covered with copper and fluoride/hydroxide film. At this point anodic dissolution virtually ceases, resulting in the termination of immersion deposition, which can be manifested by the coverage-time plot.14 Thus, the magnesium surface after the copper deposition process is composed of two areas, i.e., coated areas (white) and uncoated areas (dark), as shown in Fig. 13 and 14.
According to the above discussion, a model (Fig. 15) is proposed for the understanding of the copper immersion deposition process. In this model, before immersion (step 1) the magnesium substrate is covered with a magnesium hydroxide film. The film generally possesses a poor stability and is not perfectly uniform.6 It may also contain imperfections/defects. After immersing the magnesium substrate into the copper deposition solution (step 2), anodic magnesium dissolution occurs, preferentially at those regions/sites where the protection of magnesium substrate by the film is relatively weak. Correspondingly, in the other regions/sites where the potential is nobler as compared to the anodic sites, copper deposition takes places. During the same period, a new film rich in fluoride on the uncoated areas may be formed by the reaction of  19, 27 and by the destruction/transformation of hydroxide film. These processes continue until the entire substrate is covered with copper (coated areas) and fluoride/hydroxide film (uncoated areas), as depicted in step 3.
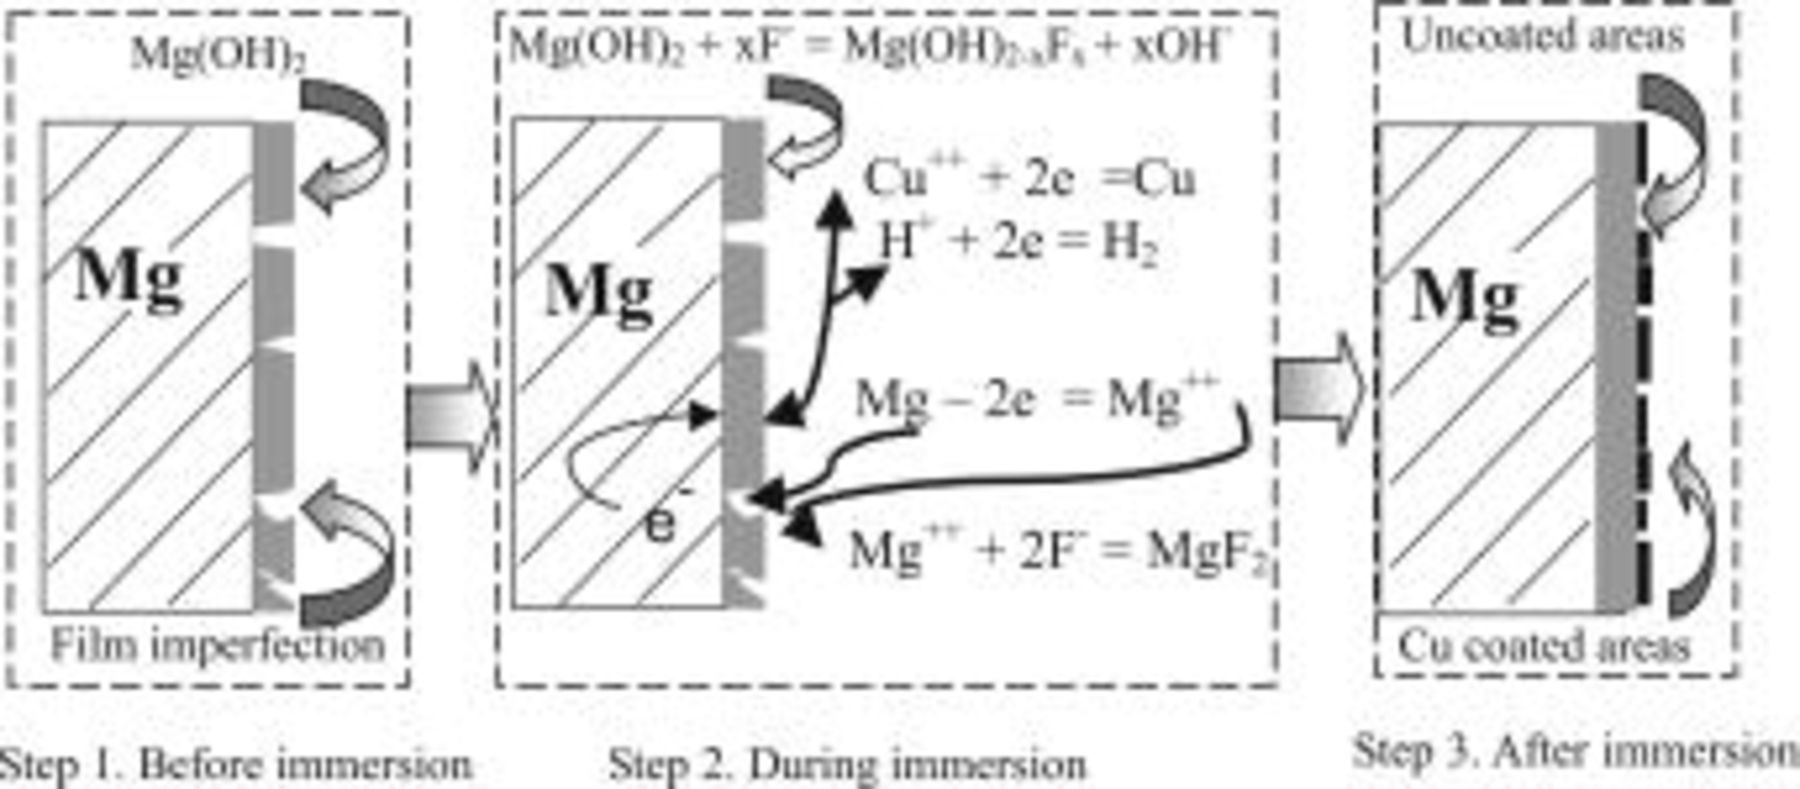
Figure 15. A model proposed for understanding the copper immersion deposition process.
The relation between HF concentration and copper surface coverage is given in Fig. 13, which shows a peak at approximately 2.2 M HF. This can be explained according to the proposed model: in a lower HF-containing bath (e.g., 1.1 M HF), the surface film formed on magnesium possessed a loose and discontinuous feature (Fig. 12a) with poor protection. The dissolution of magnesium is therefore violent, resulting in nonadherent and spongy copper deposits that were subsequently partially removed from the substrate surface by violent hydrogen evolution. With an increase of HF concentration, the surface film formed became increasingly more dense and compact (Fig. 12) with a higher content of fluoride species (Table II). Such a compact film, simultaneously formed during copper deposition, not only prevented violent magnesium dissolution but also enabled copper to deposit as fine and adhesive crystallites (e.g., Fig. 13b). With the further increase in HF concentration, however, copper deposition was only able to take place at a very early stage, because the rapid film formation limited the available anodic sites on the surface. As a result, a decrease in copper coverage is observed (Fig. 13).
Copper immersion deposition—temperature effect
Figure 14 indicates that the surface copper coverage on the substrate decreased with the elevation of bath temperature. For an understanding of the mechanism of such temperature effects, the enthalpy change of the reactions  involved in copper immersion deposition is listed below


where  is the enthalpy change of reactions
  at 298.5 K. The formation of the corrosion product,
  , subsequently reacts with
  or water to form a surface film 12, 27


As indicated, Reactions 3, 4 are exothermic, while 6, 7 are endothermic. Therefore, increasing temperature is unfavorable to both magnesium dissolution (Reaction 3) and copper reduction (Reaction 4), while the film formation is favored by either forming fluoride (Reaction 6) or oxide film (Reaction 7). As a result the copper surface coverage decreases with increasing bath temperature.
Conclusions
- (1)Formation of a surface film on magnesium alloy from a HF etching process is investigated. The surface film formed may have a structure of
 . The fluorine content depends on the treatment conditions; in particular, it increases as HF concentration or bath temperature increases.
 - (2)Both HF concentration and temperature have a significant effect on the copper immersion deposition, attributed to the surface film formation. In addition, the temperature dependence is also attributed to the enthalpy change of the reactions involved in the copper immersion deposition process.
- (3)A model for understanding the copper immersion deposition process is depicted. This model is based on results from XPS analysis, morphology observation, and electrochemical evidence.
Acknowledgment
The present work was sponsored by Natural Science and Engineering Research Council (NSERC) of Canada. The authors are thankful for assistance from Woo-Jae Cheong, John Nagata, Mike Meinert, and William Wells, IMTI at NRC. We also would like to acknowledge Mark C. Biesinger, Surface Science Western at The University of Western Ontario, for performing the XPS analysis.
The National Research Council of Canada assisted in meeting the publication costs of this article.