
Abstract
Operation of proton exchange membrane fuel cells at high current densities is a potential option to reduce fuel cell cost and volume for automotive applications. This operating regime was investigated using low cell voltages leading to limiting current density values. A zero-dimensional cell voltage model and a one-dimensional low cell voltage model were developed and validated. The operating conditions required for model applicability were summarized. The gas diffusion electrode overall mass transfer coefficient was identified as a key design parameter.
Export citation and abstract BibTeX RIS
Proton exchange membrane fuel cells (PEMFCs) are currently being developed owing to their multiple advantages as potentially clean and efficient energy sources. However, several issues still require improvement including cost, largely attributable to Pt-based catalysts and fluorinated-based proton exchange membranes. Operation at high current densities is a potential solution, which, for a given power requirement, reduces stack materials inventory and volume. This solution is especially relevant for automotive applications due to space limitations within the vehicle body. However, relatively little work has been completed to understand the key parameters related to PEMFC operation at high current densities. Such knowledge is necessary to provide direction and further optimize cell design.
The cathode oxygen mass transport treatment of a  -dimensional PEMFC model previously developed was reduced to a linear concentration profile with a slope dependent on both current density and overall mass transfer coefficient.1 This treatment resulted in a sharp cell voltage drop in the high current density region of the polarization curve. Such a sharp voltage drop is seldom directly observed for full size cells, and further confirmation of this assumption is desirable. Additionally, a method was needed to obtain an independent mass transfer coefficient estimate without interference from the other three model parameters (exchange current density, membrane resistivity, water mass transfer coefficient). This overall mass transfer coefficient is a key gas diffusion electrode design parameter associated with high current density operation.
The method selected to address these issues requires cell operation at the limiting current density. Under these specific conditions, practical considerations are important to facilitate data interpretation (need for uniform current density) and to minimize-control the effect of operating conditions-cell design. These considerations will be highlighted using present and literature data, and mathematical models specifically developed to account for high current density operation. The information and methods generated will be useful to design practical systems for operation at higher current densities but below the limiting value. This situation is illustrated in Fig. 1 with two polarization curves only differing by the oxygen mass transfer coefficient δ value. Operating point  corresponds to the maximum current density that can be used from the standpoint of system constraints (dc/ac or dc/dc converter lower input voltage limit) and efficiency (significant increase in overpotential at higher current densities). The knowledge of the dependence of gas diffusion electrode design parameters on the oxygen mass transfer coefficient will allow improved down selection and lead to increased limiting current values, as illustrated by the polarization curve with
  . This can translate into larger power densities (
 product) for the same investment in stack materials as indicated by operating point
  . Because the minimum cell voltage is the same as for point
  , the increase in power density is equal to 1.719–
 . Operating point
  is also significantly lower than the limiting current density value by 12% (1.955–
 ).
).
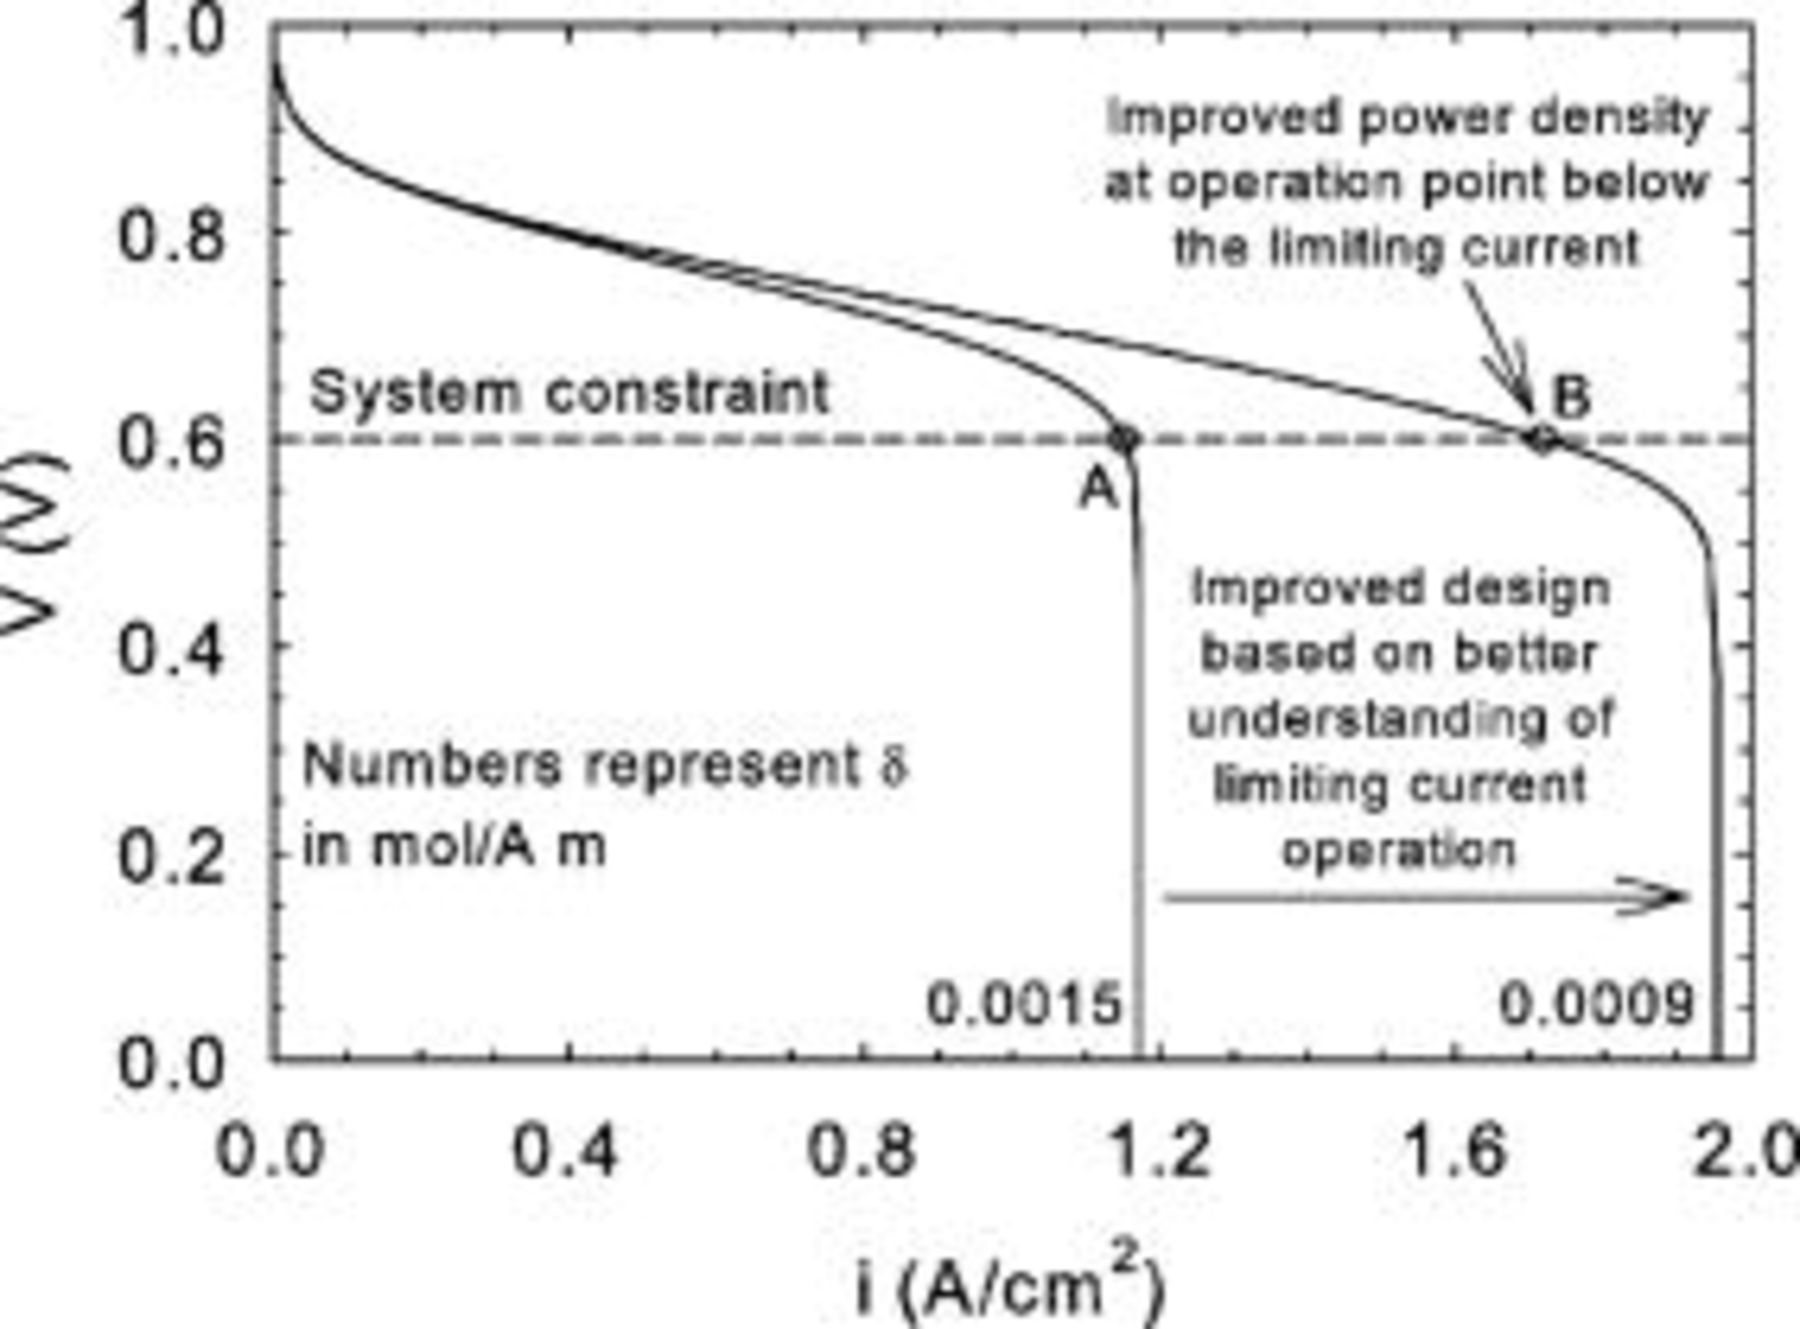
Figure 1. Polarization curves for different values of the oxygen mass transfer coefficient showing the principle behind the increase in operational current density obtained by a better understanding of limiting current density operation.
Model
Liquid water assumption
The oxygen reduction reaction is

At high current densities, mass transport of all the reactants and products may be important. However, oxygen is the focus of this study, thus requiring separation of the different mass transport overpotentials. State of the art materials and design are characterized by negligible ohmic losses (electron mass transport). In comparison, water requires more attention. Water vapor transport losses are minimized by using saturated inlet streams (absence of gas phase transport by minimizing concentration gradient), which also increases proton transport in the membrane by both migration and diffusion.2 Liquid water is more problematic, especially due to its effect on both mass transport and kinetic losses.3 Even if several methods have already been developed to measure liquid water amounts within operating PEMFCs, including neutron imaging, X-ray microtomography, proton nuclear resonance imaging microscopy, and residence time distribution,4–9 their sophistication is not yet sufficient for quantification, or property databases have not yet been established. Neutron imaging suffers from insufficient spatial resolution (an order of magnitude increase is needed) and is unable to distinguish between liquid water within the membrane and that within the cathode and anode flow field.5, 7 X-ray microtomography requires development to minimize ring artifacts arising from abrupt changes in density and atomic number at the porous gas diffusion layer interface.6 Proton nuclear magnetic resonance microscopy has insufficient temporal resolution for transient studies and is subject to interference from magnetic fuel cell materials.4 Residence time distribution techniques do not provide spatial resolution.8, 9 Mathematical modeling cannot presently be used to predict liquid water content within gas diffusion electrodes because the properties associated with liquid water transport in porous media, saturation, capillary pressure, intrinsic and relative permeability, are largely unknown.10, 11 Because measurement or prediction of the liquid water content within a gas diffusion electrode is not presently possible, liquid water effects were minimized by limiting production rates. This was achieved by reducing the oxygen concentration and thus the limiting current density. This approach also has the effect of decreasing the oxygen mass transport rate, while maintaining the proton mass transport rate, thus reinforcing the oxygen transport rate limiting assumption. This approach is reasonable considering some of the recent experimental neutron imaging characterization results.7 The gas diffusion electrode liquid water content is estimated at 5–18% of the pore volume based on Fig. 7 data of Ref. 7. Because oxygen was used, these water content values are considered an upper limit and are expected to be smaller with diluted air (lower current densities and water production rates).
Derivation
The main assumptions are12
- (1)Unit cell has straight reactant channels.
- (2)Cell performance is averaged over the cross-channel direction (plug flow reactor).
- (3)Cell voltage is constant along the cell length.
- (4)Isothermal operation.
- (5)Isobaric operation.
- (6)Reactants are saturated with water vapor.
- (7)Reactants obey the ideal gas law.
The inlet oxygen flux in the cathode channel  is first considered on an equivalent current density basis
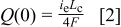
The nitrogen flux is constant (absence of crossover to the anode compartment and leaks) and is expressed as an oxygen flux multiple
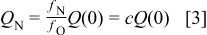
The oxygen channel concentration is
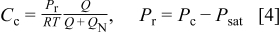
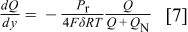
Under low voltage conditions, as a result of a reduced stoichiometry or high power demand (low external load resistance), the local current density at every position along the cell is considered to have reached the limiting value. With this observation, the local mass balance as a result of oxygen consumption by the electrochemical reaction takes the form
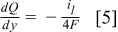
The limiting current is defined on the basis of a linearized first Fick's law
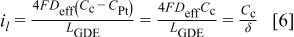
The parameter δ has crucial importance characterizing the transport properties of the gas diffusion electrode (design parameter). It can be interpreted as an overall mass transfer coefficient encompassing oxygen transport in both the gas (gas diffusion layer) and ionomer (catalyst layer) phases. Combination of Eq. 4, 5, 6 leads to
Equation 7 is solved in a universal way with one family of functions describing all low cell voltage operation. The cell length and oxygen flow rate are first rescaled [ ,
,  ]. Replacement of these scaled variables in Eq. 7 and dropping primes leads to

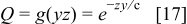
The number  can be described as a dimensionless ratio of the maximum current density permitted by mass transport to the equivalent current of the inlet oxidant stream. The implicit solution of Eq. 8 takes the form

Equation 9 has solutions  in terms of the universal function
  , where
  solves

It is possible to write an explicit formula for  in terms of the Lambert-
 function. Note that
  represents the oxygen flux fraction consumed in the cell (cell outlet is scaled to the position
  ) also known as the conversion often denoted by
  . Figure 2 illustrates the shape of
  as a function of the parameter
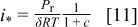
  . The maximum current density occurs at the cell inlet (Eq. 4, 6 combined with Eq. 8 inlet condition)
The more general derivation of Eq. 11 leads to (combination of Eq. 4, 6)
The universal scaled low voltage current density that can be derived from the oxygen flux curves is

Figure 3 illustrates the shape of the universal scaled current density  as a function of the parameter
  . The scaled average current density produced in the cell
  is (using
  definition from Eq. 8 and Eq. 11)
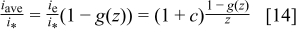
Equation 14 also defines the minimum stoichiometry to obtain the average current density
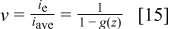
Figure 4 illustrates the shape of the minimum stoichiometry as a function of the scaled average current density for different values of the parameter  . In practice, the main equation describing diffusional limitations (Eq. 8) can be simplified for large
  values (low oxygen concentration in the reactant stream)

This is also convenient from a cell design point of view because, for air, large limiting current densities are expected, requiring design changes to accommodate modifications in electrical and thermal requirements. The solution to Eq. 16 has the form
This exponential decay is consistent with Kulikovsky's derivation.13 The universal scaled low voltage current density distribution that can be derived from the oxygen flux curves (simplified Eq. 11, 12, 13 for large  values combined with Eq. 17) is also exponential
The average current density is

For  and after rearrangement, Eq. 19 is rewritten as
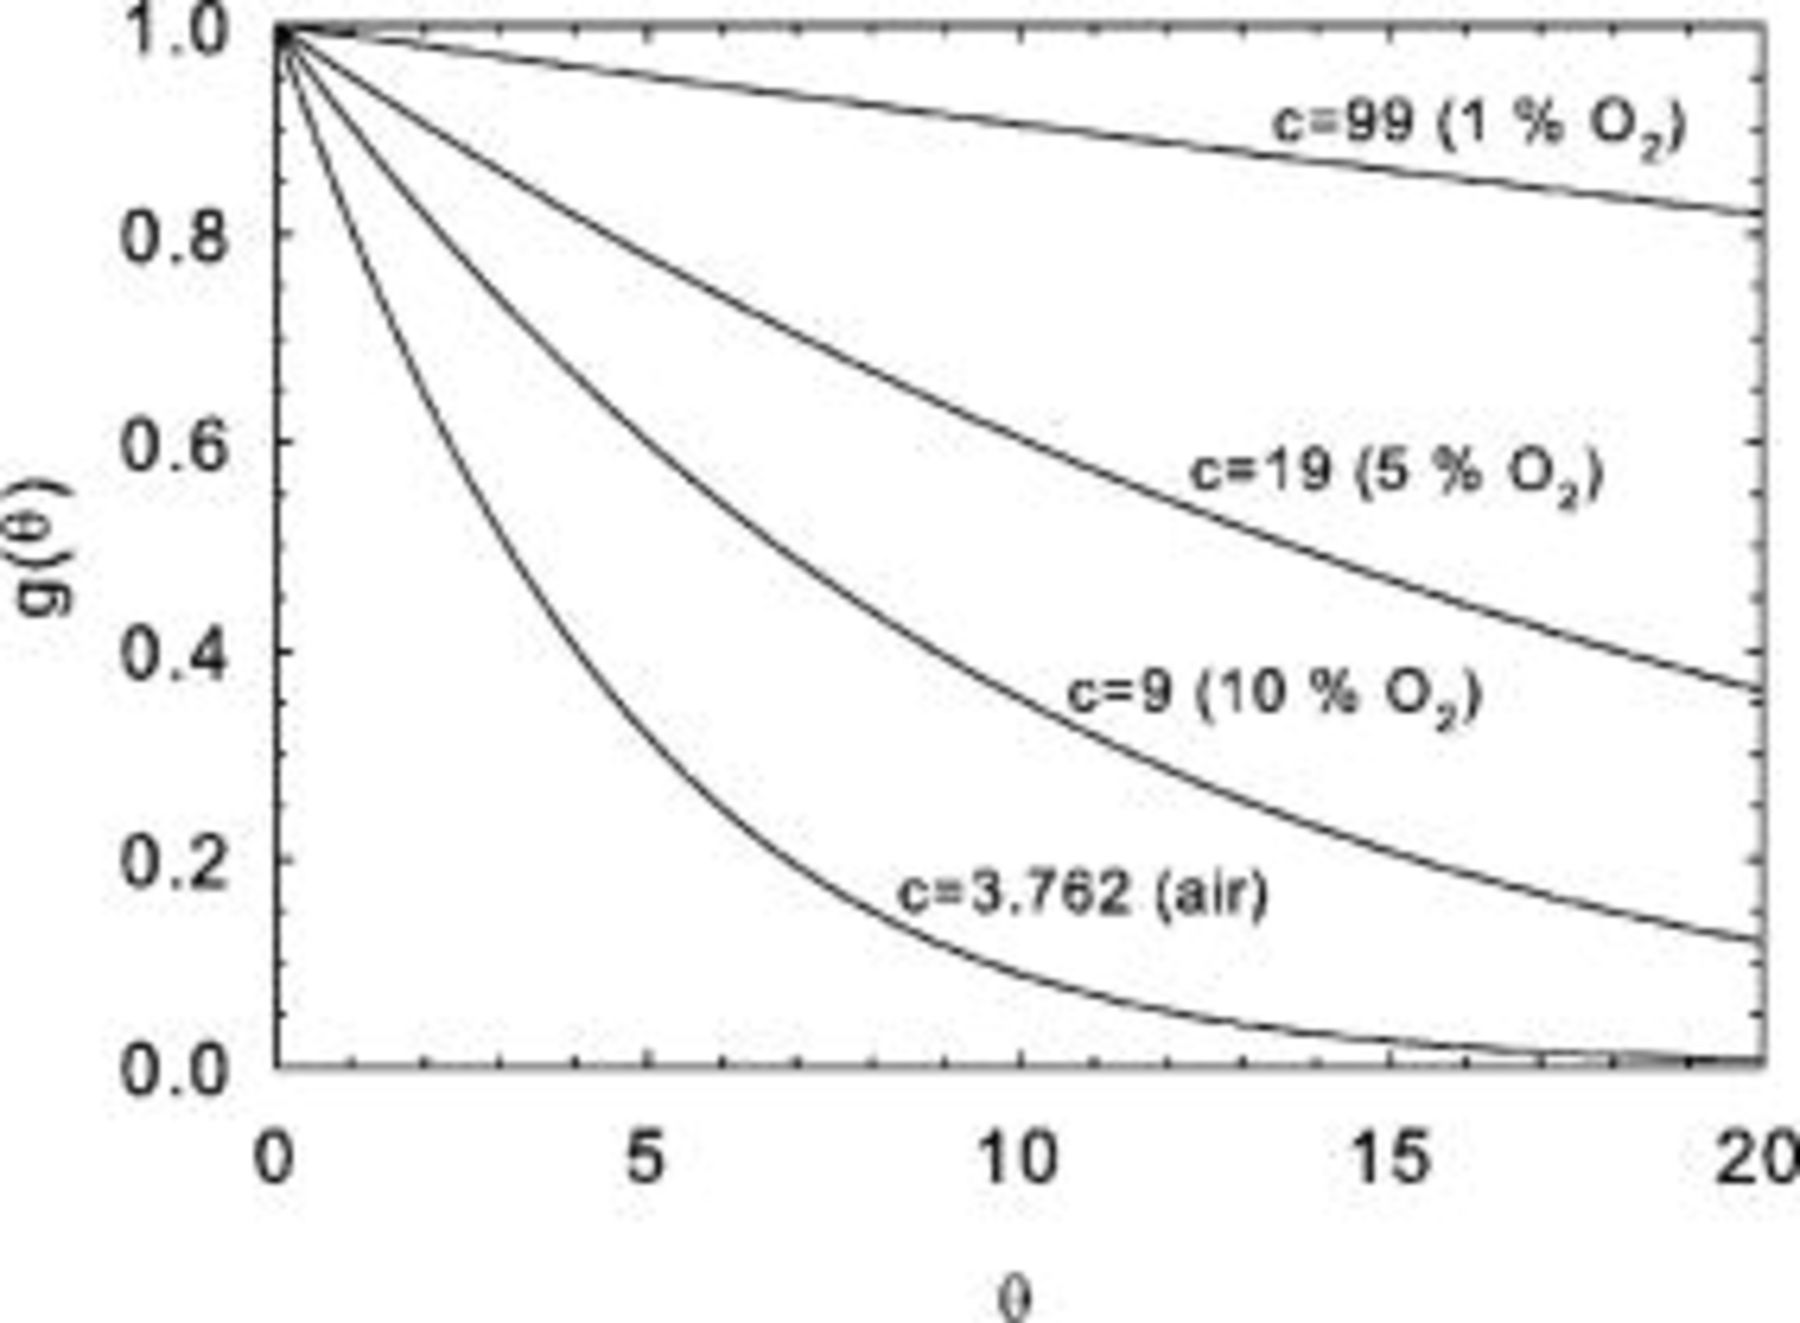
Figure 2. Universal oxygen flux function  for several values of the parameter
  .
.
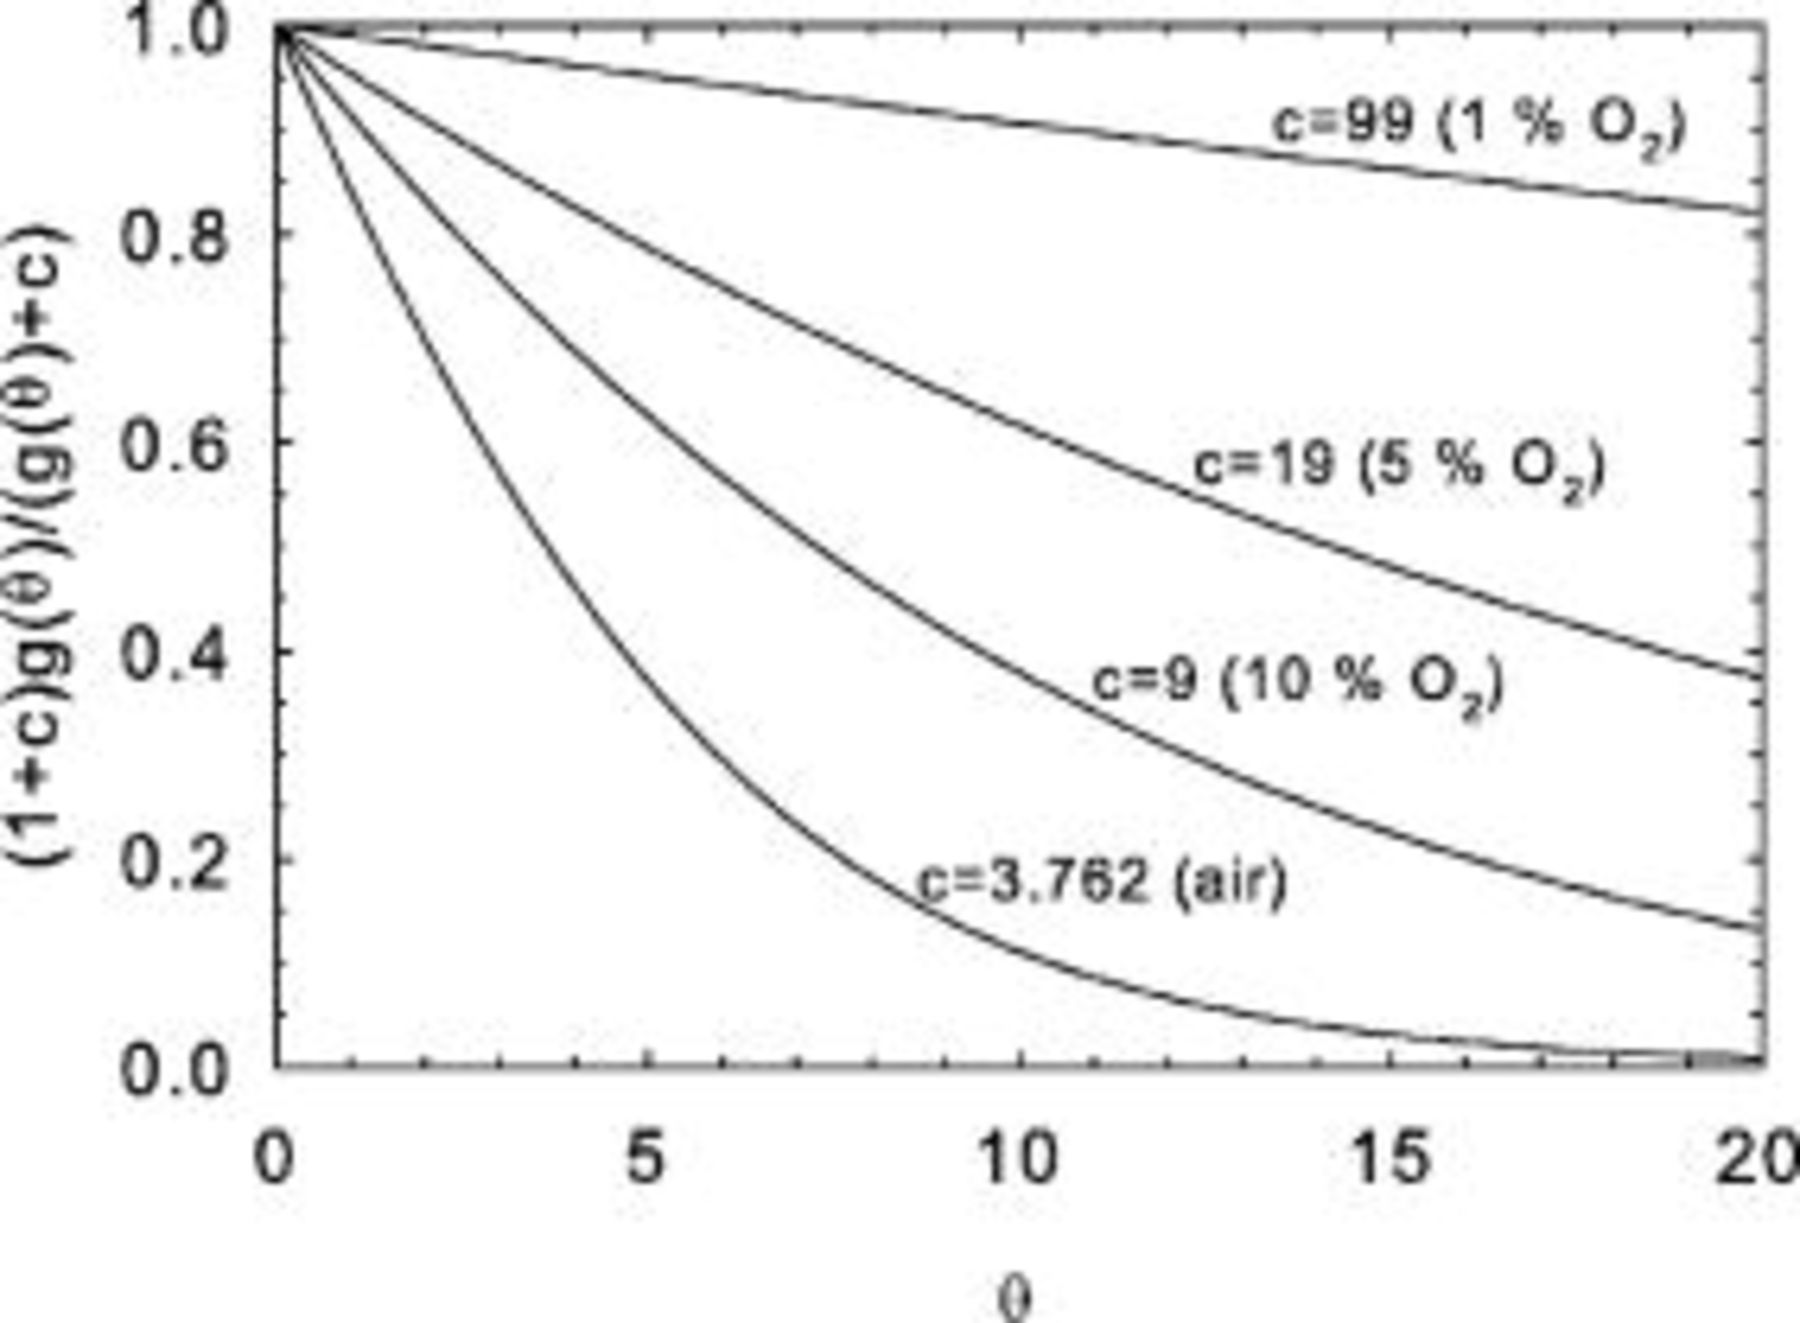
Figure 3. Universal scaled low voltage current density for several values of the parameter  .
.
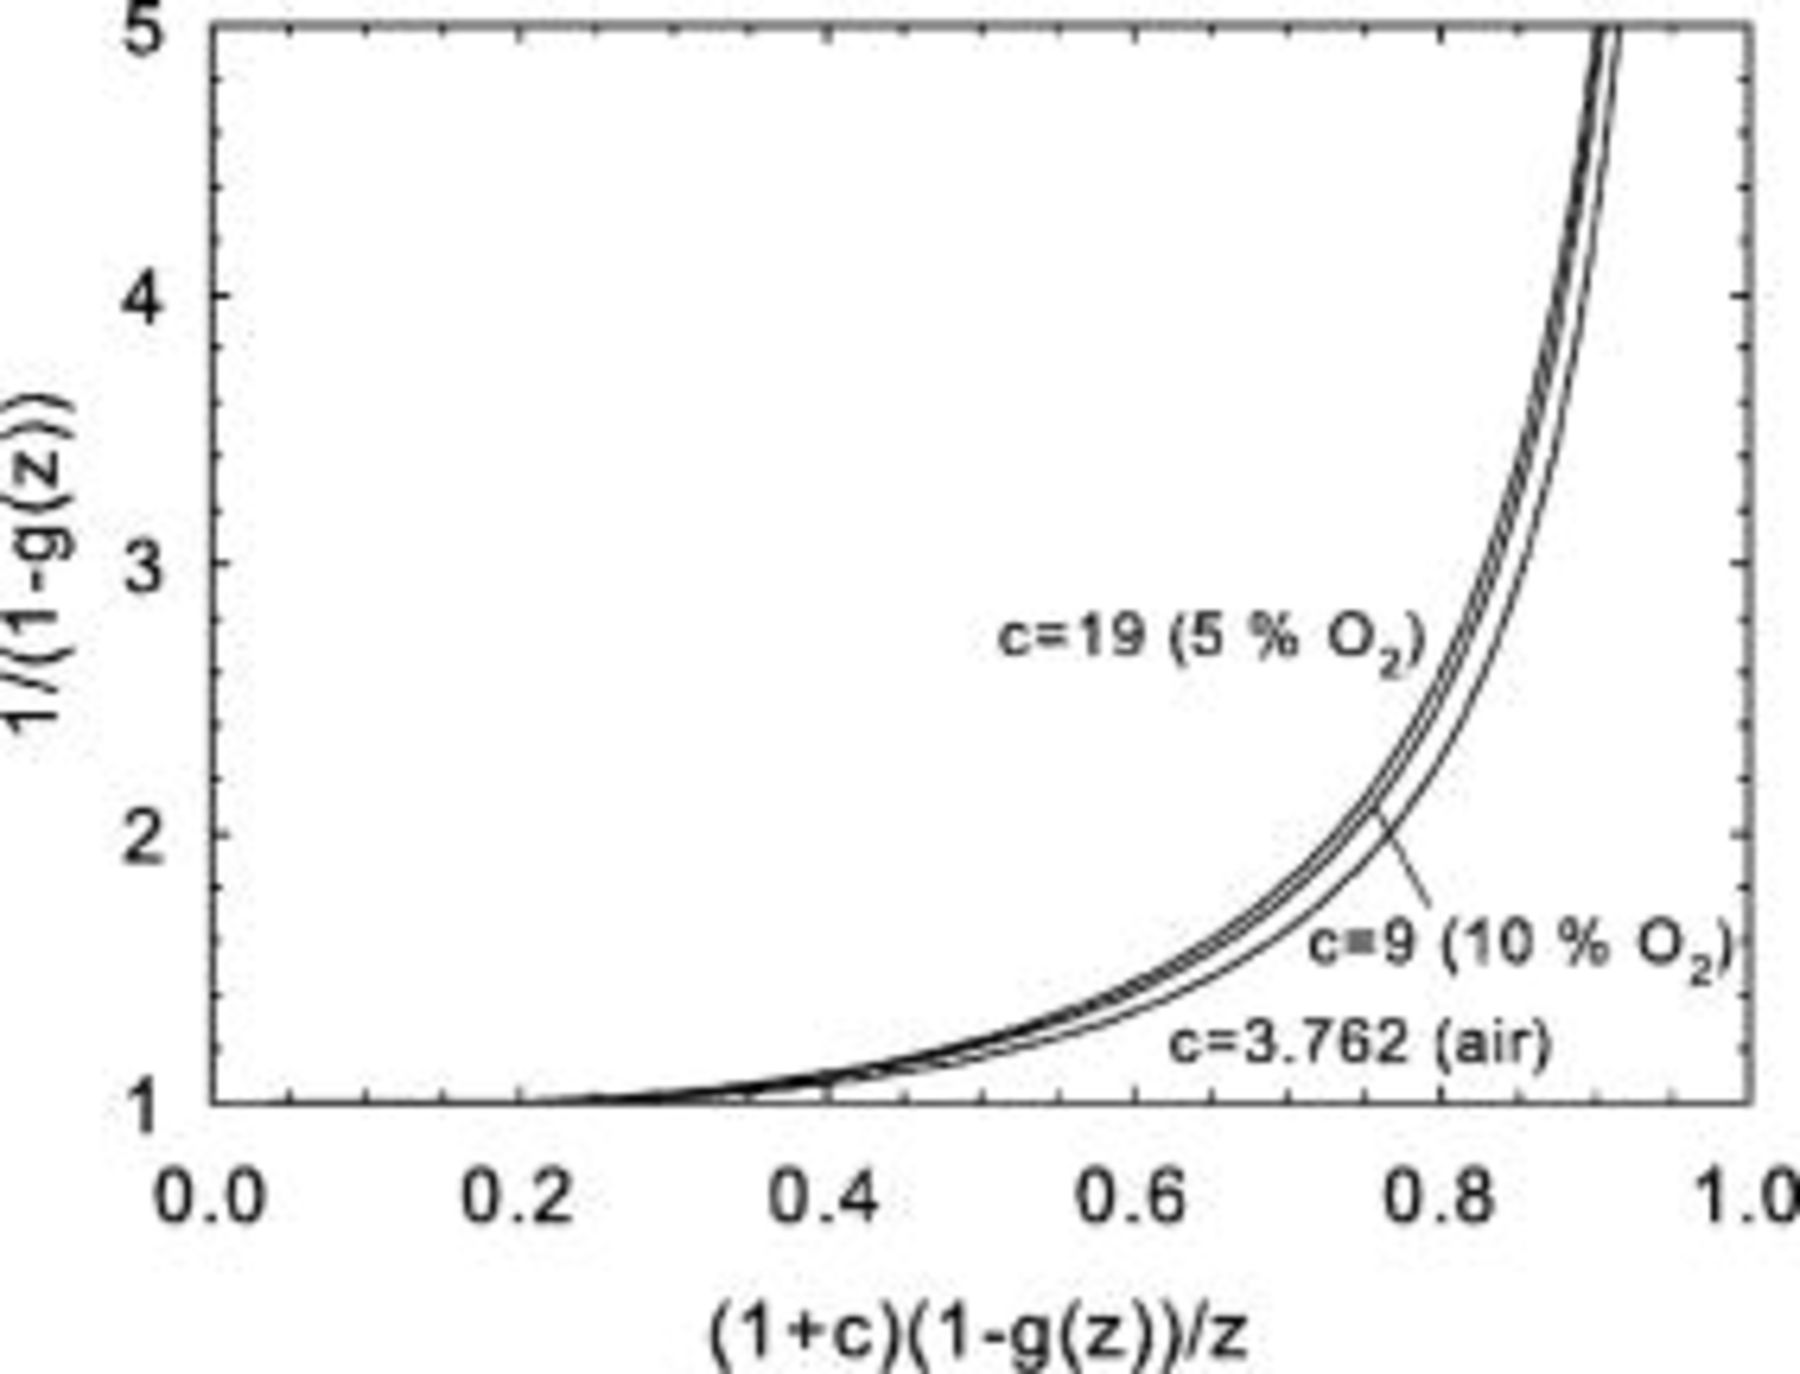
Figure 4. Minimum stoichiometry as a function of scaled average current density for several values of the parameter  .
.
Experimental
Three series of tests were completed (Table I). The first series (tests A) was completed using a small cell to ensure uniform operating conditions across the entire active surface area (negligible pressure drop, temperature rise, and reactant consumption) and potentiostatic conditions. The second series (tests B) was completed using a modified Mk902 design with segregated components along the flow-field channel direction (straight channel design) to measure the current density and cell voltage distribution.14 Galvanostatic conditions were used for the B series. The last series (tests C) was also completed with an Mk902 design able to minimize the effects of liquid product water accumulation and reactant diffusion under flow-field landings. The C series was completed using potentiostatic conditions.
Table I. Experimental conditions summary for all test series.
| Test series A | Test series B | Test series C | |
|---|---|---|---|
| Cell design | Minicell | Mk902 | Mk902 |
Active area 
| 5.7 | 289 | 294 |
| Reactants | 2.1–12.6%  (balance (balance  )/ )/
| 11.4%  (balance (balance  )/ )/
| 0.44–2.59%  (balance (balance  )/ )/
|
| Stoichiometry (oxidant/fuel) | 1.4–379/1.6–804 | 1.1–1.4/2.8–3.6 | 1.1–2.0/15.7–345.3 |
| Reactant flow rate (oxidant/fuel, standard L/min) | 0.17–0.19/0.06 | 7.1/4.2 | 5–30/12 |
| Relative humidity (oxidant/fuel, dew point in °C) | 70/70 | 70/70 | 64.5/64.4 |
| Pressure (oxidant/fuel, barg) | 2.1/2.1 | 2.7/3.1 | 2/2.1 |
| Temperature (°C) | 70 | 70 | 60 |
Current density 
| 0– for each for each  concentration concentration | 0.57–0.73 | 0– for each for each  concentration concentration |
| Temperature rise (°C) | ∼0 | <3.3 | ∼0 |

The limiting current density values were determined at  (tests A and C). The Damköhler numbers (tests A) were determined using the experimental limiting current density, inlet channel oxygen concentration, current density and voltage values, and fit parameters
  and
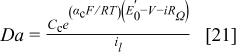
and  (see Results and Discussion section) using the following expression
Results and Discussion
Zero-dimensional unit cell voltage model
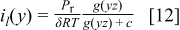
The local polarization curve, as previously described for the  -dimensional unit cell model,1 has the following form
with the limiting current density defined as  (Eq. 6). Equation 22 was modified by grouping several constants into a single parameter

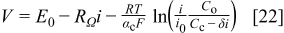
This last expression was used in its exponential form (numerically more stable) to fit the polarization data illustrated in Fig. 5 ( , tests A) using SIGMAPLOT 9.0 (Marquardt-Levenberg algorithm). The three fitted parameters, respectively, characterize kinetic
  , ohmic
  , and mass transport
  limitations. The fit is good especially at the low oxygen concentration values, where liquid water interactions are expected to be negligible (lower limiting current density and water production values). The value of the mass transfer coefficient is close but somewhat different than the value found in previous work
  .1 The difference is mostly ascribed to operating conditions changes (Table I) and absence of limiting current density data in the older work. The limiting current density values are plotted in Fig. 6 and also correspond well to the theoretical expression based on the fitted mass transfer coefficient value. Therefore, the data support the assumption that a sharp limiting current density exists at least locally.
Figure 5. Minicell polarization curves obtained for different oxygen concentrations (tests A). Symbols denote experimental data, and full lines model computations.
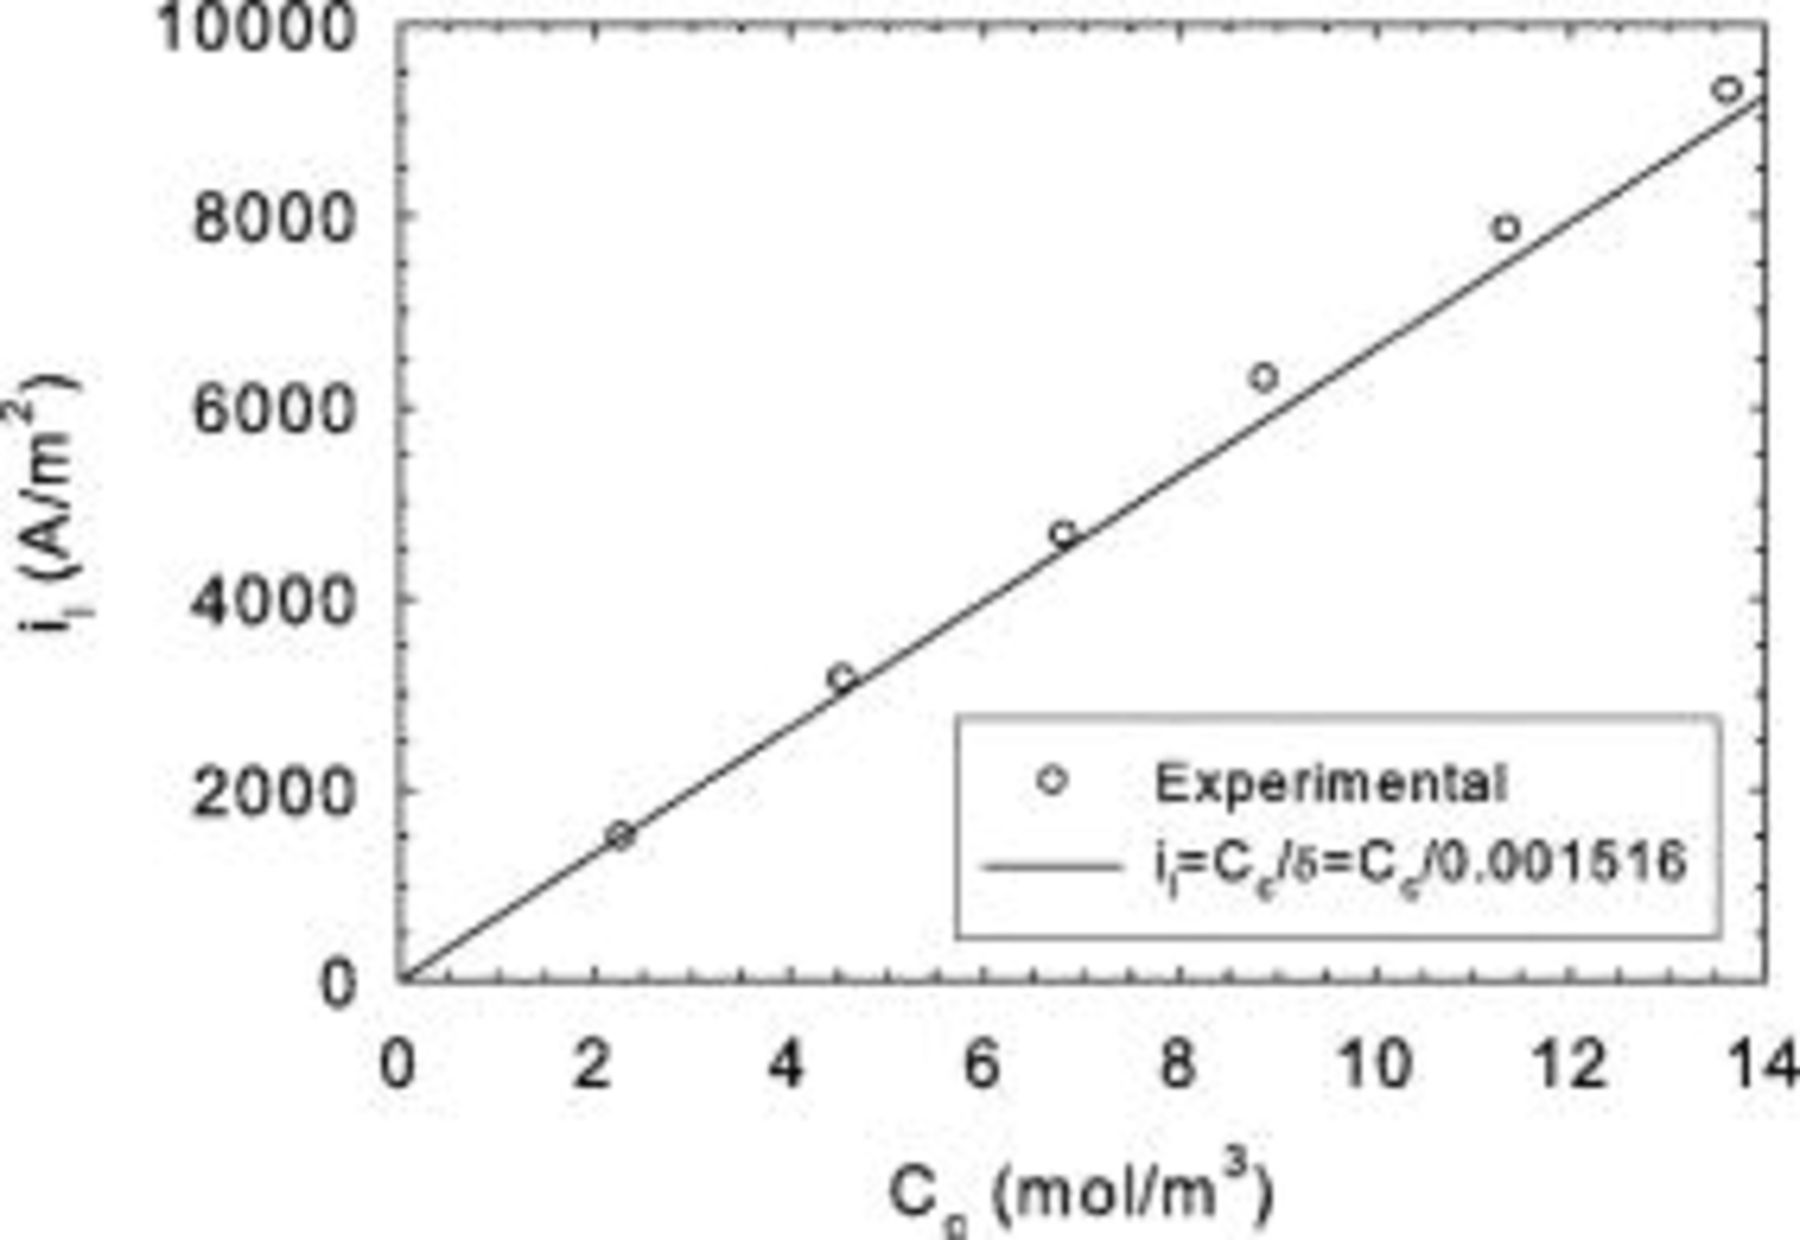
Figure 6. Minicell limiting current density as a function of oxygen concentration (tests A).
However, the good agreement between the zero-dimensional model and the experimental data is deceptive because the actual oxidant stoichiometry at the limiting current density was as low as 1.4 (Table I). This is ascribed to the implication of operation at the limiting current density. Under these limiting conditions, oxygen is locally consumed at a significant rate. Uniform conditions can only be attained if the local oxygen consumption rate is compensated by large reactant flow rates. For low oxygen concentrations, this results in increase pressure drop and nonuniform conditions further compounded by potential convection in the gas diffusion electrode. For high oxygen concentrations, the limiting current density is increased, leading to even more acute nonuniformities. These considerations are independent of both flow field and cell active area size and justify the development of a one-dimensional (channel length) low cell voltage model.
For cases where the reactant concentration can be considered constant and the current density is varied, Eq. 23 is rewritten with Eq. 6 as the equivalent form
Equation 24 represents a simple empirical expression for the cell performance with a physical explanation for the mass transport loss (existence of a limiting current). From this standpoint, Eq. 24 represents an alternative to several other similar empirical expressions, which do not necessarily have a physical meaning attached to the mass transport loss term.15–17 More recently, an attempt has been made to derive an empirical expression from fundamental principles.18 The resulting empirical expression contains four parameters for the mass transport loss term (includes the effect of liquid water) rather than one for Eq. 24.
One-dimensional unit cell low voltage model
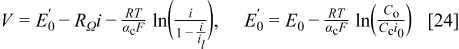
Experimental current distribution data obtained for full size cells and different current values are illustrated in Fig. 7a and 7b (tests B). A shift in the current density distribution towards the cell inlet is observed for larger current values. At the limiting current, the current density distribution no longer evolves. Agreement with the one-dimensional low voltage model (Eq. 13, 14) is poor at the limiting current (Fig. 7b) with an observed shift towards the cell outlet. The model curve was generated by first determining ν and  from experimental
  and
and  values (Eq. 15). Then, Eq. 10 is solved (Mathcad 2000 professional, secant, and Mueller methods) for
  using
using  ,
,  , and the experimental
  value (assumption that the one-dimensional unit cell low voltage model applies to the data). Equation 8 is then used to compute δ using the operating conditions and
  values. The δ values from the three current densities of Fig. 7b are averaged to compute an average
  value. Equations 13, 14 are then used to compute the ratio of the local limiting current density to the average limiting current density. This last step is performed using the average
  value,
  , from Eq. 10 (experimental
  value,
  ) and
) and  from Eq. 10 (experimental
  value, θ varying from 0 to the average
  value).
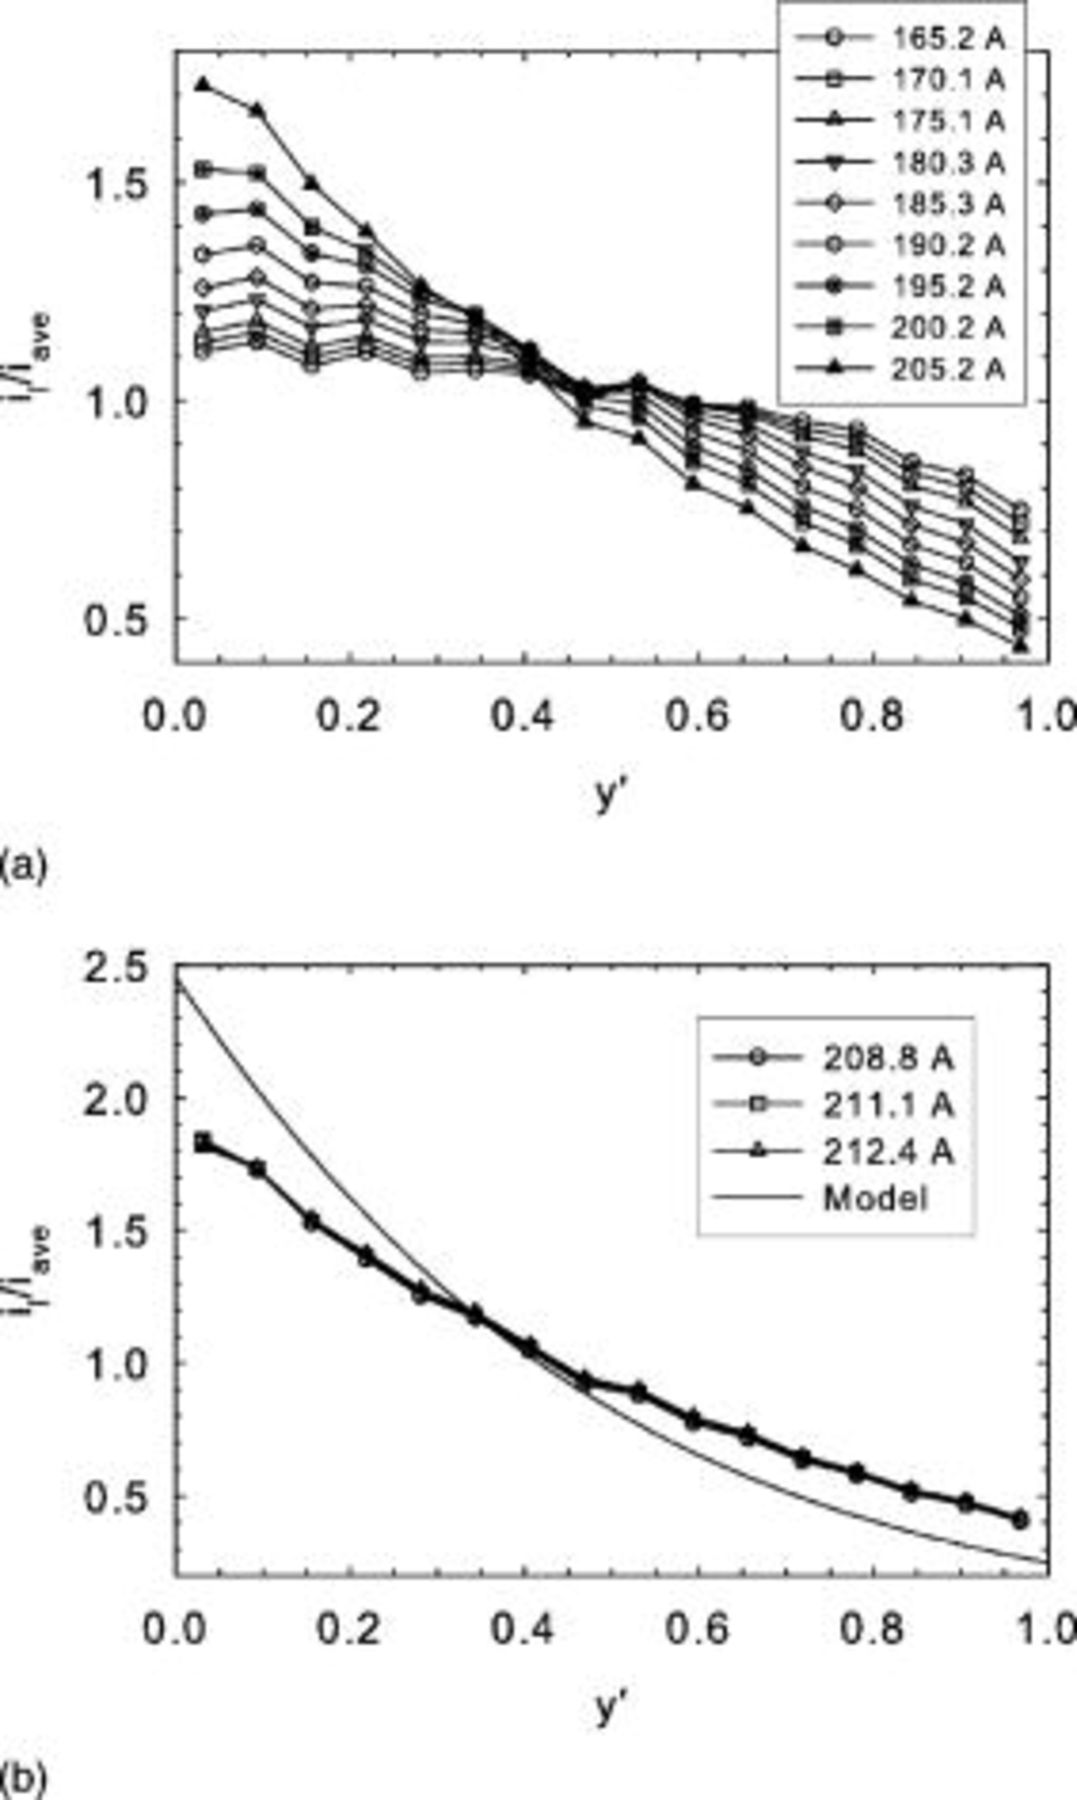
Figure 7. Mk902 current density distribution obtained for different currents (tests B). (a) Below the limiting current density, (b) at the limiting current density.
The corresponding local cell voltage values are illustrated in Fig. 8a and 8b, showing a gradual progression toward lower values at higher currents. Additionally, a larger cell voltage gradient along the cell length is developing as the current value is increased. At the limiting current, this evolution is no longer operative. The significant cell voltage gradient of  at the limiting current favors in-plane current redistribution from the cell inlet to the cell outlet. This current redistribution, as previously described,19, 20 is responsible for the significant discrepancy existing between the model predictions and experimental current density data. An in-plane current of
  is computed using Ohm's law, the observed voltage gradient of
  , the bipolar plate resistivity, and thickness, and Mk902 active area length and width.19 This in-plane current value favorably compares to the values determined from the inlet and outlet current density over average current density ratio deviations from the model curve (respectively,
  and
and  , Fig. 7b). Because the average current to each segregated element of the current distribution plate is
  (
( elements), the observed change in current for the elements at the plate extremities are 2.6 and
  (
( and
and  ).
).
Figure 8. Mk902 voltage distribution obtained for different currents (tests B). (a) Below the limiting current density, (b) at the limiting current density.
Recent air data obtained by Kulikovsky et al. under potentiostatic conditions avoid the concern of current redistribution.21 For this case, the model predictions (Eq. 12) are in good agreement with the experimental data (Fig. 9), resulting in a mass transfer coefficient of  (
( standard deviation). This value is of the same order as values reported in the previous section. Differences can be explained in terms of operating conditions and membrane-electrode assembly construction. The model curves were generated using the same procedure as for Fig. 7b except that individual
  values and Eq. 12 are used for the different currents.

Figure 9. Current density distribution obtained for different currents. Air/ , 1.01–2.07/excess stoichiometry (0.40–
 ), 30°C, ambient pressure, well-humidified reactants,
  (Ref. 21).
Limiting current density data were also obtained under potentiostatic conditions using low oxidant concentrations (Fig. 10, tests C). Each curve follows the expected dependency on reactant concentration. However, as the reactant flow rate increases, a concurrent increase in the limiting current density is also observed. Also, the rate of current density increase decreases for larger reactant flow rates. These observations are consistent with nonuniform reactant distribution along the channel length. For very large reactant flow rates, the limiting current density is no longer expected to change, as reactant consumption would be insignificant in comparison to the reactant supply provided to the cell. Figure 10 data were replotted according to Eq. 20 (Fig. 11) using experimental  , ν, and
  values. A plot of
  vs
vs  has a slope equivalent to
  using Eq. 16, 20. Again, a good correlation was obtained from linear regression
  , with a single value for the mass transfer coefficient
  lower than the value derived from Fig. 5 (tests A). The main reason for the discrepancy relates to the higher concentration used to compute the limiting current density
  because the channel effect decrease was not taken into account in Eq. 23. For a stoichiometry of 1.4, the average dimensionless reactant concentration along the channel length is
  . If the tests A mass transfer coefficient is corrected by this average dimensionless reactant concentration, a value of
  is found, resulting in a closer agreement with the tests C result. The remaining difference may relate to the higher temperature used for tests A (Table I) indicating the predominant effect of increased oxygen diffusivity on the mass transfer coefficient.
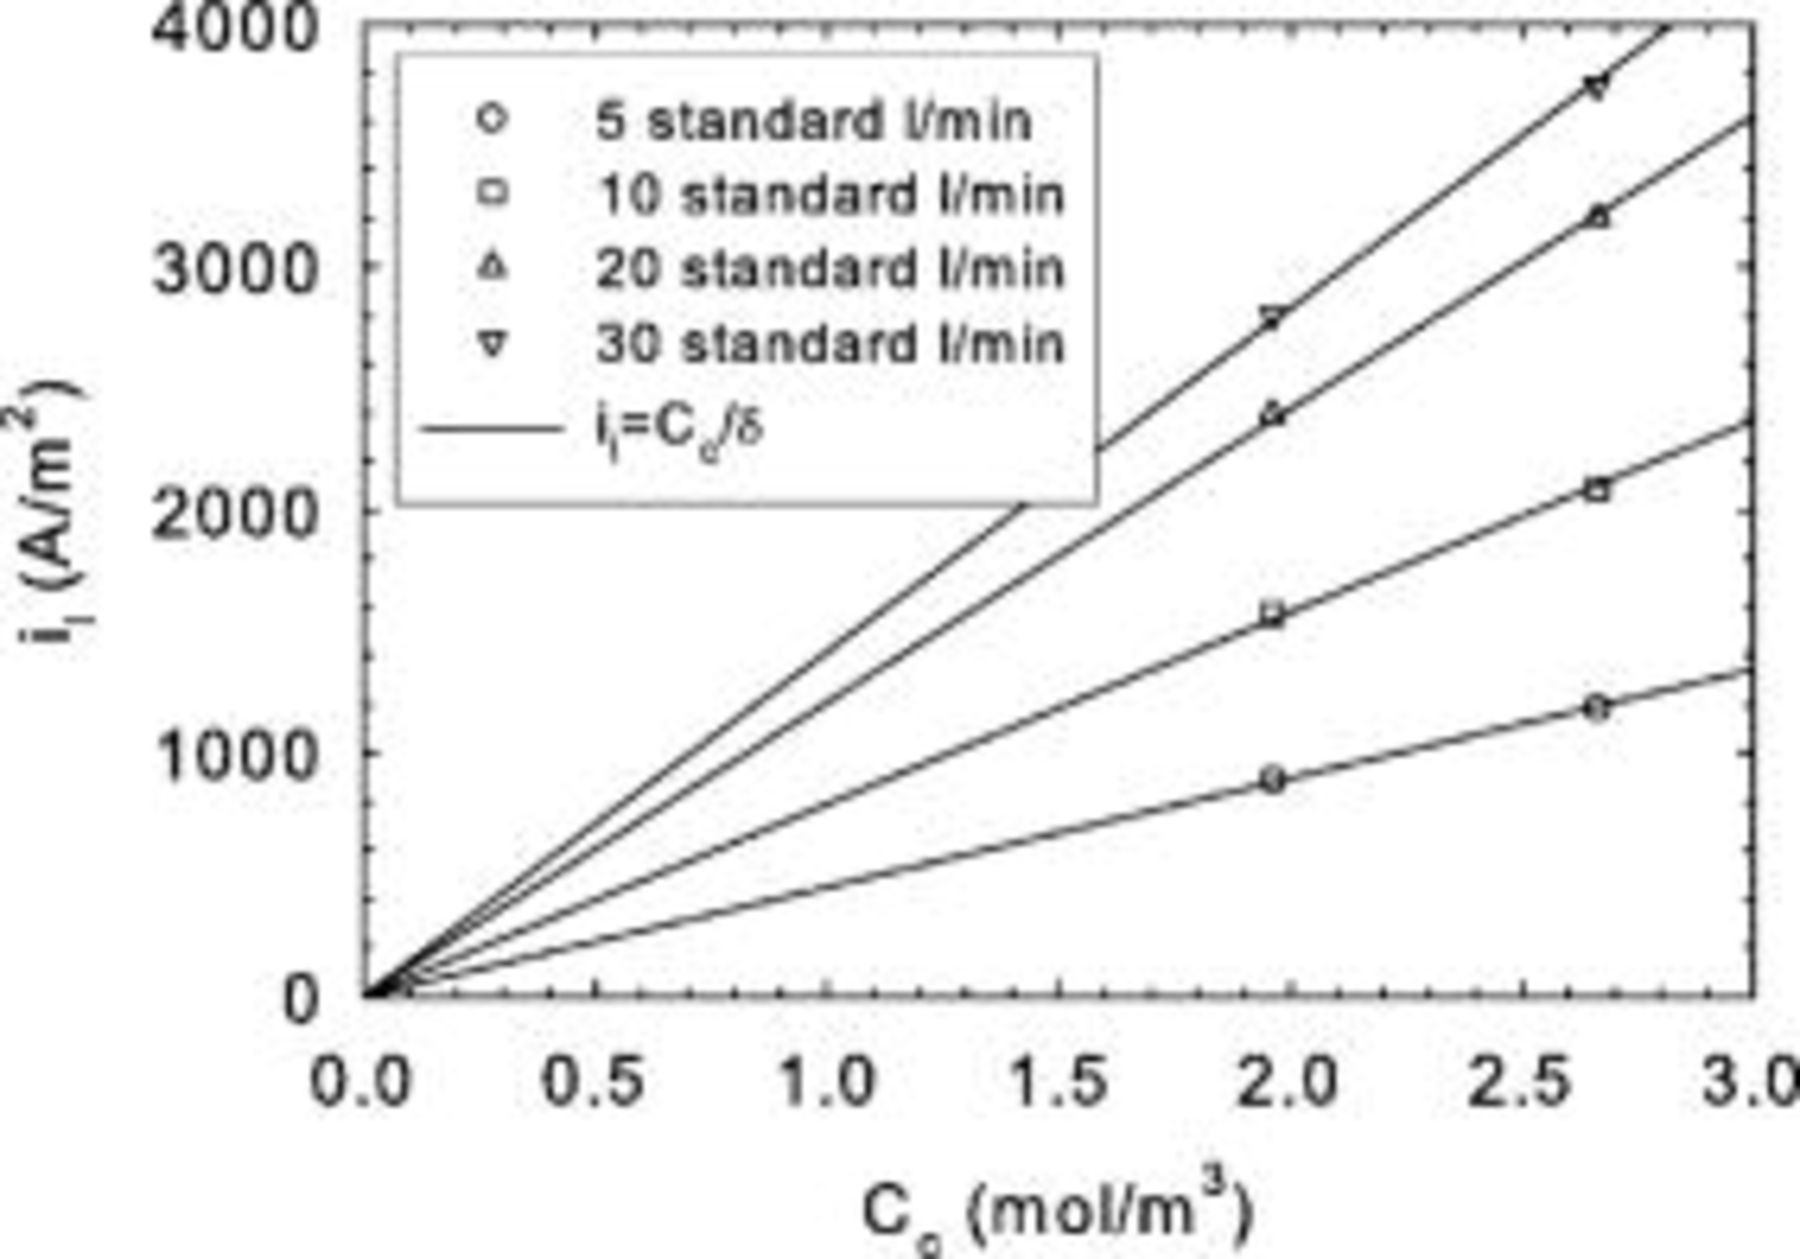
Figure 10. Mk902 limiting current density as a function of oxygen concentration for different oxidant flow rates (tests C).
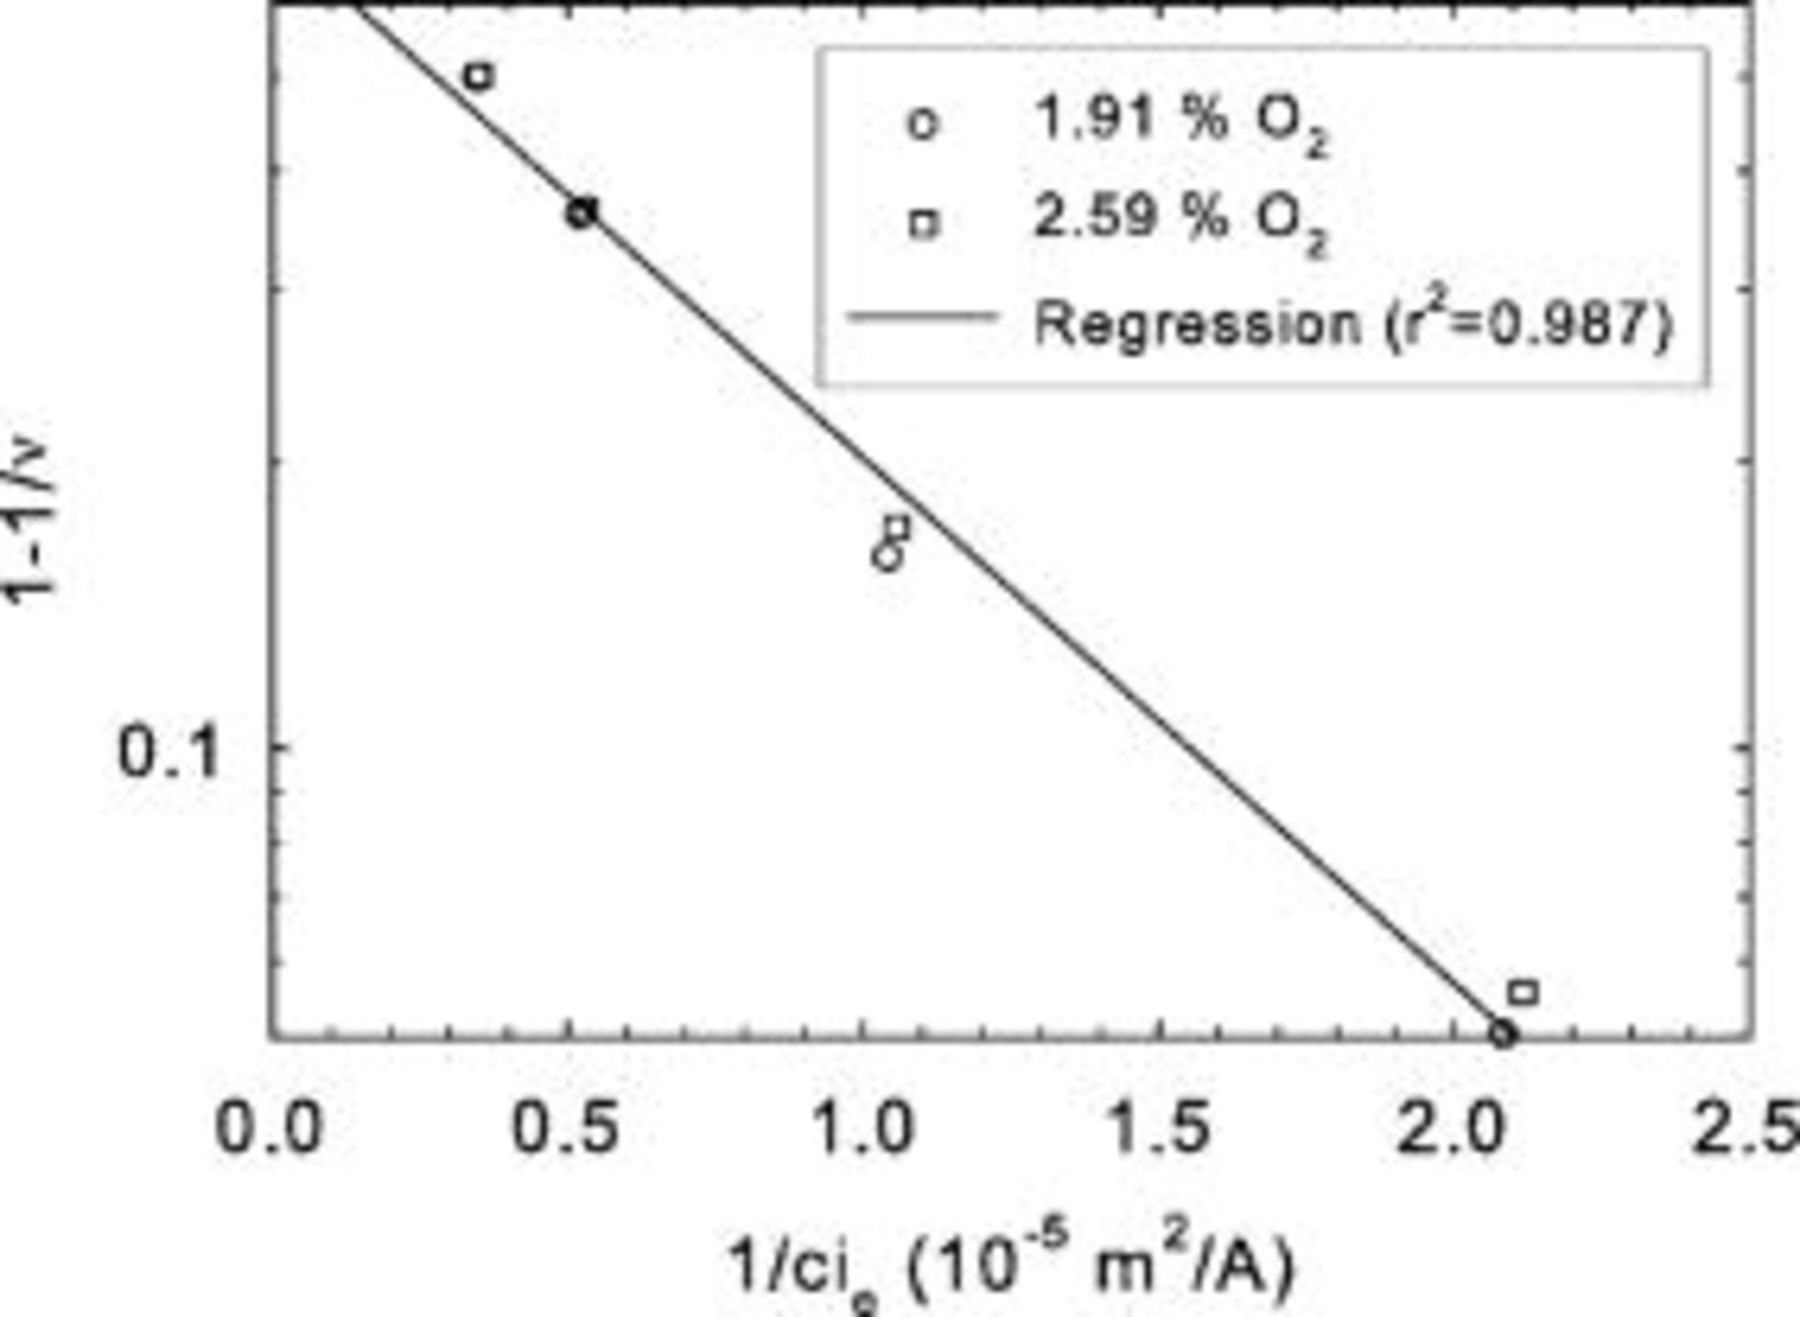
Figure 11. Comparison between a theoretical description of limiting current density behavior (Eq. 19) and Mk902 experimental data for different oxygen concentrations (tests C).
Model applicability criteria
In the previous sections, several references were made to properly select operating conditions to achieve limiting current conditions which can be easily interpreted and which are free of interactions from other sources. In this regard, cathode kinetics should be controlling. This is achieved by minimizing anode kinetics by the use of high fuel stoichiometries and minimizing membrane losses by the use of saturated reactant gases (Table I). Cell design is also important to ensure uniform conditions (other than the oxygen concentration) along the channel length. Reactant pressure drop is minimized using adequate flow-field designs. Temperature rise is controlled using either small active areas or high coolant flow rates. As for the effect of liquid water, its impact is reduced by using low oxidant concentrations leading to relatively smaller water production rates.
Some of these considerations are well illustrated considering some of the data of Williams et al. (their Table 2).22 The mass transfer coefficients for the dual-layer in-house gas diffusion layer are illustrated in Fig. 12. These were generated using the reported reactant utilization to compute ν and  (Eq. 15). Then, Eq. 10 is solved for
  using
using  ,
,  , and the experimental
  value. Equation 8 is then used to compute δ using the operating conditions (temperature, pressure, average relative humidity) and
  values. The most important conclusion relates to the mass transfer coefficient, which is not constant and contrasts with the present model assumption. The effect of the different operating conditions (reactant concentration, flow rate and relative humidity, cell temperature) provides the necessary clues to formulate a reasonable assumption for this behavior. Nonuniformities were introduced with the use of a subsaturated reactant gas, affecting oxygen mass transport in the ionomer. Oxygen permeability through Nafion and recast Nafion increases with temperature and relative humidity.23 The oxygen mass transfer coefficient decreases with reactant flow rate (Fig. 12) due to the drying effect of the subsaturated reactant (average relative humidity within the cell decreases) negatively affecting ionomer permeability. This also explains the smaller mass transfer coefficient values for the 4% oxygen reactant (in comparison to air). Because the flow rate was the same for both reactants and the limiting current was lower for the 4% oxygen case (less water production within the cell), the ionomer is relatively drier. For the combined effect of increased temperature and decreased relative humidity, the trend is not so clear and indicates the conflicting effects of ionomer dryness and increased permeability. These trends were also observed for the other gas diffusion layers. Figure 13 illustrates the comparison between the experimental data for the dual-layer in-house gas diffusion layer and model predictions. The experimental data were generated using the reported limiting current density
  and reactant utilization (to compute ν). The model curves were generated using the computed δ values (as indicated at the beginning of this paragraph). Three δ values were selected (average, those corresponding to the minimum and maximum reactant flow rate). The corresponding equivalent current density range was then computed from the measured limiting current densities and reactant utilizations. This range in turn defines a
  range using Eq. 8 and appropriate operating conditions corresponding to the selected δ values. Equation 10 is then solved using experimental
  values to compute
  ,
,  , and
, and  . Figure 13 shows that the model does not fit the experimental data as already discussed due to the nonuniform operating conditions leading to variations in δ values. Operating conditions which would lead to the absence of liquid water cannot be used to further analyze this situation because they may lead to a transient or pseudo-steady-state behavior and cell failure (if both outlet reactant streams are less than saturated).24
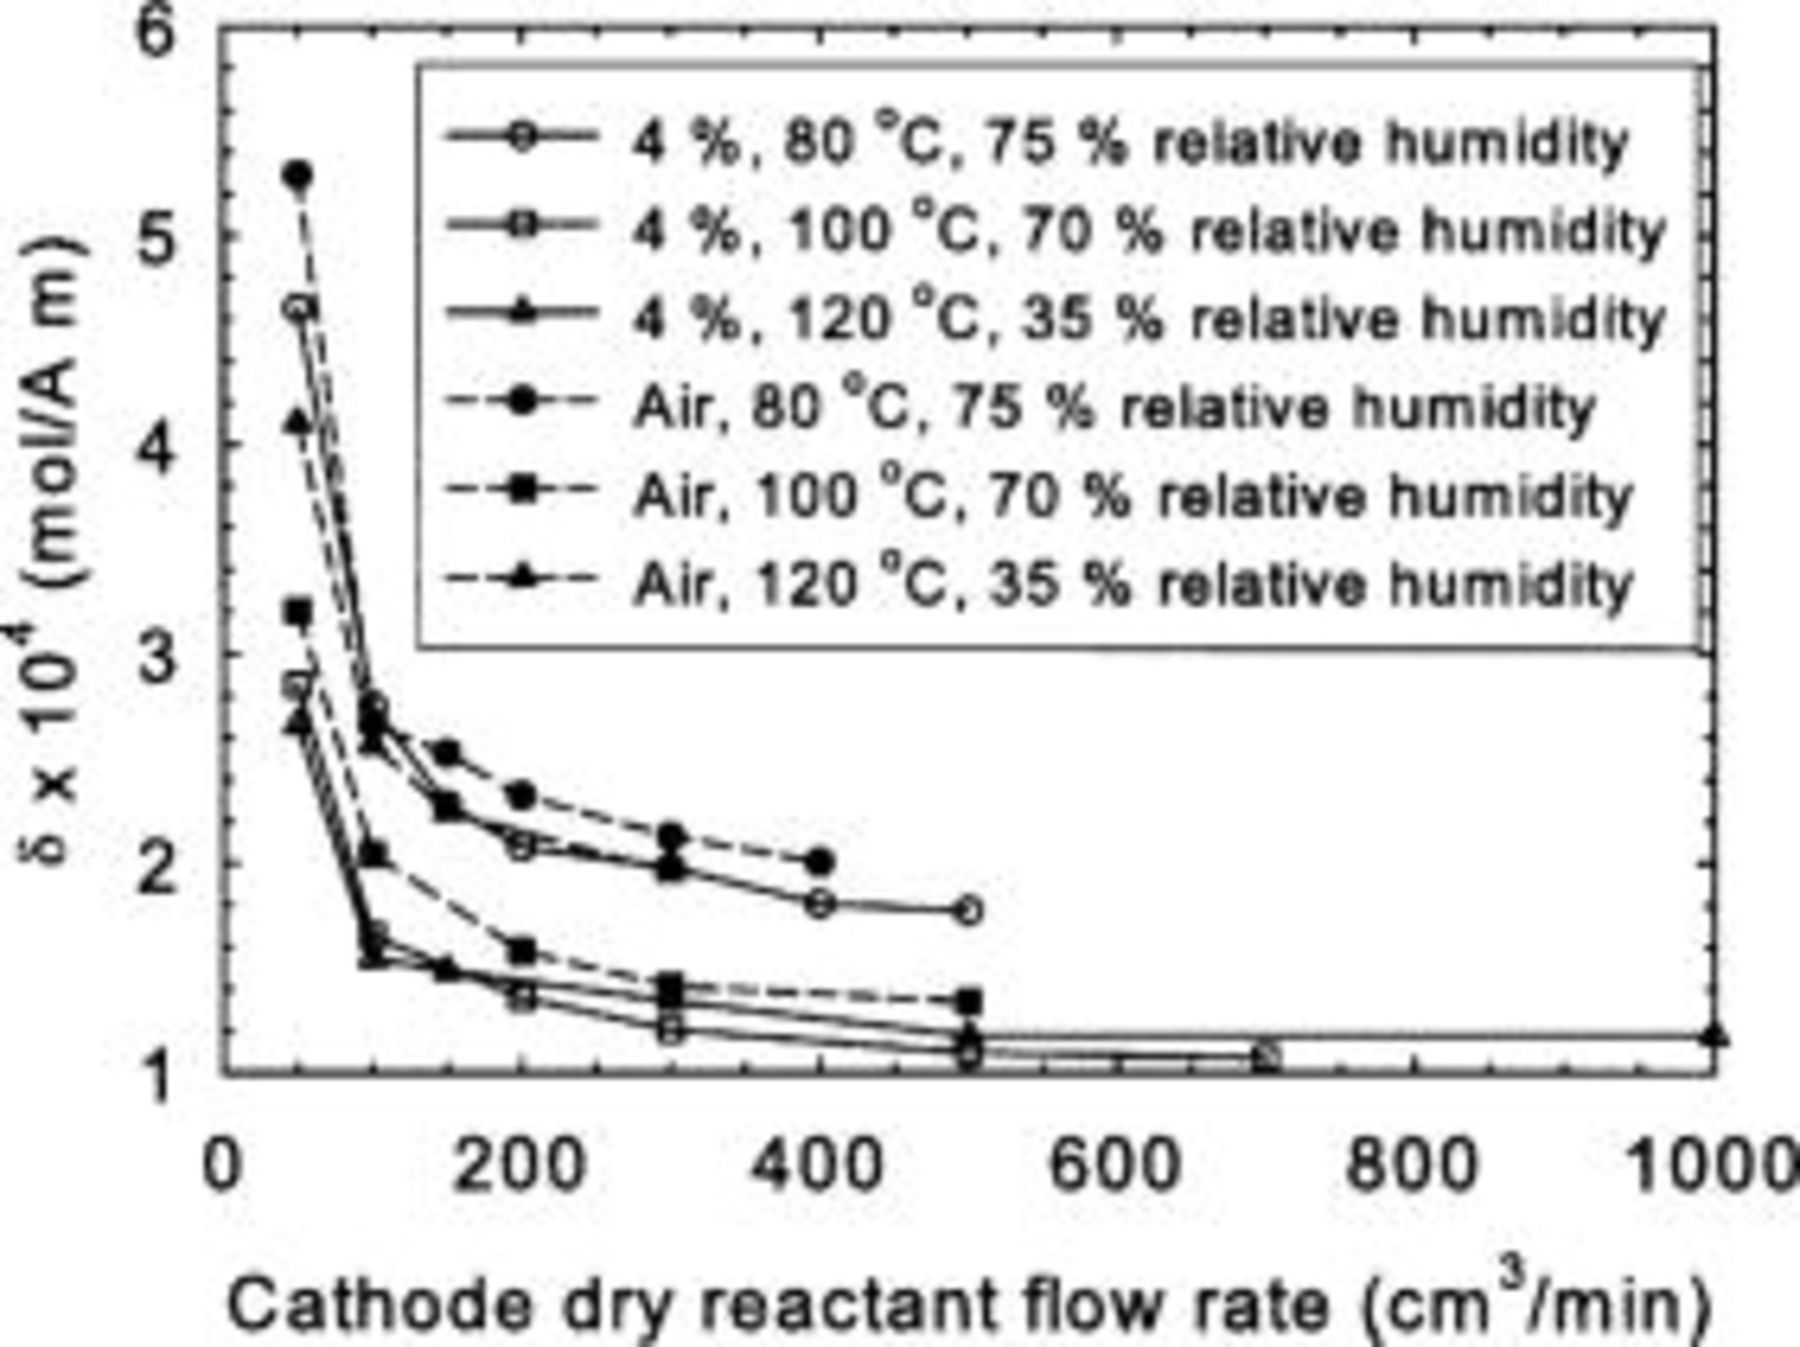
Figure 12. Oxygen mass transfer coefficients as a function of cathode dry reactant flow rate, reactant composition, temperature, and relative humidity. Dual-layer in-house gas diffusion layer, 4%  /96%
/96%  -Air/
-Air/ , 1.19–7.69/2.7 stoichiometry, 80–120°C, 1.016–1.183/-bar, 35–75/35–100% inlet relative humidity (Ref. 22).
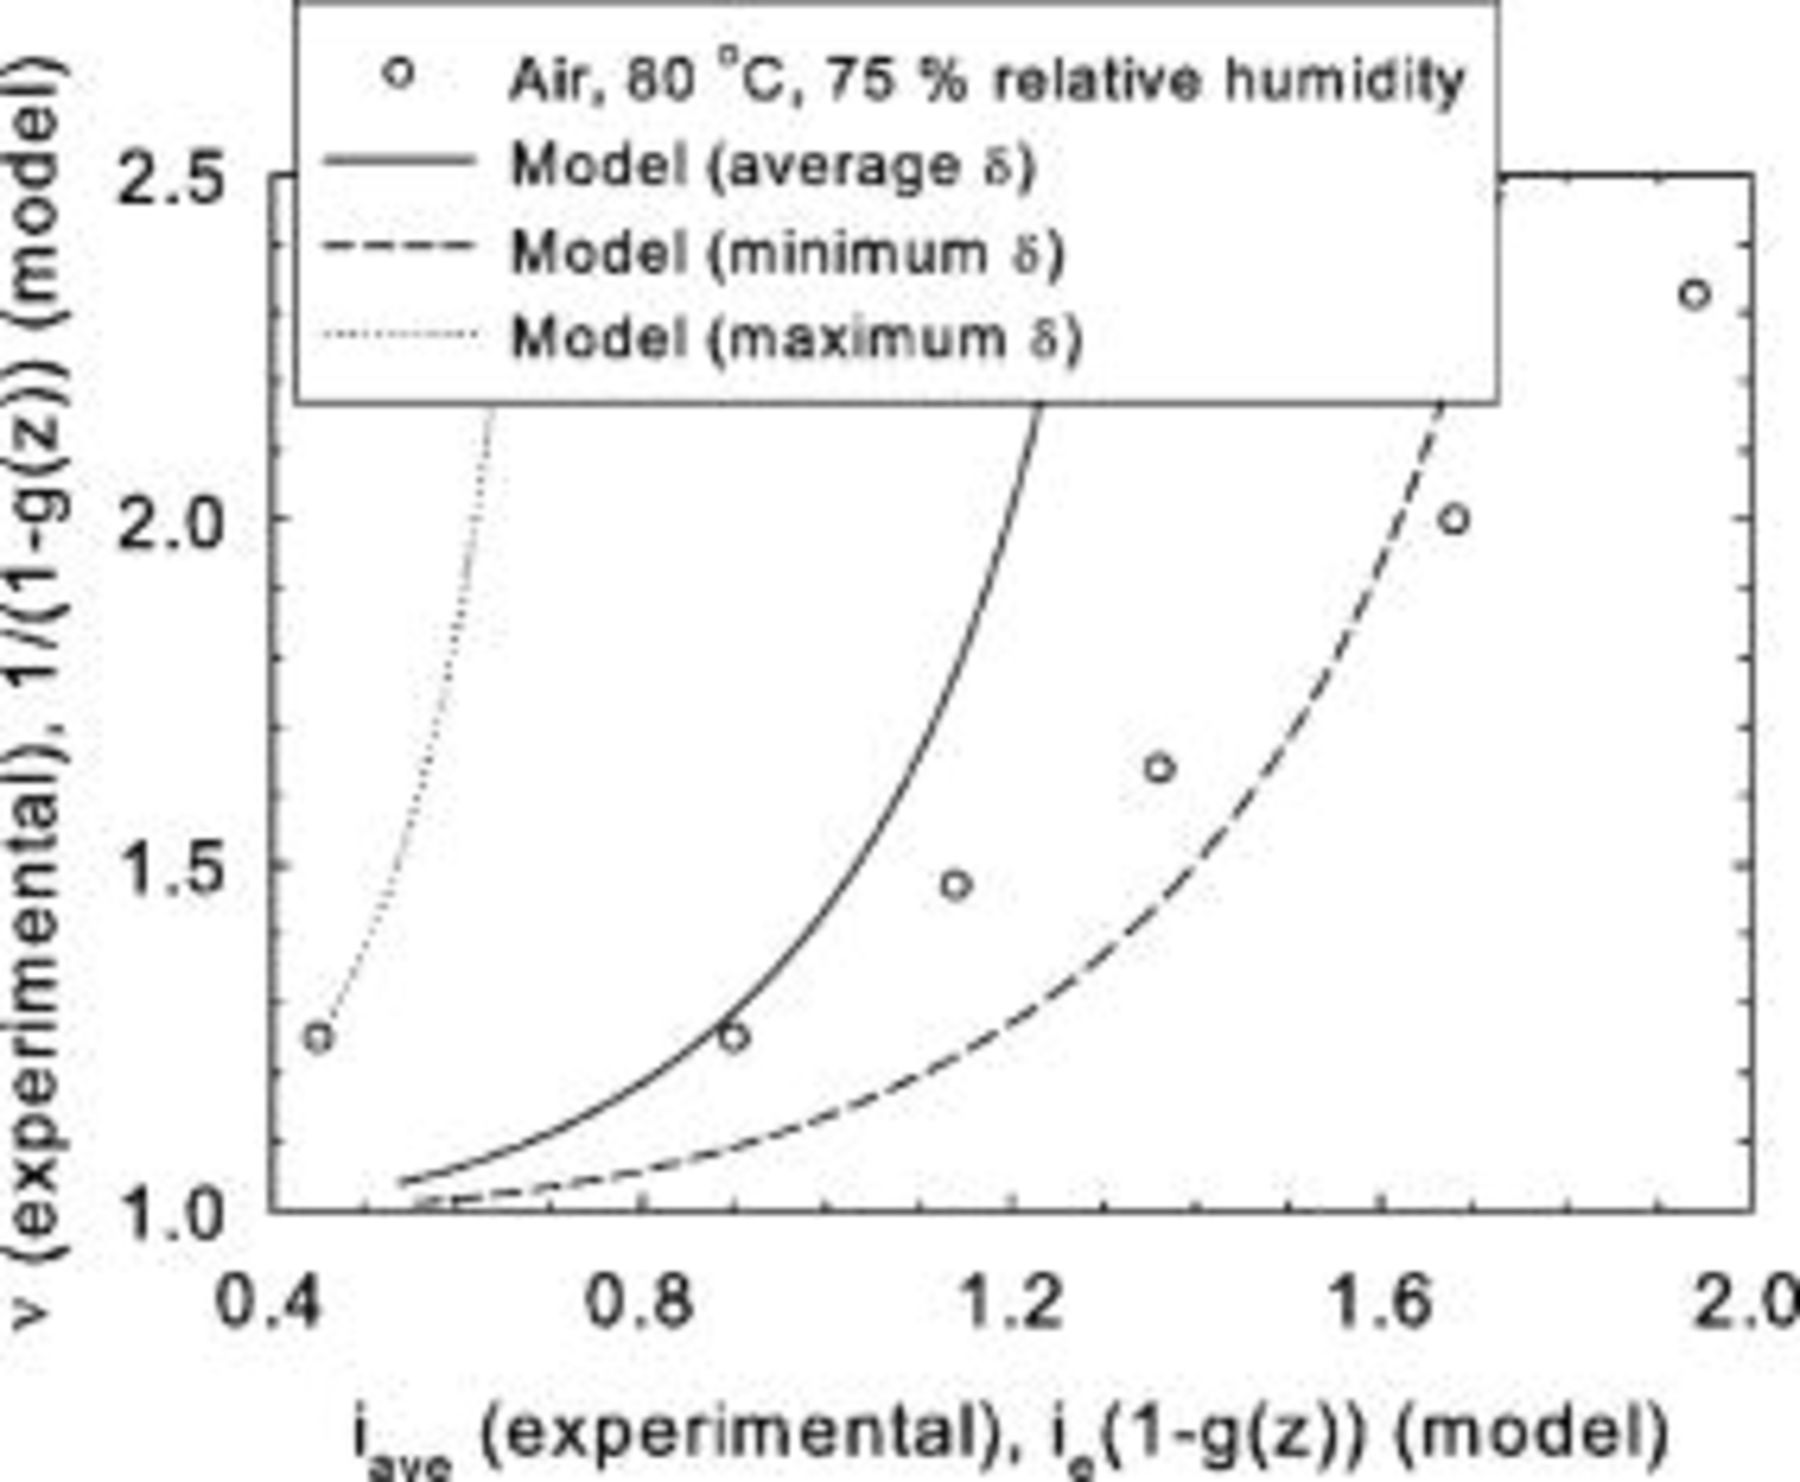
Figure 13. Comparison between a theoretical description of limiting current density behavior and experimental data. Dual-layer in-house gas diffusion layer, Air/ , 1.25–2.70/2.7 stoichiometry, 80°C, 1.016–1.071/- bar, 75/100% inlet relative humidity (Ref. 22).
Oxygen mass transfer limitations in the gas diffusion layer under the flow-field channel landings (serpentine channel design) were modeled, leading to analytical solutions for the local oxygen concentration.25 The results were extended to the entire channel length by assuming a linear oxygen concentration profile. In view of Eq. 13, 18, valid for straight channel designs, this assumption may be viewed as inappropriate, thus defining a need to measure the limiting current density distribution for serpentine channel designs. Additionally, polarization curves do not include data in the limiting current density regime, precluding further validation of the present model.
The final requirement to ensure reliable limiting current values is a sufficiently low cell voltage. The analysis is simplified by using the inlet cell voltage, which represents the largest observed value in either galvanostatic (Fig. 8a and 8b) or potentiostatic experiments. This precaution ensures that the requirement will be met at all locations along the cell. Three methods were investigated to quantify the required potential. The first method uses the zero-dimensional cell voltage model (Eq. 23) without mass transport losses evaluated at the limiting current

The second method also uses the zero-dimensional cell voltage model but evaluated at a predetermined fraction of the limiting current 

The third method relies on the Damköhler number definition (surface reaction rate/mass transport rate)
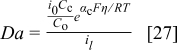
The cathode overpotential η corresponds to  (Eq. 22) and with the
  definition (Eq. 23), Eq. 27 reduces to Eq. 21. Additionally, η corresponds to the last term on the right of Eq. 22. If this term is replaced in Eq. 27, the resulting expression is
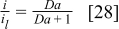
Figure 14 illustrates the tests B data fitted to the zero-dimensional cell voltage model. The same procedure was used as for Fig. 5 except that  was assumed to achieve a better fit because cell voltage data were not available at low current densities. Figure 7a and 8a show that, for inlet cell voltages between
  and
and  , the current distribution changes. However, Fig. 7b and 8b show that the current distribution no longer changes below a cell voltage of
  . Figure 14 illustrates that method 1, which leads to a critical voltage of
  , is not appropriate. Method 2, which leads to cell voltages of 0.515 and
  for respective values of
  equal to 0.999 and 0.9999, is appropriate to define the critical voltage.
Figure 14. Comparison between two critical cell potential estimates (Eq. 24, 25) and experimental fitted data (tests B).
The polarization data of Fig. 5 were replotted in Fig. 15 using the Damköhler number to further emphasize the limiting current behavior and its adequate representation by a different theoretical framework. A good correlation is obtained between the experimental data and Eq. 28, demonstrating the potential of using  values to define the critical voltage. If the previously identified values of
  are substituted for
  in Eq. 28,
  values between 999 and 9999 are required to achieve the critical voltage. As expected, based on the physical meaning of the
  number, the 999 to 9999 range is larger than the usually accepted value of
  required for mass transport control. The critical cell voltage value determined here,
  –
– , is still relatively large in comparison to minimum practical cell operating voltages of
  –
– . This is fortunate because in practice load banks do not operate below a certain voltage (typically
  ).
).

Figure 15. Comparison between a theoretical description of the dimensionless current density based on  numbers (Eq. 27) and minicell dimensionless current density data (tests A).
Conclusion
Significant evidence was provided for the existence of a local limiting current density during operation of proton exchange membrane fuel cells at low cell voltages. Thus, the previous description of the oxygen mass transfer within the gas diffusion electrode using a linearized Fick's first law is appropriate.1 The description also provides for a simple parametric relation describing the cell voltage (Eq. 24) containing all losses of interest (kinetic, ohmic, mass transport). Additionally, a method to measure the overall mass transfer coefficient using low oxidant concentrations (Eq. 20) was presented, with particular attention given to the operating conditions necessary to ensure model applicability (use of uniform operating conditions, sufficiently low cell voltage). The resulting overall mass transfer coefficient is a design parameter that can be useful to select gas diffusion electrode structures for higher current density operation. Additional work is required to separate the overall oxygen mass transfer coefficient into its respective components (gas phase diffusion within the gas diffusion electrode pores, solid phase diffusion within the ionomer covering the catalyst particles) and quantitatively assess the role of liquid water.
List of Symbols

| ratio of nitrogen to oxygen fraction in the dry inlet oxidant |

| oxygen concentration in the dry inlet oxidant, mol/
|

| reference oxygen concentration, mol/
|

| oxygen concentration at the catalyst site, mol/
|

| Damköhler number |

| effective oxygen diffusivity in the gas diffusion electrode, 
|

| cell voltage parameter, V, Eq. 22 |

| cell voltage parameter, V, Eq. 23, 24, 25, 26 |

| limiting current density fraction |

| fraction of nitrogen in the dry inlet oxidant |

| fraction of oxygen in the dry inlet oxidant |

| faraday constant, 
|

| universal oxygen flux function |

| exponential form of the universal oxygen flux function |

| current density, A/
|

| average current density, A/
|

| equivalent average current density, A/
|

| limiting current density, A/
|

| oxygen reduction exchange current density, A/
|

| maximum local current density, A/
|

| channel length, m |

| gas diffusion electrode thickness, m |

| inlet oxidant pressure, Pa |

| dry inlet oxidant pressure, Pa |

| water vapor saturation pressure, Pa |

| oxygen flux per unit cell width, mol/
|

| dimensionless oxygen flux |

| nitrogen flux per unit cell width, mol/
|

| ideal gas constant, 
|

| cell resistance, 
|

| temperature, K |

| cell voltage, V |

| reactant conversion |

| channel length coordinate, m |

| dimensionless channel length coordinate |

| dimensionless constant (Eq. 8) |

| oxygen reduction charge transfer factor |
| δ | oxygen mass transfer coefficient, mol/
|
| η | cathode overpotential, V |
| ν | oxygen stoichiometry |
| θ | dimensionless channel length |
Acknowledgments
The authors acknowledge the financial contributions of NSERC, NSF, MITACS NCE, and Ballard Power Systems Incorporated. The authors are also indebted to J. Stumper, M. Löhr, and S. Hamada for the measurements related to Fig. 7 and 8, and C. Startek and V. Branzea for the measurements related to Fig. 10 and 11.
Ballard Power Systems assisted in meeting the publication costs of this article.