
Abstract
We demonstrate a microfluidic fuel cell incorporating hydrogen peroxide oxidant. Hydrogen peroxide  is available at high concentrations, is highly soluble and exhibits a high standard reduction potential. It also enables fuel cell operation where natural convection of air is limited or anaerobic conditions prevail, as in submersible and space applications. As fuel cell performance critically depends on both electrode and channel architecture, several different prototype cells are developed and results are compared. High-surface area electrodeposited platinum and palladium electrodes are evaluated both ex situ and in situ for the combination of direct
  reduction and oxygen reduction via the decomposition reaction. Oxygen gas bubbles produced at the fuel cell cathode introduce an unsteady two-phase flow component that, if not controlled, can perturb the co-laminar flow interface and reduce fuel cell performance. A grooved channel design is developed here that restricts gas bubble growth and transport to the vicinity of the cathodic active sites, enhancing the rate of oxygen reduction, and limiting crossover effects. The proof-of-concept microfluidic fuel cell produced power densities up to
  and a maximum current density of
  , when operated on
 oxidant together with formic acid-based fuel at room temperature.
Export citation and abstract BibTeX RIS
Small fuel cells have received much interest in recent years as potential power supplies for the next generation of portable electronic devices.1 Overall fuel cell performance based on two- or three-phase interface catalysis is enhanced with miniaturization, provided the active surface-to-volume ratio is inversely proportional to the characteristic length. One class of microstructured power supply is microfluidic fuel cells,2–16 also called laminar flow-based fuel cells and membraneless fuel cells. A microfluidic fuel cell is defined here as a device that confines all fundamental components of a fuel cell to a single microstructured manifold. An image and schematic of a microfluidic fuel cell are shown in Fig. 1. In the case of nonspecific catalysts or active sites, these fuel cells exploit the characteristics of microfluidic co-laminar flow to separate anolyte and catholyte without the requirement of a physical barrier, i.e., membrane. Both streams contain supporting electrolyte that provides high conductivity for ionic transport. Interdiffusion between the two streams is restricted to an hourglass-shaped zone in the center of the channel, with maximum width at the channel walls scaling as the cube root of diffusion coefficient, channel height, downstream position, and inverse mean velocity.17 Fuel and oxidant crossover is limited by positioning the anode and cathode on channel walls with adequate separation from the co-laminar interdiffusion zone. Given low rates of interdiffusion, the co-laminar configuration allows anolyte and catholyte compositions to be optimized independently7 in order to improve kinetics and cell potential. Microfluidic fuel cells avoid some commonly encountered challenges in polymer electrolyte membrane-based fuel cells,18 including membrane humidification control, membrane degradation, and liquid water management.
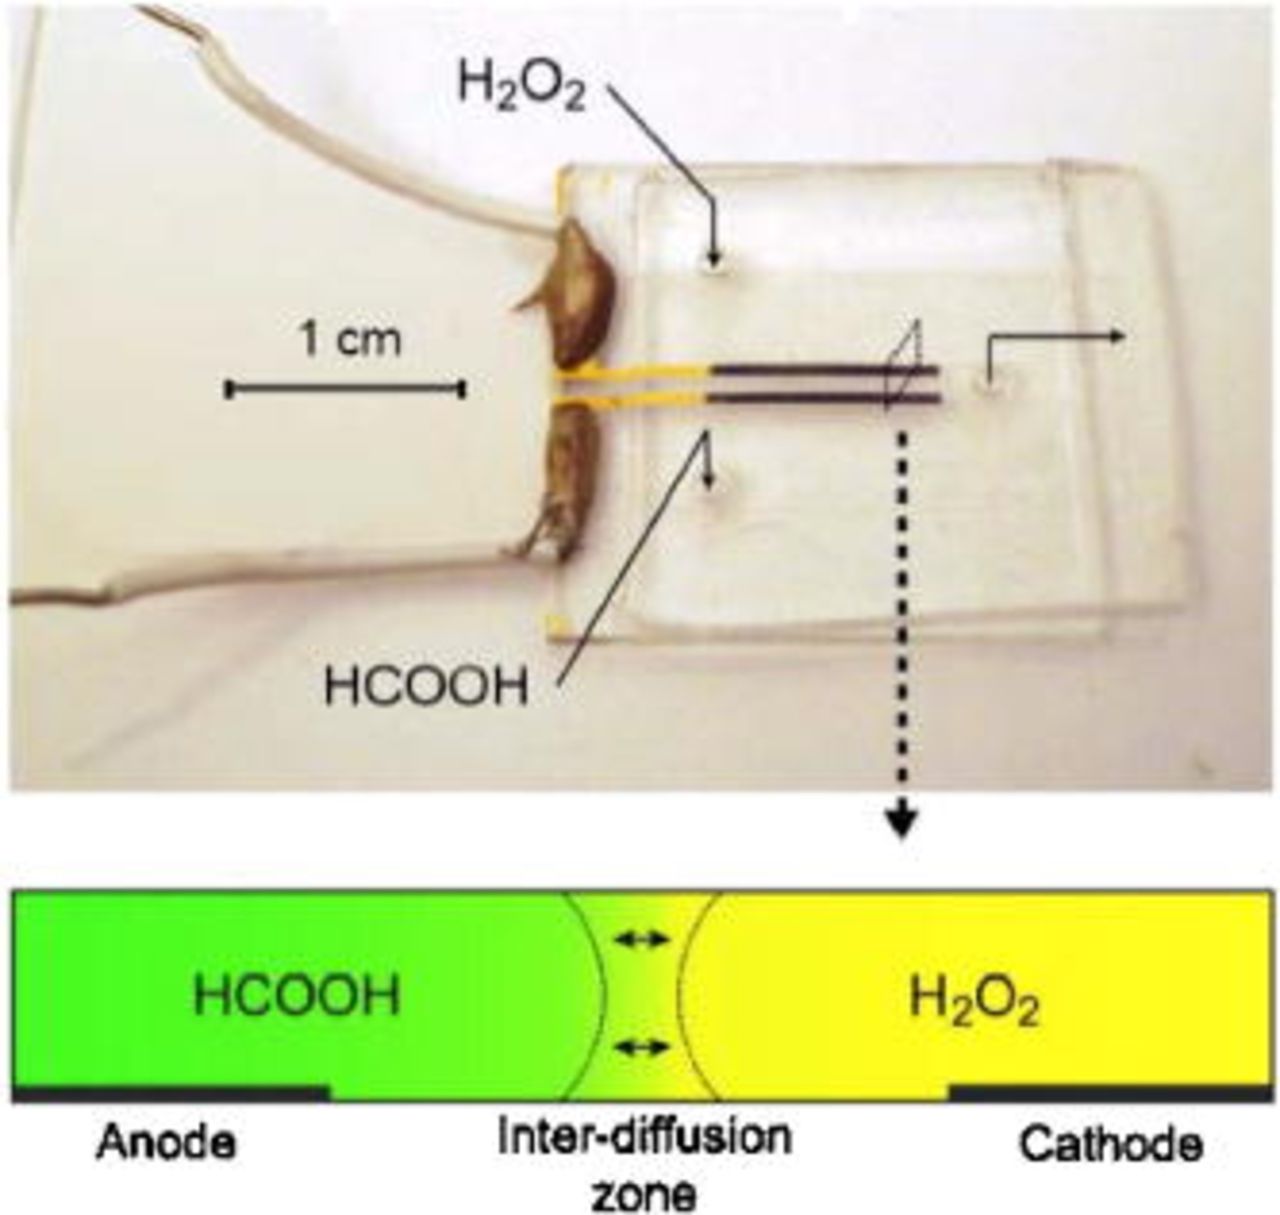
Figure 1. (Color online) Image of a microfluidic fuel cell with Pd electrodes using formic acid (HCOOH) fuel and hydrogen peroxide  oxidant. The schematic cross-sectional view of the channel shows the interdiffusion of anolyte and catholyte that is characteristic of co-laminar flow. The channels employed here were
  wide and
  high, and the electrodes were
  wide and
  in active length.
Proof-of-concept microfluidic fuel cells have been developed based on a variety of fuels: vanadium redox species,2, 3, 11 formic acid,6, 10, 14 methanol,7, 8, 13 hydrogen,9, 15, 16 and hydrogen peroxide.12 The current density of these fuel cells was predominantly controlled by the rate of mass transport to the active sites,5 typically in the cathodic half-cell.8 Fuel cells based on dissolved oxygen were particularly limited by the low solubility of oxygen  .6, 7, 9, 10 Jayashree et al.14 developed an integrated air-breathing cathode that allows gaseous oxygen transport from the ambient air, a source of oxygen that has significantly higher diffusivity and concentration than dissolved oxygen. The highest power density of air-breathing microfluidic fuel cells to date
  14 was achieved using
  formic acid fuel and a graphite plate anode covered with Pd black nanoparticles. Air-breathing designs require a blank cathodic electrolyte stream that prevents fuel crossover and facilitates ionic transport between the electrodes. They are also dependent on free convection of oxygen from the ambient air which may reduce flexibility with respect to operating environments and scale-up opportunities.
The performance of microfluidic fuel cells can be improved by employing aqueous oxidants that are soluble at higher concentrations than dissolved oxygen. For example, power densities up to  11 and
  2 have been obtained using vanadium redox couples as both fuel and oxidant. These redox fuel cells benefit from balanced anodic and cathodic streams. Similarly, Hasegawa et al.12 demonstrated a microfluidic fuel cell employing hydrogen peroxide
  as both fuel and oxidant. The operation of that cell, however, was dependent on net consumption of supporting electrolyte, with low overall energy density as a result.7, 12 Like common fuels methanol and formic acid,
  is available at high concentrations and has high solubility in aqueous media, enabling balanced half-cell configurations. A microfluidic fuel cell design is developed here with the goal of harnessing these advantages. Established soft lithography techniques are employed for channel fabrication and electrode masking.
  cathodes with different catalyst compositions and surface morphologies are produced via electrodeposition, and their electrochemical performance is evaluated both ex situ in a three-electrode electrochemical cell and in situ in a microfluidic fuel cell coupled with a generic formic acid-based anode.
Experimental
Electrochemistry
Formic acid anolyte and hydrogen peroxide catholyte of different compositions were prepared using phosphate supporting electrolyte in Millipore Milli-Q water (Millipore, Billerica, MA). Specifically, the anolyte was prepared from potassium hydrogen phosphate ( ; ACP Chemicals Inc., Montreal, Canada) and concentrated formic acid (HCOOH; Sigma-Aldrich, Oakville, Canada) to the desired concentrations of
  HCOOH in
  phosphate (pH 6–8), and the catholyte was prepared from phosphoric acid (
 ; ACP) and 30% hydrogen peroxide (
 ; EMD Chemicals Inc., Gibbstown, NJ) to
 in
in  phosphate (pH 0–1). All electrochemical experiments were driven by a PARSTAT 2263 potentiostat (Princeton Applied Research, Oak Ridge, TN) using a Ag∣AgCl (sat. KCl) reference electrode (
 vs SHE) and a platinum mesh counter electrode, where applicable. Individual electrode potentials in this article are given vs the Ag∣AgCl reference electrode unless otherwise stated. Planar gold electrodes subject to catalyst electrodeposition were cleaned in piranha etch (
 ) for
) for  , followed by rinsing in Millipore water, and electrochemical cycling in
  hydrochloric acid (HCl; Anachemia, Montreal, Canada) between
  and
and  at
at  for
for  . Platinum (Pt) was electrodeposited from a near-neutral plating bath containing
  chloroplatinic acid (
 ; Sigma-Aldrich) and
  ammonium phosphate (pH 8) prepared from ammonium hydroxide (
 ; EMD) and
  in Millipore water. The plating solution was heated to
  and sonicated for
  until the bright yellow precipitate formed upon mixing of the constituents was fully dissolved and the solution turned into a uniform clear orange color. Palladium (Pd) was plated from an acidic plating bath consisting of
  palladium(II) chloride (
 ; Sigma-Aldrich) and
  HCl in Millipore water, dissolved as a clear brown solution after
  sonication. The target Au electrode was immersed in the plating bath, and characterized by cyclic voltammetry at
  . Electroplating was carried out under potentiostatic control until the desired loading was deposited, assuming 60% coulombic deposition efficiency.19 The obtained electrodes were rinsed thoroughly with Millipore water before further use. Scanning electron micrographs were captured by a Hitachi S-3500N scanning electron microscope with a tungsten filament operated at
  .
.
Fuel cell fabrication and testing
Proof-of-concept microfluidic fuel cells were assembled using in-house microfabrication techniques. The fuel cell shown in Fig. 1 comprises two layers: a substrate upon which electrodes are formed, and a polymeric top layer housing the channel structure. The substrate was a  commercial
  gold slide (EMF Corp., Ithaca, NY) subject to gold etching combined with photolithography to attain the desired electrode structure. The electrode structures were patterned with negative photoresist (SU-8 25; Microchem, Newton, MA) over the gold, as previously reported,20 and the uncovered parts were removed by immersion in gold etching solution (Type TFA; Transene Company Inc., Danvers, MA) for
  and chromium etching solution (
 in
in  NaOH) for
  followed by thorough rinsing in Millipore water. The remainder of the photoresist was removed by sonication in acetone, until the desired gold electrodes were revealed. Wires were attached to the electrodes using conductive epoxy (Circuit Works CW2400; ITW Chemtronics, Kennesaw, GA) prior to catalyst electrodeposition. The T-channel structure required for the co-laminar flow was molded in poly(di- methylsiloxane) (PDMS; Dow Corning, Midland, MI), following established soft-lithographic protocols21 and in-house developed procedures.22 Ports for fluid handling were punched in the PDMS prior to assembly. The electrodeposited substrate and PDMS channel structure were plasma treated (PDC-32G; Harrick Sci., Pleasantville, NY) for
  to yield silanol surface groups that covalently bind glass to PDMS and render hydrophilic channel walls. When the two were aligned under a microscope and brought into contact, an irreversible seal was obtained.
Steady co-laminar flow of aqueous fuel and oxidant solutions required for fuel cell operation was driven by a syringe pump (PHD 2000; Harvard Apparatus, Holliston, MA) via Teflon tubing (Upchurch Sci., Oak Harbor, WA). Polarization data were obtained at room temperature by chronoamperometry under stepwise potentiostatic control from  to the open-circuit voltage by
  increments. The cell current was monitored for
  at each potential to ensure steady state conditions. Current densities and power densities reported here were time averaged over the
  measurement interval and calculated based on the planar active area of the electrodes
  .
.
Results and Discussion
The half-cell reaction scheme for a cathode based on hydrogen peroxide in acidic media includes a combination of direct hydrogen peroxide reduction and indirect oxygen reduction following decomposition. The reactions and associated standard potentials at  are23
are23


The standard potential for direct hydrogen peroxide reduction, Reaction 1, is more positive than most other oxidizers (e.g., oxygen or permanganate), therefore potentially establishing a higher electromotive force for fuel cell operation. However, the oxidation of peroxide to oxygen, Reaction 2, is facile on both Pt and Pd, and both Reactions 1, 2 occur together. The effect of this is that the open circuit potential is a mixed potential, occurring at about  on Pt in acid solution. Net reduction of hydrogen peroxide occurs only negative of this, so the actual overpotential for direct hydrogen peroxide reduction is relatively high. The combination of the two reactions is the catalyzed decomposition of hydrogen peroxide to oxygen and water,
  . (The uncatalyzed reaction, not requiring a Pt or Pd surface, is very slow on the time scale of these experiments.) Downstream recapture of
  and its reduction to water, Reaction 3, can reduce some of the losses from Reaction 2.
In order to evaluate the feasibility of hydrogen peroxide oxidant for microfluidic fuel cells, a suitable anodic half cell that does not constrain the overall fuel cell performance was required. Anodic systems based on formic acid have previously exhibited relatively high performance in terms of both current density and power density in microfluidic fuel cells14 as well as polymer electrolyte membrane fuel cells based on liquid fuels, such as the direct formic acid fuel cell.24 The half-cell reaction and standard potential at  of a formic acid-based anode are23

A fuel cell based on hydrogen peroxide reduction and formic acid oxidation thus has a standard cell potential of  .
.
Electrocatalytic analysis
Pure Pt and Pd electrodes were plated on gold and the electrochemical response of the deposits was characterized ex situ in typical formic acid and hydrogen peroxide solutions. Bath electroplating generally progresses via a three-dimensional nucleation and growth model.25 Nucleation can be either instantaneous or progressive: for instantaneous nucleation, all nuclei form at the same instant and grow with time; for progressive nucleation, on the other hand, new nuclei are formed as older nuclei grow and overlap. Since nucleation usually occurs at defects, dislocations, or edges, it is possible to control this behavior and synthesize specific morphologies by using substrates with known surface structure. The shape and size of the deposit also depends on kinetic parameters, e.g., whether the process is rate controlled or mass transport controlled. By careful tuning of the overpotential, one can obtain fractal growth leading to high surface area deposits.19 The combination of the high catalytic surface area and the absence of adhesive agent (e.g., Nafion) makes this tuned electroplating methodology particularly suitable for microfluidic fuel cell applications.
Cyclic voltammograms shown in Fig. 2 were measured for Pt and Pd electrodeposition on planar Au electrodes from the open-circuit potential  (Pt), and from OCP
  (Pd). The large potential shift between the two curves was primarily caused by the pH difference of the plating baths. Deposition of Pt was expected to start around
  , with an increasing current toward the peak at
  . This is a well-known characteristic for nucleation and diffusion controlled growth.19 At the peak, the active sites available on the WE surface limit the deposition current, forcing it back down toward a steady, diffusion-limited value. However, at
  there was a sharp increase in current due to the onset of hydrogen evolution, which concealed the deposition current. At these potentials, co-deposition of hydrogen took place, which can interfere with the quality and efficiency of the Pt deposition. As shown in Fig. 2, operation at near-neutral pH enabled the separation of Pt deposition and hydrogen evolution, a feature that was not possible in acidic solution due to the positive shift of the hydrogen standard potential. The plating bath employed for Pd was of a standard acidic type, in which it was not possible to completely separate Pd deposition and hydrogen evolution peaks (Fig. 2). An alkaline plating bath for Pd (not shown here) was also evaluated, however, the obtained catalyst structures had lower electrocatalytic activity than the ones from the more commonly used acidic bath.
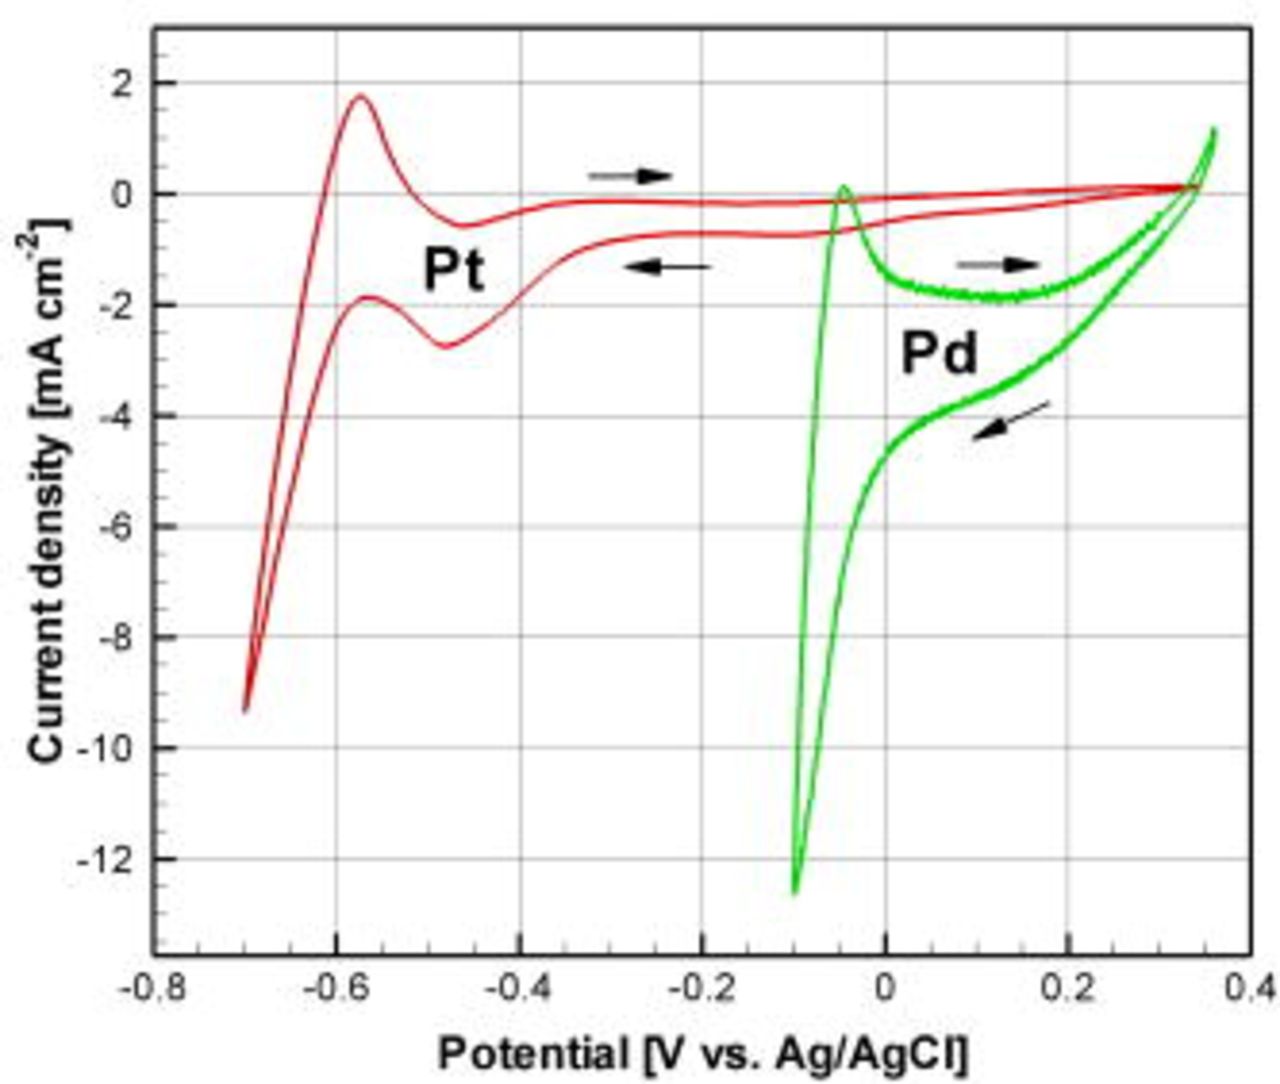
Figure 2. (Color online) Cyclic voltammograms for Pt and Pd electrodeposition on planar Au electrodes, measured at  scan rate (fourth cycle shown).
The electrodeposition of Pt and Pd was carried out under potentiostatic control at  and
and  , respectively, where the deposition current was essentially transport limited in both cases and hydrogen co-deposition was negligible. The deposition charge was monitored until the desired catalyst loading was obtained
  . The current generally increased with time, which corresponded to the growth of the active surface area during the plating process. Figure 3 shows scanning electron micrographs of the obtained surface morphologies. The Pt morphology (Fig. 3a) was quite smooth with uniformly distributed grains and pores on the order of a few micrometers. The Pd surface structure (Fig. 3b) exhibited a more distinct fractal character with large features on the order of micrometers as well as features on the order of hundreds of nanometers and smaller. The active surface areas of the obtained Pd electrodes were therefore generally higher than for the Pt deposits. The expanded view of the Pd electrode (Fig. 3c) shows preferred growth at the edges of the gold and at some defects in the center, which reflects nucleation and diffusion-controlled fractal growth. Moreover, the edges of the electrode are exposed to a higher rate of diffusive transport that further promotes local growth under transport-limited plating conditions. The edge formations were
  high in the case of
  Pd loading.
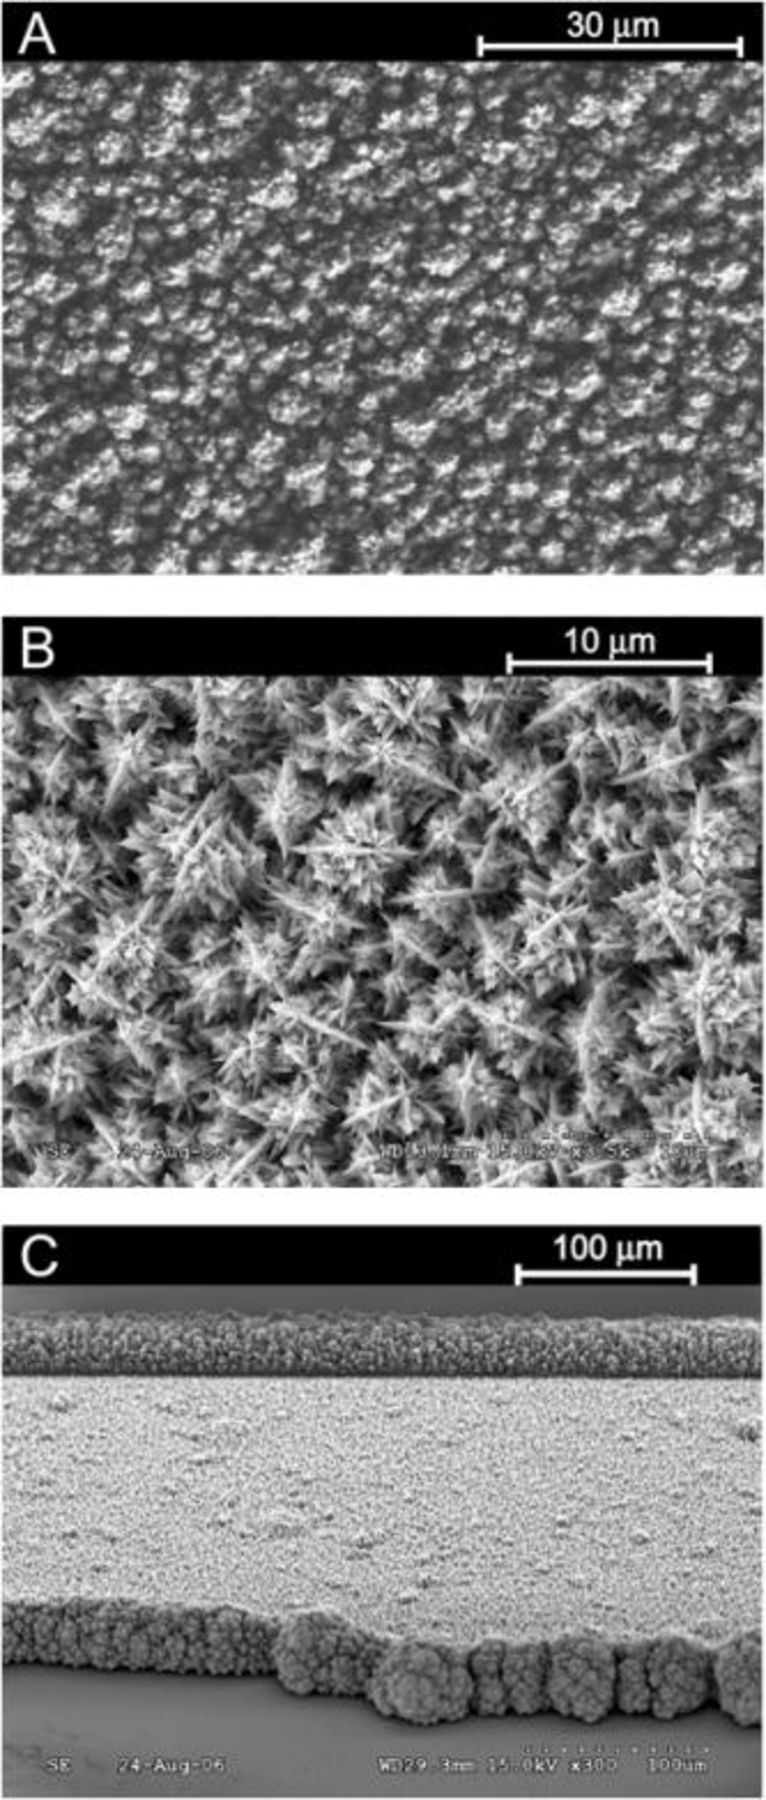
Figure 3. Scanning electron micrographs of the surface morphology of the electrodeposited Pt (A) and Pd (B) electrodes, and a side view (C) of the Pd electrode, captured at  ,
,  , and
, and  magnification, respectively.
The electrocatalytic activity of the Pt and Pd electrodes toward hydrogen peroxide reduction and formic acid oxidation was analyzed by cyclic voltammetry and chronoamperometry. Polarization data for individual electrode performance in a three-electrode electrochemical cell containing either  or HCOOH in phosphate electrolyte are shown in Fig. 4. The potential gap between the two sets of curves indicates that this fuel and oxidant combination is feasible for fuel cell operation. The Pt and Pd deposits were equally effective catalysts for
  reduction. The OCP for this half cell was relatively low, owing to the parasitic nature of Reaction 2. The observed rate of gaseous oxygen evolution via Reactions 1, 2 upon immersion of the electrodes in the
  solution was higher for Pd than for Pt. The activation overpotential for HCOOH oxidation was essentially zero. Pd showed significantly higher activity than Pt in this case, in agreement with previous reports.24, 26
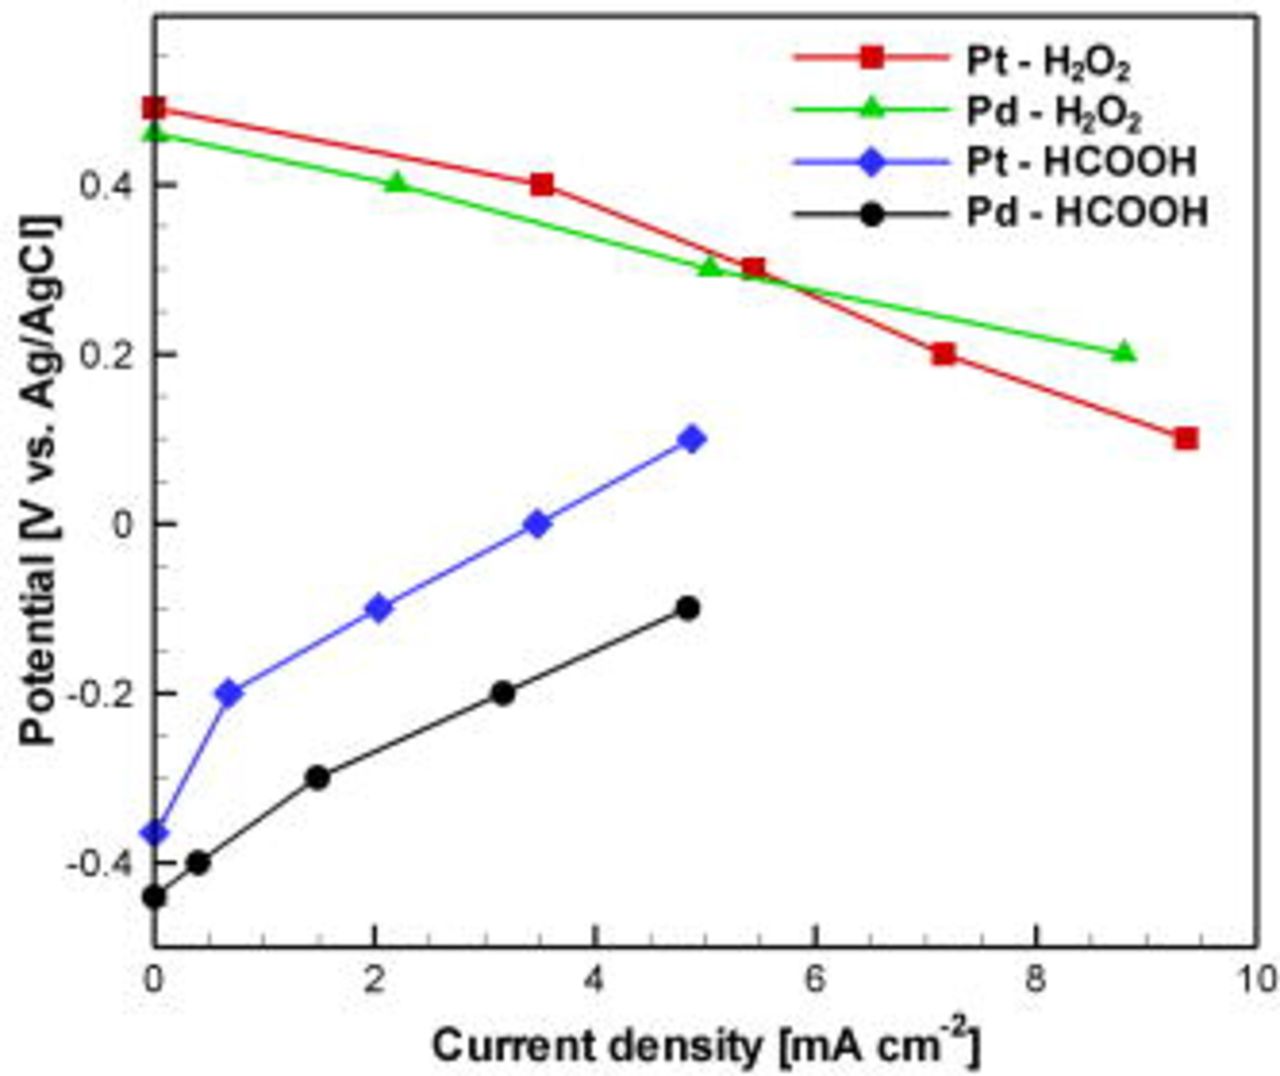
Figure 4. (Color online) Separate anode and cathode polarization data measured in a three-electrode electrochemical cell with electrodeposited Pt and Pd working electrodes. The anolyte was  HCOOH in
  phosphate (pH 4) and the catholyte was
 in
in  phosphate (pH 1).
Fuel cell testing
Planar microfluidic fuel cells were fabricated according to the procedure outlined in the experimental section. The cell design is shown schematically in Fig. 1; fuel (HCOOH) and oxidant  solutions enter the main channel via separate inlets and flow in a co-laminar configuration in parallel with the anode and cathode downstream toward the single outlet. The high-aspect ratio cross-sectional geometry of the channel (
 wide and
  high) with electrodes placed perpendicularly to the co-laminar flow interface delays interdiffusion of the streams and enables high fuel utilization.4 The supporting electrolyte provides high ionic conductivity within the streams, which facilitates rapid ionic charge transport between the electrodes. An array of different fuel cells was fabricated to study fuel cell performance as a function of the following parameters: cathode catalyst and loading, channel height and cross-sectional shape, and concentration and pH of fuel and oxidant solutions. A generic anode was employed in all cells, consisting of
  electrodeposited Pd, and the HCOOH concentration was fixed at
  . Polarization data were measured for all fuel cells under stepwise potentiostatic control. A selected current transient is presented in Fig. 5, showing an initial peak and then decay toward steady state over
  . The time scale for stabilization is attributed to initial gas evolution partly blocking the active sites and the formation of concentration boundary layers for reactants as well as products, and is two orders of magnitude larger than the residence time in the channel at this flow rate. The unsteady oscillation pattern is attributed to the formation, growth, and expulsion of gas bubbles over the electrodes associated with
  evolution from peroxide oxidation at the cathode as well as product
  evolution at the anode. The level of unsteadiness during the chronoamperometric measurements can be quantified by two methods: the variability, defined by the ratio between the maximum and average currents; and the standard deviation about the mean. In this case, the variability and standard deviation were 1.8 and 13%, respectively. The fuel cell design, incorporating a channel structure with three walls of optically transparent PDMS, enabled direct observation of these phenomena. Anodic
  gas evolution started at low-to-moderate current densities
  , in contrast to previous microfluidic fuel cells using HCOOH fuel,6, 14 and was found to increase further with current density. The air-breathing HCOOH-based microfluidic fuel cell introduced by Jayashree et al.14 operated under similar current densities, and exhibited peak power at
  HCOOH, however
  evolution was not addressed in that study. The solubility of
  in water is relatively high (0.15% w/w at
  and
and  partial
  pressure,23 neglecting the pH-dependent acid-base reactions) compared to the rate of product
  formation experienced in the fuel cells, e.g., for the case shown in Fig. 5, the
  turnover rate is approximately 0.05% w/w vs the flow rate of the anolyte, which is only one-third of the solubility limit. The flow cells under study, however, present different conditions than a generic solubility test and observations here indicate that the high local rates of
  dissolution in microfluidic fuel cells can result in significant gas bubble formation below the solubility limit. Extensive
  evolution was also observed at the cathode, particularly at high current densities. The solubility of
  in water is one order of magnitude less than for
  ,23 and thus the extensive
  bubble evolution is expected from
  oxidation.
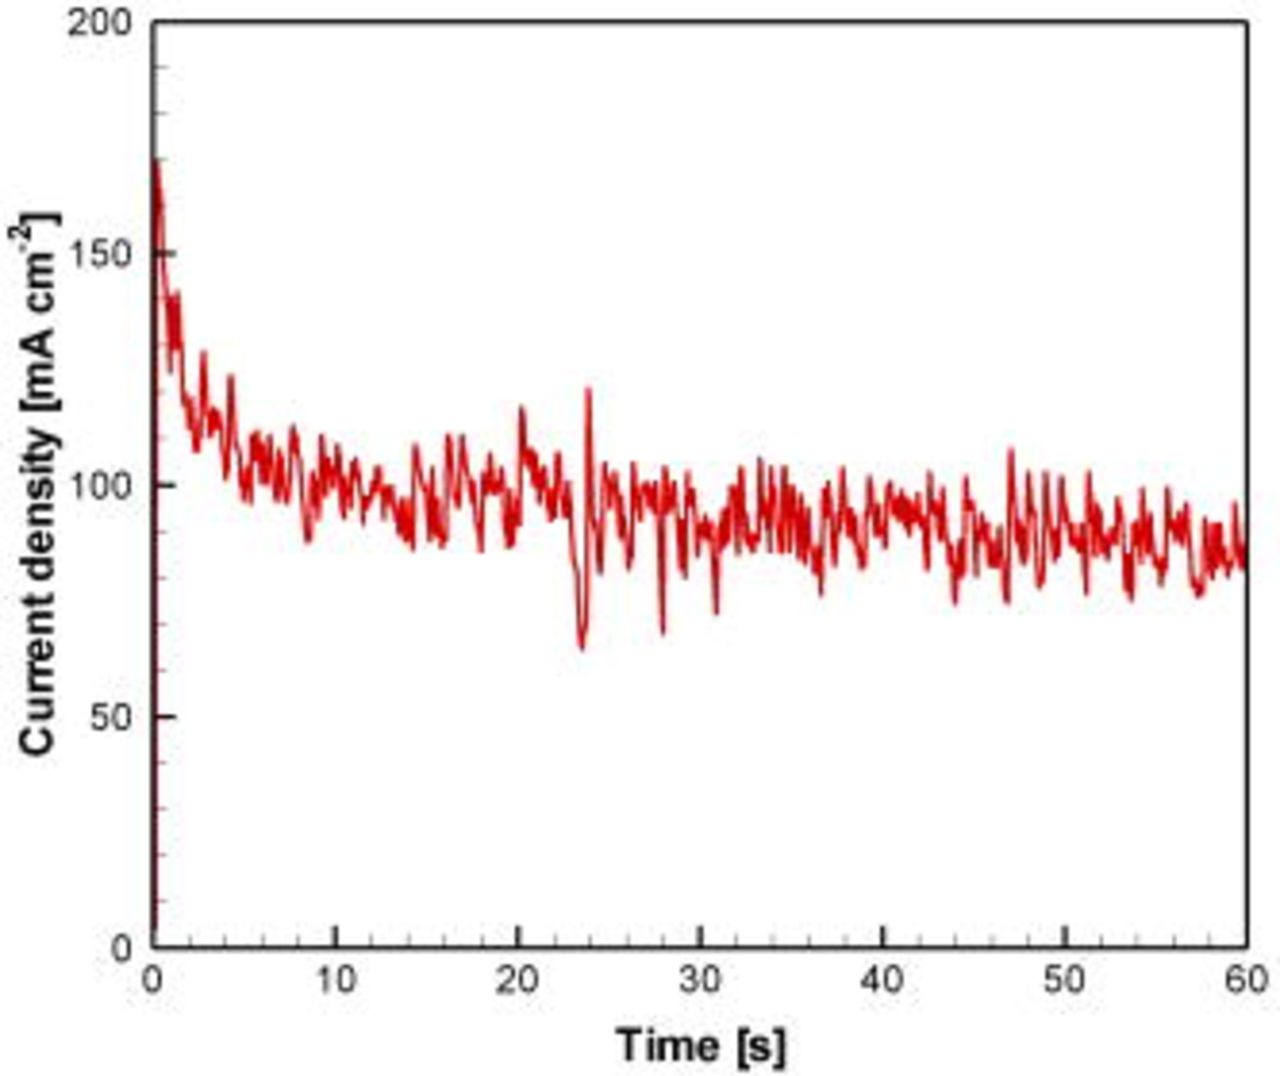
Figure 5. (Color online) Sample chronoamperometric curve for microfluidic fuel cell operation measured at  cell voltage using
  HCOOH in
  phosphate (pH 7) anolyte and
 in
in  phosphate (pH 0) catholyte flowing at
  .
.
Figure 6 shows power density curves obtained using a proof-of-concept fuel cell design with  Pd electrodes and a
  high microchannel. Here, the effects of
  concentration as well as anodic and cathodic supporting electrolyte concentrations were evaluated using a fixed HCOOH concentration
  and flow rate
  . The fuel cell produced
  when all concentrations were
  . The power density was improved by 33% by increasing both anodic and cathodic phosphate concentrations to
  , attributed to improved reaction kinetics and ionic conductivity as well as enhanced electromotive force and open-circuit voltage achieved by increasing the pH difference between the two streams.7 Increasing the
  concentration to
  provided an additional 33% increase in peak power density. Increasing the concentration further to
  did not, however, result in significant further improvement. We also investigated the use of a more alkaline anodic stream (
 phosphate; pH 8), which improved performance by only 15% compared to the
  case, still without net consumption of supporting electrolyte.7 In sum, a balanced pair of solutions that provided high power density at moderate concentration was
 in
in  phosphate (pH 0) together with
  HCOOH in
  phosphate (pH 7). This pair is denoted "standard solutions" in the following paragraphs.
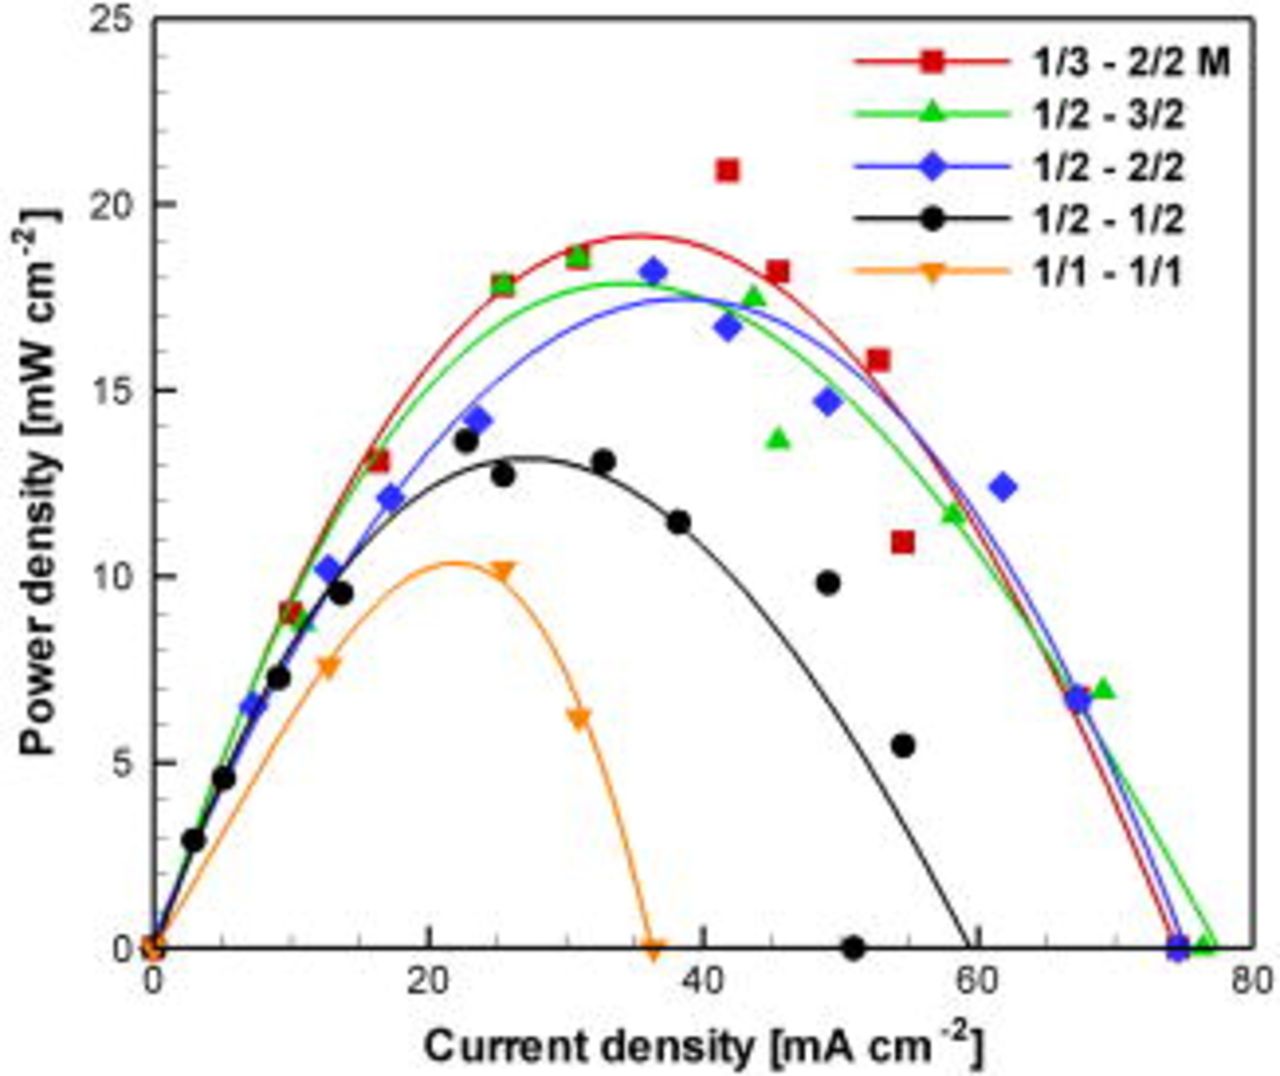
Figure 6. (Color online) Fuel cell power density curves measured experimentally using different combinations of anolyte and catholyte flowing at  . The numbers on the legend indicate HCOOH/phosphate and
  /phosphate molar concentrations of anolyte and catholyte, respectively. The lines are third-order polynomial curve fits to the experimental data (symbols). Both electrodes contained
  Pd and the channel was
  high.
high.
The performance of various fuel cell designs was investigated using these standard solutions at fixed flow rates (60 and  ). The parameters examined here were channel height, cathodic catalyst composition, the geometry of the electrode both at the fractal level and on the scale of the channel height (edge formations); and cross-sectional channel shape, as shown schematically for the six prototype cells in Fig. 7a. These parameters influence the boundary layer thickness, transport of reactants to the active sites, current collection, gaseous bubble formation, and rate of removal of bubbles through both advection and reaction. Bubble dynamics, in turn, influence local species transport as well as fuel and oxidant mixing and crossover. Figures 7b and 7c show the experimental power density data for each cell at the two different flow rates. Among the cells with Pd cathodes (cells I–III), the cell with
  channel height (cell I) generally produced more power than the
  cell (cell II). The relative size of the edge formations to the channel height, which is larger in the
  cell, directed the majority of the flow to the interelectrode spacing. As observed visually, gas bubble stagnation over the electrodes limited the performance of the
  cell, while the cell with a higher channel facilitated improved transport and bubble expulsion characteristics. The dynamic two-phase flow characteristics introduced by gas evolution can be beneficial for local transport rates and time-averaged current density,27 but were found here to also perturb the co-laminar flow interface and cause unfavorable crossover effects if not controlled. Increasing the Pd loading from 5 (cell I) to 10 (cell III) mg
  caused the performance to drop drastically at low flow rate (Fig. 7b) due to severe crossover effects attributed to expedited
  evolution. This crossover effect at high Pd loading was less severe at high flow rate (Fig. 7c), where bubble growth was restricted and expulsion was promoted by the increased flow rate. The average variability of the chronoamperometric data, given in Table I, provided a measure of the degree of crossover in each cell. Variability levels between 1.5 and 2 were observed routinely; these levels are related to the initial peak (Fig. 5) combined with convective transport and concentration boundary layer growth. Values above 2, however, are attributed to increased crossover effects. The electrode with high Pd loading (cell III) exhibited the largest variability at both flow rates.
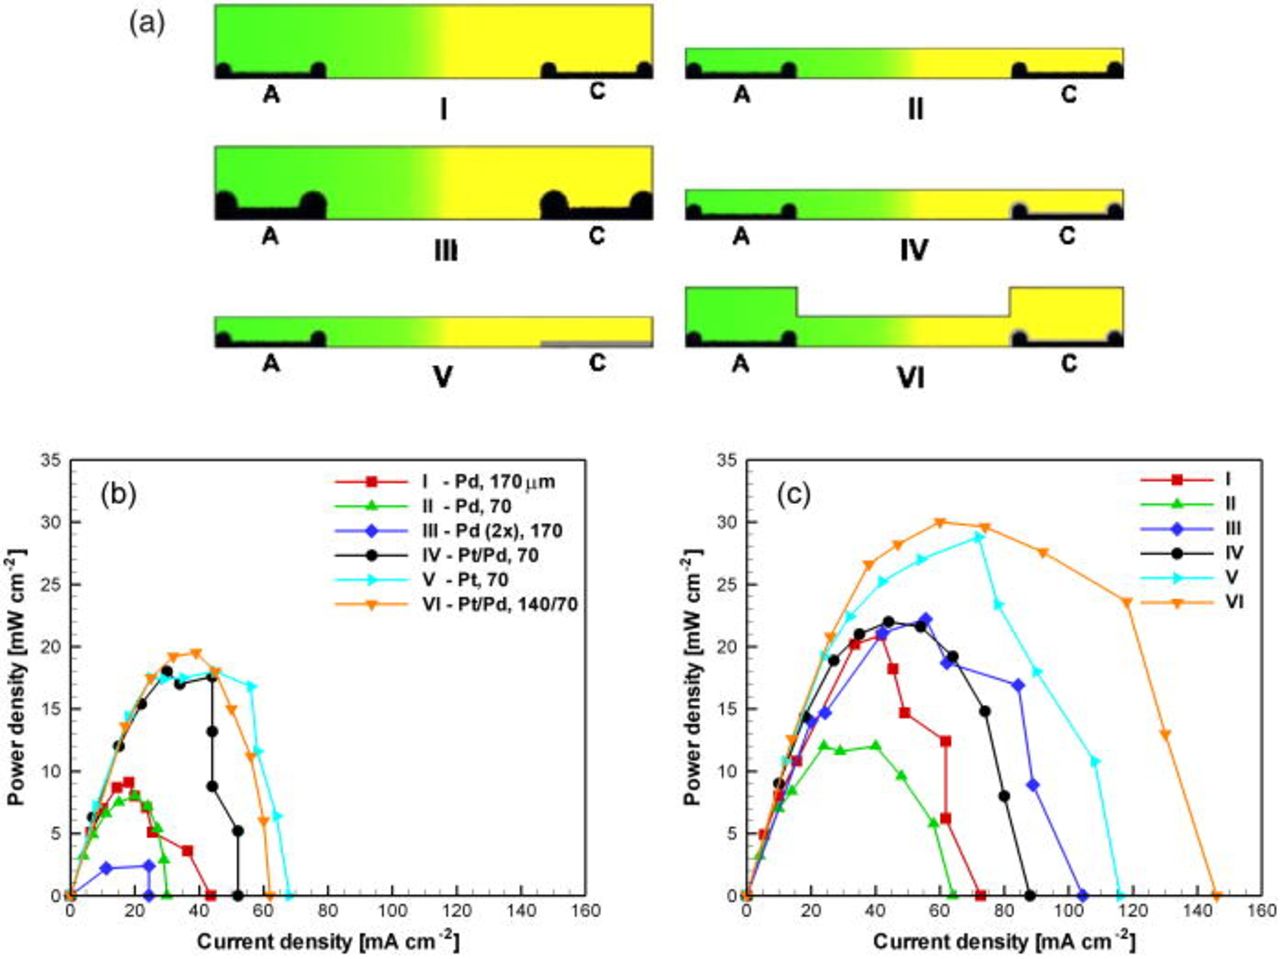
Figure 7. (Color online) Schematic (A) of the six different fuel cell designs (I–VI) studied here, and associated power density curves obtained experimentally at 60 (B) and 300 (C)  flow rates. The legend indicates cathode catalyst material and channel height in
  . Standard solutions were used (
 HCOOH in
  phosphate and
 in
in  phosphate).
Table I. Average variability measured for fuel cells (I–VI) using standard solutions at 60 and  .
.
Flow rate ( ) ) | Variability | |||||
|---|---|---|---|---|---|---|
| I | II | III | IV | V | VI | |
| 60 | 3.1 | 2.1 | 6.5 | 1.8 | 1.6 | 2.0 |
| 300 | 1.8 | 1.7 | 2.5 | 1.7 | 1.5 | 1.6 |
The crossover problem was mitigated by depositing a thin adlayer of Pt over the Pd cathode (in cells IV and VI), thus reducing the rate of  production. The cells with Pt on the cathode (cells IV–VI) showed reduced crossover at low flow rates (Fig. 7b) and also markedly improved performance at high flow rates (Fig. 7c). This effect is also evidenced in lower variability in Table I. The cell with a pure Pt cathode (cell V) generally performed better than the
  cell with
  channel (cell IV). This is attributed to a lack of Pd edge formations that negatively impacted species transport over the bulk of the electrode surface with the
  channel height, consistent with the observations from Pd electrode cells (cells I–II). The best overall performance was achieved with the
  cell with a grooved cross-sectional geometry (cell VI). Polarization and power density curves for this cell are studied separately in Fig. 8 using standard solutions at four different flow rates. Operation was demonstrated for flow rates spanning three orders of magnitude, with maintained open-circuit voltage near
  and current densities up to
  . Unlike the other fuel cell designs (cells I–V), this fuel cell is capable of steady operation without crossover issues at flow rates as low as
  , equivalent to a residence time of
  . This capability is attributed to the cross-sectional shape of the channel: the channel sections directly above the electrodes are higher
  than the center part of the channel over the interelectrode spacing
  . Gas evolved from each electrode is trapped in the high channel sections directly above the respective electrode. The result is a source of
  to the cathode, and a containment of
  over the anode. In addition, the grooved channel design enables preferential flow (higher velocity and transport rate) over the electrodes, in contrast to the other cells (I–V) with uniform channel height. Employing this cell design, detrimental crossover effects are minimized and the mixing interface is confined and stabilized in the center of the channel sufficiently far away from the edges of the electrodes; the produced
  is captured and constrained within the direct vicinity of the cathodic active sites. The maximum power density measured here was
  at
at  , which is comparable to air-breathing cells
  14 and higher than cells based on dissolved oxygen
  ;6, 10 all of which were also utilizing HCOOH as fuel.
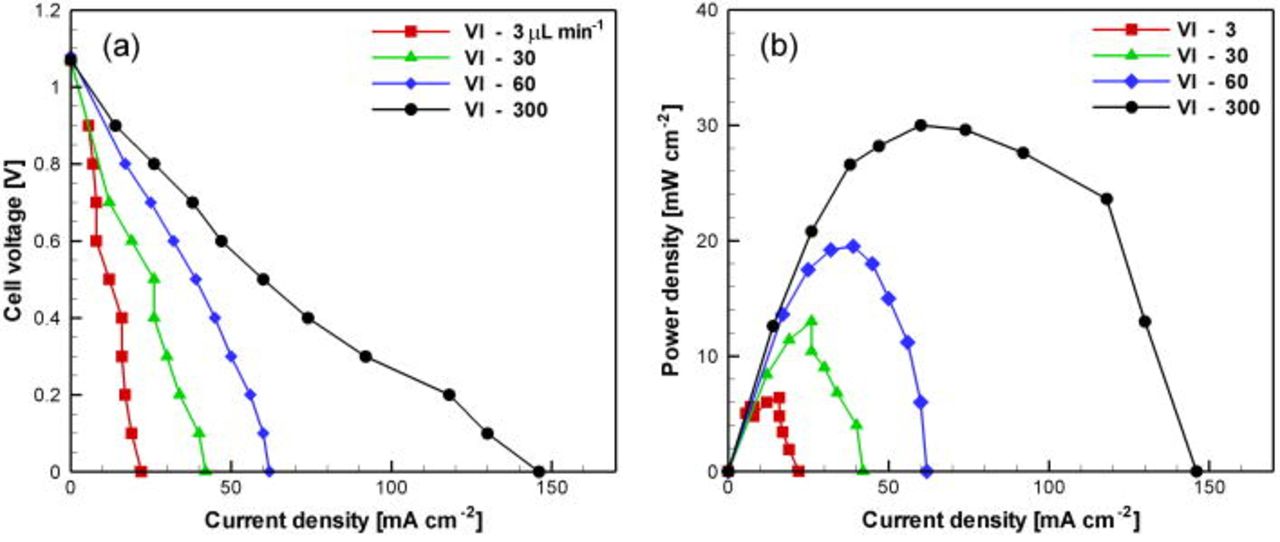
Figure 8. (Color online) Polarization (A) and power density (B) curves obtained experimentally at flow rates ranging from  . Fuel cell (VI) (
 cathode and
  channel) was employed using standard solutions (
 HCOOH in
  phosphate and
 in
in  phosphate).
Conclusion
Microfluidic fuel cell operation based on hydrogen peroxide  oxidant was demonstrated employing electrodeposited platinum and palladium electrodes with high surface area. The cathode design of these fuel cells allows some recapture of
  that is produced by parasitic oxidations of
  . We developed a membraneless microfluidic fuel cell design with a grooved channel geometry that (i) utilizes gas evolution and unsteady two-phase flow characteristics to enhance local transport rates and time-averaged current density, and (ii) restricts oxygen bubble growth and expulsion to the channel section directly above the cathode in order to enhance the rate of oxygen reduction and prevent detrimental fuel and oxidant crossover effects. Our proof-of-concept
  -based microfluidic fuel cell demonstrated competitive power density and current density levels that were comparable to air-breathing designs and significantly higher than cells based on dissolved oxygen. In addition,
  -based cells are acquiescent to operation where natural convection of air is limited and anaerobic conditions prevail, for example, in submersible and space applications. The performance of
  -based cathodes, as well as overall fuel cell performance, would further benefit from a catalyst optimization study within the framework of a microfluidic fuel cell, including Pt and Pd nanoparticles and various high-surface area Au electrodes.
Acknowledgments
Funding for this research provided by the Canadian Natural Sciences and Engineering Research Council (NSERC) and Angstrom Power, Inc., is highly appreciated.
University of Victoria assisted in meeting the publication costs of this article.