
Abstract
Gelatin hydrogel electrolytes (GHEs) with varying  concentrations have been prepared by cross-linking an aqueous solution of gelatin with aqueous glutaraldehyde and characterized by scanning electron microscopy, differential scanning calorimetry, cyclic voltammetry, electrochemical impedance spectroscopy, and galvanostatic chronopotentiometry. Glass transition temperatures for GHEs range between 339.6 and
  depending on the dopant concentration. Ionic conductivity behavior of GHEs was studied with varying concentrations of gelatin, glutaraldehyde, and
  , and found to vary between
  and
and  . GHEs have a potential window of about
  . Undoped and
 -doped GHEs follow Arrhenius equations with activation energy values of 1.94 and
  , respectively. Electrochemical supercapacitors (ESs) employing these GHEs in conjunction with Black Pearl Carbon electrodes are assembled and studied. Optimal values for capacitance, phase angle, and relaxation time constant of
  ,
,  , and
, and  are obtained for
 -doped GHE, respectively. ES with pristine GHE exhibits a cycle life of
  vs
vs  for the ES with
 -doped GHE.
Export citation and abstract BibTeX RIS
Polymer electrolytes are widely studied materials with applications in electrochemical devices. Although the ionic conductivity behavior of solid polymer electrolytes, such as polyethylene oxide-salt complexes, was reported as early as in 1973 by Wright, the potential of these materials as a new class of solid electrolytes for energy storage applications was envisaged by Armand in 1978.1–4 Solid polymer electrolytes exhibit ionic conductivity between  and
and  that is too low to be significant for devices. Accordingly, efforts have been expended to enhance the ionic conductivity of polymer electrolytes.1, 2 One such approach involves addition of plasticizer, a low-molecular-weight polar solvent, such as ethylene carbonate, to a polymer-salt system to realize polymer gel electrolyte (PGE).5–8 These PGEs are solid, have good adhesive properties, and exhibit high ionic conductivity of about
  at ambient temperatures. Although such nonaqueous PGEs have a wider potential window of about
  as compared to about
  for their aqueous counterpart, preparation and handling of the former require a moisture-free environment that is both involved and cost-intensive. Besides, organic solvents used as plasticizers with nonaqueous PGEs are environmentally toxic.5
Electrochemical supercapacitors (ESs) are electrochemical power systems with highly reversible charge-storage and delivery capabilities. ESs have properties complementary to secondary batteries and find usage in hybrid energy systems for electric vehicles, heavy-load starting assist for diesel locomotives, utility load leveling, and military and medical applications.9, 10 Depending on the charge-storage mechanism, an ES is classified as an electrical double-layer capacitor (EDLC) or a pseudocapacitor. Higher energy density of EDLCs, as compared to dielectric capacitors, is primarily due to the large surface area of the electrode materials, usually comprised of activated carbons,11, 12 aerogel or xerogel carbons,11, 13–15 and carbon nanotubes.11, 16, 17 EDLCs have several advantages over secondary batteries, namely, faster charge–discharge, longer cycle life ( cycles), and higher power density.9 Pseudocapacitors are also called redox capacitors because of the involvement of redox reactions in the charge-storage and delivery processes. Energy storage mechanisms in pseudocapacitors involve fast faradaic reactions such as underpotential deposition, intercalation, or redox processes occurring at or near a solid electrode surface at an appropriate potential.9 Redox processes often occur in conducting polymers9, 18 and metal oxides,9, 19–28 making them attractive materials for pseudocapacitors. ESs employ both aqueous and nonaqueous electrolytes in either liquid or solid state; the latter provide the advantages of compactness, reliability and freedom from any leakage of liquid.
Organic PGEs have been employed in both lithium batteries5 and EDLCs.6–8 There have been reports29, 30 on aqueous PGEs based on poly(vinyl alcohol) (PVA)– and their use in ESs, but due to their corrosive nature, acidic electrolytes are suitable only for a limited number of electrode materials. Alkaline PGEs, such as poly(ethylene oxide) (PEO)–
 31–33 and poly(acrylic) (PAA)–
 34, 35 have found applications in nickel–metal hydride batteries and EDLCs. Recently, a study on aqueous PGEs comprised of aqueous PVA/PAA blend hydrogel electrolytes with acidic, alkaline, and neutral dopants has been reported.36
Hydrogels are three-dimensional polymeric networks with large quantities of water absorbed in the polymer matrices. The three-dimensional network formation and its insolubility in the parent solution are due to the presence of chemical cross-links or physical entanglements. Physiologically responsive hydrogels often show a swelling behavior in response to a changing external environment. Some of the factors responsible for the swelling behavior are pH, ionic strength, temperature, and electromagnetic radiation. Based on the nature of the pendant groups, hydrogels are classified as neutral or ionic, and as affine or phantom networks based on their structural and mechanical features. Depending on the nature of the polymer, hydrogels are classified as homopolymeric or copolymeric hydrogels. Hydrogels are also classified as amorphous, semicrystalline, hydrogen-bonded structures, supramolecular structures, and hydrocolloidal aggregates based on the physical structure of the networks.37 Hydrogels are further subdivided as chemical and physical hydrogels. Physical hydrogels differ from chemical hydrogels in the type of cross-linkages, randomness of the network formation, and the effects of these parameters on the rigidity and elastic moduli of the formed networks. Unlike the covalent cross-linking points in chemical hydrogels formed by the reaction between the polymer and a cross-linking reagent, physical hydrogels are formed through association of several laterally associated polymer helices in extended junction zones, wherein the hydrogel network is stabilized by physical entanglements, electrostatic attractive forces, and hydrogen bonding; physical hydrogels are thermally reversible and can be viewed as viscoelastic solids.38
Hydrogels comprising synthetic polymers, such as PVA, have high structural integrity and good mechanical properties. These hydrogels have a large water content absorbed in the polymer matrix that helps fine-tune their ionic conductivity. Such hydrogels, however, possess a high degree of hydrophobicity due to the presence of long carbon chains with fewer pendant groups. By contrast, hydrogels consisting of natural polymers, such as gelatin, possess a higher degree of hydrophilicity due to the presence of a large number of hydrophilic pendant groups, which helps higher retention of water in the polymer matrix, leading to an enhanced ionic conductivity. Unlike the hydrogel electrolytes comprised of synthetic polymers, biopolymer-based hydrogel electrolytes with natural cross-linkers, such as genipin,39 have unique advantages for applications in biomedical devices such as defibrillators.9
Gelatin is a polypeptide consisting mostly of proline, hydroxyproline, and glycine and is extracted from denatured collagen. It dissolves in boiling water to form a pale yellow, semitransparent, and viscous solution. Upon cooling below  , a concentrated solution of gelatin forms a physical hydrogel. The utility of such a hydrogel is limited due its low network rigidity. Mechanical strength of gelatin hydrogel can be improved by chemical cross-linking with aldehydes.40
Research in the field of biomaterials has led to advances in hydrogel science and technology, supporting a wide spectrum of applications in biomedicine, tissue engineering, agriculture, aquaculture, infant care, and nanotechnology.40  -doped, agar-based physical hydrogel electrolytes have long been employed in salt bridges for electrochemical experiments. Although the effect of indifferent electrolytes on the rate of gelation of gelatin by dextran dialdehyde has been reported in the literature,41 an elaborate study as electrolyte of a biopolymer-based cross-linked hydrogel and its applicability in electrochemistry is still lacking.
In the light of the aforesaid discussion, we have embarked on a study of a biopolymer-based hydrogel for its properties and viability as a solid electrolyte. In this communication, we report the preparation and characterization of a hydrogel electrolyte comprising glutaraldehyde cross-linked gelatin, in both pristine and  -doped forms, as well as its use in electrochemical supercapacitors.
Experimental
Preparation of aqueous solution of gelatin
An aqueous solution of gelatin of a given concentration was prepared by dissolving the required amount of gelatin (Qualigens Fine Chemicals, Ltd., India) in a measured volume of Millipore water. In a typical preparation of  gelatin solution,
  of gelatin was added to
  of Millipore water and stirred magnetically for about
  followed by boiling on a water bath for about
  with stirring. A solution of
  in aqueous gelatin was prepared by adding the required amount of
  (Merck, India) to a given volume of aqueous gelatin solution by mechanically agitating the mixture for about
  .
.
Preparation of gelatin hydrogel electrolytes
Undoped gelatin hydrogel electrolytes (GHEs) employed in this study were prepared by mixing an aqueous solution of gelatin with aqueous glutaraldehyde solution (25% solution,  , Merck, Ltd., India) while GHEs doped with
  were prepared by mixing an aqueous solution of gelatin containing
  dopant with aqueous glutaraldehyde solution. In a typical preparation, about
  of aqueous gelatin with or without dopant was transferred to a Teflon casting tray
  and spread with a paintbrush. This was followed by brush-painting
  of aqueous glutaraldehyde solution of a given concentration over the gelatin solution and letting it remain at room temperature for about
  to complete the cross-linking reaction between gelatin and glutarladehyde. During the cross-linking reaction, the color of the aqueous gelatin changed from pale yellow to light brown.
Physical characterization of GHEs
Pristine as well as  -doped GHEs were examined by scanning electron microscope (SEM) and energy-dispersive analysis by X-rays (EDAX) employing a FEI-FP 6800/73 scanning electron microscope.
Thermal characterization of GHEs
GHE with and without  dopant were characterized by temperature-modulated differential scanning calorimetry (TMDSC) in the temperature range between 303 and
  using a Mettler Toledo DSC 823e differential scanning calorimeter interfaced with TOPEM software.
Electrochemical characterizations of GHEs
Electrochemical characterizations of pristine and  -doped GHEs were carried out by studying their ionic conductivity and supercapacitor performances. For ionic conductivity measurements, a freestanding film of the GHE (about
  in thickness and
  in geometric area) was sandwiched between two circular stainless steel (SS) blocking electrodes (each of about
  area) that were fixed in a Teflon holder. The SS electrodes were chemically etched with a mixture of nitric acid (25%) and hydrofluoric acid (8%) before employing them in conductivity measurements. Supercapacitor performance studies were carried out on all solid-state ESs assembled with various hydrogel electrode assemblies (HEAs). In a typical experiment, HEA was prepared by in situ gelation of a
  aqueous solution of gelatin with 5% (w/v) aqueous glutaraldehyde on Black Pearl Carbon (BPC) electrode material coated onto a Toray carbon paper (Toray TGP-H-090) followed by sandwiching the GHE thus formed with another BPC-coated carbon paper of similar dimensions. BPC-2000, with Brunauer–Emmett–Teller (BET) surface area of
  , micropore area of
  and mesopore area of
  ,42, 43 was procured from Cabot Corp., USA. The HEA was kept immersed in 5% (w/v) aqueous glutaraldehyde solution for about
  to complete the gelation. To prepare electrodes for the ESs, a slurry was obtained by ultrasonicating the required amount of BPC with 40% (w/w) Nafion perfluorinated ion-exchange resin (
 solution, Aldrich Chemical Company, Inc., U.S.) in isopropyl alcohol. The slurry was dropped onto a preweighed Toray carbon paper of
  thickness and about
  geometric area. The loading of BPC/Nafion per electrode was about
  , which was kept identical for all the ESs studied here. The HEA was sandwiched between two high-density graphite (HDG) current collectors, each of
  thickness and
  geometric area. The HEA with HDG current collectors was wrapped with a Teflon tape and fixed inside a Teflon holder prior to their performance evaluation studies. Because a practical supercapacitor device has a two-electrode configuration, we have adopted the same configuration for performance evaluation of GHE-based ESs against the three-electrode cell configuration commonly employed to characterize an electrode material.44–49
Electrochemical characterizations of the GHEs were carried out by cyclic voltammetry (CV), electrochemical impedance spectroscopy (EIS), and galvanostatic chronopotentiometry. All the electrochemical studies were carried out using an Autolab Electrochemical System (Eco Chemie BV). All the electrochemical measurements except the temperature dependence of ionic conductivity were conducted at room temperature.
The bulk ionic conductivity  of the GHEs was determined from the complex impedance spectra in the frequency range between
  and
and  with a perturbation of
  root mean square (rms) using the equation

In Eq. 1,  ,
,  , and
, and  are, respectively, the thickness, geometric area, and bulk resistance calculated from high-frequency intercept on the real axis of the complex impedance plot of the GHE.
To evaluate the utility of various GHEs in ESs, cyclic voltammograms (CVs) were recorded in the potential range of  to
to  for pristine GHE as well as GHEs doped with varying concentrations of
  in conjunction with BPC electrodes using a symmetrical two-electrode configuration. All the CVs were recorded at a scan rate of
  . The specific capacitance
  values44, 49 were obtained from the CVs using the equation

In Eq. 2,  is the output current at
  ,
,  is the weight of BPC used in one electrode, and
  is the potential scan rate.
The average specific capacitance  values for the ESs were obtained from the CVs44, 49, 50 using the equation

In Eq. 3,  is the sum of anodic and cathodic charges (absolute values) obtained by integrating both the positive and the negative sweeps of the CV,
  is the weight of BPC used in one electrode, and
  is the potential window of the CV.
The phase angle and relaxation time constant51 of the ESs were determined from the complex impedance spectra recorded in the frequency range between  and
and  with a perturbation of
  rms. The values of cell resistance for various ESs were obtained from the intercept on the abscissa at the high-frequency end of the impedance plot recorded in the frequency range between
  and
and  with a perturbation of
  rms.52
Specific capacitance and charge–discharge efficiency values for the ESs were also obtained from chronopotentiometric data recorded galvanostatically at a current density of  in the potential range between 0 and
  . The specific capacitances were evaluated from discharge curves of the charge–discharge plots49 using the equation

In Eq. 4,  is the constant input current and
  is the time required to change the potential by
  .
.
The charge–discharge efficiencies  of the ESs were calculated using the equation

In Eq. 5,  and
and  are the respective times required for charging and discharging the ESs.
Life-cycle tests on the ESs were performed at ambient conditions of temperature and humidity in open atmosphere and the values for cell resistance, specific capacitance, and charge–discharge efficiency were obtained for various charge–discharge cycles.
Results and Discussion
The cross-linkage of gelatin by aldehydes is predominantly due to the reaction of the ε-amine groups of lysine or hydroxylysine amino acid residues with the aldehyde groups, forming a relatively labile Schiff's base or aldimine. Other functional groups of gelatin such as carboxyl, amide, imidazoyl, or guanidine also occasionally take part in the cross-linking reaction.41 The cross-linking reaction between amine groups of gelatin and aldehyde groups of glutaraldehyde, leading to the formation of cross-linked gelatin hydrogel, is schematically depicted in Fig. 1. The rate of the cross-linking reaction increases with increasing concentrations of both the precursor solutions of gelatin and glutaraldehyde. This reaction, which takes place at ambient temperature and pressure without any catalyst, converts the aqueous gelatin solution into a solid mass with all the water content absorbed in it. The solid mass with pure water or aqueous solution of neutral salts such as  absorbed in it is referred to as gelatin hydrogel. The gelatin hydrogels with or without dopant salts possess high ionic conductivity and hence are amenable to use as electrolytes in electrochemical systems.
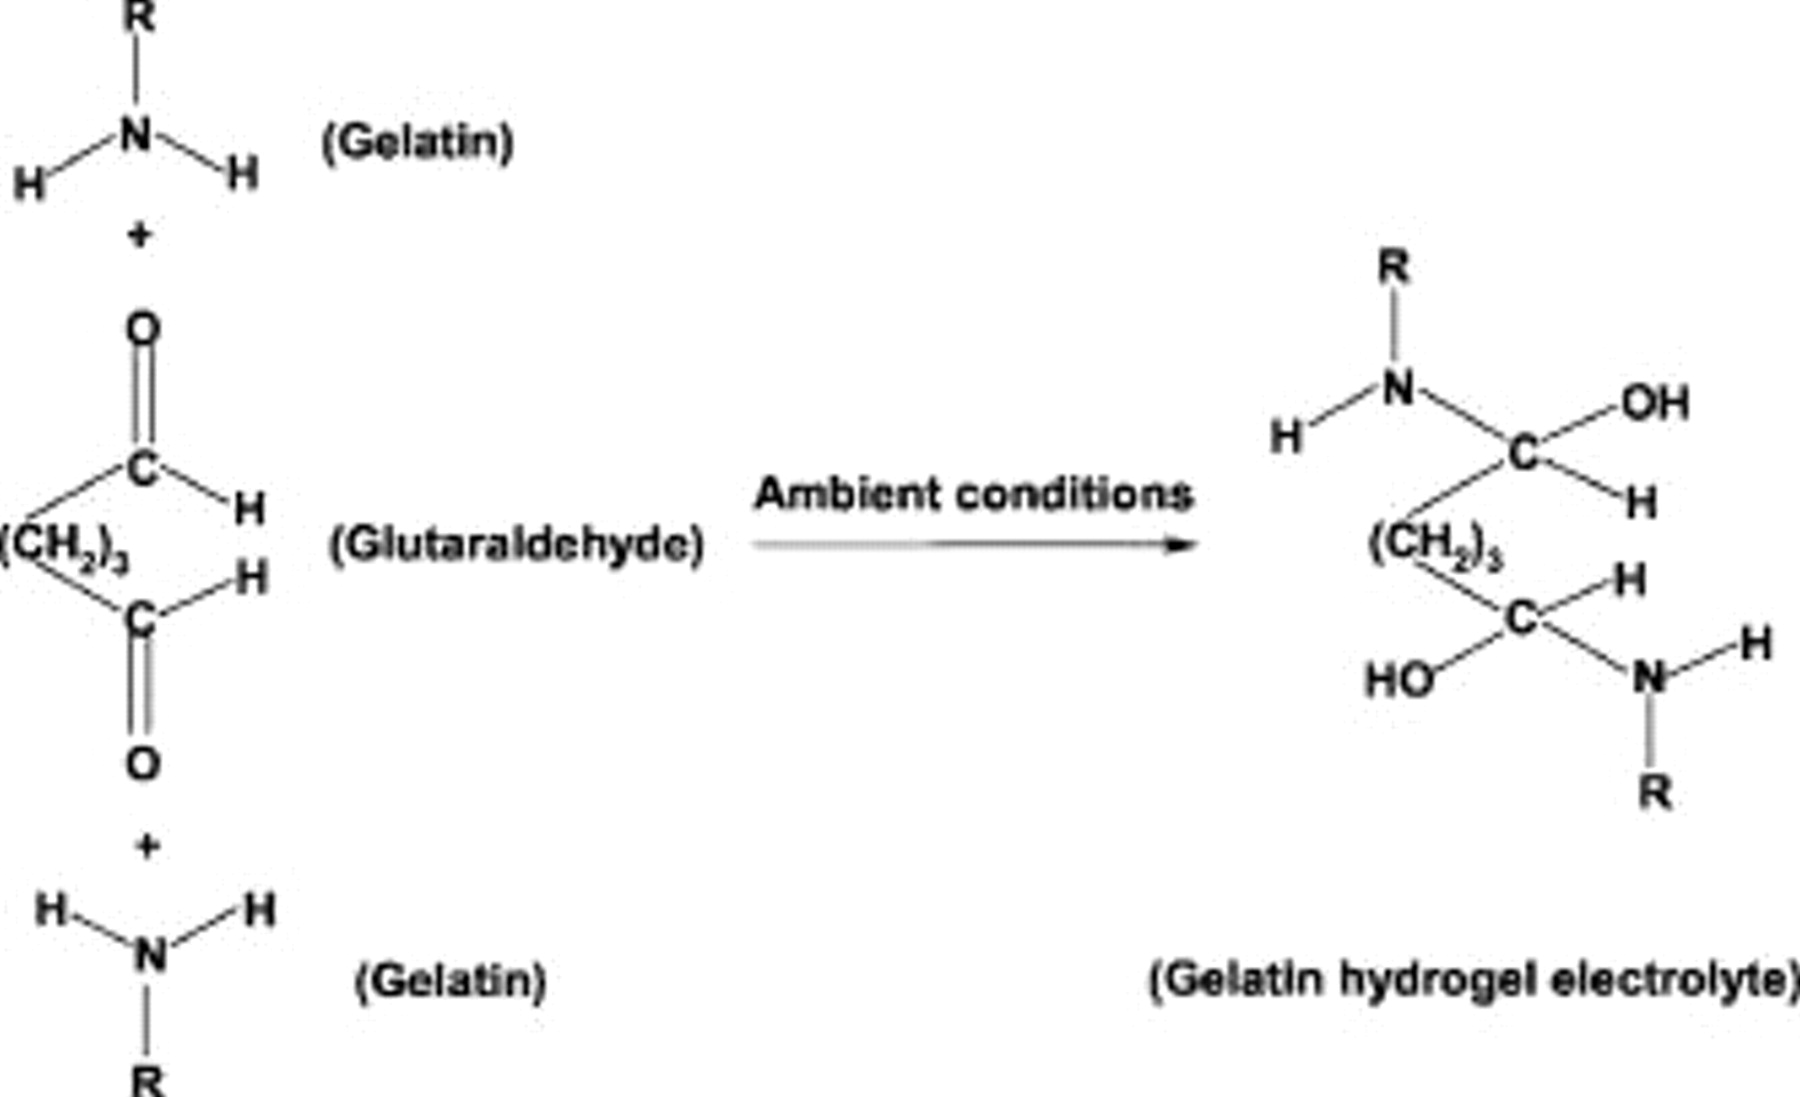
Figure 1. Reaction between aqueous solutions of glutaraldehyde and gelatin to form cross-linked GHE (after Ref. 41).
The GHEs employed in this study are typically semitransparent, light brown, about  thick, and mechanically strong freestanding films with a large amount of water absorbed in the polymer hydrogel matrix. Mechanical strength of the GHEs increases with increasing concentrations of both gelatin and glutaraldehyde solutions.
Scanning electron micrographs for pristine and 
 -doped GHEs are shown in Fig. 2a and 2b, respectively. Both the GHEs show morphologies that are planar with micrometer sized folding. The average size of a folding is about
  for a pristine GHE and about
  for a doped GHE. Due to the decrease in folding size, the folding appeared to be more intense in the doped GHE. The folding is found to form on the hydrogel side that is exposed to air during its preparation. The EDAX spectrum (not shown) for undoped GHE exhibits peaks for C and O, while the EDAX spectrum (not shown) for
  -doped GHE contains peaks due to Na and Cl in addition to C and O.

Figure 2. SEM images for gold-coated GHEs comprised of  aqueous gelatin, cross-linked with 5% (w/v) glutaraldehyde and containing (a) 0 and (b)
 dopants.
In order to study the effect of dopant concentration on the degree of cross-linking, GHEs with varying  concentrations are analyzed by TOPEM, a new advanced multifrequency TMDSC technique that allows both temperature-dependent and time-dependent processes to be separated. The basic principle of TOPEM is to overlay the isothermal or ramped temperature with a time series of stochastic temperature pulses of different durations.53 The TOPEM data for a typical composition are shown in Fig. 3. The midpoint ASTM glass transition temperature
  values for pristine,
 -doped,
  -doped, and
 -doped GHEs were found to be 339.6, 370.7, 376.9, and
  , respectively. The increase of
  values with increasing dopant concentration may be explained on the basis of decreased segmental mobility of the gelatin chains resulting from ionic cross-linking between
  ions and polar segments belonging to different gelatin helices.54

Figure 3. (Color online) Typical DSC TOPEM data for GHEs comprised of  aqueous gelatin cross-linked with 5% (w/v) glutaraldehyde.
The effect of glutataldehyde concentration on the ionic conductivity of GHEs consisting of  gelatin solution and varying amounts of
  was studied. The data shown in Fig. 4a, 4b and 4c correspond to GHEs with 0, 1.5, and
 dopants, respectively. In each of the three cases, there is a decrease in ionic conductivity with increased glutaraldehyde concentration. The decrease in ionic conductivity with increased glutaraldehyde can be understood by considering the GHE as a solid–liquid hybrid phase in which the liquid phase is pure water in the case of pristine GHE, in contrast to aqueous
  in the case of
  -doped GHE and a solid phase consisting of a three-dimensional network resulting from chemical condensation between aqueous gelatin and glutaraldehyde. The continuity in the long-range network of hydrogen-bonded water molecules might not prevail in the cross-linked GHE as in uncross-linked or less cross-linked aqueous gelatin solutions. Consequently, proton transport in pristine GHE by a Grötthus-type mechanism36 will be less effective. The decreased proton mobility resulting from increased glutaraldehyde concentration is responsible for the decreased ionic conductivity in pristine GHE. The water associated with the solid network of glutaraldehyde cross-linked gelatin in the
  -doped GHE might not be as effective as in uncross-linked or less cross-linked gelatin solution to act as a medium for diffusion of
  and
and  ions. This accounts for the decreased ionic conductivity of
  -doped GHE with increased glutaraldehyde concentration. In the GHEs comprised of dilute gelatin solutions, although most of gelatin molecules might be cross-linked, the proportion of solid phase consisting of glutaraldehyde cross-linked gelatin is considerably smaller. Consequently, the resistance offered by the solid phase to ion transport in GHEs comprising dilute gelatin solutions is too low to reflect any dependence of ionic conductivity on glutaraldehyde concentration. Although the ionic conductivity was highest for the GHE with minimum glutaraldehyde concentration of 2% (w/v), its mechanical strength was so low that it posed difficulties in handling as a freestanding film. Because of this, all the subsequent studies on the GHEs were carried out with 5% (w/v) glutaraldehyde as cross-linker.

Figure 4. Plot of ionic conductivity vs glutaraldehyde concentration for GHEs comprised of  gelatin solution and (a) 0, (b) 1.5, and (c)
 dopants.
Figure 5i shows the effect of the concentrations of  and gelatin solution on the ionic conductivity of GHEs. For all the concentrations of gelatin, ionic conductivity increased with increasing
  concentration. Increase in ionic conductivity with increased
  concentration might be due to the increased charge-carrier concentration. Ionic conductivity increased from
  to
to  as
as  concentration in the GHE is increased from 0 to
  . The effect of indifferent electrolytes on the cross-linking of gelatin by dextran dialdehyde in a phosphate buffer has been studied in the literature41 and is reported to have a negative influence on the gelation. But in this study, we have found little retarding influence of added
  on the gelation of gelatin by glutaraldehyde. However, acidic and alkaline dopants have been found to inhibit the cross-linking of gelatin with glutaraldehyde. Retardation of cross-linking of gelatin by glutaraldehyde in the presence of acidic dopants may be due to the repulsion between protonated amino acid groups.55 Increase in gelatin concentration results in a small decrease in ionic conductivity, which might be due to the decreased polymer-free, water-filled volume with increased gelatin concentration. Although the ionic conductivity is highest for the GHE with minimum gelatin concentration
  , its mechanical strength is too low to stand as a freestanding film. Accordingly, the concentration of gelatin in GHEs for all subsequent studies was kept at
  . Ionic conductivity in pristine GHE can be qualitatively explained by considering a host of protons associated with amino, hydroxyl, and thiol groups as well as readily removable small chain fragments present in gelatin that can migrate through the hydrogel under the influence of a small electric field.56 This viewpoint is corroborated by EDAX spectroscopic study on pristine GHE, which suggests the presence of C and O only. Ionic conductivity in the
  -doped GHEs might be the sum of the protonic conductivity possessed by the pristine GHEs and the conductivity due to
  dopant. Because large volume fractions of the GHEs are occupied by water imbibed during gelation, mobility of
  and
and  ions in the
  -doped GHEs might take place by both free diffusion as well as segmental motion-aided mechanism. Figure 5ii shows the CVs for ESs consisting of HDG electrodes and GHEs containing (a)
 , (b)
, (b) 
 , and (c)
 . Irrespective of the dopant concentration, the currents and hence the capacitances in all the CVs are identical in the potential range between
  and
and  . The independence of the capacitance in relation to dopant concentration can be explained on the basis of the low surface area of HDG electrodes. As the low concentration of ionic species available in pristine GHE could have been sufficient to access the entire surface of HDG electrodes, leaving few free active sites for the added dopant ions to be adsorbed and contribute to the capacitance, there was little enhancement in the capacitance with increase in
  concentration in the aforesaid potential region. The data further reflect on the effect of dopant concentration on the potential window of the GHEs. Although all the GHEs are stable in the potential range between
  and
and  , the rate of gas evolution increased with increasing
  concentration. In other words, the electrochemical stability of the GHEs slightly decreased with increasing
  concentration beyond the potential range between
  and
and  . To figure out any redox reaction of gelatin taking place at the electrode/electrolyte interface of the ES during its operation, we have recorded 1000 scans of CVs on an ES comprised of pristine GHE and BPC electrodes at a scan rate of
  . The first and one-thousandth scans of CVs, shown as graphs (a) and (b), respectively, in Fig. 5iii , are near rectangular, with few redox features, revealing that there is hardly any redox reaction taking place at the electrode/electrolyte interface of the ES during its operation.

Figure 5. (i) Plot of ionic conductivity vs  concentration for GHEs comprised of (a) 0.05, (b) 0.10, (c) 0.15, and (d)
  gelatin solution. (ii) CVs for ESs comprised of HDG electrodes and GHEs with (a) 0, (b) 1.5, and (c)
 dopants. (iii) CVs for ESs comprised of BPC/Nafion electrodes and pristine GHE recorded at a scan rate of
  for (a) 1st cycle and (b) 1000th cycle.
Variation of ionic conductivity with temperature for undoped and 
 -doped GHEs was studied in the temperature range between 300 and
  . With increasing temperature, an increase in ionic conductivity is seen despite the evaporation of water from the GHEs during heating. Data (not shown) for both the pristine and doped GHEs fit the Arrhenius equation well with
  values of 0.9. The activation energy for ion conduction decreases from 1.94 to
  as the concentration of
  in the GHE is increased from 0 to
  .
.
CVs for ESs comprised of BPC electrodes and GHEs with 0, 1, 2, and 
 are shown as a, b, c and d, respectively, in Fig. 6i. The specific capacitance, calculated from Eq. 2 at
  , increases from 37.6 to
  as the concentration of
  in the GHE is increased from 0 to
  . The average specific capacitance, calculated using Eq. 3, increases from 35.6 to
  as the concentration of
  in the GHE is increased from 0 to
  . The increase in capacitance with increasing dopant concentration may be explained on the basis of increased accessibility of BPC by dopant ions during charge–discharge cycling. The low concentration of ions present in pristine GHE may not be sufficient to access all the active sites of BPC that possesses high surface area. With increasing dopant concentration, there is a corresponding increase in the number of ions available for electric double-layer formation at the electrode/electrolyte interface, leading to a better utilization of BPC electrode material in the ESs with doped GHEs as compared to pristine GHE-based ESs. The enhanced utilization of electrode material in the ESs with doped GHEs might be responsible for enhanced capacitance of the latter. Specific capacitance values for ESs comprised of varying loadings of BPC electrodes and pristine as well as
 -doped GHEs are summarized in Table I. The specific capacitance values are nearly identical for all the loadings of BPC, and no distinct dependence of capacitance on BPC loading is observed. The independence of specific capacitance on the loading of BPC can be explained by considering that the area of the electrodes are identical and the electrode/electrolyte interfaces are solid/solid in nature; only the outermost layer of BPC is involved in the electric double-layer formation with the GHE while the rest of the BPC in the bulk remains unutilized. It may be surmised that a BPC/Nafion loading of
  is sufficient to yield the optimum value of specific capacitance for the ESs studied here.
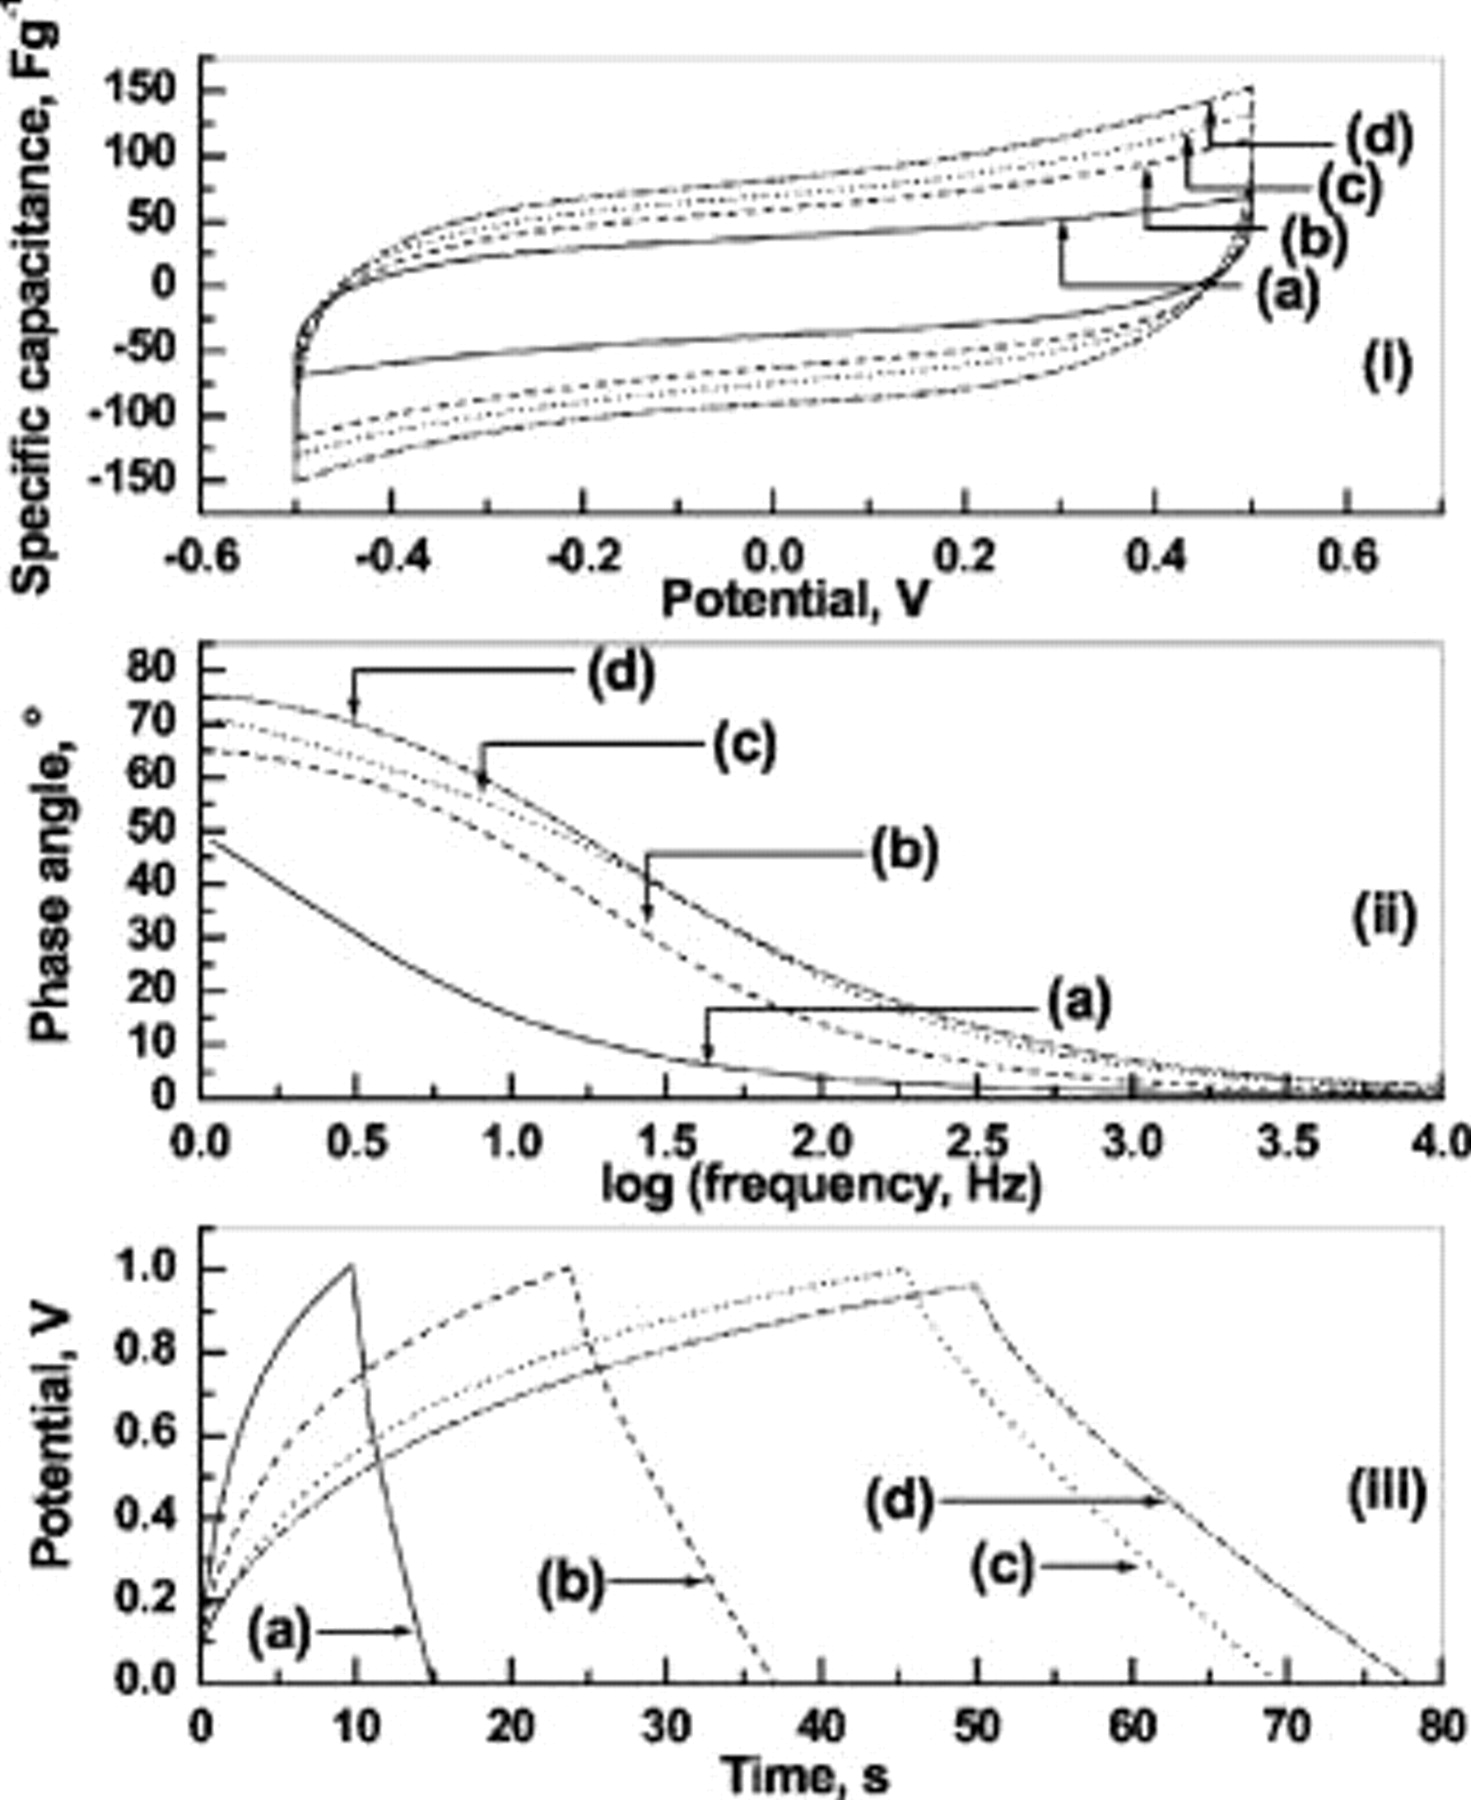
Figure 6. Electrochemical data for ESs with GHEs containing (a) 0, (b) 1, (c) 2, and (d) 
 dopants derived from (i) cyclic voltammetry, (ii) electrochemical impedance spectroscopy, and (iii) galvanostatic chronopotentiometry.
Table I. Specific capacitance values for ESs comprised of varying loadings of BPC/Nafion and pristine as well as 
 -doped GHEs.
Average specific capacitance  of ESs with of ESs with | ||||
|---|---|---|---|---|
| GHE with |
 BPC/Nafion BPC/Nafion |
 BPC/Nafion BPC/Nafion |
 BPC/Nafion BPC/Nafion |
 BPC/Nafion BPC/Nafion |
 
| 35.6 | 44.0 | 29.2 | 36.0 |
 
| 58.8 | 46.0 | 56.4 | 60.8 |
The electrochemical impedance data in Bode form for the ESs with GHEs containing 0, 1, 2, and 
 are shown as (a), (b), (c), and (d), respectively, in Fig. 6ii. The phase angle of ESs at
  increases from 49 to
  as the concentration of
  in the GHE is increased from 0 to
  . The increase in phase angle with increasing dopant concentration suggests an improvement in the capacitative characteristics of the ESs. The galvanostatic chronopotentiometric data for the aforesaid ESs with GHEs containing 0, 1, 2, and
 are shown as (a), (b), (c), and (d), respectively, in Fig. 6iii. With increasing
  concentration in the GHE, an increase in both charge and discharge times is observed. The unequal timescales associated with the first few cycles of the charge and discharge processes for ESs need to be probed further. Enhanced charge–discharge times for the ESs with increased dopant concentration might be due to the availability of more ions, leading to enhanced double-layer charging and discharging. The discharge capacitance increases from 12.4 to
  as the concentration of
  in the GHE is increased from 0 to
  . The results pertaining to the electrochemical studies depicted in Fig. 6 are summarized in Table II.
Table II. Electrochemical data for the ESs comprised of BPC electrodes and gelatin hydrogel electrolytes with varying  concentrations.
| Electrochemical data obtained from | ||||
|---|---|---|---|---|
CVs at 
| CVs by integrating total enclosed area | Bode plot at 
| Galvanostatic chronopotentiomery at 
| |
 concentration (N) concentration (N) | Specific capacitance 
| Average specific capacitance 
| Phase angle 
| Specific capacitance 
|
| 0 | 37.6 | 35.6 | 49 | 12.4 |
| 1 | 58.0 | 58.8 | 65 | 31.2 |
| 2 | 70.4 | 69.6 | 71 | 56.8 |
| 3 | 81.2 | 82.4 | 75 | 70.0 |
The frequency behavior of ESs comprised of GHEs with varying  concentrations was studied by complex power equations. EIS data for ESs are analyzed in the light of information available in the literature51, 57, 58 to evaluate the relaxation time constant
  that corresponds to a phase angle of
  and represents a transition for ES from a resistive behavior for frequencies higher than
  to a capacitive behavior for frequencies lower than
  . These plots allow overarching the entire frequency spectrum for the ESs, ranging from a pure resistance at high frequencies to a pure capacitance at low frequencies. The data suggests that the relaxation time constant decreases from 0.5 to
  as
as  concentration in the GHEs is increased from 0 to
  . The decrease in relaxation time constant for the ESs might be due to the decrease in ESR with increasing dopant concentration.
The specific capacitance, charge–discharge efficiency, and cell resistance for the ESs comprised of pristine as well as 
 -doped GHEs were studied as a function of charge-discharge cycles recorded at
  and the data are shown in Fig. 7. Data (a) and (b) in Fig. 7i show the variation of specific capacitance with cycle number for the ESs with undoped and
 -doped GHEs, respectively. The charge-discharge efficiency as a function of cycle number for the ESs with undoped and
 -doped GHEs are shown as data (a) and (b), respectively, in Fig. 7ii. Data (a) and (b) in Fig. 7iii depict the variation of cell resistance for the aforesaid ESs with undoped and
 -doped GHEs, respectively. The ES with
 -doped GHE has a higher discharge capacitance of
  vs
vs  with pristine GHE. The charge–discharge efficiencies for the ESs with both undoped and
 -doped GHEs are as low as ca. 50% for the first charge–discharge cycle, which gradually increases to ca. 85% for the one hundredth cycle. The ES with
 -doped GHE has nominally higher charge–discharge efficiency as compared to the ES with pristine GHE. The relatively low charge–discharge efficiency of the ESs is due to the low current density employed. This is evident from chronopotentiometric study of the pristine GHE-based ES carried out at varying current densities. As shown in Table III, the charge–discharge efficiency increases from 52 to 100% as the current density is increased from 0.1 to
  . As the current density increases, the time required to attain the cutoff voltage of
  decreases, which affects formation of the electric double-layer, leading to an increase in efficiency.59 The cell resistance for the ES with
 -doped GHE is
  , as compared to
  for the ES with undoped GHE. The lower cell resistance for the doped GHE-based ES as compared to the pristine GHE-based ES could be mainly due to the higher ionic conductivity for the doped GHE. The specific capacitance and charge–discharge efficiency decrease while cell resistance increases with increasing cycle number. The ES with
 -doped GHE exhibits a longer life of
  over 900 charge–discharge cycles as compared to the ES with pristine GHE that has endurance of only
  over 1700 cycles. The faster increase in ESR of the ES with
 -doped GHE as compared to that of pristine GHE-based ES might be due to the faster degradation of the
 -doped GHE during charge–discharge cycling. The difference in the degradation rates of doped and pristine GHEs can be explained on the basis of the difference in the mode of ionic transport. Ionic conduction in pristine GHE takes place by the Grötthus-type mechanism of proton transport, whereas that in
  -doped GHE takes place predominantly by free diffusion of hydrated
  and
and  ions. As described earlier,36 transport of protons in aqueous media by a Grötthus-type mechanism takes place along chains of hydrogen-bonded water molecules. In this mechanism, transport of protons take by alternation of covalent and hydrogen bonds with little physical movement of protons. This mechanism explains the facile transport of proton and accounts for its highest conductivity among all the ions.
  and
and  ions in aqueous media such as doped GHEs are associated with a large hydration shell. During charge–discharge cycling of ESs,
  and
and  ions with their large shells of hydrated water molecules shuttle back and forth between the electrodes. The ionic shuttling in ESs takes place at high rates due to their high power density. Because of the fast potential-driven migration of hydrated
  and
and  ions back and forth between the electrodes during charge/discharge cycling, the doped GHEs might get damaged faster than pristine GHEs, with a consequent faster increase in cell resistance in the doped GHE-based ES; this is evident in Fig. 7iii. The decrease in both the specific capacitance and charge–discharge efficiency and increase in cell resistance for the ESs during cycling might be due to the gradual evaporation of water from the GHE, which turns into a dry mass at the end of the day-long experiment carried out in ambient conditions of temperature, pressure, and humidity. This can be substantiated from the study of capacitor performance as a function of time during which the capacitor was kept at open-circuit condition in a closed chamber maintained at 100% relative humidity. There was only a small decrease in capacitance during the first
  of operation, subsequent to which the performance was almost invariable. The capacitive performance data for the ES for 10 days of operation are shown in Table IV.

Figure 7. Plots of (i) specific capacitance, (ii) charge-discharge efficiency, and (iii) cell resistance as a function of charge–discharge cycle number for ESs with GHEs containing (a) 0 and (b) 
 .
.
Table III. Charge–discharge efficiencies for pristine GHE-based ES as a function of current density.
Current density 
| 0.1 | 0.2 | 0.3 | 0.4 | 0.5 | 0.6 | 0.7 | 0.8 | 0.9 | 1.0 |
| Charge–discharge efficiency (%) | 52 | 80 | 85 | 89 | 91 | 93 | 91 | 95 | 94 | 100 |
Table IV. Average specific capacitance values for pristine GHE-based ES evaluated by keeping it in a closed chamber maintained at 100% relative humidity.
| Time (day) | 0 | 1 | 2 | 3 | 4 | 5 | 6 | 7 | 8 | 9 | 10 |
|---|---|---|---|---|---|---|---|---|---|---|---|
Average specific capacitance 
| 43.6 | 40.8 | 37.6 | 36.4 | 36.0 | 36.8 | 36.8 | 37.6 | 37.6 | 37.6 | 38.0 |
Corrosion of graphitic carbon in aqueous sodium chloride medium has been extensively studied in the literature.60–64 According to Rabah et al. ,60 during electrolysis of brine employing graphite electrodes, some carbon atoms are ionized followed by adsorption of chloride ions on certain active sites on the anode. The adsorbed chloride ions then react with partially ionized, positively charged carbon atoms to form  , which is water-soluble and could decompose to carbon, carbon monoxide, carbon dioxide, chlorine, and water. Further investigation by Rabah et al.60 on the effect of chloride ion concentration suggested that the chloride ions are adsorbed on the available surface, leaving a minor fraction of chloride ions to react with graphite and the major portion shielding the anode surface from further corrosion, the obvious consequence being that the rate of corrosion decreases with increasing brine concentration. The rate of corrosion of carbon reportedly60 increases with bath temperature and operational current density. A typical graphite anode corrosion rate in brine at
  and
and  current density is reported to be
  . In the present study, however, the operational temperature and current densities of the ESs are considerably low
  . Accordingly, the effect of the aforesaid corrosion could be negligibly small. For practical devices, it would be essential to mitigate the corrosion of carbon for their longevity; this could perhaps be achieved by adequate treatment of the carbon surface.
Conclusion
In this study, cross-linked GHEs with semi-interpenetrating network have been realized and characterized by various solid-state techniques in conjunction with electrochemistry. GHEs are light brown, semitransparent, and mechanically strong freestanding films with a large volume of water imbibed in the hydrogel matrix. Upon the addition of 
 ,
,  for the GHE increased from 339.6 to
  . Ionic conductivity of the GHEs increases from
  to
to  as the dopant concentration is increased from 0 to
  . Ionic conductivity of the GHEs decreases with increase in the concentration of gelatin and glutaraldehyde precursor solutions. Temperature dependence of ionic conductivity for both pristine and
 -doped GHE follows the Arrhenius equation with activation energies of 1.94 and
  , respectively. The study further demonstrates that it is possible to assemble and operate all-solid-state ESs with pristine and doped GHEs. Using BPC electrodes, a specific capacitance of
  is obtained with pristine GHEs vs the value of
  obtained with
 -doped GHEs. For identical ESs, the phase angle increases from about 49 to
  , while the relaxation time constant decreases from 0.5 to
  when the concentration of
  in the GHE is increased from 0 to
  . ES with pristine GHE exhibits a shorter cycle life of
  vs
vs  for ES with
 -doped GHE. Capacitive properties of the ESs such as specific capacitance, phase angle, cell resistance, time constant, and charge–discharge efficiency improve with increasing dopant concentration.
Acknowledgments
N. A. Choudhury is grateful to the Council of Scientific and Industrial Research, New Delhi, for a Research Fellowship. S. Ramu is thanked for many helpful discussions.
The Indian Institute of Science assisted in meeting the publication costs of this article.