
Abstract
 ,
,  ,
,  , or
, or  ion with an atomic radius similar to or smaller than that of
  ion was doped into the Fe site to synthesize
  samples using a solution method. The mean particle size of all samples, independent of doping species, was about
  . All samples in this study contain a carbon content of about
  and have a similar Brunauer–Emmett–Teller surface area (about
  ). The synergetic effect of the supervalency and larger atomic size of the doping element will induce the lattice expansion and Li–O bond lengthening of the olivine structure. The lengthening and weakening of the Li–O bond will be beneficial to the electrochemical performance of cathode materials especially under the high C rate. Hence, the
  powder with the largest volume of unit cells (longest Li–O bond length) exhibits the highest discharging capacity of 152 and
  at C/10 and 1C rates, respectively.
Export citation and abstract BibTeX RIS
Among the several materials under development for use as cathodes in lithium-ion batteries, lithium iron phosphate  has been recognized as a promising candidate for the cathode of Li batteries due to the low cost, environmental benignity, cycling stability, and high theoretical capacity of
  .1–3 However, the poor conductivity, resulting from the low lithium-ion diffusion rate and low electrical conductivity in the olivine structure of
  , has posed a bottleneck for commercial applications. Improvements of poor conductivity have been achieved in two ways. One way is synthesizing small, monodispersed particle size,4–9 and forming electrically conductive coating on materials.10–12 Another way is doping some ions in the Li site to improve conductivity.13–16
The density functional theory-based calculations on  (
( , Mn, Co, and Ni) show that the lowest Li migration energy for the nonlinear pathway along the [010] channel is a curved trajectory between Li sites.17 With such a one-dimensional pathway, there is also the possibility that long-range Li conduction will be easily blocked by Li site doping.18 Hence, Fe-site doping may be another promising and feasible strategy.
In this work, we attempt to substitute  with the doped ion (
 ,
,  ,
,  , or
, or  ) with an ionic radius similar to or smaller than that of
  to form
  samples to improve electrochemical performance.
Experimental
Synthesized precursor
The  and
and  (
( ,
,  ,
,  , or
, or  ) were prepared by the solution method.4 The iron powder was immersed and dissolved in the aqueous solution containing
  , LiOH, citric acid, polyvinyl acetate, and the doping precursor. The doping precursor includes
  (98%, Wako),
  (98%, Wako),
  (99.6%, First), or
  (99%, Wako). The powdered products of the reaction, in the form of slurry, could be
  and
and  . The slurry mixture was atomized and dried into powders by the spray-dry method. These as-sprayed powders were subsequently calcined at
  for
for  in a nitrogen atmosphere. In this work, the synthesized powders with various doping in the lithium iron phosphate included
  (LFP),
  (LFMgP),
  (LFVP),
  (LFNiP), and
  (LFAlP).
Structural and morphological characterization
The crystalline structure of the prepared  powders was measured with a Shimadzu XRD-6000 diffractometer (Cu
  radiation at
  ,
,  ). The crystal structure parameters for the lithium iron phosphate were refined by Rietveld analysis using the General Structure Analysis System. The diffraction data were collected for
  at each 0.02° step width over
  ranging from 15 to 115°. The morphology can be observed by scanning electron microscope (SEM) (Hitachi S-800) equipped with energy-dispersive X-ray spectrometry (EDS). EDS and elemental mapping were used to clarify the existence and distribution of doping materials, phosphorus, and iron. The amount of C, N, and H was determined using an elemental analyzer (HERAEUS VarioEL-III for CNH). The particle size distribution was quantitatively determined by the optical particle size analyzer (Beckman Coulter LS 13 320). The Brunauer–Emmett–Teller (BET) specific surface area of
  powder measurement was performed by the
  adsorption–desorption method (Beckman Coulter SA 3100).
Electrochemical characterization
The synthesized powders were used to prepare cathode electrodes by mixing  carbon black and
  polyvinylidene fluoride with the synthesized powders in
  -methyl-2 pyrrolidone solution, followed by tape-casting, drying, and punching into disk electrodes. The cyclic voltammetry (CV) of the synthesized powders was investigated with a three-electrode cell comprised of the working electrode, Li foils as the counter and reference electrodes.
 in ethylene carbonate–diethyl carbonate (EC–DEC) solution was used as an electrolyte. The CV was carried out at a scanning rate of
  in the range of
  vs
vs  . The cycling performance of the prepared powders was studied with coin-type cells with lithium metal as the anode,
 in EC–DEC solution as the electrolyte. The prepared cathode galvanostatically charged and discharged over a voltage range of
  at different C rates in a multichannel battery tester.
Results and Discussion
Powder characterization
For all of the  and
and  samples in this study, the carbon content, determined from an elemental analyzer, was controlled within about
  . Because both the synthesized particles and pyrolysis carbon are from the aqueous precursor, the carbon can be evenly distributed to promote the electrical conductivity by a small quantity of carbon.19 Regardless of the difference in doping, the mean particle size of all samples was about
  , measured by the optical particle size analyzer and SEM observation. At the same time, all particles in this study had a similar BET surface area (about
  ).
).
Microstructure of the powders
The SEM images of  and their elemental mappings of Fe, P, and V, as shown in Fig. 1, indicate that the secondary particle (around
  ) is composed of an agglomeration of small primary particles and the doping element is uniformly distributed over all the particles. Other samples with different doping have similar results. Although the chemical composition distribution of particles prepared by the solution method is homogeneous as expected, X-ray diffraction (XRD) is still required to verify if the doping element is incorporated in the lithium iron phosphate crystal.
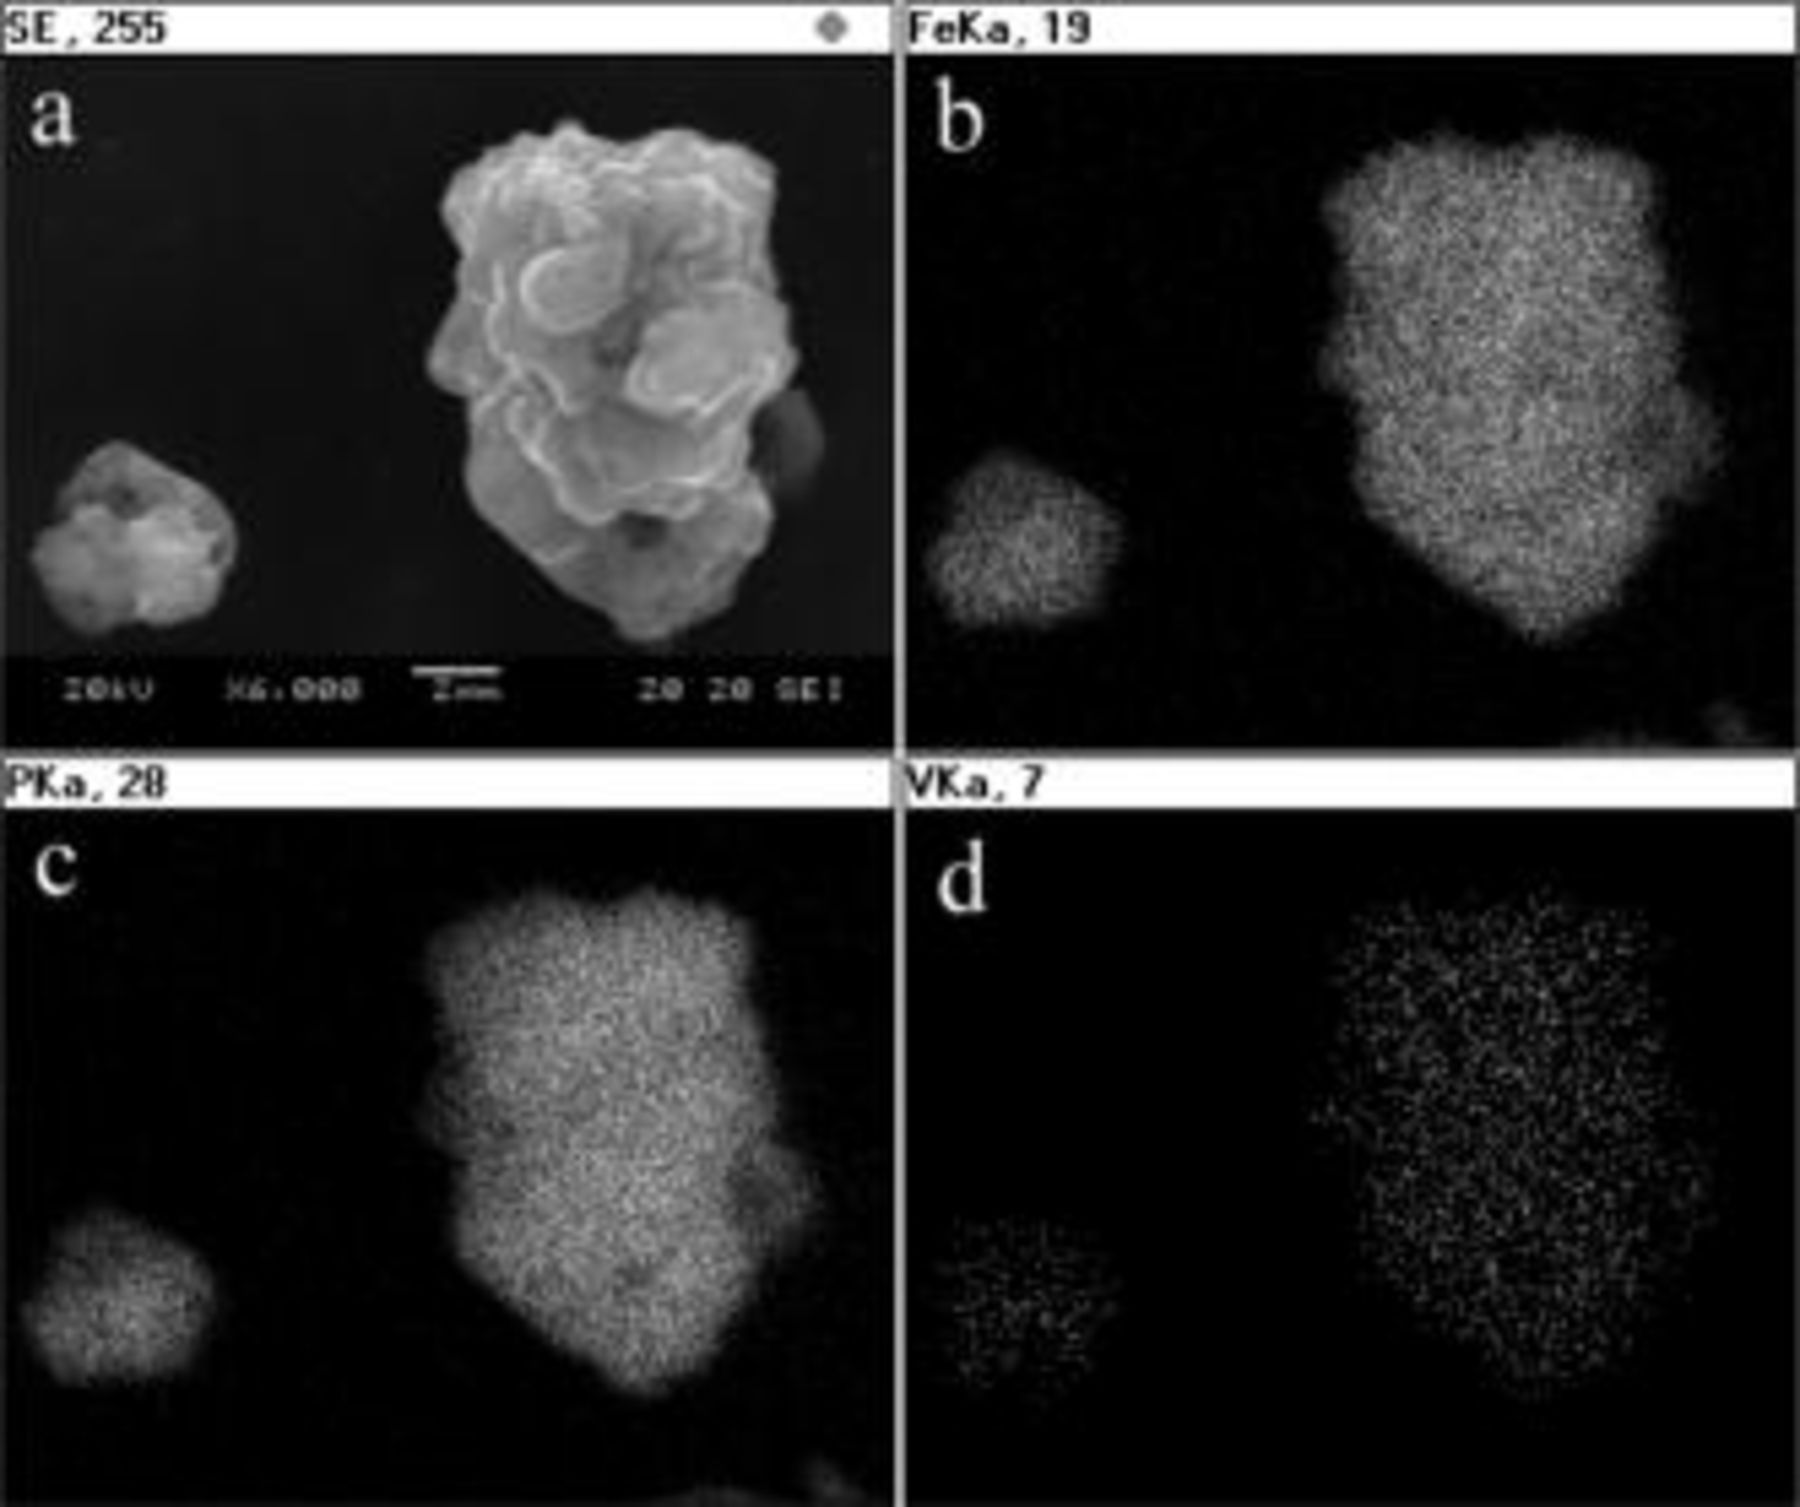
Figure 1. Elemental mapping and SEM image for  sample. (a) SEM image of
  sample, (b) elemental mapping for Fe, (c) elemental mapping for P, (d) elemental mapping for V.
Crystalline structure analysis
Figure 2a shows the XRD diffraction patterns of the  and
and  that were synthesized at
  for
for  in nitrogen atmosphere. The diffraction patterns of all samples were indexed to an orthorhombic crystal structure, and no other impurity phases were detected. The lattice parameters for the
  and
and  were refined by Rietveld analysis. The best refinement model was chosen from a
  space group. The typical XRD pattern refinement of
  is shown in Fig. 2b. The results of refinement of all the samples are listed in Table I.
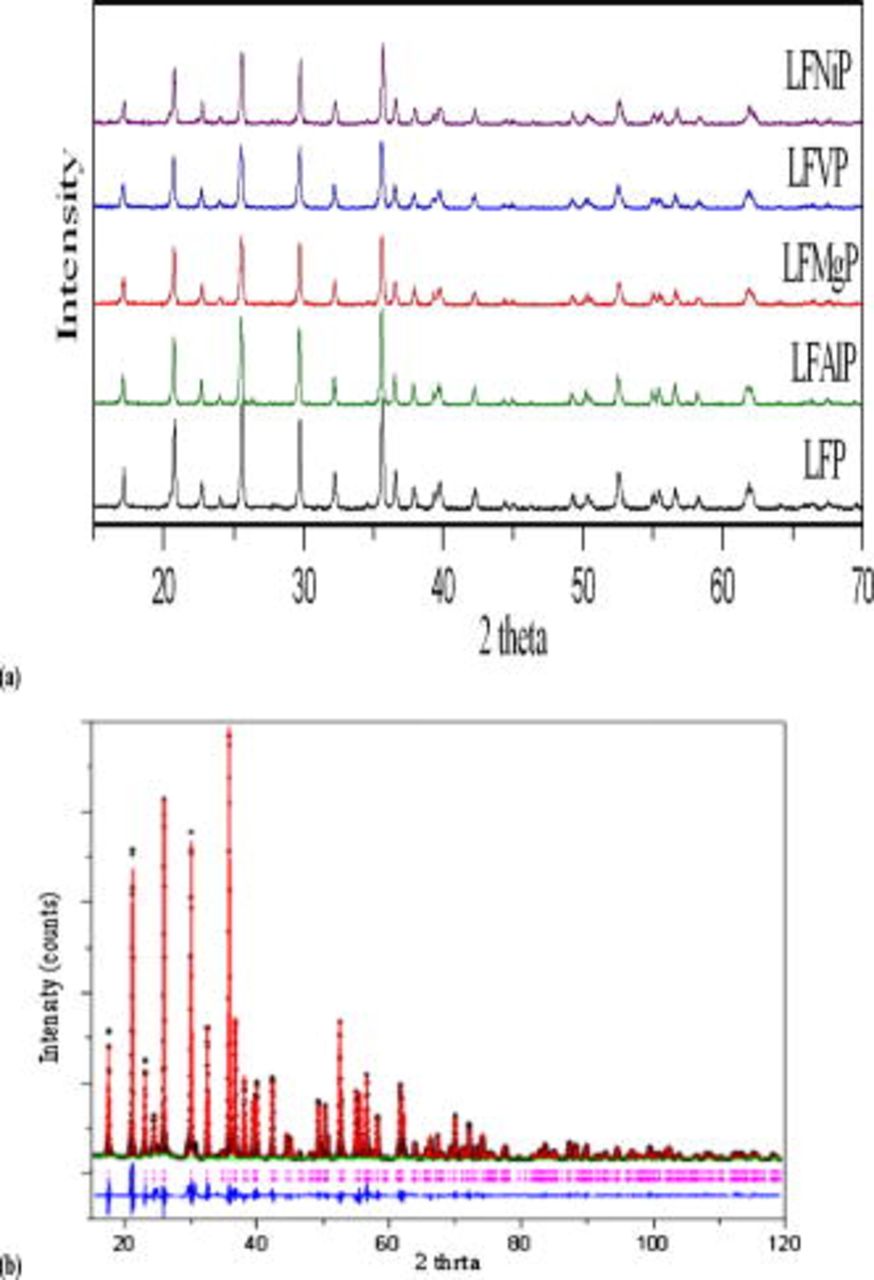
Figure 2. (a) XRD patterns of the synthesized powders with various materials doped (M) in the  samples composition of LFP, LFMgP, LFVP, LFNiP, and LFAlP. (b) Rietveld refinement of
  sample.
Table I. Results of structural analysis obtained from XRD Rietveld refinement of  and
and  .
.
Space group:

| |||||
|---|---|---|---|---|---|
| Sample | LFP | LFMgP | LFAlP | LFNiP | LFVP |
| Doped atomic radius (Å) |

|

|

|

|

|
| Displace ion radius (Å) |

|

|

|

|

|
| Lattice constant (Å) |


|


|


|


|


|
Lattice volume 
| 290.45 | 290.36 | 290.68 | 290.01 | 291.00 |
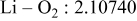
| Interatomic distances (Å) |
|
|
|
|
|
Reliability factors , ,  , , 
|


|


|


|


|


|
Because  and
and  are less than 10% and
  is less than 3, the Rietveld refinement results are reliable. Because Ni has a smaller atomic radius than Fe, LFNiP powder with Ni doping has smaller lattice constants and unit cell volume than LFP, as shown in Table I. LFMgP with Mg doping of similar atomic size to Fe shows similar lattice constants and unit cell volume to LFP. LFVP with V doping of atomic sizes larger than Fe exhibits larger lattice constants and unit cell volume. It can be concluded that the volume of the unit cell increases with the increasing of the radius of the Fe-site doping atom. The substitute doping for Fe ion in the
  crystal structure can account for the shift of the lattice constant. The shift can also imply that the doping element has been successfully incorporated into the parent phase.
Electrochemical performance
The discharge curves of various samples under a C/10 rate to a cutoff voltage between 2.5 and  are shown in Fig. 3a. Compared to LFP, the doping seemingly does not remarkably improve the specific capacity. However, it is obvious that the samples prepared from precursors containing a doping ion with a higher valency will exhibit a more specific discharge capacity, although the valency of V in
  will change from pentavalency to trivalency after sintering. This is confirmed from the V
  -edge X-ray absorption near-edge structure (XANES) spectra shown in Fig. 4. Under a 1C rate, the doping effect seems more pronounced, as shown in Fig. 3b. The extent of the discharge capacity increase due to the doping is in the order of Ni, Mg, Al, and V (from better to the best). The
  powder with the largest volume of unit cells (longest Li–O bond length) exhibits the highest discharging capacity of 143 and
  at C/10 and 1C rates, respectively. These electrochemical performances of samples doped with the element of higher valency also excel compared to the samples doped with
  (such as
  , or
, or  ), reported elsewhere.20, 21 All the doped
  samples exhibited a good capacity retention without obvious capacity fading within
  , as shown in the inset of Fig. 3. It can be concluded that the samples with a doping element of higher valency exhibit a higher specific discharge capacity, especially when a high C rate charge/discharge is implemented. From the result of the doping with the same valency, it is evident that the doping with a larger atomic size will be beneficial to the electrochemical performance under a high C-rate.
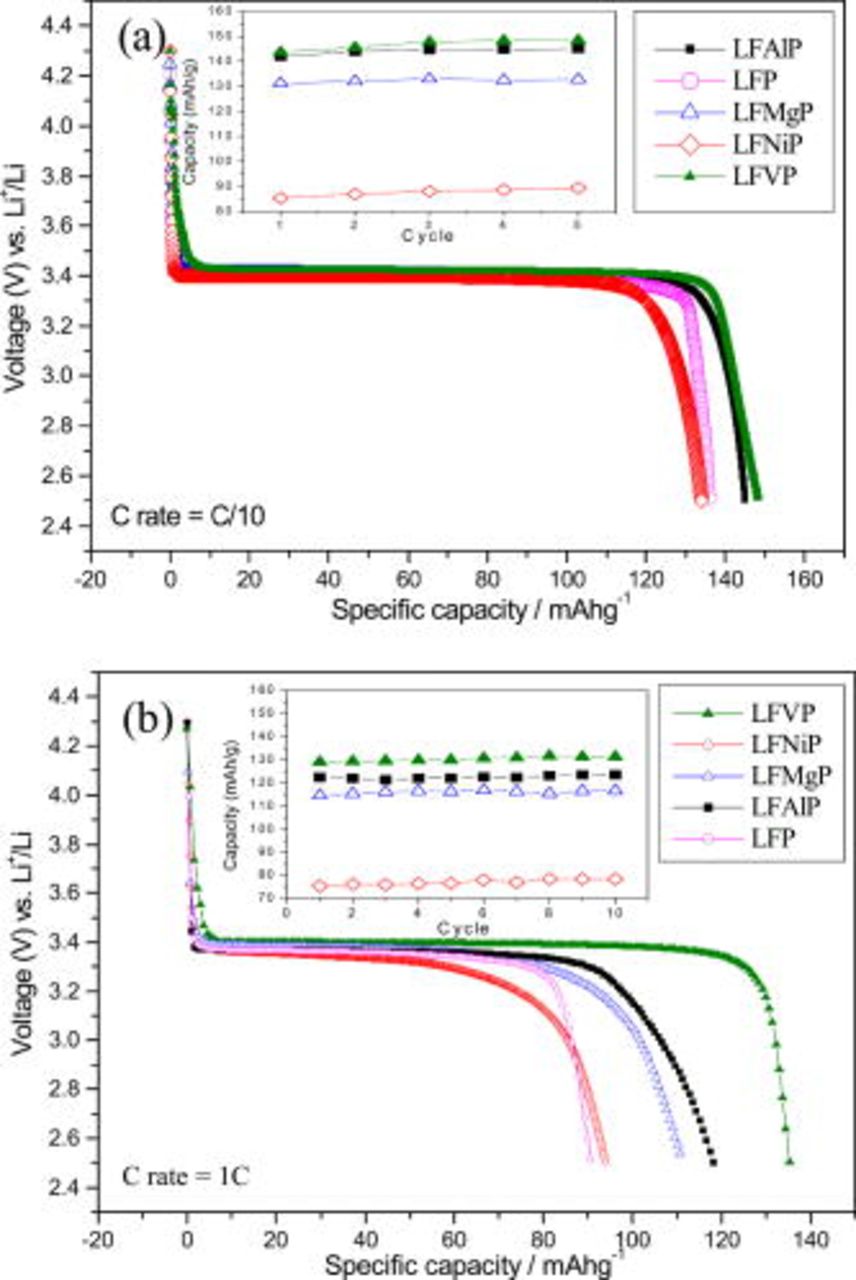
Figure 3. (a) The discharge curves of  samples under C/10 at the 10th cycle. (b) The discharge curves of
  samples under 1C rate at the 10th cycle.
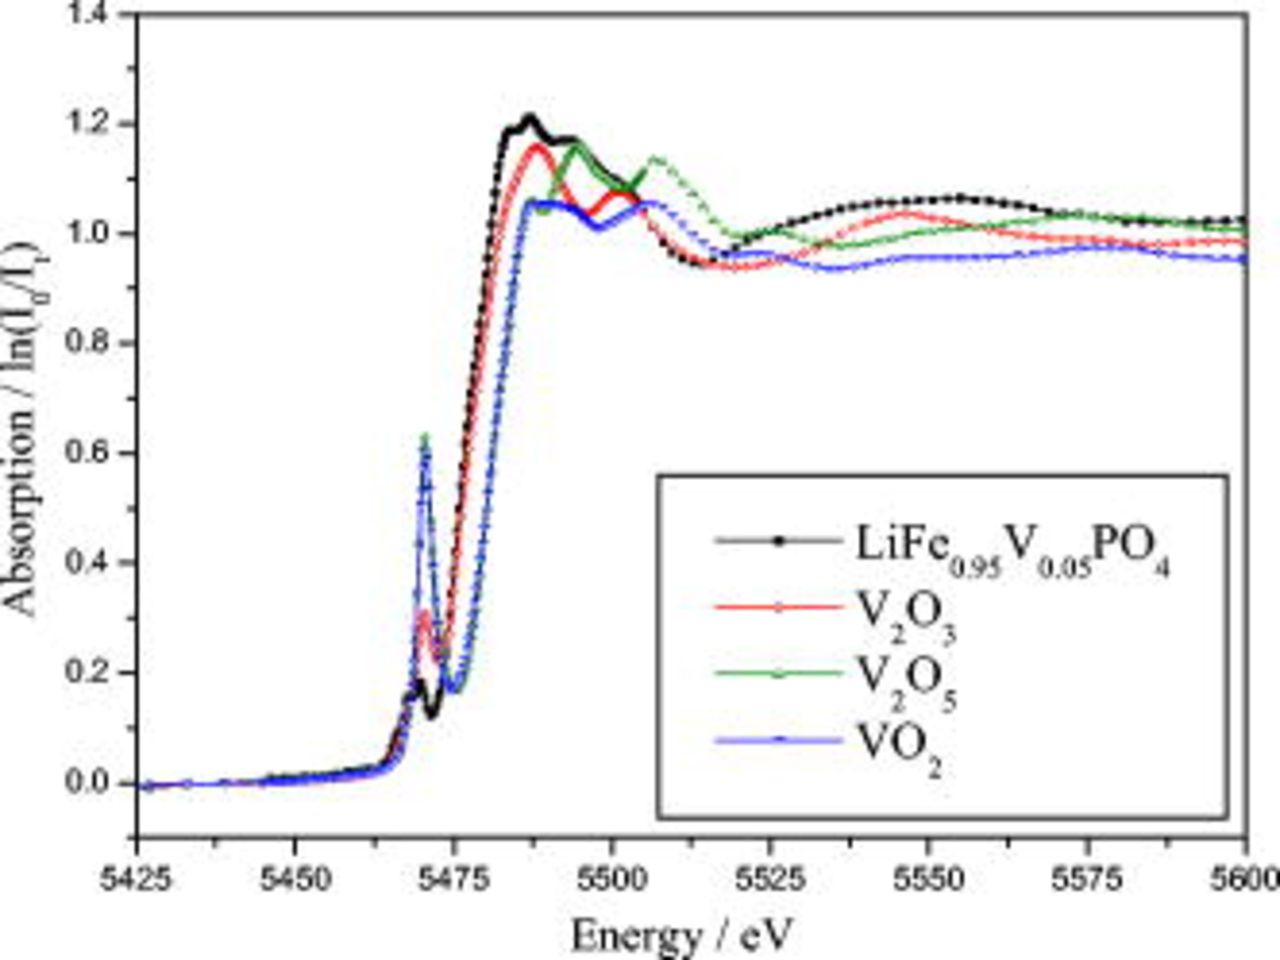
Figure 4. Comparison of V  -edge XANES spectra of the model compounds (
 ,
,  ,
,  , and
, and  ) with standard vanadium oxides.
Although the methodology (doping with atoms of high valency and atomic sizes) to improve the lithium iron phosphate is found in this work, Rietveld refinement may further reveal the mechanisms of improvement. As illustrated in Table I, the Li–O bond length seemingly follows a monotonic increase with the increase in specific discharge capacity. For the charge/discharge process, the Li–O bond lengthening will facilitate  extraction/reinsertion in the
  crystal structure. Moreover, a longer Li–O bond will have a smaller binding energy, leading to the easy migration of
  due to the reduction of the energy barrier. For the doping with the same trivalency as indicated in Table I, the lattice constant and volume of the unit cell of the sample with V doping are apparently larger than that of the sample with Al doping. As predicted, the LFVP samples will have a longer Li–O bond length than the LFAlP sample. Hence, it is reasonable that LFVP exhibits a better electrochemical characterization under a high-C rate, as shown in Fig. 3b. A similar phenomenon has been observed for the sample doping with Mg and Ni ions of divalency. The shortest Li–O bond length in LFNiP with nickel doping can account for the poorest electrochemical characterization under a high-C rate (1C). Hence, it can be concluded that the synergetic effect of the supervalency and larger atomic size of doping element will induce the lattice expansion and Li–O bond lengthening of the olivine structure. The lengthening and weakening of the Li–O bond will be beneficial to the electrochemical performance of cathode materials, especially under the high-C rate.
The CV measurement can clarify the effects of dopant on  electrodes by identifying the characteristics of the redox reactions in Li-ion cells. The redox potential in CV profiles is consistent with potentials where a flat charging or discharging plateau happens, as shown in Fig. 5. The cathodes exhibited oxidation peaks at
  and reduction peaks at
  . Because no additional redox peaks in CV curves have been found, the dopant does not participate in the redox reactions. In those redox reaction curves the profile of LFVP was more symmetric and sharp, exhibiting an anodic peak at
  and a corresponding cathodic peak at
  . The potential interval of LFVP was
  . This elucidates the fact that
  redox pairs are easy to obtain, and the loss of electrons in
  crystal structures during the lithium-ion insertion and extraction process. That is, the well-defined peaks and smaller value of the potential interval show the enhancement of electrode reaction reversibility. The most reversible redox reaction of the cells containing LFVP is consistent with the fact that cells containing LFVP exhibit the highest discharge capacity.
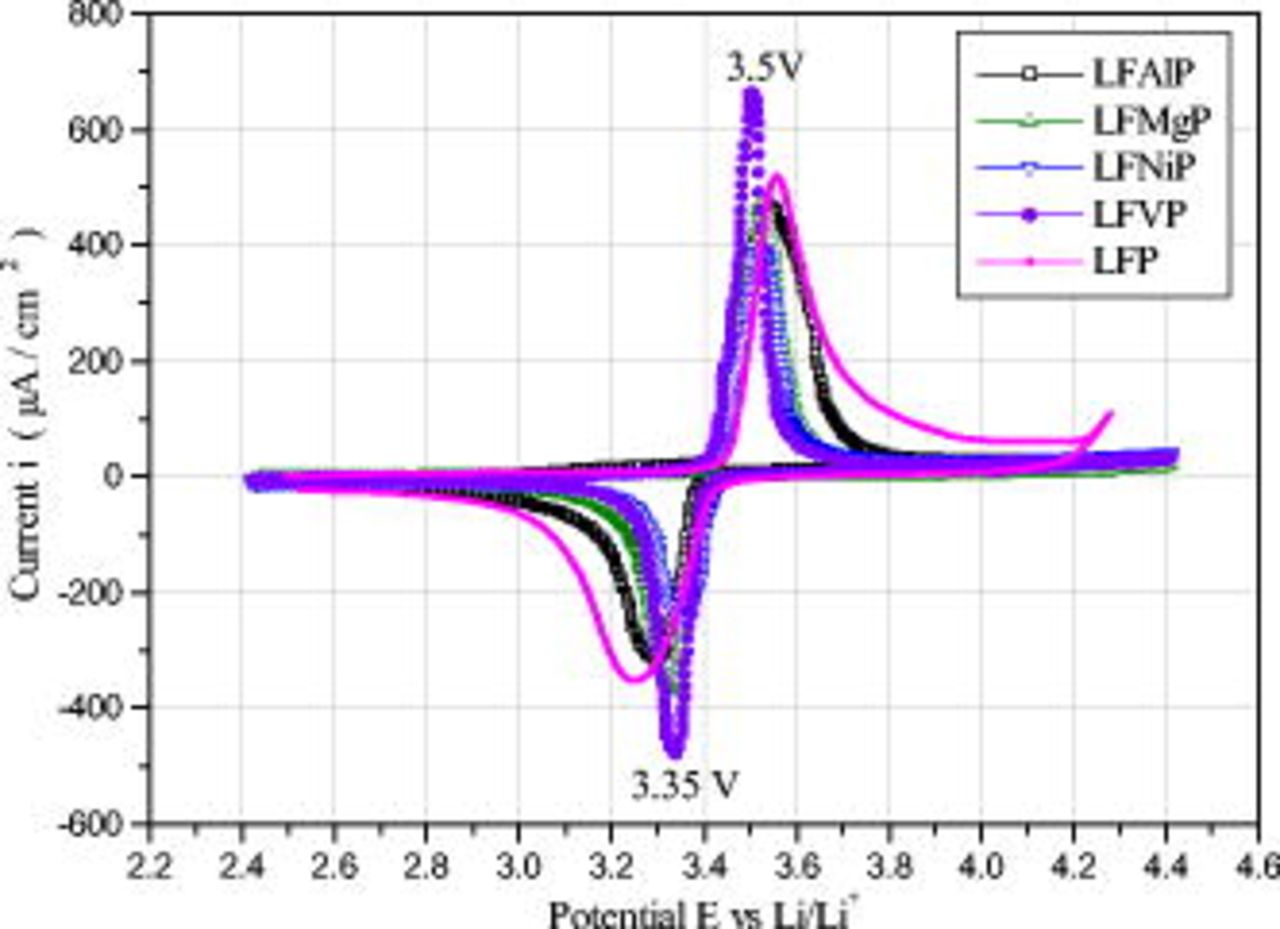
Figure 5. First CV profile of M-doping  electrode in EC-DEC (1:1) electrolyte cell with Li counter and reference electrodes, carried out at room temperature with the scan rate of
  .
.
The peak current equation of quasi-reversible reaction is  , where
  is the oxidation peak of maximum current;
  is oxidization electron number per molecule;
  is specific surface area of electrode material contact with electrolyte;
  is Faraday's constant;
  is
is  diffusion velocity;
  is the scanning rate, and
  is an irreversible constant about 0.78.22–24. The diffusion coefficients of
  in LFVP, LFMgP, LFAlP, LFP, and LFNiP estimated from CV curves by this equation are
  ,
,  ,
,  ,
,  , and
, and  , respectively. The results revealed LFVP has a faster
  diffuse velocity than other samples, and the result is consistent with the results of electrochemical performance and crystal structure parameters.
Conclusions
 (
( ,
,  ,
,  or
or  ) powders with similar particle size, surface area, and similar content of carbon coating were prepared by the solution method. The synergetic effect of the supervalent doping and lattice expansion is beneficial to the electrochemical performance of cathode materials. The doping will not introduce a new phase. The unit cell volume and Li–O bond length of olivine structures increase with increasing radius of the Fe-site doping atom. It is found that the increase in volume of unit cells will lead to increasing the discharging capacity and reducing capacity fade at C/10 and 1C rates. The improvement in electrochemical performance can be attributed to the increase in the Li–O bond length, which facilitates the movement of the
  ion in the crystal.
Acknowledgments
The authors acknowledge the financial support of the National Science Council (Taiwan) under the grant NSC 96-2221-E-036-026 and of Tatung Company.
Tatung University assisted in meeting the publication costs of this article.