Abstract
A model of electrocodeposition is developed for an unsubmerged impinging jet electrode system. The rate of particle incorporation has been described via the particle flux to the electrode, which was found to be mainly governed by convectional diffusion. The influence of gravitational and buoyancy forces was determined to be negligible for  nanoparticles, but influential for larger agglomerates. The probability for particles to be in the neighborhood of the electrode was used to fit the theoretical predictions to the experimental results for copper and nickel-alumina nanocomposite films made with a wide range of process variables.
Export citation and abstract BibTeX RIS
There is an increased scientific and technological interest in the preparation of nanocomposite materials consisting of nanosized particles in a continuous metal matrix.1–4 A suitable method for their preparation is the electrocodeposition (ECD) from plating baths containing a dispersion of nanoparticles.5, 6 A large variety of composite films have been deposited using this method. For example, particles of pure metals, oxides, carbides, carbon nanotubes, and microcapsules have been successfully incorporated in matrix materials such as Au, Cu, Ni, and Co.2, 7
However, thus far the process of particle codeposition is not very well understood and it would be highly desirable to have predictive models.2 The amount of particle incorporation within the metallic matrix is determined by the process variables of the ECD system. The composite film formation is governed by the metal plating rate and the particle flux to the electrode.8–10 The metal growth rate can be easily tuned by varying the applied plating current density, whereas the particle flux depends on a variety of variables, such as particle size, particle loading of the electrolyte, hydrodynamics, and electrode configuration. Vereecken et al.8 and Shao et al.9 analyzed the nanoparticle flux during ECD via the forces acting on a single particle. Their model described the codeposition of  nanoparticles with nickel from a sulfamate electrolyte using a rotating disk electrode (RDE). The incorporation results were presented as a function of the current density and the electrode rotation rate. Recently, Lee and Talbot10 developed a model to predict the experimental results from the ECD of alumina nanoparticles with copper using a rotating-cylinder electrode (RCE) adapting the models of Vereecken et al.8, 9 and Celis et al.11 In their model, the basic approach of Vereecken et al.8, 9 was modified by replacing the transport parameters of the RDE by those of the RCE system. Moreover, the dependency of the flux of particles to the electrode on the current density was described by the concepts presented by Celis et al.11 (i.e., a distinction between charge transfer and mass transfer control was implemented). The model can be used to predict the amount of particle incorporation in the kinetically as well as in the mass transfer limited region of the ECD with an RCE. Nevertheless, a few experimental data points are necessary to quantify the value of certain fitting parameters.10
In the present study, we apply the model of Vereecken et al.8 and Shao et al.9 to describe the codeposition of  nanoparticles with copper and nickel from acidic electrolytes using an unsubmerged impinging jet electrode (IJE) system. In our previous papers,12–14 we have extensively discussed the composition as well as the structure and properties of the resulting composite films by using an IJE system. Here we model the particle incorporation results by taking into account the particle flux to the electrode and the metal deposition rate.
Experimental
An unsubmerged IJE system was utilized for the ECD of Cu and Ni-alumina nanocomposites. A detailed description of the experimental setup can be found elsewhere.13, 15 In this system, the electroplating cell was directly placed over the  rectangular solution tank. An electric diaphragm pump with an
  capacity was used to circulate the electrolyte. A stainless steel tube served as anode and nozzle. The nozzle-substrate gap distance was
  , and the angle at which the jet impinges onto the surface was
  . The electrolyte was continuously recirculated to a stirred bath.
ECD experiments were conducted at room temperature using either a copper sulfate electrolyte containing 
 and
and 
 or a nickel sulfamate electrolyte containing
 ,
, 
 , and
, and 
 . The process variables studied were current density of
  , electrolyte flow rate of
  , and particle loading up to
  of
of 
 particles (Buehler Micropolish II). The codeposition was carried out galvanostatically onto copper disks with an active area of
  . The total charge was
  , yielding ca.
  thick films.
The amount of particle incorporation was determined by an electrogravimetric method.16 The typical weight of the nanocomposite films was  , resulting in an accuracy in the particle incorporation of
  . Additionally, the amount of particle incorporation was verified by energy dispersive X-ray analysis using a FEI Quanta 600 with an accuracy of about
  .
.
Model
In this paper, we consider the motion of particles within the hydrodynamic boundary layer,  , of an IJE system (Fig. 1). In front of the impinging zone of the IJE system, we can distinguish four main regions:10, 17 the diffusion boundary layer for particles
  , the diffusion boundary layer for reactive ions
  , the viscous sublayer
  , and the free jet flow region
  , where both shear stress and viscous forces are unimportant.17, 18 The concentration of the reactive ionic species at the electrode surface and in the bulk solution are
  and
and  , and
, and  and
and  are the bulk and surface concentrations of the particles. The variation of the particle concentration is assumed to be confined within the particle diffusion boundary layer,
  .
.
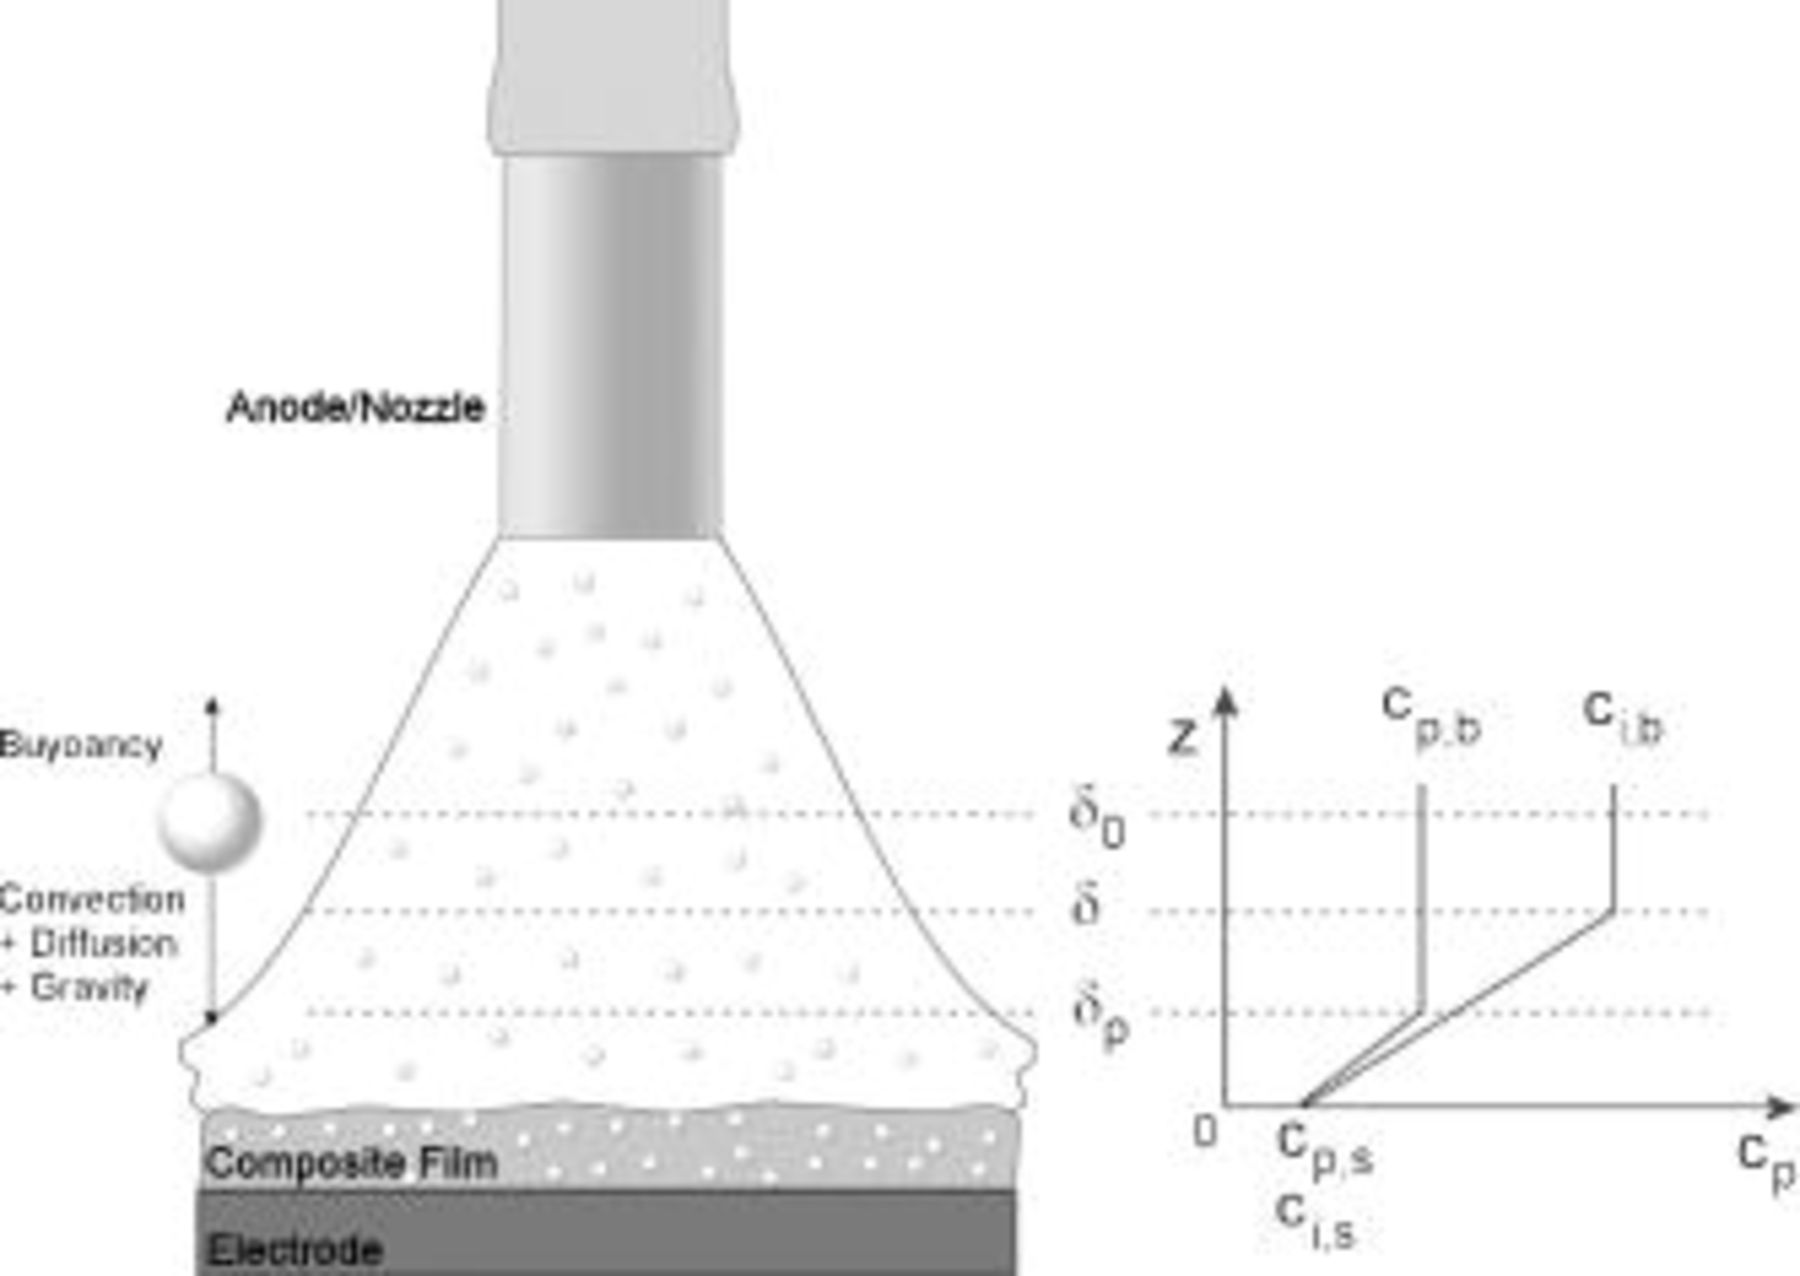
Figure 1. Schematic of the particle concentration in the impinging region of the unsubmerged IJE system.  ,
,  are the bulk concentration and
  ,
,  are the concentration at the electrode surface of the particle and reactive ion, respectively.
Following the development of the model of Vereecken et al.8 and Shao et al. ,9 the total force acting on a single rigid particle in an unbounded homogeneous solvent is given by the product of the net drift velocity of the particles  times the friction coefficient
  9
9
According to Stokes' law, the friction coefficient can be calculated by  , where η is the viscosity of the solution and
  the particle radius.
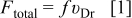
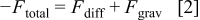
The total force on the particle  in an impinging jet is the sum of convectional diffusion
  and gravitation
  (Fig. 1). The ECD experiments took place in electrolytes with high ionic strength. Hence, no electrophoretic effects have been considered in the modeling. Of course the gravitational term has to be corrected for the influence of the buoyancy of the dispersed nanoparticles. Hence, the total force exerted on a particle in front of the electrode can be written as
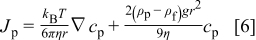
The diffusion force is known to be the negative of the chemical potential gradient  , which corresponds in an ideal solution to19
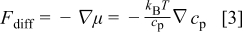
where  is Boltzmann's constant and
  is the temperature. The orientation of the driving force of the diffusion process, the concentration gradient
  , is schematically shown in Fig. 1. The second component is due to gravity and is given as19
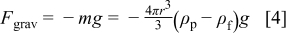
where  is the mass of one particle,
  is the acceleration due to gravity,
  is the particle radius, and
  and
and  are the density of the particle and the fluid, respectively. From Eq. 4, it can be seen that the gravitational force is a function of the particle radius, the value of which increases with increasing particle size.
Substituting Eq. 1, 3, 4 in Eq. 2, the total force acting on a particle in front of the electrode (Eq. 5) is obtained

The particle flux is defined as  . Hence, substituting for the velocity Eq. 5 can be rewritten as
Comparison to Fick's first law shows that  is the particle diffusion coefficient
  .19
.19
Following the model of Vereecken et al.8 and Shao et al. ,9 we will use the Nernst diffusion layer model to describe the particle flux to the electrode.20 The driving force for the diffusion process is characterized by a linear concentration drop within the diffusion layer thickness,  , and is given by
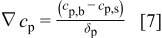
where  is the bulk particle concentration,
  is the particle concentration at the electrode surface, and
  is the thickness of the diffusion boundary layer for particles.
According to the diffusion theory, the average particle concentration within the diffusion layer is given by  . Thus, the particle flux can be written as
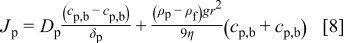
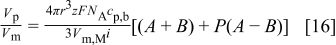
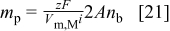
The volume fraction of particles  within the electroplated composite film is given by
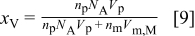
where  and
and  are the number of moles of particles and metal atoms in the film,
  is the particle volume,
  is the molar volume of the metal matrix, and
  is Avogadro's number. The ratio of the number of moles of particles to those of metal atoms
  is equal to the ratio of their fluxes
  . However, this relationship is only valid if all particles that collide with the electrode become embedded in the growing metal film. Because this simplification does not apply to all experimental conditions, a statistical factor
  will be introduced later that correlates the particle concentration at the electrode surface with that in the bulk electrolyte. During the process of ECD, both
  and
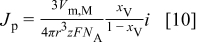
and  are positive. Noting that the flux of metal ions to the electrode surface is given by
  , where
  is the applied current density,
  is the charge number of the species, and
  is Faraday's constant, Eq. 9 can be written as
Combining Eq. 8, 10 under consideration of  gives an expression for
  as a function of the plating parameters
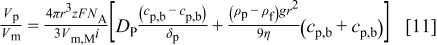
The particle concentration at the electrode surface,  , can be written as
  , where
  represents the probability for particles to be in the neighborhood of the electrode. Thus, Eq. 11 can be rewritten
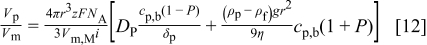
The two limits are if  , such that the surface concentration is zero, and as
  approaches 1, the surface concentration increases to the bulk concentration of particles.
Chin and Hsueh extensively investigated mass transfer with an unsubmerged IJE system.21 Using the Chilton–Colburn analogy,21 which utilizes a similarity between mass and momentum transfer to a flat plate, they obtained a correlation for the rate of mass transfer to the impinging region of the IJE system in the form
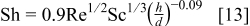
where the Sherwood number  is a function of the Reynolds number
  , which is based on the diameter of the jet nozzle
  and the exit velocity from the nozzle υ, and the Schmidt number
  , which is a ratio of the kinematic viscosity ν of the electrolyte to the diffusion coefficient of the reactive species
  , and the ratio of the distance between the nozzle and substrate
  to the diameter of the jet nozzle
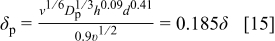
  . By defining the average mass transfer coefficient20 as
  and using Eq. 13, the diffusion layer thickness at an unsubmerged IJE can be calculated as
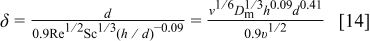
Because of the small size of the alumina nanoparticles  , transport by Brownian diffusion is important. The diffusion coefficients of the alumina nanoparticles in the two baths calculated from the Stokes–Einstein equation19 are shown in Table I. The diffusion coefficient of the reactive species,
  ions, was
  .22 Hence, the diffusion boundary layer thickness for the nanoparticles was calculated from Eq. 14, with
  being substituted for
  , such that
The dependence of the particle diffusion boundary layer thickness on the electrolyte velocity is shown in Fig. 2 for the investigated flow rate range of the IJE system. As expected, an increase in the jet flow rate decreases the diffusion layer thickness. Likewise, the diffusion boundary layer thickness of the metallic ions also decreases with increasing electrolyte velocity (Eq. 14).
Table I. List of values for physical properties.
| Physical property | Value at 
| Ref. |
|---|---|---|

|

| 26 |
 of bulk solution of bulk solution |
 : : 
| 13, 14 |
 : : 
| 12 | |

|
 : : 
| 22 |
 : : 
| 22 | |
 in Cu bath in Cu bath |

| |
| in Ni bath |

| |

|

| 22 |

| 22 | |
 (nozzle-substrate distance) (nozzle-substrate distance) |

| 12 |
 (nozzle diameter) (nozzle diameter) |

| 12 |
| η |

| Experimental |

| 22 | |
| ν |

| Experimental |

| 22 | |

|

| 26 |

|

| Experimental |

|

| 22 |

| 22 |

Figure 2. Particle diffusion boundary layer thickness as a function of the electrolyte velocity;  ,
,  ,
,  ,
,  ,
,  . ◻ nickel sulfamate;
  , △ copper sulfate bath;
  .
.
Equation 12 can be rewritten as
where  and
and  are defined as
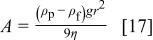
The parameter  is related to the gravitational force corrected for the buoyancy, whereas
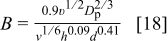
  is related to the diffusional flux. For a given ECD system (i.e., a given particle size and electrolyte composition),
  is a constant and
  is a function of the IJE experimental parameters, particularly the jet flow rate. The impact of the several forces acting on a particle (Eq. 2) can be illustrated by plotting the magnitude of
  and
and  as a function of the particle diameter. The parameters were calculated using the values for the nickel sulfamate bath as given in Table I. As a simplification the kinematic viscosity of the electrolyte was assumed to be not affected by the particle loading of the electrolyte, which was
  . Hence, the kinematic viscosity of the pure electrolyte was used for all the calculations. As can be seen from Fig. 3, the impact of the gravitational force
  increases, whereas the diffusional force
  decreases with increasing particle size.
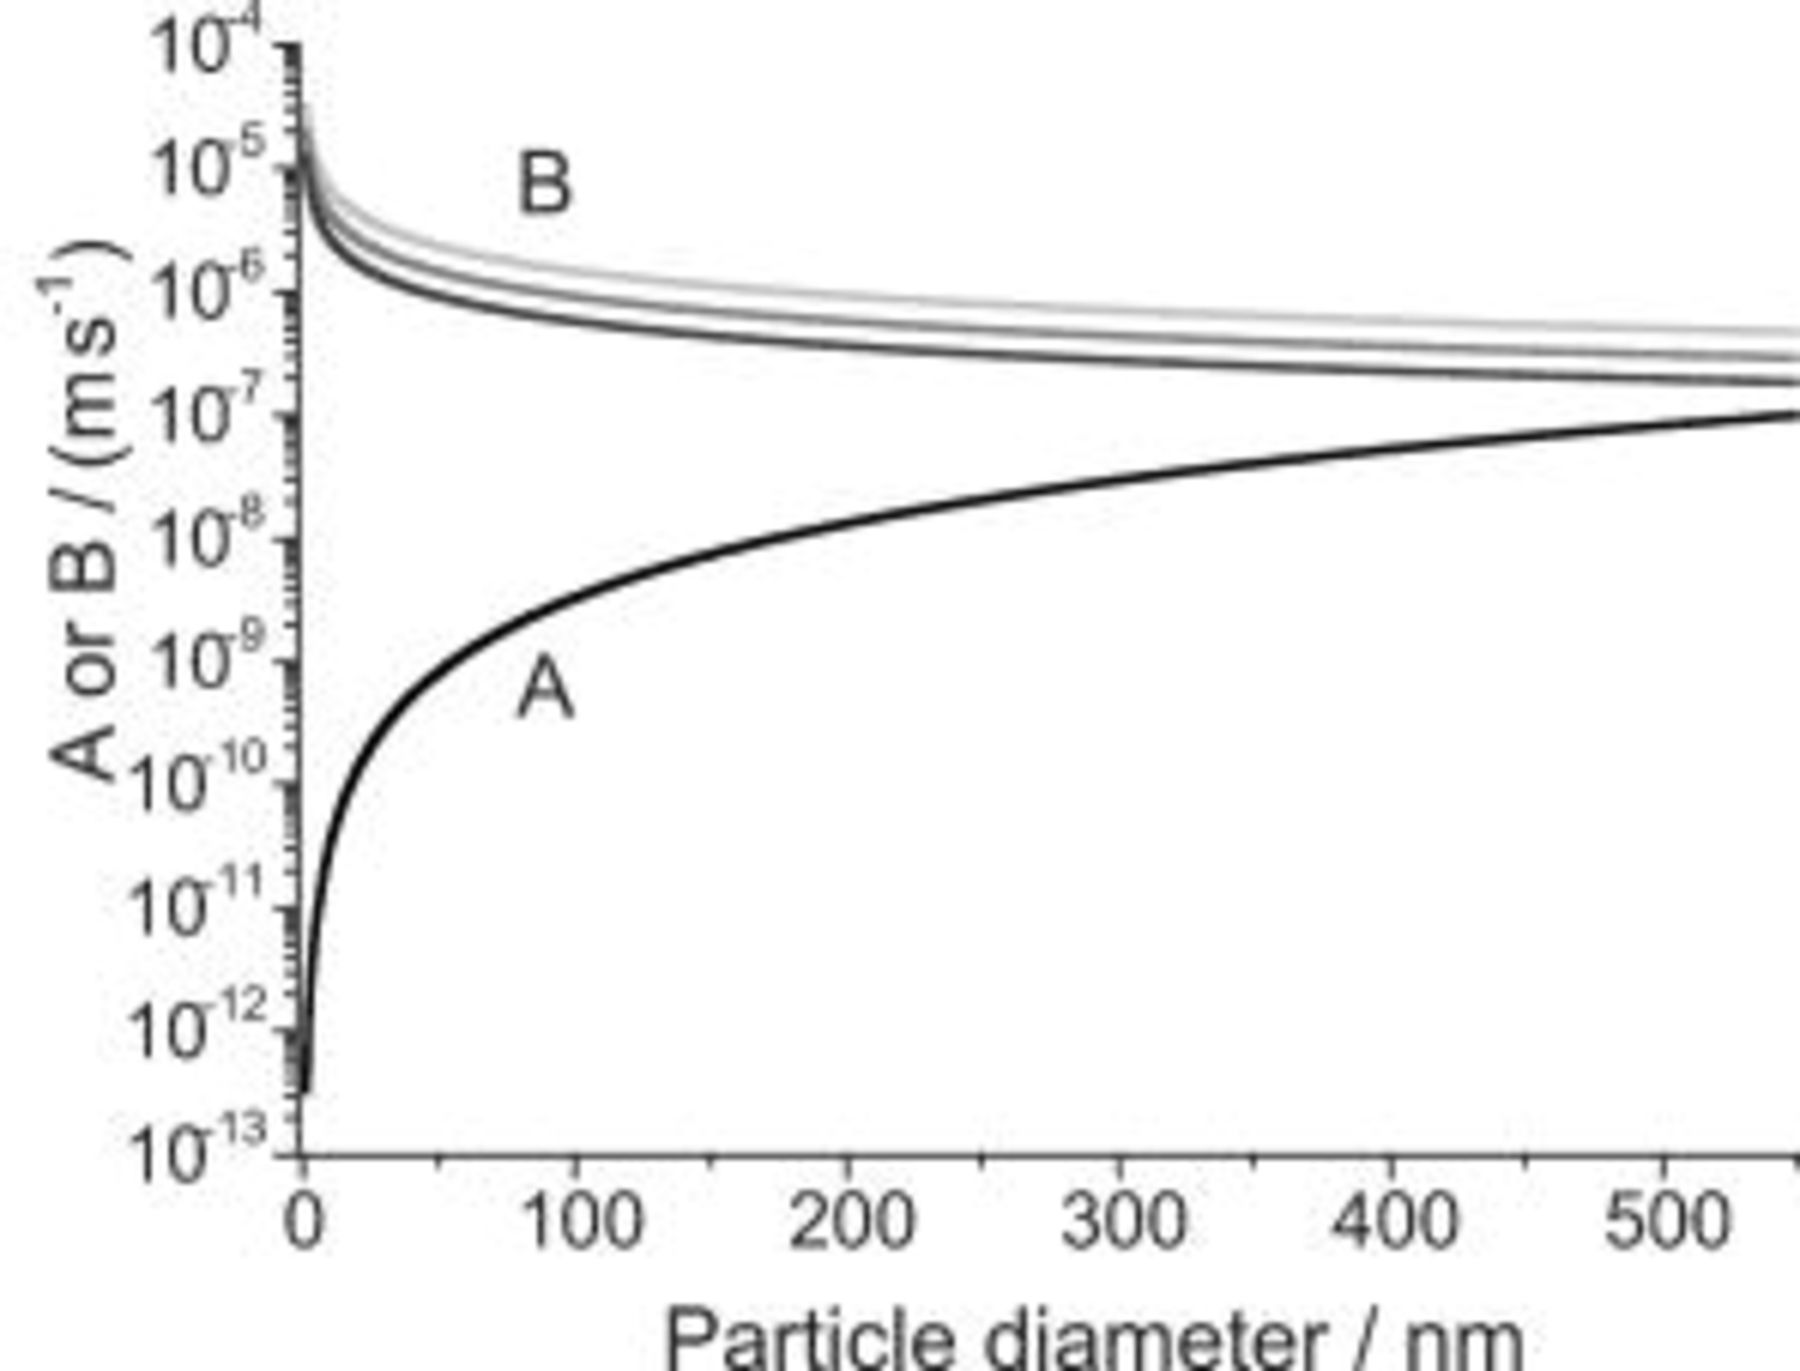
Figure 3. Parameter  (—) and
  (IJE flow rate: (top shaded gray line)
  , (middle shaded gray line)
  , (bottom dark gray line)
  ) in Eq. 16 vs particle diameter.
  ,
,  ,
,  ,
,  ,
,  ,
,  .
.
As the IJE velocity increases for a particular particle size, the effect of the diffusional force  decreases, as shown in Fig. 3. The forces become equal at about a particle diameter of
  , above which both are important. This is illustrated in Fig. 4, in which the ratio of
  to
to  is shown as a function of particle diameter. As the particle size decreases,
  rapidly decreases. In good agreement with the results of Vereecken et al.8 and Shao et al. ,9 the ratio
  for particles with a diameter of
  (as used here). Hence, the influence of the gravitational force may be neglected for the jet flow rates studied. Because the convectional diffusion dominates over the gravitational and buoyancy effect in this study, and considering the case of
  or the diffusion limited case [i.e., the particle concentration at the electrode surface is equal to zero
  ] Eq. 16 simplifies to
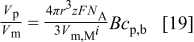
Figure 5 shows the ratio of codeposited particle volume to the volume of plated nickel matrix,  , vs particle concentration in the solution,
  , for various jet flow rates.12 Depending on the flow rate, particle incorporation plateaus at a particle loading of the electrolyte between 30 and
  .
.
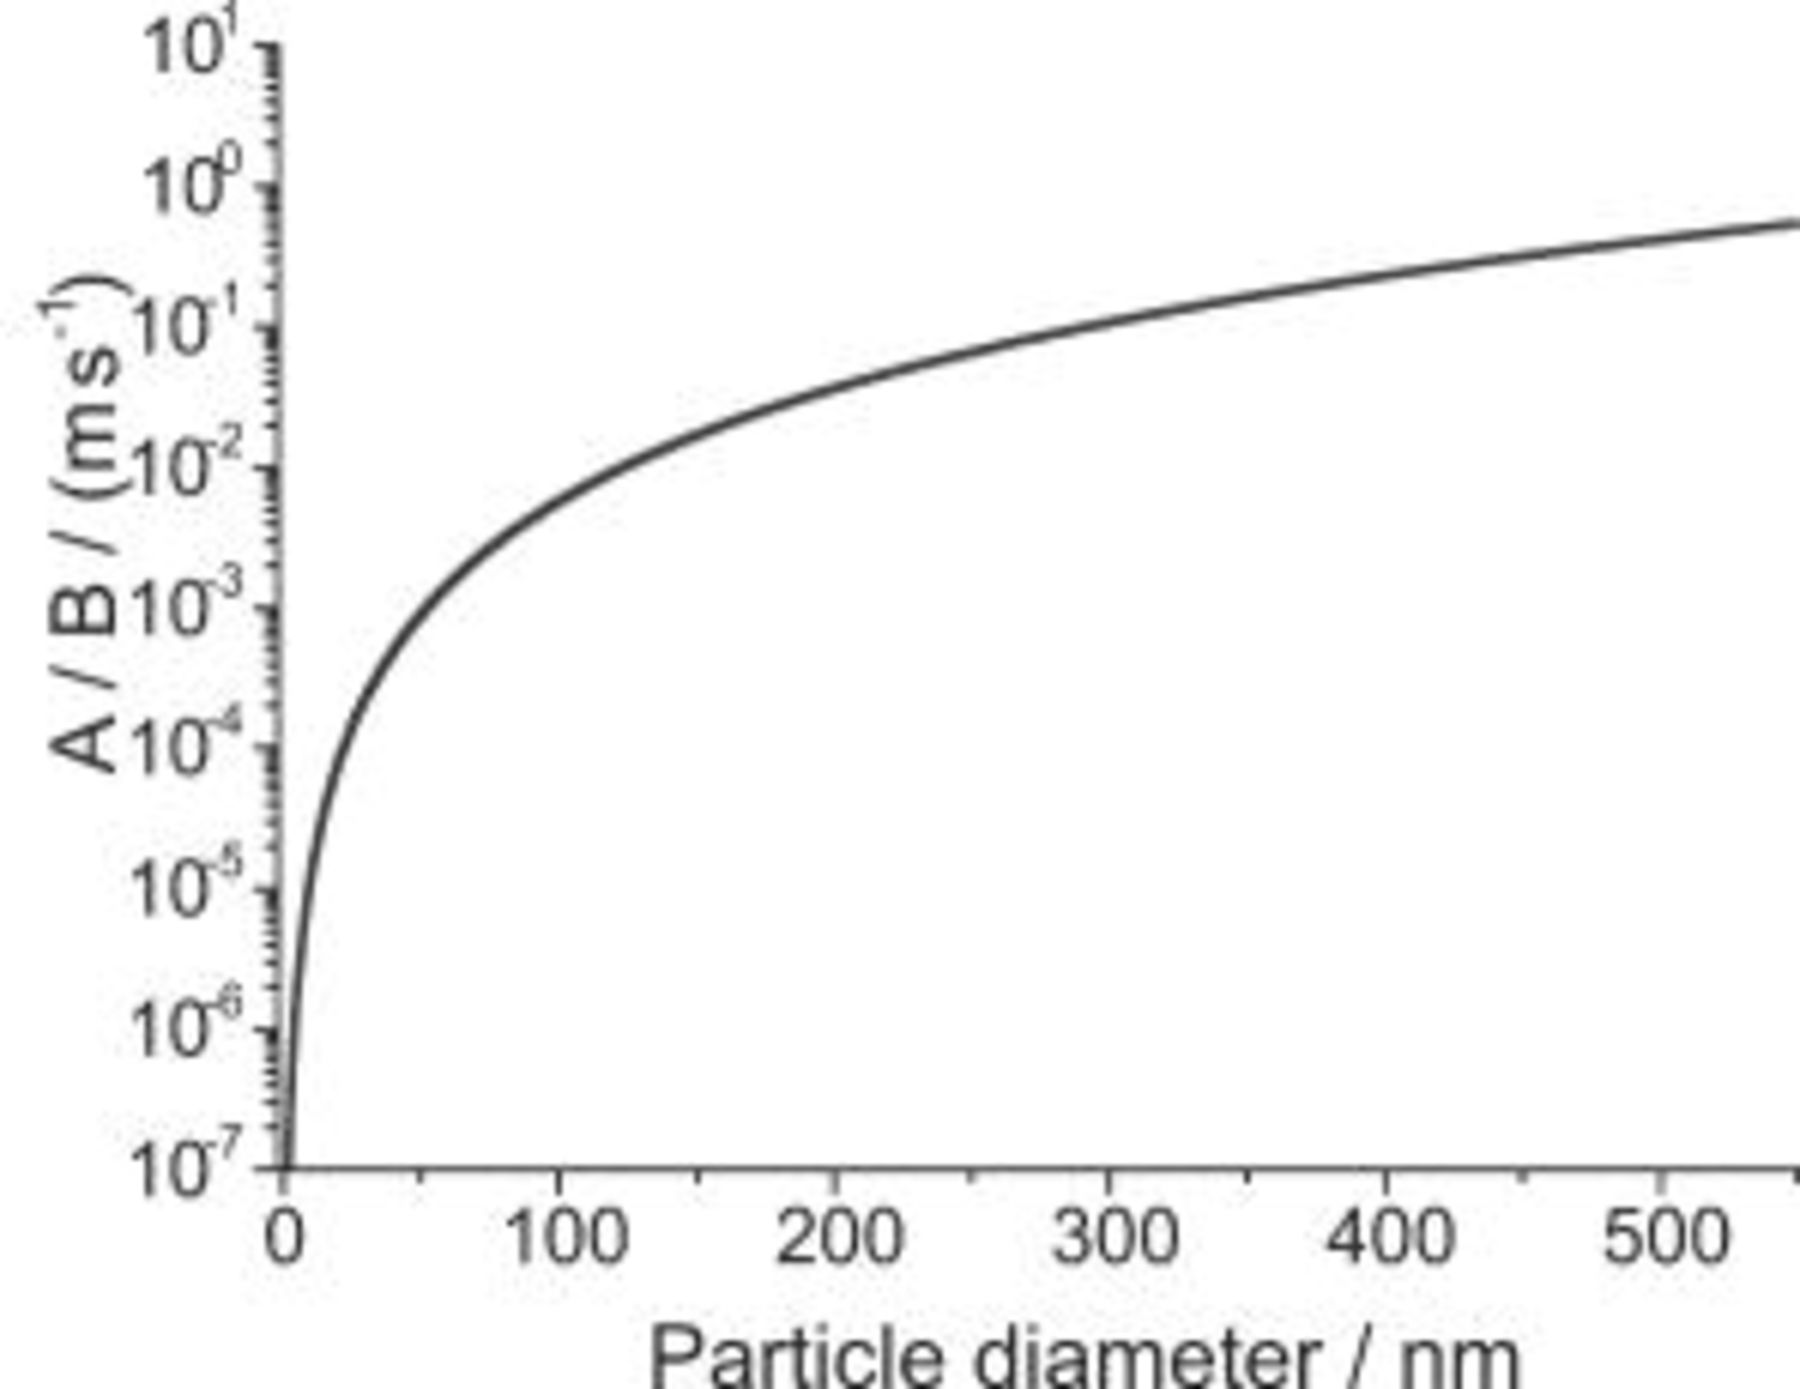
Figure 4. Parameter  divided by
  for an electrolyte flow rate of
  vs particle diameter (same parameters as Fig. 3).
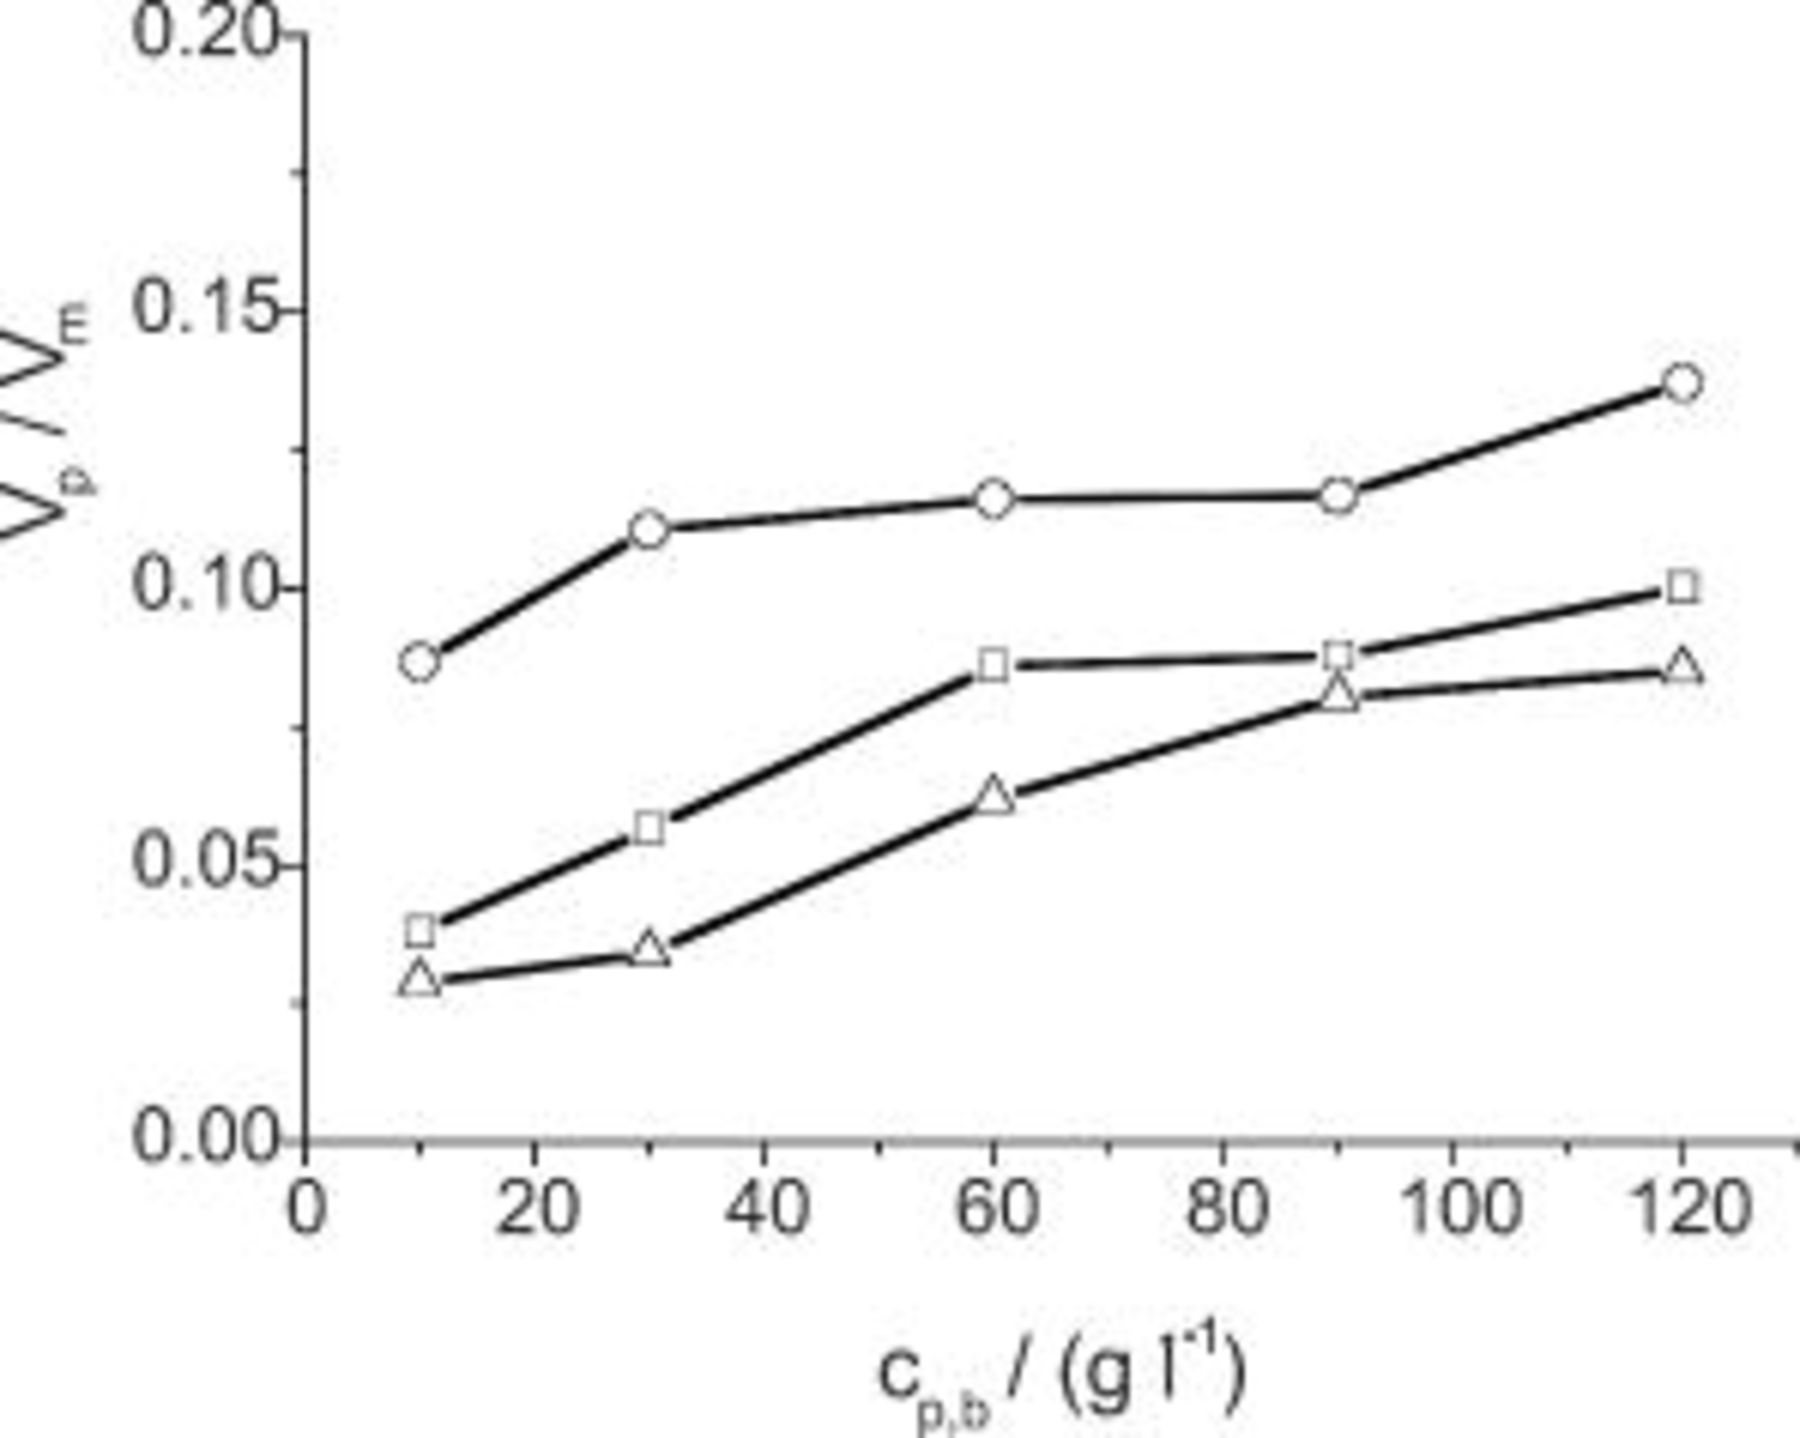
Figure 5. The ratio of codeposited particle volume to the volume of plated nickel matrix vs particle concentration in the solution with varying electrolyte flow rate at a current density of  : ◻ 1, ○ 2.5, and △
  .
.
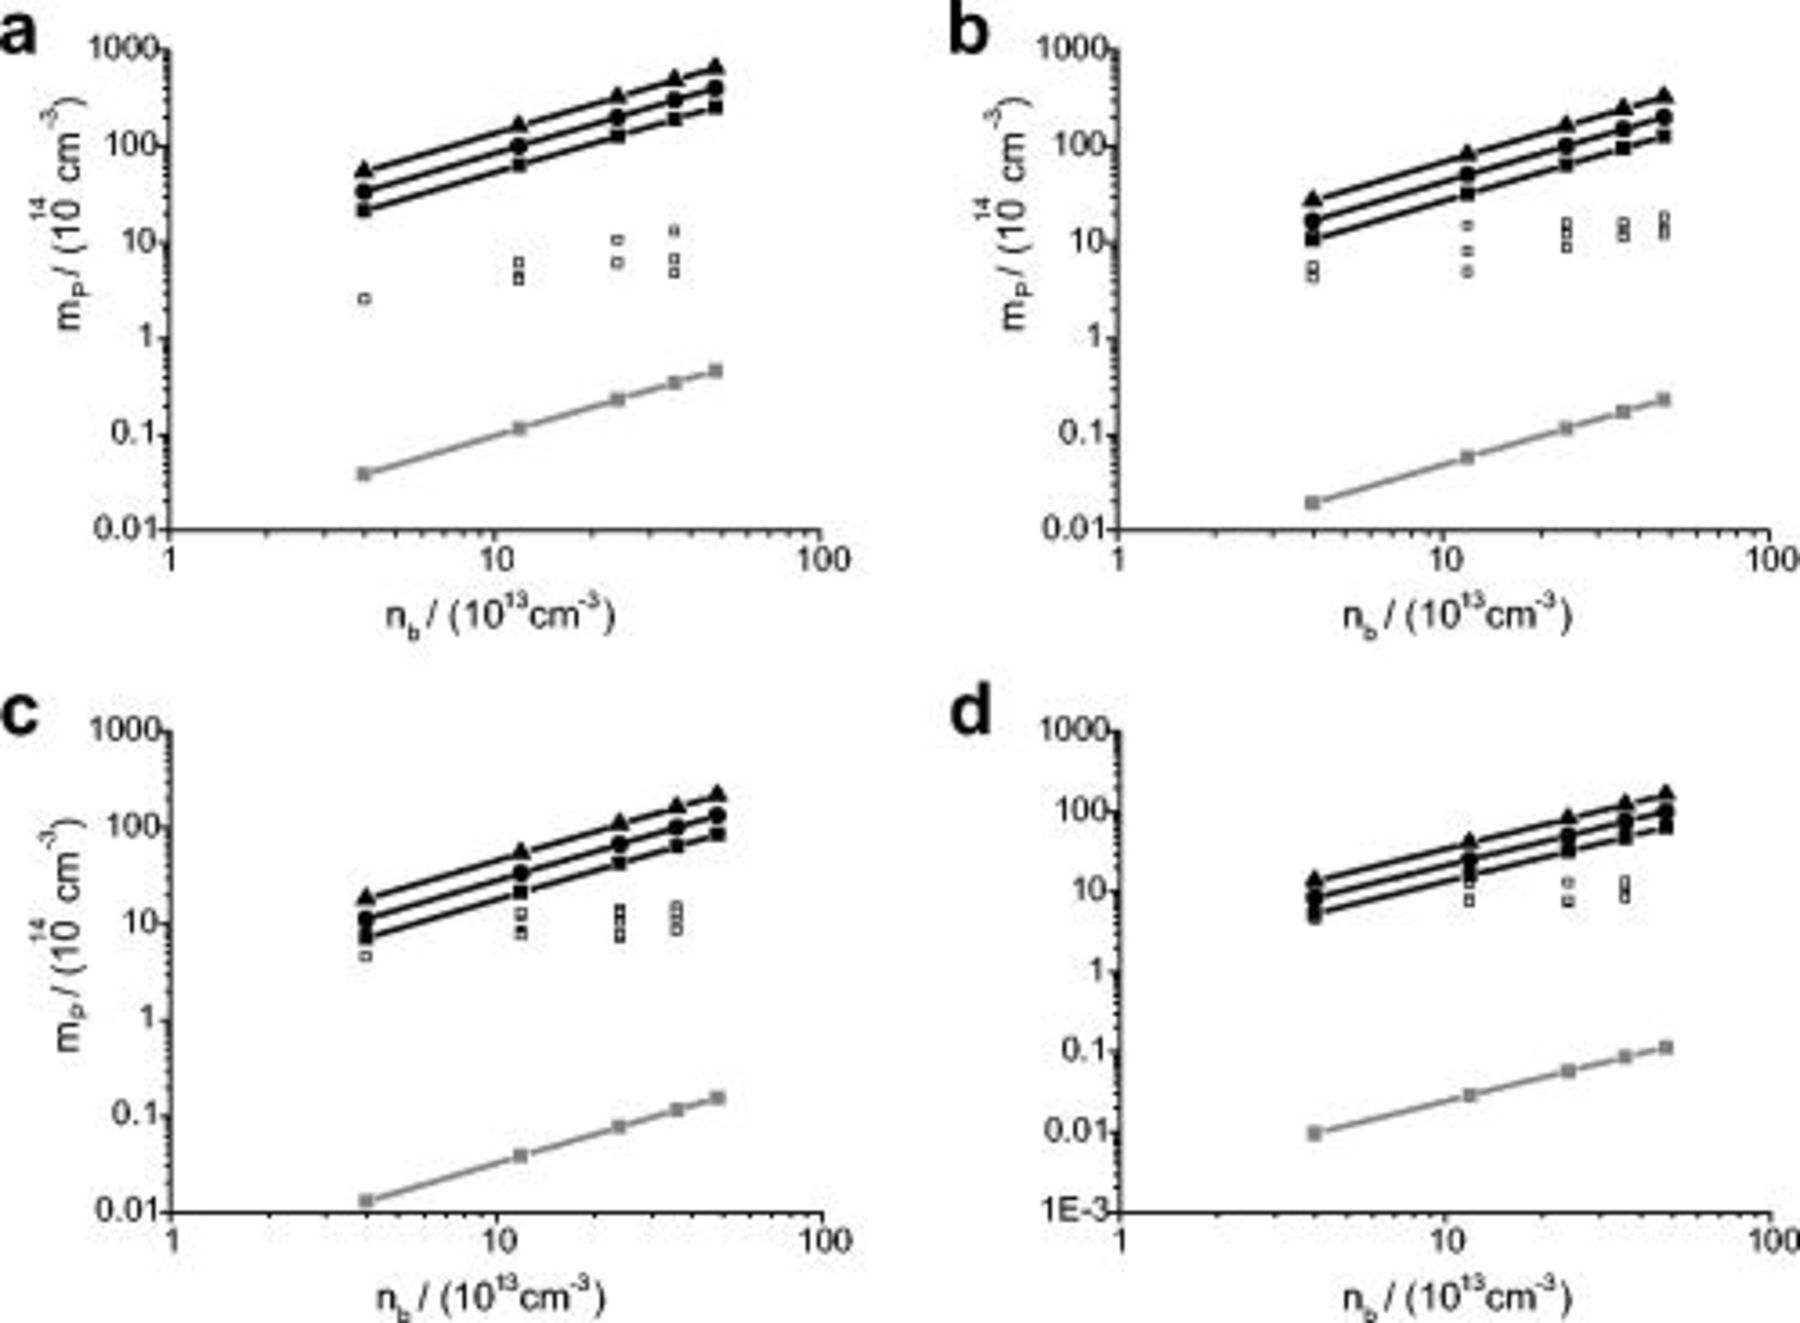
Figure 6. The number of nanoparticles per unit volume of nickel in the film  vs particle number density in the solution
  for various flow rates ranging from 1 to 6.5 L
  . The solid lines are the calculated particle number densities in the film for P=0 (IJE flow rate: ◼ 1, ● 2.5, ▲
  ) and
) and  (shaded gray box). The open squares refer to the experimental results.
  ,
,  ,
,  ,
,  , η=2.09 g
 T=298 K,
 . (a) 5, (b) 10, (c) 15, and (d) 20 A
  .
.

Figure 7. Number of nanoparticles per unit volume of copper in the film  vs particle number density in a
  Cu sulfate solution
  for various flow rates ranging from
  . The solid lines are the calculated particle number densities in the film for
  (IJE flow rate: ◼ 1, ▲
  ) and
) and  (shaded gray box). The open squares refer to the experimental results.
  ,
,  ,
,  ,
, 
 ,
, 
 ,
,  : (a) 2.5, (b) 7.5, (c) 12.5 and, (d)
  .
.
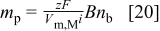
Equation 19 can be rewritten in terms of the number of particles per unit volume of plated metal matrix  and the number density of particles (per unit volume of solution) in the electrolyte
  where
where  . The following expression describes the number of codeposited particles under diffusion limiting conditions
If the probability for particles to be in the neighborhood of the electrode  , the number of codeposited particles is given by
A comparison of the two limiting cases, i.e.,  and
and  , respectively, is shown in Fig. 6 and 7 with the experimental data, which show the particle density in the composite film,
  , as a function of the particle density in the electrolyte,
  , for various IJE flow rates and plating current densities. The experimental incorporation results are in between the results of the two limiting cases.
Therefore, the probability for particles to be in the neighborhood of the electrode,  , was used in the model Eq. 12 to fit the experimental data. Depending on the electrolyte flow rate,
  for the
  system was
  for a current density of
  and
and  for a current density of
  as shown in Table II. As shown in Table II,
  increases with an increase in particle loading (for a constant flow rate and current density) and an increase in flow rate (for the same current density and particle loading). As either particle loading or fluid velocity increases, particle-particle interactions (i.e., agglomeration) and possibly lower incidence of particle adsorption at the electrode surface are more likely. As a result the chance that an individual particle codeposits decreases. The values of
  decrease with an increase in current density for the same flow rate and particle loading, indicating the balance of the metallic plating rate and other forces on particle incorporation. For the system
  ,
,  was close to unity, ranging from
  for all deposition conditions studied. The difference between the two experimental systems can be explained by the relatively high particle content of the electrolyte for
  system
  , which would lead to enhanced particle-particle interactions in solution or possibly lower incidence of particle adsorption. In accordance with these observations, Vereecken et al.8 and Shao et al.9 reported that the particle transport might not be under diffusion limited conditions in the range of higher particle loadings of the electrolyte. The incorporation process is largely influenced by the interplay of particle-particle and particle-electrode short-range forces.
Table II. Fitted  values for
  deposition conditions.
 
|
 
| Flow rate 
| ||
|---|---|---|---|---|
| 1 | 2.5 | 6.5 | ||
| 5 | 10 |
|
| 0.95 |
| 30 | 0.90 | 0.96 | 0.98 | |
| 60 | 0.95 | 0.95 | 0.98 | |
| 90 | 0.97 | 0.96 | 0.99 | |
| 10 | 10 | 0.47 | 0.25 | 0.84 |
| 30 | 0.74 | 0.69 | 0.94 | |
| 60 | 0.81 | 0.84 | 0.95 | |
| 90 | 0.87 | 0.89 | 0.95 | |
| 120 | 0.89 | 0.91 | 0.96 | |
| 15 | 10 |
| 0.16 | 0.46 |
| 30 | 0.37 | 0.63 | 0.84 | |
| 60 | 0.68 | 0.79 | 0.90 | |
| 90 | 0.79 | 0.85 | 0.92 | |
| 20 | 10 | 0.12 |
| 0.42 |
| 30 | 0.48 | 0.47 | 0.81 | |
| 60 | 0.77 | 0.73 | 0.90 | |
| 90 | 0.76 | 0.82 | 0.93 | |
The model calculations were made using the primary particle diameter  as given by the producer. However, the alumina nanoparticles are expected to aggregate in aqueous solutions, particularly in the plating bath with a high ionic strength.19 The maximum agglomerate size
  that is stable in the fluid can be estimated knowing the hydrodynamic shear of the fluid as follows
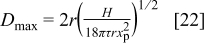
where  is the Hamaker constant,
  is the primary particle radius, τ is the shear stress, and
  is the separation distance of the particles in the primary medium.23 This equation was developed by balancing the van der Waals force between two particles with the hydrodynamic force acting to separate two particles.23 For an aqueous alumina suspension, it was assumed that
  .
. ,24 and
  ,25 with
  for the alumina dispersion. This means that agglomerates that are greater than
  will break up by the shear force of the fluid. In the impingement regime, the shear stress for an unsubmerged jet can be calculated by21
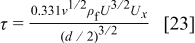
where  is the average fluid velocity at the nozzle exit and
  is the local average velocity along the radial direction.
  was calculated to range from
  for a flow rate of
  for
for  . Therefore, large agglomerates could form and would not break up in the impinging jet system.
According to the Stokes–Einstein equation,19 the particle diffusion coefficient  depends inversely on the particle size. Hence, the theoretical particle density in the film,
  , as given by Eq. 20, may be corrected for the actual particle diffusion coefficient. Figures 3 and 4 show the impact of the forces acting on a particle to be dependent on the particle diameter. Additionally, Vereecken et al.8 and Shao et al.9 indicated that the gravitational force becomes important at a particle size of
  . Hence, because of the large alumina agglomerates possibly present in the plating electrolyte, the particle transport cannot be described solely by a diffusion process because an increase in the particle size leads to an increasing impact of the gravitational force (Fig. 4). Moreover, the gravitational force, represented by parameter
  (Eq. 17), has to be considered in the calculation of the theoretical particle density in the film. An increase in the particle size for the case of
  would only cause the model predictions at this limit to be even greater than data as in Fig. 6 and 7. For values of
  , an effective particle diameter could be
  in the model to fit the data. However, it is difficult to determine the agglomerate size under plating conditions (i.e., in an electrolyte with high ionic strength and at appropriate high particle loadings of the electrolyte).
Conclusions
The ECD of copper and nickel alumina nanocomposites using an IJE system was described by a model based on an analysis of the particle flux to the electrode. The particle flux was derived from an analysis of the total force acting on a rigid spherical particle in an unbounded fluid in front of the electrode of an IJE system. The forces considered are the convectional diffusion, gravity, and buoyancy. By using a fitting parameter,  , that relates the particle surface concentration to the bulk concentration
  , the experimental data agree with the model predictions. The parameter
  indicated the probability that the particles are near the surface to be incorporated, with
  being the diffusion-limited case and
  being the kinetic limit.
  increased with increasing particle loading and flow rate and decreased with increasing current density.
Using the particle size of the dry nanopowder  , the comparison of the theoretical incorporation values with the experimental results showed the predominance of convectional diffusion. Nevertheless, it has to be emphasized that the primary particle size of the alumina powder as given by the producer may not be appropriate for the present model. Because of the high ionic strength of the plating baths, the nanoparticles tend to form agglomerates. Hence, a consideration of the particle-particle and particle-electrode short-range forces is needed to gain a better understanding of the ECD process. Colloidal probe microscopy experiments are currently underway to gain a better insight in these short-range forces.
List of Symbols

| transport parameter for gravitational flux corrected for the buoyancy, m s−1 |

| transport parameter for diffusion flux, m s−1 |

| concentration of ionic species in the bulk electrolyte solution, 
|

| concentration of ionic species at the electrode surface, 
|

| concentration of particles in the bulk solution, 
|

| concentration of particles at the electrode surface, 
|

| jet nozzle diameter, m |

| effective agglomerate size, m |

| diffusivity of the reactive metal species, 
|

| maximum aggregate size, m |

| particle diffusion coefficient, 
|

| friction coefficient 
|

| Faraday's constant, 
|

| diffusion force |

| gravitation force |

| gravitation acceleration rate, 
|

| nozzle-substrate gap distance, m |

| Hamaker constant |

| current density, 
|

| limiting current density, 
|

| mass flux of particles on an electrode surface, 
|

| mass flux of deposited metal atoms on an electrode surface, 
|

| average mass transfer coefficient  , , 
|

| Boltzmann's constant, 
|

| single-particle mass, kg |

| number density of particles per unit volume of electrolyte solution |

| number density of particles per unit volume of electrolyte solution |

| number of moles of metal atoms in a composite film |

| number of moles of particles in a composite film |

| Avogadro's number, 
|

| particle radius, m |

| gas constant, 
|
| Re | Reynolds number |
| Sc | Schmidt number |
| Sh | Sherwood number |

| temperature, K |
| υ | jet flow velocity, 
|

| net drift velocity of the particles |

| average fluid velocity at the nozzle exit |

| local average fluid velocity along the radial direction |

| molar volume of the deposited metal |

| single particle volume, 
|

| separation distance of the particles in the primary medium, n |

| volume fraction of inert particles incorporated in a composite film, vol % |

| charge number |
Greek
| β | friction coefficient 
|
| δ | boundary layer thickness for metal ions, m |

| viscous sublayer boundary layer thickness, m |

| boundary layer thickness for particles, m |

| density of the electrolyte solution, 
|

| density of a particle, 
|

| concentration gradient |
| ∇μ | chemical potential gradient |
| η | viscosity of the electrolyte solution, 
|
| τ | shear stress |
| ν | kinematic viscosity of the electrolyte solution, 
|
Subscripts
| b | bulk electrolyte solution |
| f | fluid |
| m | deposited metal species |
| p | particle |
| s | electrode surface |
Acknowledgment
This research was funded by the "Deutsche Forschungsgemeinschaft" (grant no. BU 1200/10-1 , no. BU 1200/14–1).
University of California, San Diego assisted in meeting the publication costs of this article.