
Abstract
Various amounts of Cr and Al nanoparticles were electrochemically assembled into a nanocrystalline Ni matrix template to form  nanocomposites (
 ,
,  in weight percent). By characterization of the steady-state oxide scales formed at
  in air, an oxide map correlating the scale types with the composition ranges of the nanocomposites was established, showing that these nanocomposites can transform from NiO formers to chromia or alumina formers, by increasing the amount of
  to a critical, particle-size-dependent value and by changing the value of the ratio
  . The nanocomposites, in comparison to ternary composites assembled using Cr and Al microparticles instead of the nanoparticles and with conventionally coarse-grained alloys of similar composition, exhibited a greatly increased ability of thermally developing chromia or alumina scales. A model for the establishment of various oxide scales on the nanocomposites is proposed, correlating the nature of the scales with their specific microstructures and with the values of
  and
and  .
.
Export citation and abstract BibTeX RIS
The Ni–Cr–Al system is the major constituent of many commercial nickel-base superalloys that have been widely used in high-temperature environments because of its two specific properties. First, it normally has a γ–γ' ( phase) structure that exhibits extraordinary mechanical properties; second, it has great potential for thermally developing protective oxide scales, such as chromia or alumina.1, 2 Unfortunately, most commercial Ni–Cr–Al base alloys are not able to form exclusive chromia or alumina scales, due to some limitation of the content of chromium or aluminum (e.g., high Cr and Al would increase alloys' brittleness and decrease their high-temperature strength or creep resistance). These alloys for structural applications at high temperatures are always covered with oxidation (or corrosion)-resistant coatings, which contain chromium and aluminum concentrations profoundly higher than their conventional values in commercial superalloys.3, 4
Ni–Cr–Al–Y coatings are a typical type of M–Cr–Al–Y overlay coatings ( , Co, or their combinations). Compared to diffusion coatings usually fabricated using pack chromizing,5 aluminizing,6 or chrome aluminizing,7 compositions for the overlay coatings can be specifically developed through various coating techniques, including electron-beam physical vapor deposition (EB-PVD),8 magnetron sputtering,9 plasma spray,10 high-velocity oxy-fuel (HVOF),11 etc. Ni–Cr–Al–Y overlay coatings, with chromium contents in the range of 18–22 (by weight percent) and aluminum contents in the range of 8–12, are alumina formers, which have better resistance to high-temperature oxidation and type I hot corrosion
  .4 A typical Ni-base commercial overlay coating is EB-PVD ATD10 (Ni–20Cr–11Al–0.3Y). The alumina-forming Ni–Cr–Al–Y type coatings are also used as bond coats for thermal barrier coatings (TBCs).12, 13 The purpose of adding small amounts of yttrium is to increase the resistance of the protective scale (mostly alumina) to oxidation through the so-called reactive element effects (REEs), as reviewed elsewhere.14–16
Nanocrystallization of the Ni–Cr–Al base alloys has an influence partly similar to that of yttrium additions in increasing the adhesion of the alumina scale developed through several mechanisms as summarized by the present authors,17 including forming interfacial "oxide micropegs," minimizing the concentration of cation vacancies condensed and the segregation of sulfur at the scale/metal interface, increasing oxide diffusion creep by favoring the formation of a fine-grained–scale structure. The alloy's nanocrystallization may also favor an exclusive development of a protective scale (mainly alumina), without increasing the contents of chromium and aluminum. This made the synthesis of oxidation-resistant nanocrystalline (NC) coatings an active field of research in the past decade.17–22 Several authors investigated the oxidation of Ni–Cr–Al–type NC coatings prepared by sputtering. Chen and Lou20 found that a three-component NC coating containing both concentrations of Cr and Al as low as  can develop alumina scales. For the
  NC coating, only
  Al is needed for selectively developing an α-alumina scale at
  , while the minimum content for conventionally coarse-grained (CG) ternary alloys is
  Al; below this concentration limit, the CG alloys form an external layer of
  and
and  spinel with deep internal
  particles underneath.21 An increased ability to selectively form alumina scales was also repeated for the oxidation of NiCrAl-type NC coatings prepared by HVOF using cryomilling-produced NC powders.22
The technique of electrochemical deposition has the merits of simple processing and ease of fabrication, low expense, high productivity, and good compositional control. In the mid-1980s Foster et al.23 and Honey et al.24 suggested developing an oxidation-resistant Ni–Cr–Al–type overlay coating by simultaneous electrodeposition of Ni and prealloyed, micron-sized high Cr and Al particles. Most recently, a Ni–6Cr–7Al nanocomposite coating with increased hot corrosion resistance beneath molten  salts at
  was developed through electrochemical deposition of Cr and Al nanoparticles into NC nickel deposits.25 On the basis of this result, it was assumed that the unique structure of this kind of ternary, three-phase nanocomposite may favor the development of protective oxide scales at high temperatures. In this work, chromium and aluminum nanoparticles with different contents and sizes were electrochemically assembled into a NC nickel template to fabricate a Ni–Cr–Al nanocomposite system with an extended range of chromium and aluminum contents, and the oxidation mechanism, particularly regarding the selective oxidation of chromium and aluminum, was fully explored. The present results will constitute a frame of reference for manufacturing oxidation-resistant Ni–Cr–Al–type coatings through the simple electrochemical method.
Assembly and Characterization of Ni–Cr–Al Nanocomposites
Cr nanoparticles were synthesized using a direct-current arc-plasma method. They were gathered on a collecting tank located on the cooled downstream of aerosol from the chamber where pure Cr, used as an anode, is evaporated at the attack of the arc-flame of nitrogen and hydrogen. Al nanoparticles were prepared using a technique of electric explosion of wires, and their size was determined by several processing parameters, including the Al wire diameter, the metal overheat, and the ambient gas pressure.26 The two types of synthesized nanoparticles were passivated in argon before utilization. They both were mainly spherical in shape, but some Cr nanoparticles appeared to be cubic.25, 27 The particle size was determined by averaging the measured sizes of over 100 particles randomly selected from transmission electron microscopy (TEM) images. In this work, Al nanoparticles with a mean size of  and Cr nanoparticles with a mean size of
  were used. Cr nanoparticles with a mean size of
  were also used instead of the
  –sized particles for investigating the effect of particle size on oxidation.
The nanoparticles of Cr and Al were loaded into a conventional Ni-plating sulfate bath containing 
 ,
, 
 ,
, 
 ,
, 
 . Pure electrolytic nickel
  specimens with dimensions of
  and a Φ
  hole in the upper middle area, after being ground to 800 grit SiC paper and ultrasonically cleaned in acetone, were hung by a copper wire in the bath as a cathode for electrodeposition, as seen from the setup schematically shown in Fig. 1. The nanoparticles were maintained, suspended in the bath, using a reciprocating perforated plate during deposition. They were transported by the flowing electrolyte toward the cathode, where they were electrochemically assembled into the template of Ni electrodeposits to form
  nanocomposites (
 ,
,  in weight percent). The particle deposition process, as proposed by Guleimei,28 can be simply divided into two stages (Fig. 1): particles move toward the cathode and part of them are adsorbed on the surface in stage I, while the adsorbed particles are embedded into the Ni deposits in stage II. According to this model, the content of the particles incorporated into the Ni deposits generally increases with an increase of the particle-loaded content at a given current density. That is, in this work the total amount of the deposited particles in the nanocomposites,
 , is roughly a function of bath particle–loaded content, while the actual values of
  and
and  depend on the bath content of chromium and aluminum particles. Practically, the particle-assembled content was also slightly affected by other parameters besides current density, such as hydrodynamics (related to agitation frequency of the perforated plate), pH value, bath temperature, and the zeta potential of the particles.29, 30 The parameters used here were similar to those previously reported.25 Moreover, according to Faraday law, the nanocomposite thickness increased linearly with the deposition time.
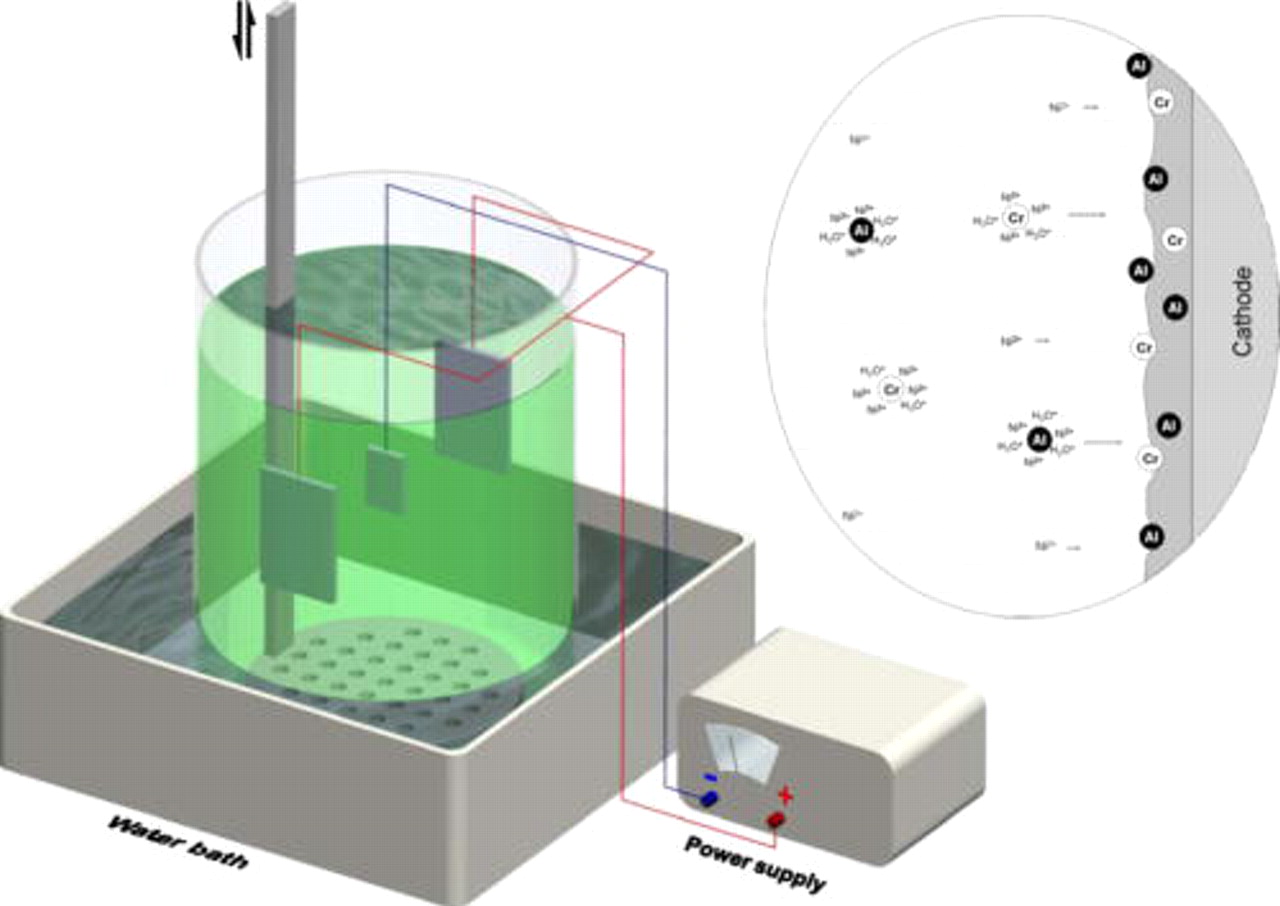
Figure 1. The setup for the electrochemical assembly of a Ni–Cr–Al nanocomposite system, where a perforated plate moves up and down to keep the nanoparticles suspended in bath during deposition. The right inset schematically shows a process for assembling Cr and Al nanoparticles into a Ni base film on cathode. The nanoparticles that possibly adsorb the cations (e.g.,  and
and  ) in the bath are conveyed by the solution agitated to cathode, where part particles uncovered by the electrical field are progressively included into the Ni base film, according to Guleimei's model.28
The surface morphology and composition of the ternary nanocomposites in the as-deposited state were investigated using a scanning electron microscope (SEM) equipped with energy dispersive X-ray analyzer (EDAX). Generally, the as-deposited composites have a smooth surface, as already observed on the as-deposited Ni–Cr nanocomposite.31 The flat surface can also be seen from its cross-sectioned backscattered electron image (BEI) given by electron probe microanalysis (EPMA) (Fig. 2). From the corresponding X-ray mappings of Al and Cr, a uniform dispersion of the two different particles can be assumed.
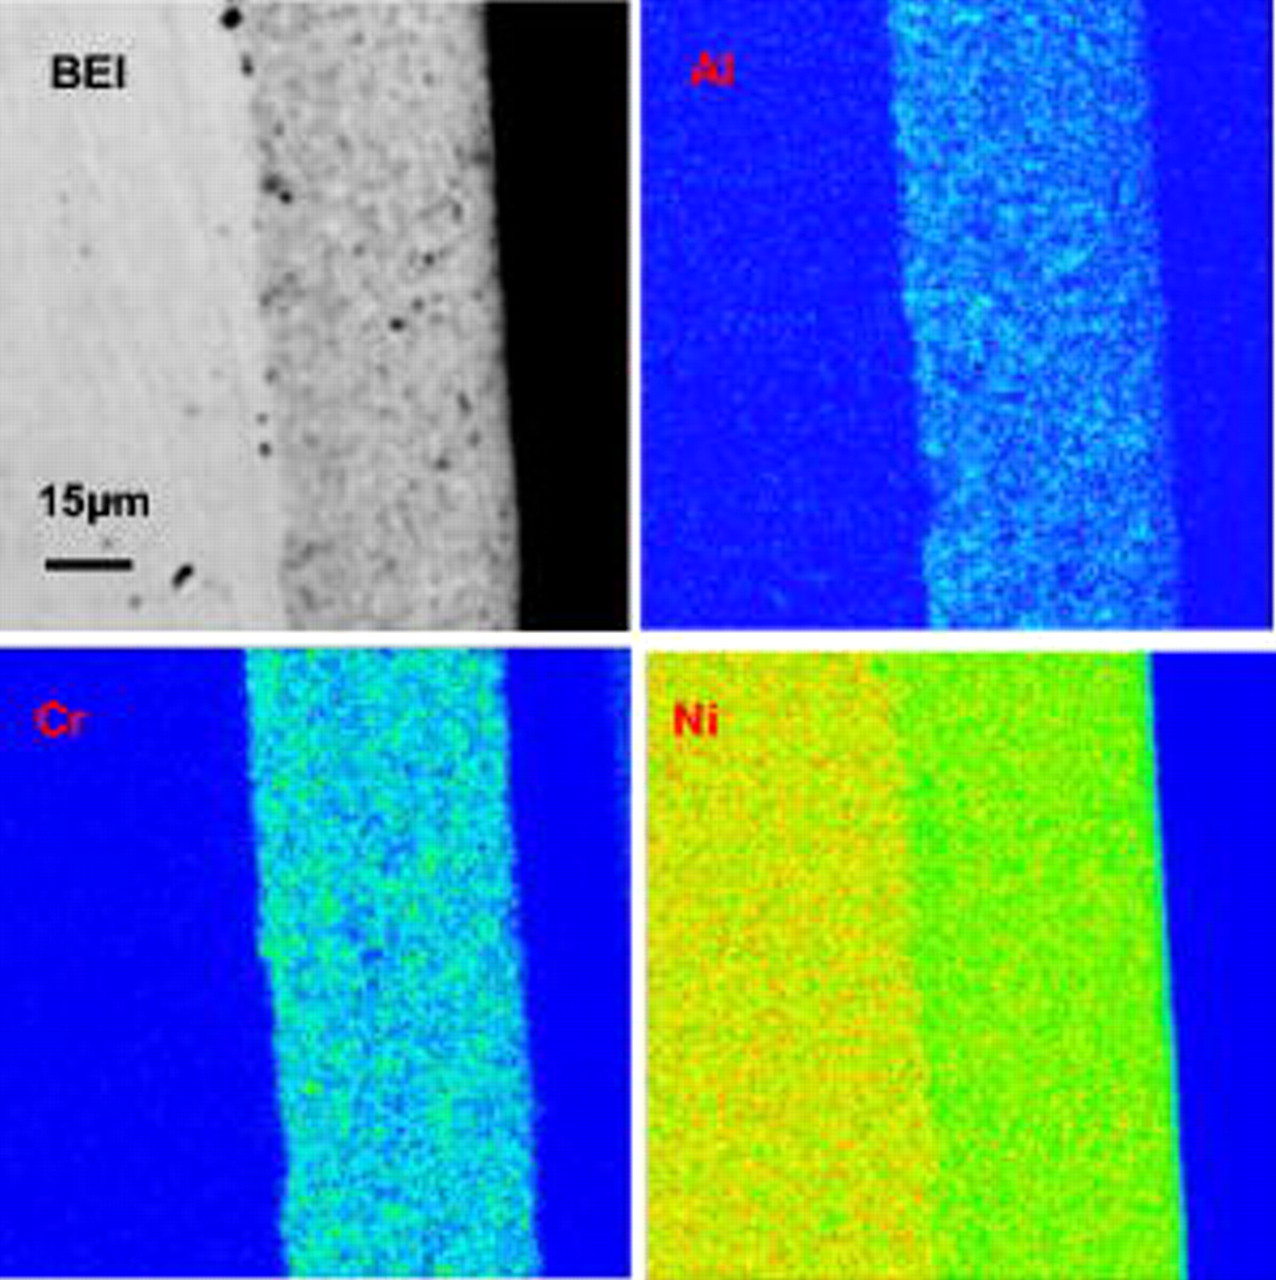
Figure 2. BEI image and Al, Cr, and Ni X-ray mappings of a cross section of an as-deposited Ni–Cr–Al nanocomposite.
The fine structure of the nanocomposites was characterized using TEM. The TEM foil preparation method is given as follows: a nanocomposite film with a thickness of  was peeled off from the substrate and then cut into a small piece and mounted onto a Φ
  copper ring; afterward, it was ion-milled to electron transparence. Figure 3 shows a typical TEM bright-field image, where the Cr (indicated by dotted circles and squares) and Al (indicated by dash dot circles) nanoparticles were clearly seen. The nanoparticles were dispersed in nanolength scale in an electrodeposited Ni template with a mean grain size of
  . Twins were visible within the Ni grains. No pores and cracks occurred in the nanocomposite.
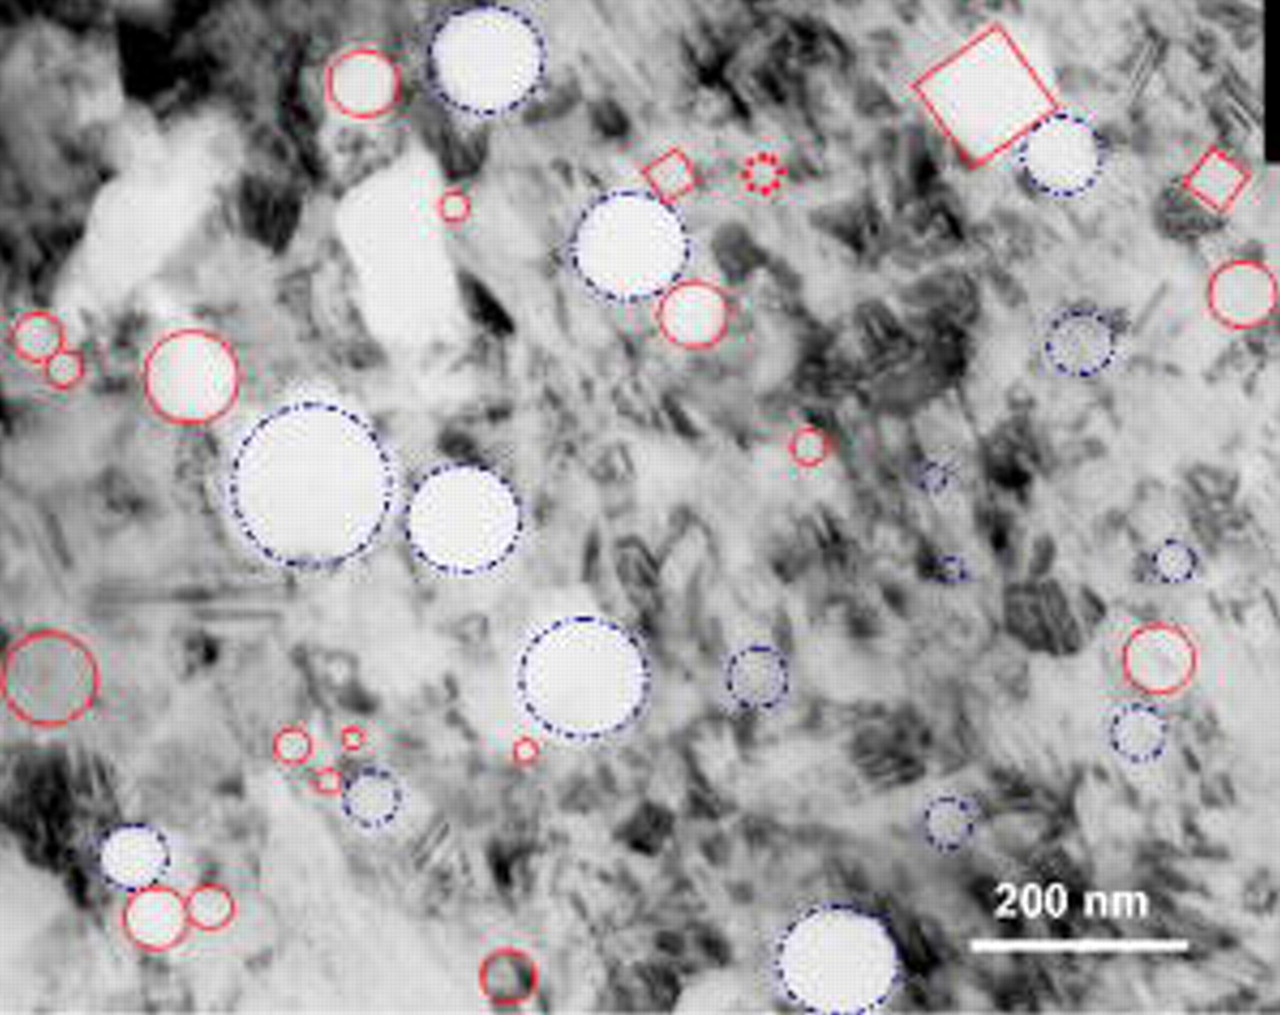
Figure 3. TEM bright-field image of an as-deposited Ni–Cr–Al nanocomposite.
Oxidation Behavior of Ni–Cr–Al Nanocomposites
Oxidation behavior and scale characterization
The oxidation behavior of the electrodeposited Ni–Cr and Ni–Al nanocomposites was studied in air at temperatures around  .32, 33 The results suggested that as a rule of thumb, the amount of Cr needed for the conversion of Ni–Cr nanocomposites (with
  -sized Cr particles) from a NiO former to a chromia former was close to
  ,32 while the amount of Al needed for the conversion of Ni–Al nanocomposites (with
  -sized Al particles) from a NiO former to an alumina former was near
  .33 To corroborate this, binary nanocomposites of Ni–11Cr (mean particle size:
  ) and Ni–13.1Al (mean particle size:
  ) were prepared and oxidized using a Thermax 700 thermogravimetric analyzer (Thermo Cahn, USA) in a flowing commercial dry air at
  , with a heating rate of
  . Scale microstructural characterization indicated that the two nanocomposites truly developed chromia and alumina scales, respectively. On this basis, the
  nanocomposites assembled using the above Cr and Al nanoparticles may transform essentially from a NiO former to chromia or alumina formers, if the amount of
  varies in a range below
  . For this reason, the oxidation kinetics in air at
  of 25 Ni plate samples coated with
  thick nanocomposites with
  were extensively investigated in this study. It was found that the nanocomposites with
  oxidized quickly, with the scaling rates even faster than that of the pure Ni electrodeposits. In contrast, those with
  had oxidation rates generally lower than that of the chromia-forming Ni–11.0Cr nanocomposite. In the latter case, the oxidation kinetics further decreased with a decrease of
  . When the ratio was reduced down to a value roughly below 1.5, the ternary nanocomposites oxidized more slowly than the alumina-forming Ni–13Al nanocomposite. The oxidation curves of some typical ternary nanocomposites during
  exposure are summarized in Fig. 4, where they are compared to those of the reference deposits of pure Ni, Ni–11Cr, and Ni–13.1Al.
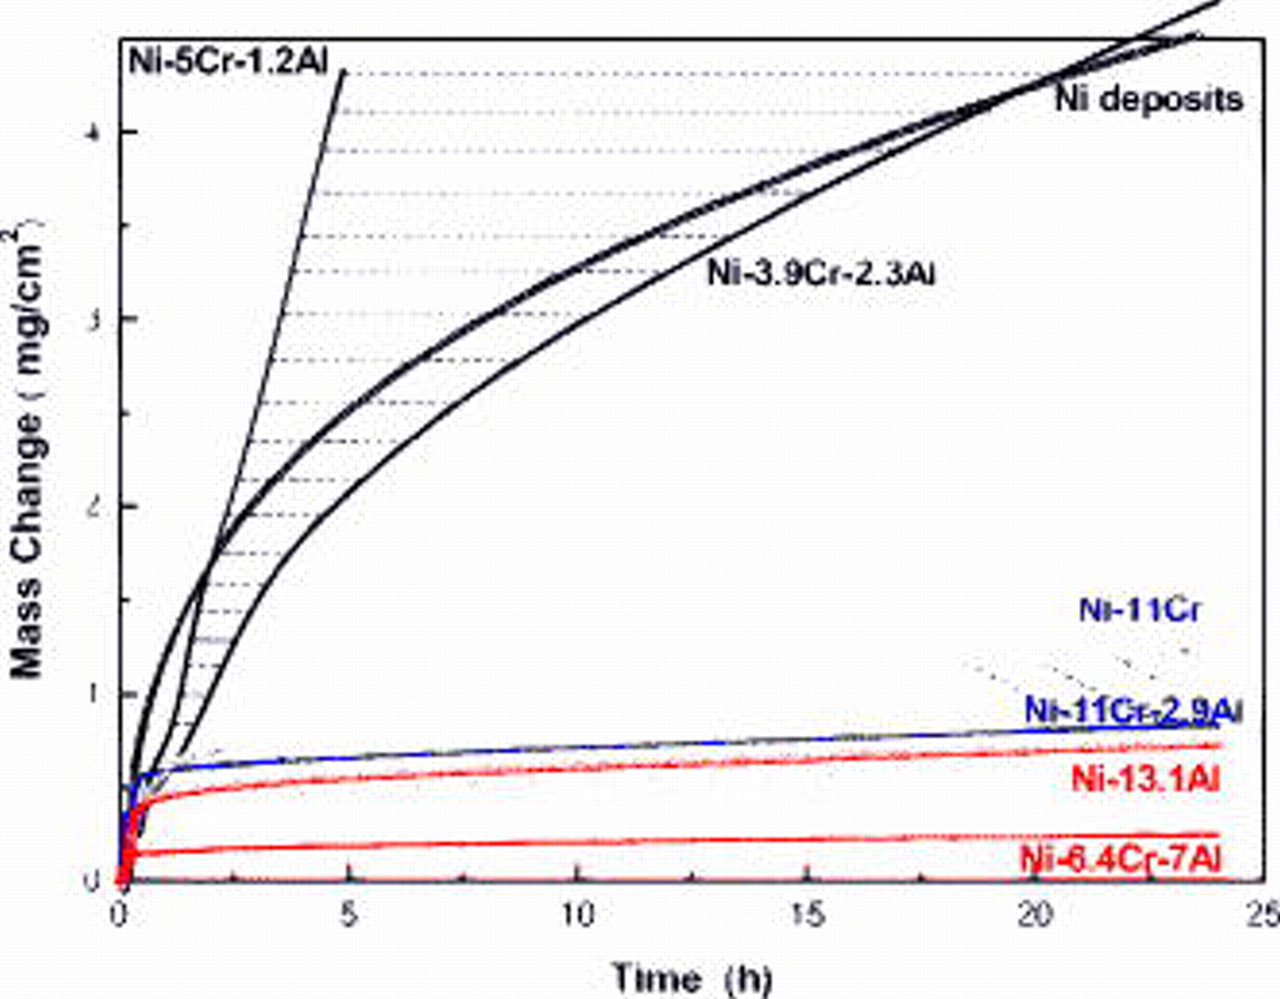
Figure 4. Oxidation kinetics of some typical  nanocomposites in air at
  .
.
The scales formed on the typical nanocomposites were characterized using SEM/EDAX in combination with X-ray diffraction. Figure 5 shows their surface and cross-sectional features. Ni–3.9Cr–2.3Al formed a scale having large-faceted surface NiO crystals (Fig. 5a-1) and a double-layered structure consisting of an outer porous NiO layer and a denser inner NiO layer with incorporated  ,
,  and
and  particles (the spinel oxide formed because of the reaction of NiO with
  and
and  ) (Fig. 5a-2). By considering the fact that at the onset of oxidation the Cr and Al nanoparticles on the surface easily converted into the corresponding oxides, which can then act as immovable inert marks, it is assumed that the interface between the outer and inner layers might approach to the original surface of the as-deposited nanocomposite and that the outer layer formed as a result of an outward NiO growth. Peng et al.34 reported that the pure Ni electrodeposits during oxidation developed a double-layered NiO scale with the outer layer composed of coarse columnar crystals and the inner layer formed of fine equiaxed grains. Some researchers35–37 suggested that the inner layer formation was related to the inward diffusion of oxygen molecular species through the defects (e.g., porosity, microchannels, and cracks), which were normally produced in the growing outer layer. Compared to the oxidation of the Ni deposits,34 Ni–3.9Cr–2.3Al nanocomposite developed a more porous outer layer and a denser inner layer. This difference was mainly due to the precipitation of
  and
and  in the inner NiO layer during oxidation. From Fig. 5a-2, internal
  and
and  particles also appeared beneath the scale. This further implied that, for oxidation of this type of nanocomposites, the inward penetration of oxygen was quick, leading to a deep internal oxidation of Cr and Al that might pre-exist in solution as a result of easy dissolution of these nanoparticles in Ni at such lower contents. The precipitation kinetics of
  and
and  and its effect on the growing NiO-scale structure may be main factors causing the oxidation kinetics of the NiO-forming nanocomposites being slightly higher or lower than that of pure Ni deposits (Fig. 4).
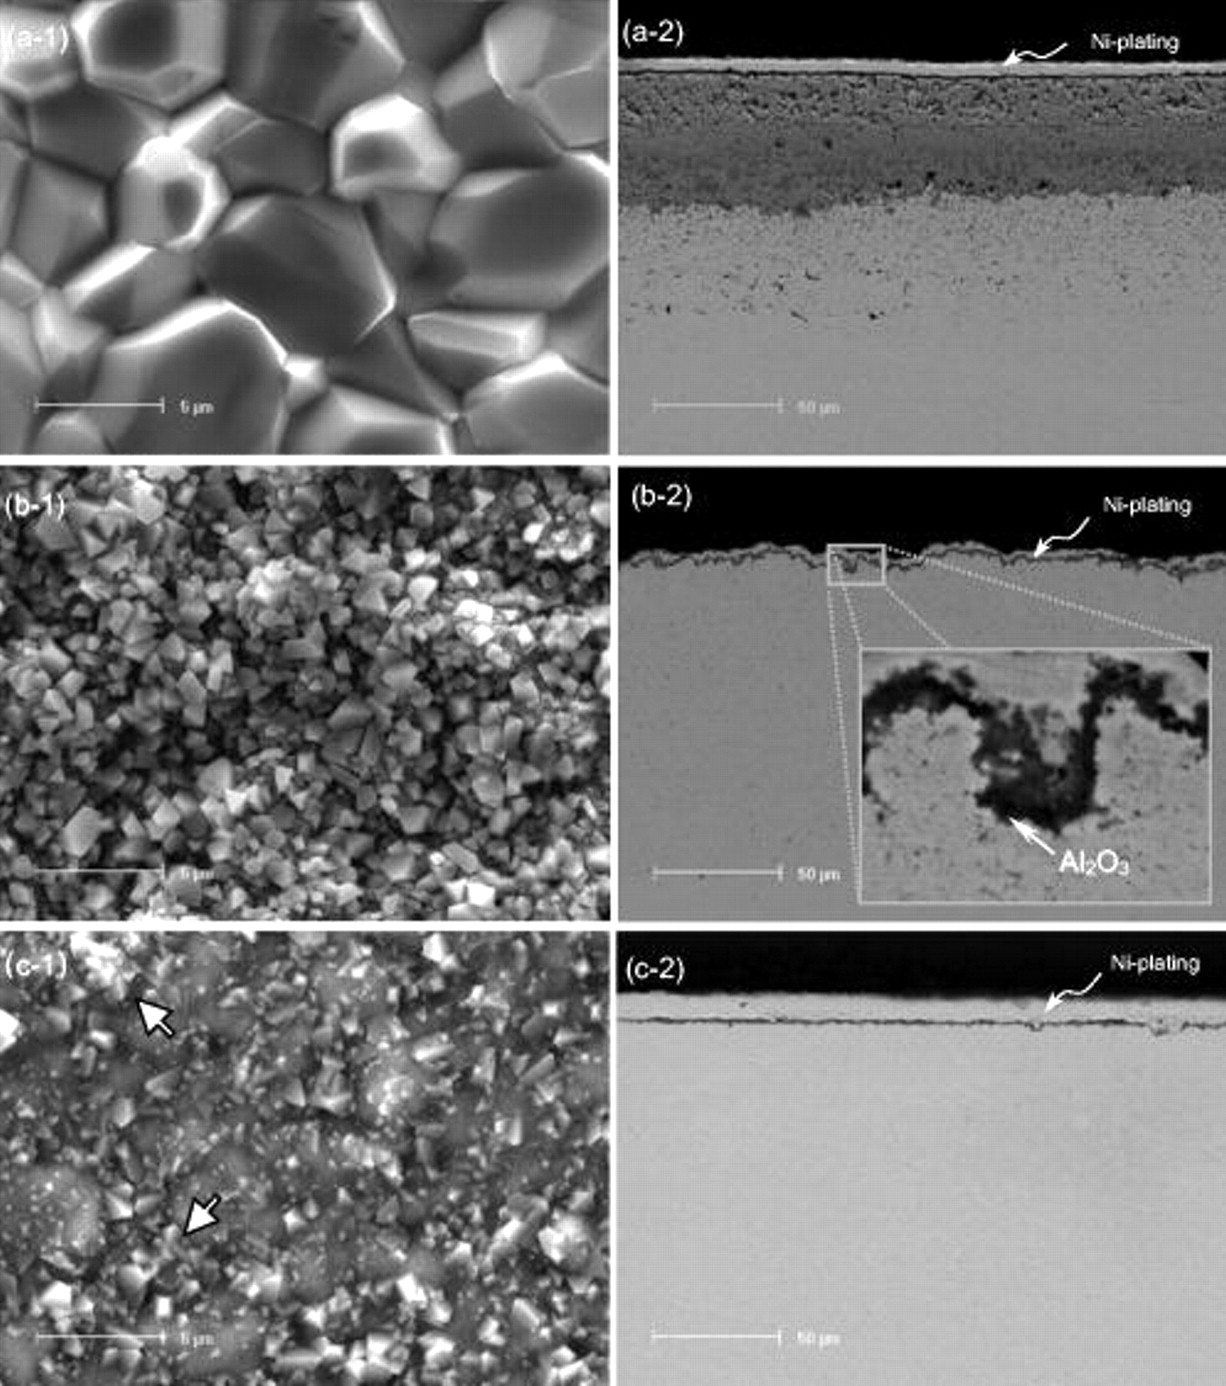
Figure 5. Typical surface and cross-sectional scale features of the  nanocomposites oxidized for
  in air at
  . (a) a NiO-forming Ni–3.9Cr–2.3Al, (b) a
  -forming Ni–11Cr–2.9Al, (c) an
  -forming Ni–6.4Cr–7Al. Arrows in (c-1) indicate some large NiO crystals on the surface.
Ni–11.0Cr–2.9Al (Fig. 5b-1 and 5b-2) developed a finer-grained, external  layer; an inner
  (in its α form) layer also occurred locally, as shown in a magnified view (the inset in Fig. 5b-2). Ni–6.4Cr–7Al developed
  on most areas (Fig. 5c-1). This oxide, different from the large-grained Ni-rich oxide as some arrowed, was so fine in size that its crystal shape was difficult to inspect under the SEM instrument used. TEM observation revealed that the average oxide grain size was
  , as seen in Fig. 6. The TEM foil was prepared by ion-milling to electron transparence from the scale/composite interface. The occurrence of the light areas in Fig. 6 was probably related to the roughened scale surface. Figure 5c–2 presents the cross-sectional morphology of the thin
  scale. Here and also in Fig. 5b-2, the original nanoparticles, as seen in the BEI in Fig. 3, disappeared in the nanocomposites even deeply below the scale. Apparently, they mostly, if not all, dissolved into the Ni matrix during oxidation.
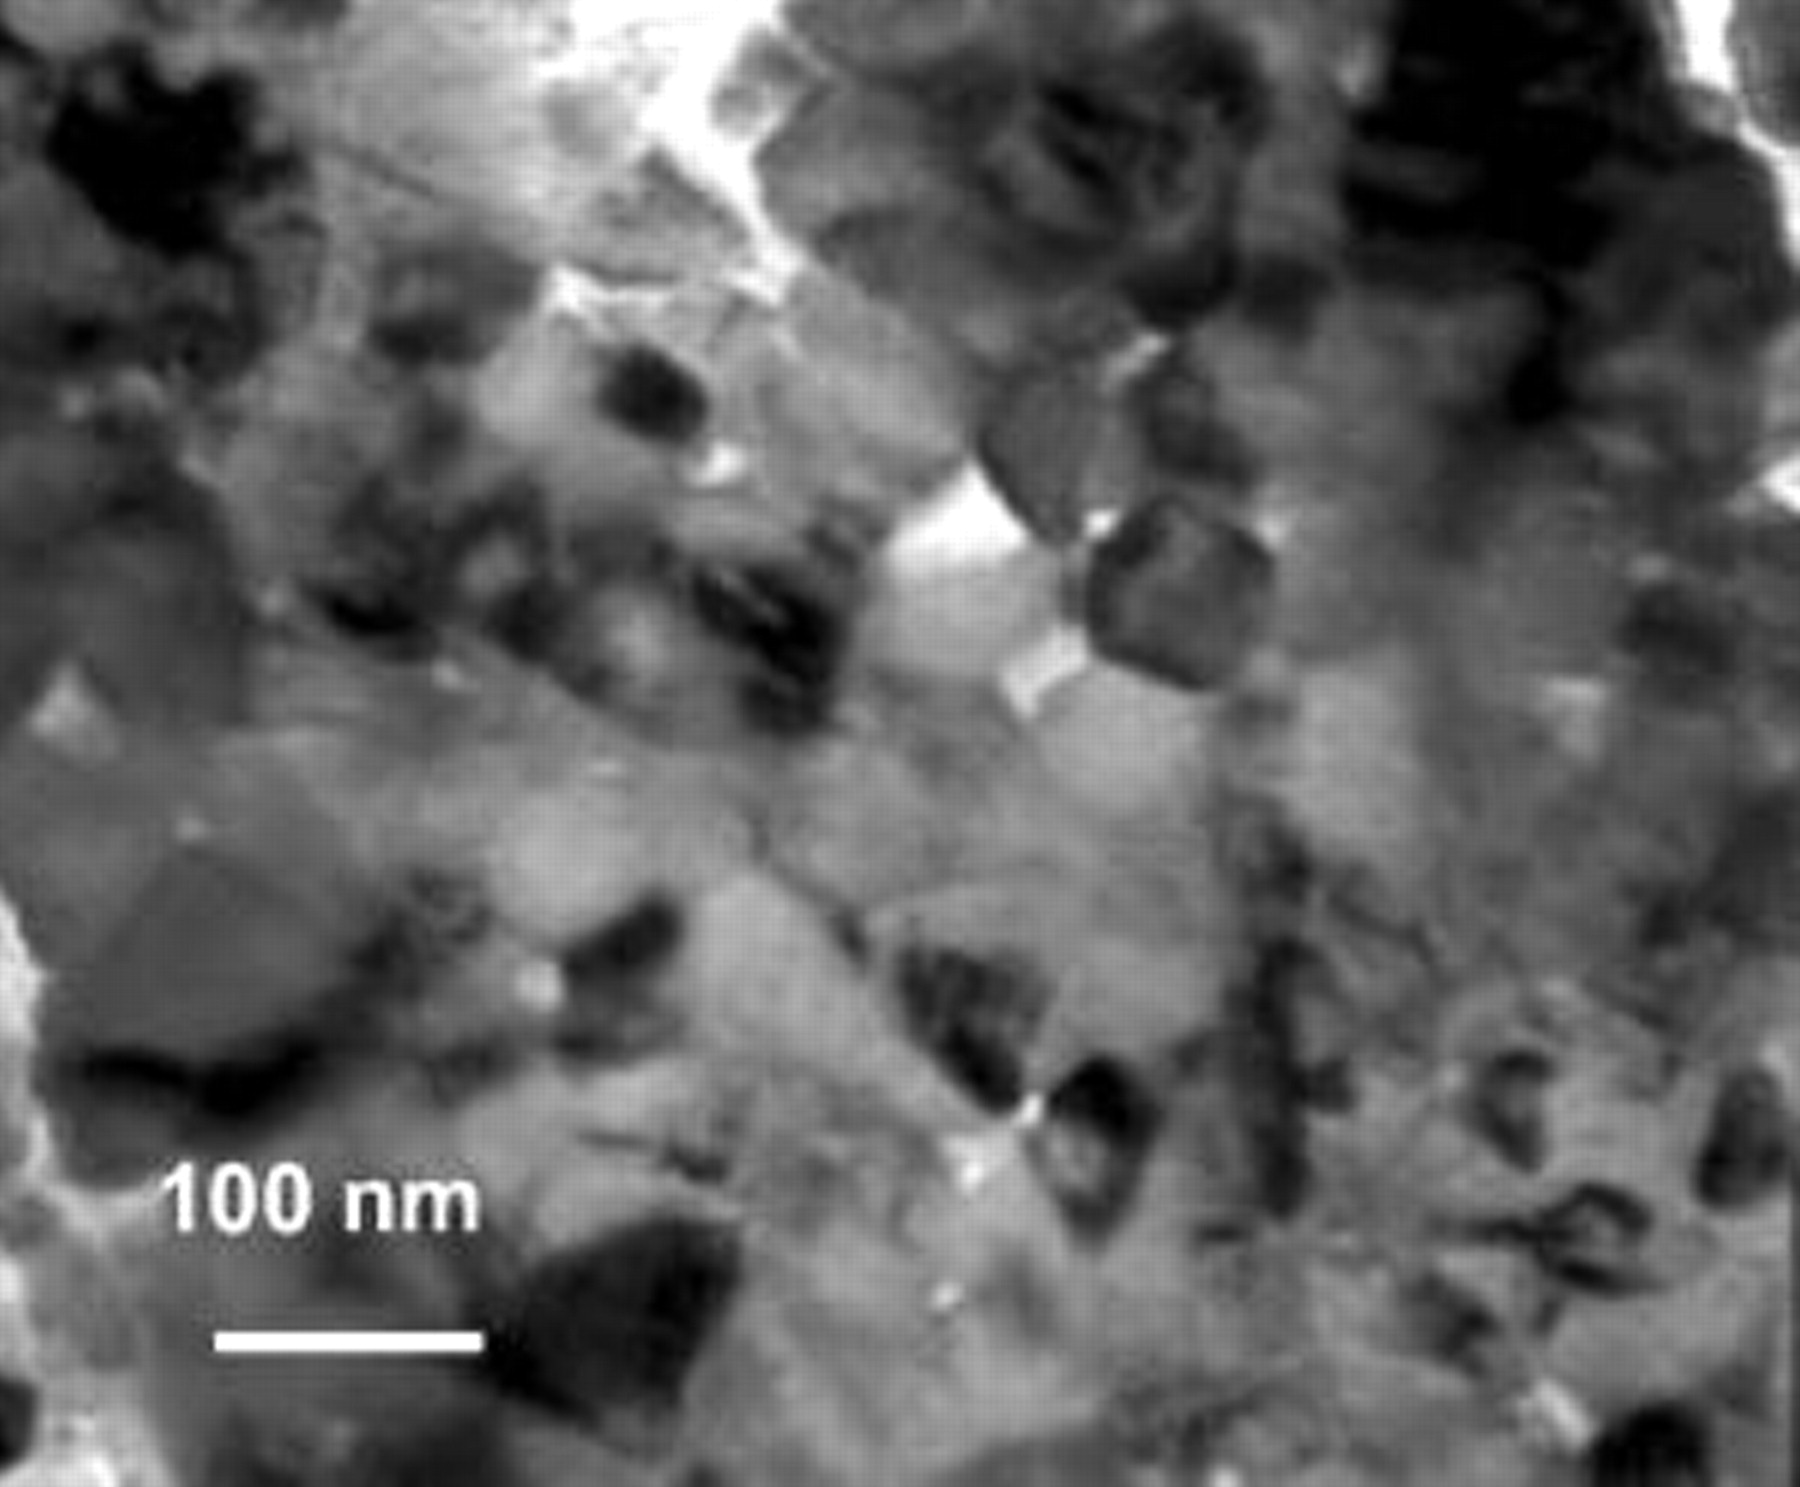
Figure 6. Bright-field TEM image (parallel) of the scale grown on the Ni–6.4Cr–7Al nanocomposite during  oxidation in air at
  .
.
Following the oxidation result, an oxide map correlating the composition ranges of the  nanocomposites with the steady-state oxide scales developed after
  was constructed and presented in Fig. 7. The nanocomposites can be divided into three groups. Composites in group I are NiO formers with
  , those in group II are
  formers with
  but
but  , while composites in group III are
  formers with
  but
but  . Hence, the oxidation behavior of the ternary nanocomposites strongly depends on the actual values of
  and
and  . Moreover, the solid triangle in the oxide map shows that the Ni–4.3Cr–4.2Al nanocomposite assembled using
  -sized Cr particles instead of the above
  -sized particles was also an alumina former, suggesting that the particle size reduction can minimize the critical
  value for alumina scale formation.
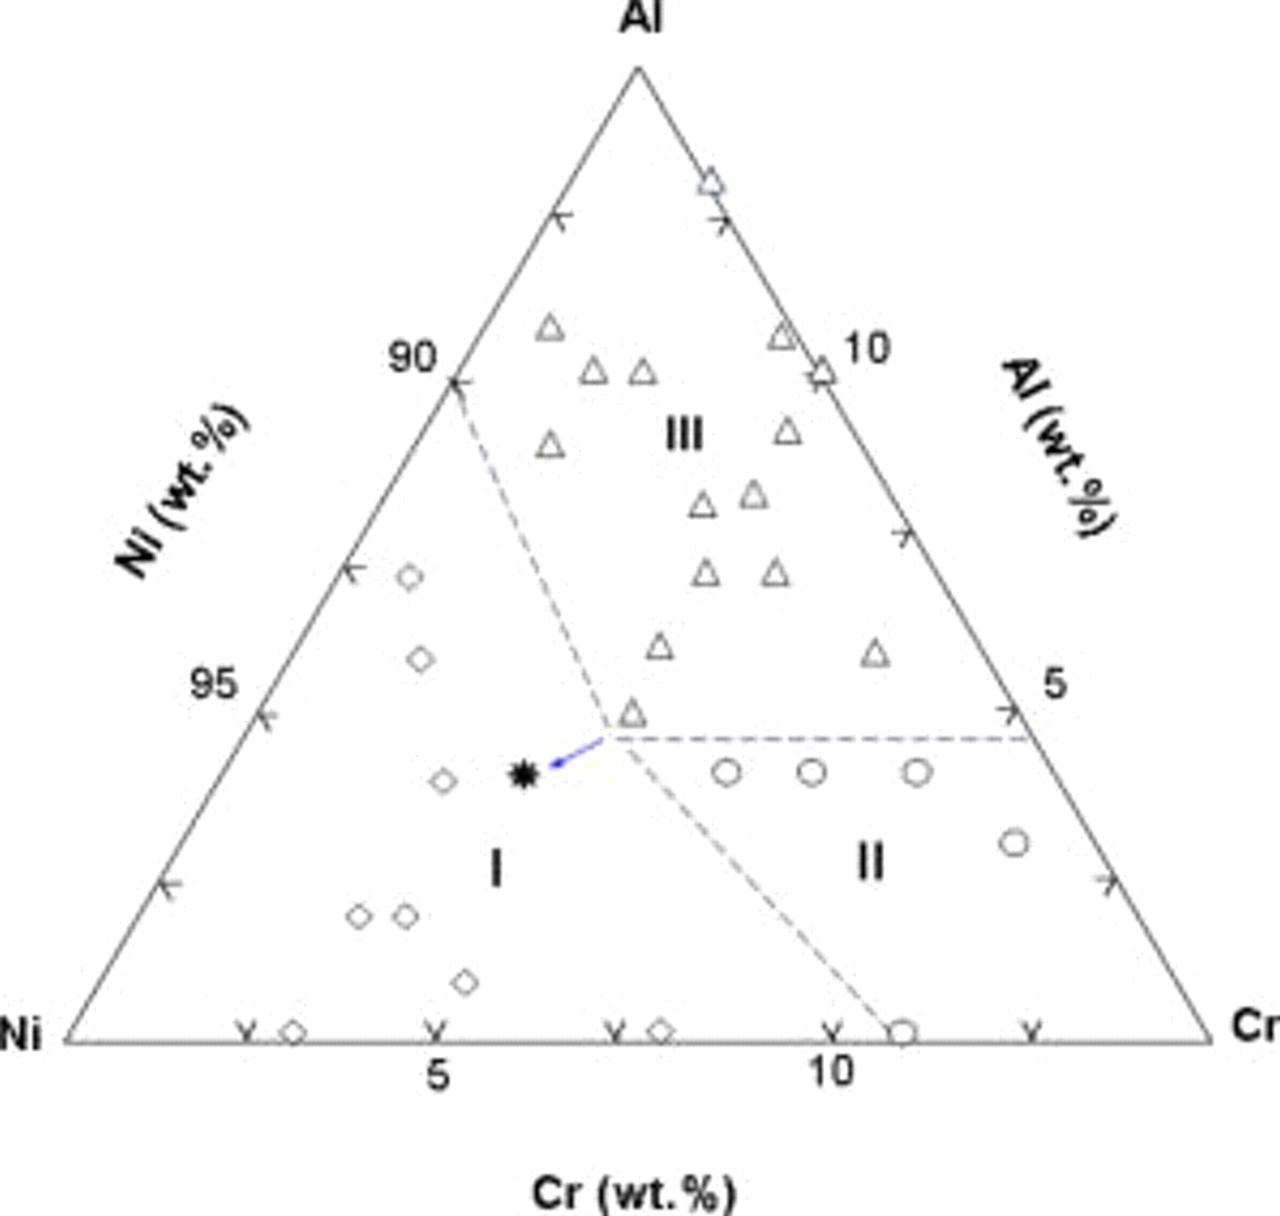
Figure 7. Oxide map for correlating the categories of the composition ranges of the  nanocomposites with the steady-state oxide scales developed. ⋆ corresponds to the nanocomposite assembled using smaller Cr nanoparticles, indicating an extension of the boundaries of I/II and I/III along the arrowed direction with the decrease of Cr particle size.
Comparison of microparticle-codeposited and arc-melted Ni–Cr–Al systems
The oxidation behavior of the ternary nanocomposites was compared to that of two different samples: one was the Ni–Cr–Al composite deposited onto similar nickel plate samples from the aforementioned bath but loaded with appropriate amounts of  -sized Cr and Al particles instead of the nanoparticles, the other was the Ni–Cr–Al alloy, prepared by arc-melting a mixture of pure Ni
  , Cr
, Cr  , and Al
  , which was subsequently annealed in vacuum for
  at
at  . Figure 8 shows the oxidation kinetics in air at
  of two typical nanocomposites: Ni–11.0Cr–2.9Al (
 former) and Ni–3.3Cr–10.1Al (
 former), and their corresponding composite counterparts with similar Cr contents but a higher Al content: Ni–11.3Cr–6.9Al and Ni–2.9Cr–16.2Al. All oxidation curves can be divided into several stages following a parabolic law. The parabolic oxidation constant after
  was calculated. It was
  for the Ni–11.3Cr–6.9Al composite and
  for the Ni–2.9Cr–16.2Al composite; while the value reduces to
  for the Ni–11.0Cr–2.9Al nanocomposite and to
  for the Ni–3.3Cr–10.1Al nanocomposite. Clearly, the composites were oxidized much faster than the nanocomposites. Figure 9 shows the EPMA analysis of the cross-sectioned scale on the Ni–11.3Cr–6.9Al composite. As is evident, the layer of
  and
and  formed below deep NiO protrusions. Figure 10 compares the oxidation curves of the Ni–6.4Cr–7Al nanocomposite and of an arc-melted Ni–6Cr–7Al alloy of similar composition (sample size:
  ; mean grain size:
  ). The CG alloy had a very faster scaling rate in the initial and transient stages
  . After that, the alloy still had a faster steady-state oxidation rate. The parabolic oxidation rate calculated after
  was
was  for the CG alloy and
  for the nanocomposite. Much larger Ni and Cr contents were detected in the scale, compared to the alumina scale formed on the nanocomposite.
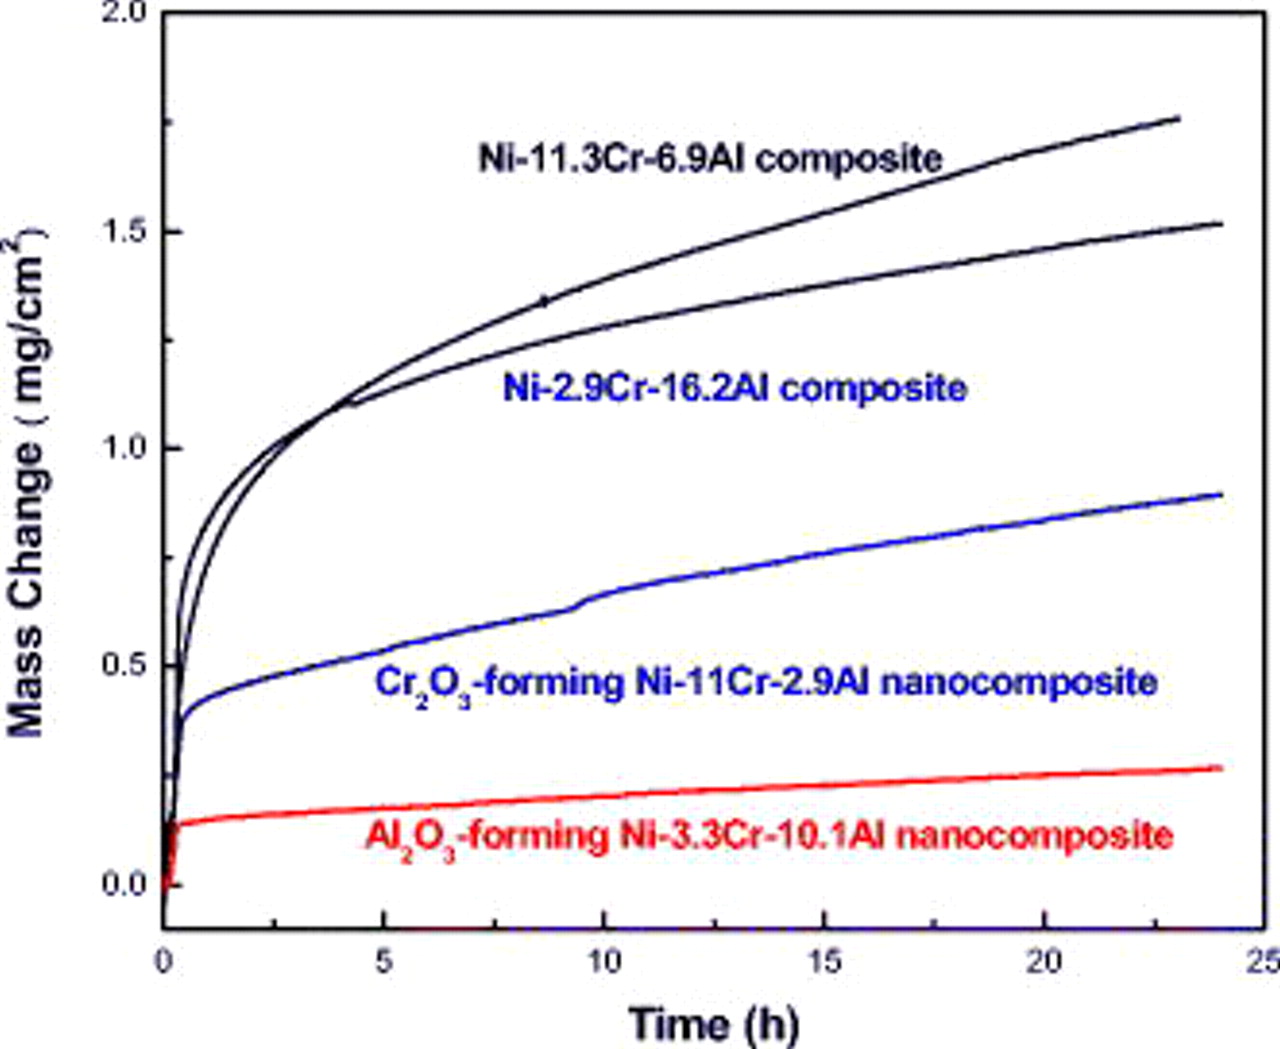
Figure 8. Oxidation curves of  -forming Ni–11Cr–2.9Al and
  -forming Ni–3.3Cr–10.1Al nanocomposites and the corresponding counterparts of Ni–11.3Cr–6.9Al and Ni–2.9Cr–16.2Al composites prepared using micron-sized Cr and Al particles.
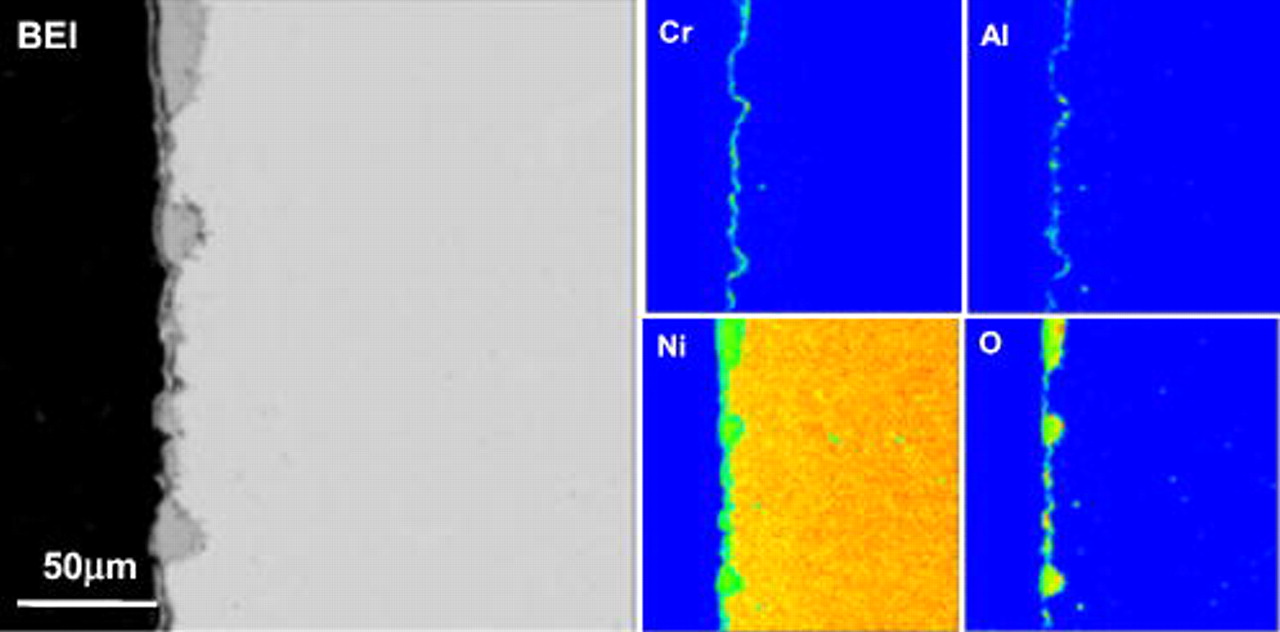
Figure 9. EPMA analysis of cross section of the scale formed on Ni–11.3Cr–6.9Al composite assembled using Cr and Al microparticles after  oxidation in air at
  .
.
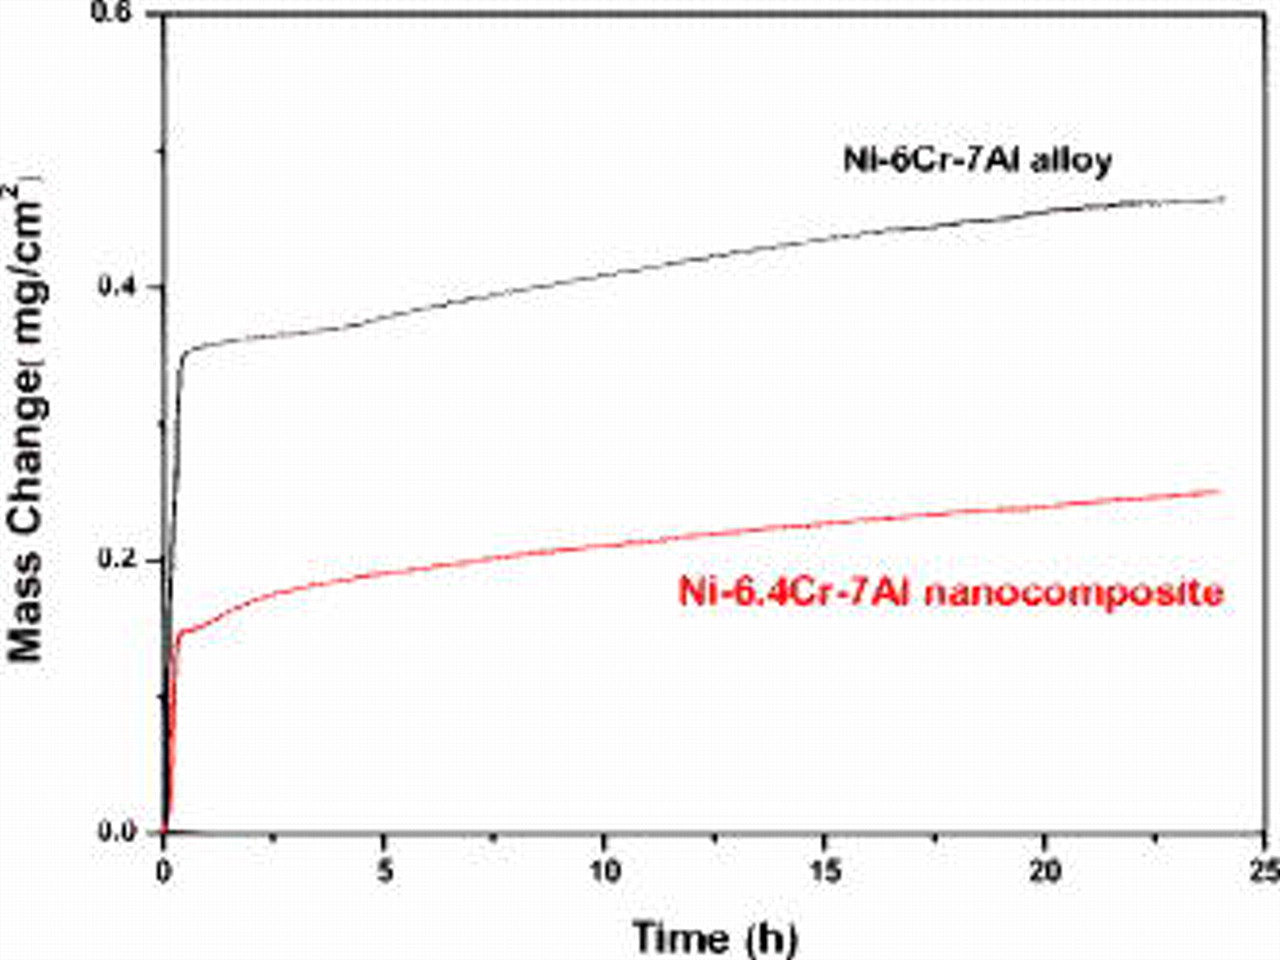
Figure 10. Comparison of the oxidation kinetics of Ni–6.4Cr–7Al nanocomposite and a composition-similar, arc-melted CG Ni–6Cr–7Al alloy for  in air at
  .
.
Discussion
Effect of  and values on selective oxidation


The  nanocomposites have a NC Ni matrix containing a dispersion of Cr and Al nanoparticles in nanolength scale. They can develop external protective scales, even with the
  amounts remarkably lower than the value needed by conventional ternary alloys and coatings for protective scale formation.2–4 This is undoubtedly a result of the unique nanocomposite structure, which may profoundly affect the oxidation process. The details are schematically presented in Fig. 11 and described below.
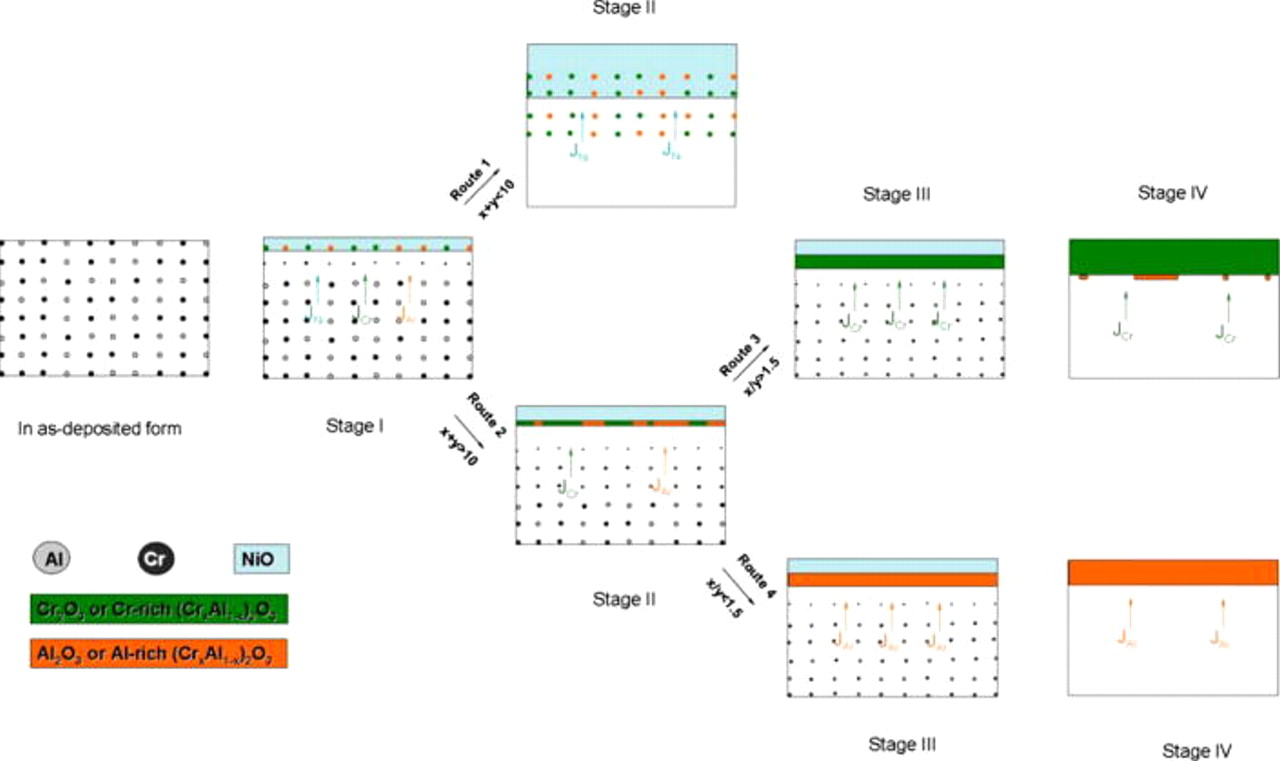
Figure 11. Schematic diagram illustrating the oxidation progression of various  nanocomposites. Stage I: the rapid oxidation of Cr and Al nanoparticles in the near-surface zone to form chromia or alumina islands. Stage II: the development of NiO scale following route 1 due to the lower
  amount, or the linkage of chromia or alumina islands to form a mixed
  and
and  layer following route 2 in the case that the
  level increases up to a threshold value. Stage III: the mixed oxide layer converts into a layer of Cr- or Al-rich
  following routes 3 or 4, depending on the relative magnitude of the Cr and Al fluxes. Stage IV: the
  layer finally develops an external chromia scale in the case of
  or an external alumina scale if
  . (Note: The spinel oxides formed as mentioned in the text are not considered here.)
The nanoparticles assembled are supposed to be uniformly dispersed. They experience two different evolutions, depending on their locations in the nanocomposites from the onset of oxidation: the particles located on the surface or in the near-surface zone act as "diffusionless nucleating sites" for  and
and  , and are quickly converted into oxide islands; those in deeper areas start to dissolve into the Ni matrix, acting as "reservoirs" supplying Cr and Al to the oxidation front for the growth of their oxides. Simultaneously, NiO grows on the particle-free area (stage I). Then, thickening of NiO and lateral coalescing of the
  and
and  islands occurs. Their competitive growth, which is significantly correlated with the
  amount, dominates the subsequent oxidation progression. If the
  level is low and falls below a threshold limit,
  , then the distance between the neighboring
  and
and  islands may be too large and the fluxes of the diffusing species are low, so that the slowly growing
  and
and  islands are dissevered before their linkage by the inward-advancing NiO on the particle-free areas as a result of a rapid penetration of oxygen (see section on Oxidation behavior and scale characterization). In this case, the oxidation continues following route 1. The NiO thickening dominates the oxidation progression, and the recession of the metal/NiO interface leads to the incorporation of the internal
  and
and  particles into the NiO scale (stage II through route 1). This is why the internal Cr- and Al-rich oxide particles occurred in the inner NiO layer on the Ni–3.9Cr–2.3Al nanocomposite (Fig. 5a-2). Conversely, if the
  level exceeds
  , the initially formed
  and
and  islands can link together through their lateral growth during a short initial stage, establishing a continuous, mixed
  and
and  layer (stage II through route 2). It efficiently suppresses the NiO growth.
Thereafter, whether the nanocomposite develops chromia or alumina scales depends on the  ratio (Fig. 7). This reason may be further illustrated in Fig. 11. After the establishment of a continuous layer of a mixture of
  and
and  (with Cr and Al concentration distribution differing from place to place at this time), its thickening starts.38
  and
and  (in its α phase) have a similar corundum, hexagonal close-packed (hcp) crystal structure and can form continuous solid solutions
  .39, 40 Therefore, the mixed
  and
and  layer can first convert into a thickened layer of Cr- or Al-rich
  solid solutions (stage III via route 3 or 4), depending on the relative magnitude of the fluxes of Cr and Al in the nanocomposite for the oxide growth. For the nanocomposite with a large
  value (i.e., with a low Al content), the dominance of the flux of Cr over that of Al causes the transformation of the Cr-rich
  layer into a
  layer. Conversely, if the
  value decreases below a lower limiting value (e.g.,
  in this work), the larger Al flux in comparison to the Cr flux converts the Al-rich
  layer into an
  layer. The subsequent steady-state thickening of the chromia or alumina layer eventually converts the top NiO layer into an external chromia scale (stage IV in route 3) or into an external alumina scale (stage IV in route 3) by the following process: NiO progressively reacts with
  or
or  from the interface of the NiO layer and the underlying layers of
  or
or  to form
  or
or  spinels, which have an hcp structure similar to those of
  and
and  , then these spinels convert into the latter oxides as a result of continuous incorporation of the diffusing Cr or Al cations.
This study shows that when  is in the range of
  and
and  , decreasing y from
  still guarantees the
  nanocomposites to develop an
  scale. Adding more Cr can decrease the Al content needed for the alumina scale formation. This result may constitute an example of the third element effect (TEE), which was first suggested by Wagner.41 That is, the second most reactive element like Cr in Ni–Cr–Al alloys can be regarded as the third element that acts as a getter for oxygen in the alloy during the initial stage, decreasing the oxygen solubility in the alloy and favoring the transition from internal oxidation of the more reactive component, Al, to its external oxidation at lower Al levels. Giggins and Pettit2 attributed the TEE to the precipitation of internal oxides of the two most reactive components in ternary alloys, which produces an overall volume fraction of internal oxides that reaches the critical value required for the transition to external oxidation, based on a criterion defined by Wagner.42 Recently, Niu et al.43 gave a semi-quantitative approach on the dependence of the overall critical volume fraction,
  (ov) (usually set equal to 0.3),44 of the two internal oxides, on the critical content of Cr
  and Al
  in the Ni–Cr–Al system, as presented below
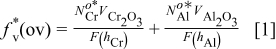
where  is the ratio of the molar volumes of the alloy and the corresponding oxide,
  is an auxiliary function given by
  , while
  and
and  (where
  and
and  are the diffusivities of Cr and Al in the Ni matrix, and
  ,
,  are the depth of the internal oxidation front from the alloy surface at time
  , respectively). In an approximate treatment (ternary diffusion interactions are neglected), it is found that
  decreases linearly with the increase of
  .
.
Reasons for increased ability to form alumina scales
Con ventional  overlay or bond coatings are normally alumina formers. Exclusive external alumina scales can form when Al contents are over
  with
with  .4 However, the three-component nanocomposites with lower
  level, such as Ni–6.4Cr–7.0Al, developed an alumina scale. The increased ability of selective oxidation of aluminum may be related to the fact that oxygen solubility in the near-surface nanocomposite zone is sharply minimized from the onset of oxidation as a result of prompt, simultaneous precipitation of internal chromia and alumina through the reaction of the nanoparticles there with the inward penetrated oxygen.2 Another reason may be related to the fact that the nanocomposite has a NC Ni matrix, where numerous grain boundaries (GBs) serve as "short-circuit channels" for supplying sufficient Al toward the oxidation front for the alumina growth. The interpretation can be indirectly evidenced by the comparative TEM/EDAX characterization of the initial scales formed on the Ni–6.4Cr–7.0Al nanocomposite and on the composition similar CG alloy. After
  oxidation in air at
  , the scales grown on the two samples were peeled off by grinding from the metal side and then ion milled for TEM investigation. The CG alloy formed NiO grains of average
  size, which may include minor
  or spinel
  , on the basis of the EDAX analysis (Fig. 12). Conversely, the initial scale on the nanocomposite was finer grained, with a grain size generally around or below
  [Fig. 13a], which formed due to greatly increased density of nucleation sites for chromia or alumina. This was confirmed by the EDAX acquisition of much higher Cr and Al levels in the TEM image (Fig. 13b). Thus, the initial scale on the nanocomposite transforms more easily into the alumina scale, as proposed in the model given in Fig. 11.
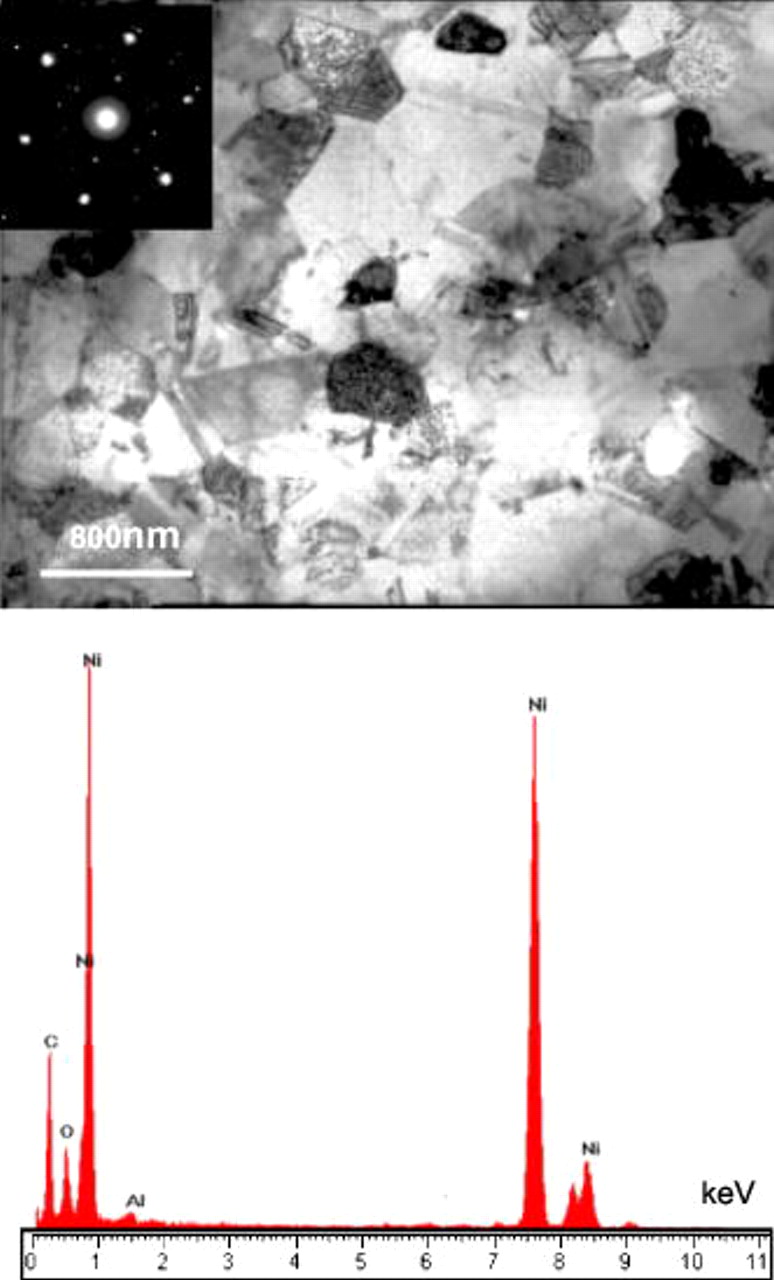
Figure 12. TEM bright-field image and the corresponding EDAX analysis of the scale formed on arc-melted CG Ni–6Cr–7Al alloy for  oxidation in air at
  .
.
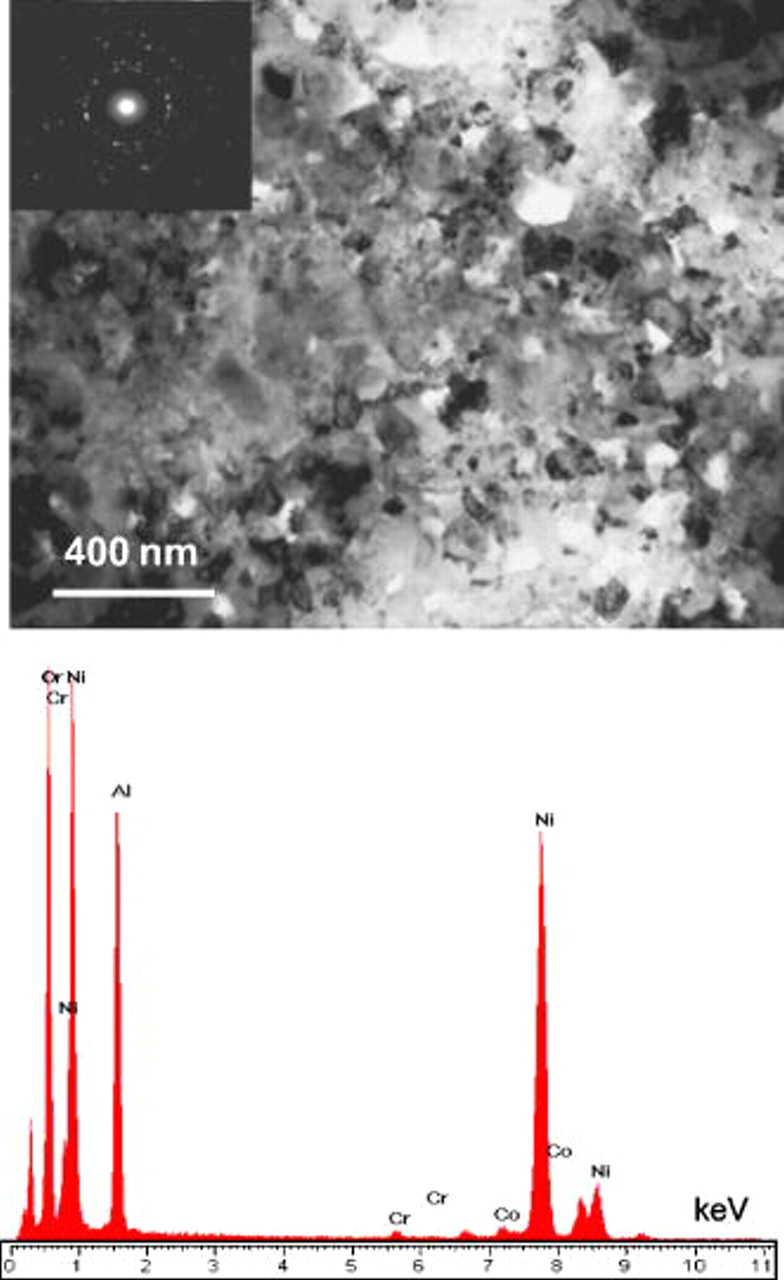
Figure 13. TEM bright-field image and the corresponding EDAX result of the scale formed on Ni–6.4Cr–7Al nanocomposite for  oxidation in air at
  .
.
This result also indicates that the  level for alumina scale formation is reduced from
  , when
  -sized Cr particles of the nanocomposite are replaced by particles of
  (Fig. 7). This fact can also be interpreted using the above model. The finer the dispersed particles are, the smaller the interparticle spacing is, if the nanocomposites have comparable contents of Cr and Al, and consequently, the easier the linkage of alumina islands is to form a continuous layer. Hence, the
  relies on the actual size of particles. This conclusion is supported by the fact that the Ni–11.3Cr–6.9Al composite assembled using
  –sized particles of Cr and Al, although having a
  value higher than that of the chromia-forming nanocomposite Ni–11Cr–2.9Al, formed thick NiO scales on many areas (see section on comparisons of microparticle-codeposited and arc-melted Ni–Cr–Al systems). This is because the actual interparticle spacings on many areas of the microparticle-assembled composite are too large to be completely covered by the laterally processed
  (or
(or  ) before they are protruded through by the NiO growing inward. The latter can explain why no further oxidation data were published on the electrodeposited Ni–Cr–Al composites dispersing the prealloyed CrAl-rich microparticles, because they were synthesized two decades ago.23, 24 According to this study, the ternary composite system to develop an exclusive external alumina scale should have much higher content of the Cr- and Al-containing microparticles. Unfortunately, the latter condition is difficult to achieve using the composite electrodeposition.45
Finally, the long-term stability and durability of the alumina-forming nanocomposites depends on the maintainence of a steady-state growth of this oxide. This condition can only occur if the flux of Al diffusing from the nanocomposite interior to the scale/composite interface equals to that from the interface to the scale surface required for alumina growth. During a long-term exposure, the Al flux in the alloy kinetically decreases with oxidation time, because of a progressive decrease in the amount of Al needed for the steady-state growth of alumina. In this case, the flux decrease by the coarsening of the NC Ni grains, which should occur during oxidation, may not be too significant to affect the stable oxide growth. Our study shows that the Ni grains, although coarsened, are still submicron sized.46 The ultrafine-grained structure is able to sustain Al transport at a relatively fast rate, at which the Al amount arriving at the interface can reach the value required for the alumina thickening. Thus, one can expect that if the  nanocomposites have appropriate thickness and high Cr and Al content, they can quickly develop an exclusive external alumina scale, which would continuously grow for a long-exposure period at high temperatures. Hence, the alumina-forming
  nanocomposites fabricated through the electrochemical method may be potentially used as overlay coatings or bond coats for TBCs.
Conclusions
Using a technique of electrochemical codeposition, nanoparticles of Cr and Al can be simultaneously assembled into a Ni deposit template to form  nanocomposite systems composed of a nanocrystalline Ni matrix with the Cr and Al nanoparticles distributed randomly in nanolength scale. The content of Cr and Al of the nanocomposite alters with the concentration of the corresponding particles loaded in the electrolyte bath. The oxidation property of the
  nanocomposites profoundly depends on the total
  amount, the
  ratio, and the actual particle size. They will thermally develop protective chromia or alumina scales, if the total
  amount exceeds a critical content value (at an average Al particle size of
  , it was
  for
for  –sized Cr particles but reduced to
  when they were replaced by
  –sized particles). In this case, they would further transform from chromia to alumina formers if the
  ratio decreases down to a limiting value (e.g.,
  in this study).
The critical  content is lower than the values needed for the growth of chromia or alumina scales on conventional CG ternary alloys or the ternary composites prepared using conventional micron-sized particles. This is a consequence of the fact that the unique structure of the nanocomposites favors the establishment of a continuous, protective layer of chromia or alumina during a short, initial transient stage. In this period, the nanoparticles assembled in the near-surface zone are quickly oxidized to form chromia or alumina islands, which would be easily linked together because they have an average nanospacing and the short distance can be promptly covered by a lateral growth of chromia and alumina, as a result of a sufficient supply of Cr or Al from the nanocomposite, via numerous GBs in the finely grained Ni matrix.
On the basis of this study, the oxidation properties of the  nanocomposites may be further improved by structural tailoring and compositional optimizing, such as assembling more nanoparticles as well as reactive element oxide particles (e.g.,
  ) capable of exerting REEs on oxidation.14–16 Hence, the alumina-forming ternary nanocomposites may play a similar role as the traditional Ni–Cr–Al base coatings in providing a desired high-temperature oxidation protection to metals with poor oxidation performance. This strongly suggests that the electrochemical assembly of Cr and Al nanoparticles into a finely grained base metal (Ni, Co, Fe, or their combinations) is an alternative to the conventional deposition techniques of M–Cr–Al–Y (or
  ) overlay or bond coatings.
Acknowledgments
Financial support from the National Natural Science Foundation of China (NSFC) project (grant no. 50571108) and "One Hundred Talents Plan" sponsored by the Chinese Academy of Sciences. X.P. also thanks Professor F. Gesmumdo at DICheP, Università di Genova in Italy, for his comments.