
Abstract
This paper addresses the possible mechanisms underlying the capacity enhancement through polyetheramine [PEA, glyceryl poly(oxypropylene)triamine] coating on  (Phostech Lithium) particle surface. X-ray photoelectron spectroscopy (XPS) and Fourier transform infrared studies have confirmed the presence of PEA on the surface by the appearance of the N 1s peak in the XPS spectra and bands in the
  wavenumber range of the IR spectra. Potentiostatic measurements in organic electrolytes have shown that the discharge capacity is increased ca. 12% compared to the as-received material, i.e., more
  ions are utilized during the redox process. This is due to better wettability of the electrolyte to the particle surface, which is indicated by the slower sedimentation of coated particles. Furthermore, cyclic voltammetry has shown that PEA-coated particles display higher capacity than the as-received material also in an aqueous electrolyte, which to some extent can be explained by the difference in wettability between the materials, but also by the protection of
  from spontaneous formation of a
  surface layer and
  -containing solids when in contact with water.
Export citation and abstract BibTeX RIS
The increased demand on mobile electronic devices has led to a corresponding increase in demand on mobile power sources. Much research has focused on energy storage solutions such as rechargeable batteries; in particular, Li-ion batteries. An emerging demand on the power source for miniature electronic devices (e.g., microelectromechanical systems) has recently driven the research society to develop microbatteries,1–4 while at the same time, research on upscaled Li-ion battery production for hybrid electric vehicle applications is more relevant than ever.5–8
For the past decade,  has attracted much attention as a cathode material for Li-ion batteries, not least for upscaled applications. The material is nontoxic—thereby environmentally friendly—thermally stable, easy to synthesize, and potentially inexpensive.9 However,
  exhibits the disadvantages of having comparably low electronic conductivity9 and a slow transport of the lithium ions.10 Its poor electronic conductivity has so far been combated by decreasing particle size,11–13 increasing operating temperature,14 or modifying the particle surface with a thin layer of electronically conducting material, e.g., carbon,15–20 silver,21 or zinc oxide.22 Choi and Kumta recently showed that using lauric acid surfactants during the synthesis process can optimize the particle-size uniformity and thereby minimize the agglomeration of
  powder during the synthesis.23
In a recently published paper, we discussed an additional approach to further improve the electrochemical performance of  .24 Short-chain polymer surfactants, hexadecylamine and polyetheramine [PEA, glyceryl poly(oxypropylene)], were deposited onto Phostech Lithium
  particles to create ultrathin electrolytes for microbattery applications. The surfactants were self-assembled onto the solid/liquid particle interface and assumed to form a thin-film coating following the contours of the
  substrate. The thickness and chemical nature of the coating layer, estimated to between one and a few molecular monolayers, could be controlled by the chemical structure of the surfactant molecule and by the surfactant solution concentration during the coating process. When depositing a thin layer
  of PEA (from 25 mM ethanol solution), a significant capacity enhancement (ca. 12%) as compared to the as-received material was observed.
That polymer coatings on Phostech Lithium  can result in a capacity increase has also recently been shown by Huang and Goodenough.25 However, their approach was fundamentally different from ours; they used electrochemically active polymers (polypyrrole and polyaniline) to replace the conductive carbon and binder. These polymers were electrochemically active, with the redox reaction occurring in the 2.0–3.8 V range, and thereby gave an electrochemical contribution to the overall capacity. Our polymer coatings are electrochemically inactive.
In the work presented here, an in-depth analysis has been made of the PEA attachment, and possible mechanisms for capacity enhancement are proposed. X-ray photoelectron spectroscopy (XPS) and Fourier transform infrared (FTIR) measurements were carried out to characterize the surface of the coated particles. Cyclic voltammetry (CV) has also been used to acquire qualitative information on the kinetics of the electrochemical processes taking place at the electrode surfaces. Electrochemical measurement was also performed using an aqueous electrolyte to study the effect of solvent polarity on the electrode/electrolyte interface.
Experimental
Phostech Lithium  (with 2 wt % carbon coating and a discharge capacity of 153 mAh/g at
  according to the manufacturer) was used as received for the surfactant coating procedure. The procedure of the surfactant coating onto the
  particles was described elsewhere.24 Blank samples (hereafter also referred to as 0 wt % PEA) were made by ultrasonic bath treatment of the as-received material dispersed in ethanol.
FTIR measurements were performed using a Perkin-Elmer Spectrum One Spectrometer with a diamond cell; the wavenumber range was  . XPS analyses were performed using a PHI 5500 system with monochromatic
  radiation at 1.486 keV.
Electrodes were prepared by spreading a mixture of 75% active material (including their coating), 10% carbon black (Cabot, as received), and 15% poly(vinylidene fluoride) (PVdF) (Fluka, as received) binder onto aluminum foil; the thickness of the electrode layer was ca.  . The solvent used was
  -methyl pyrrolidone (Selectipur, Merck, as received) mixed with the PVdF binder in a 5 wt % solution.
Electrochemical measurements with an organic solvent electrolyte were carried out in cells vacuum sealed in "coffee-bag" packaging with a two-electrode setup. Circular electrodes  with a mass of active material in the range 4–6 mg were dried overnight at
  in a vacuum furnace before cell assembly. Half-cells with the configuration
  glass–wool separator soaked in the electrolyte
  were assembled in a glove box under a dry argon atmosphere (
 and
and  ). The electrolyte was 1 M
  (Stella Chemifa) dissolved in ethylene carbonate (EC) (Ferro, battery grade) and diethyl carbonate (DEC) (Alfa Aesar,
  ) in a 2:1 volume ratio. The
  salt was dried overnight at
  under vacuum before dissolving into the electrolyte; the solvents were used as received.
The electrochemical measurements with an aqueous-solvent electrolyte were carried out with a three-electrode setup with Ag/AgCl as reference and Pt as counter electrode. Square electrodes  with a mass of active material in the range 1.2–1.4 mg were used as a working electrode. The electrolyte was 1 M
  (ICN Biomedicals, as received).
The CV measurements were performed on a Bio-Logic VMP2 cycling system. The potential window was 2.7–4.2 V vs  (for 15 wt % of PEA on the particle surface, it was 2.0–5.0 V vs
  ) for the organic system, and −0.3 to 0.7 V vs Ag/AgCl KCl (3.5 M) for the aqueous system, with a constant sweep rate of 0.1 mV/s for the organic system and 0.2 mV/s for the aqueous system. The cathodic potential step experiments, to record the current transients from 4.2 to 2.7 V, were performed using an
  type II potentiostat. The galvanostatic measurements were carried out using a Digatron BTS-600 battery testing system using a charge and discharge rate fixed at 0.1C. Cycling was performed at room temperature between 2.7 and 4.2 V vs
  .
.
Results and Discussion
The PEA surfactant (Fig. 1) formed a stable layer on the surfaces of the  particles, which was spectroscopically shown for higher concentrations (Fig. 2). FTIR measurements on the pristine material only exhibit bands in the
  range. These derive from the stretching mode of the
  groups.26 Additional peaks were found for the surfactant-coated
  particles; see Fig. 3. Comparisons with the spectrum of the pure surfactant confirm the presence of PEA on the particles. Bands in the
  range derive from C–H stretching modes in the
  and
and  groups.27 In the lower wavenumber range, bands at
  originate from
  and
and  deformations.27 That these peaks were not visible in the
  spectrum with a 1% PEA is probably because the amount of the surfactant is below the detection limit.
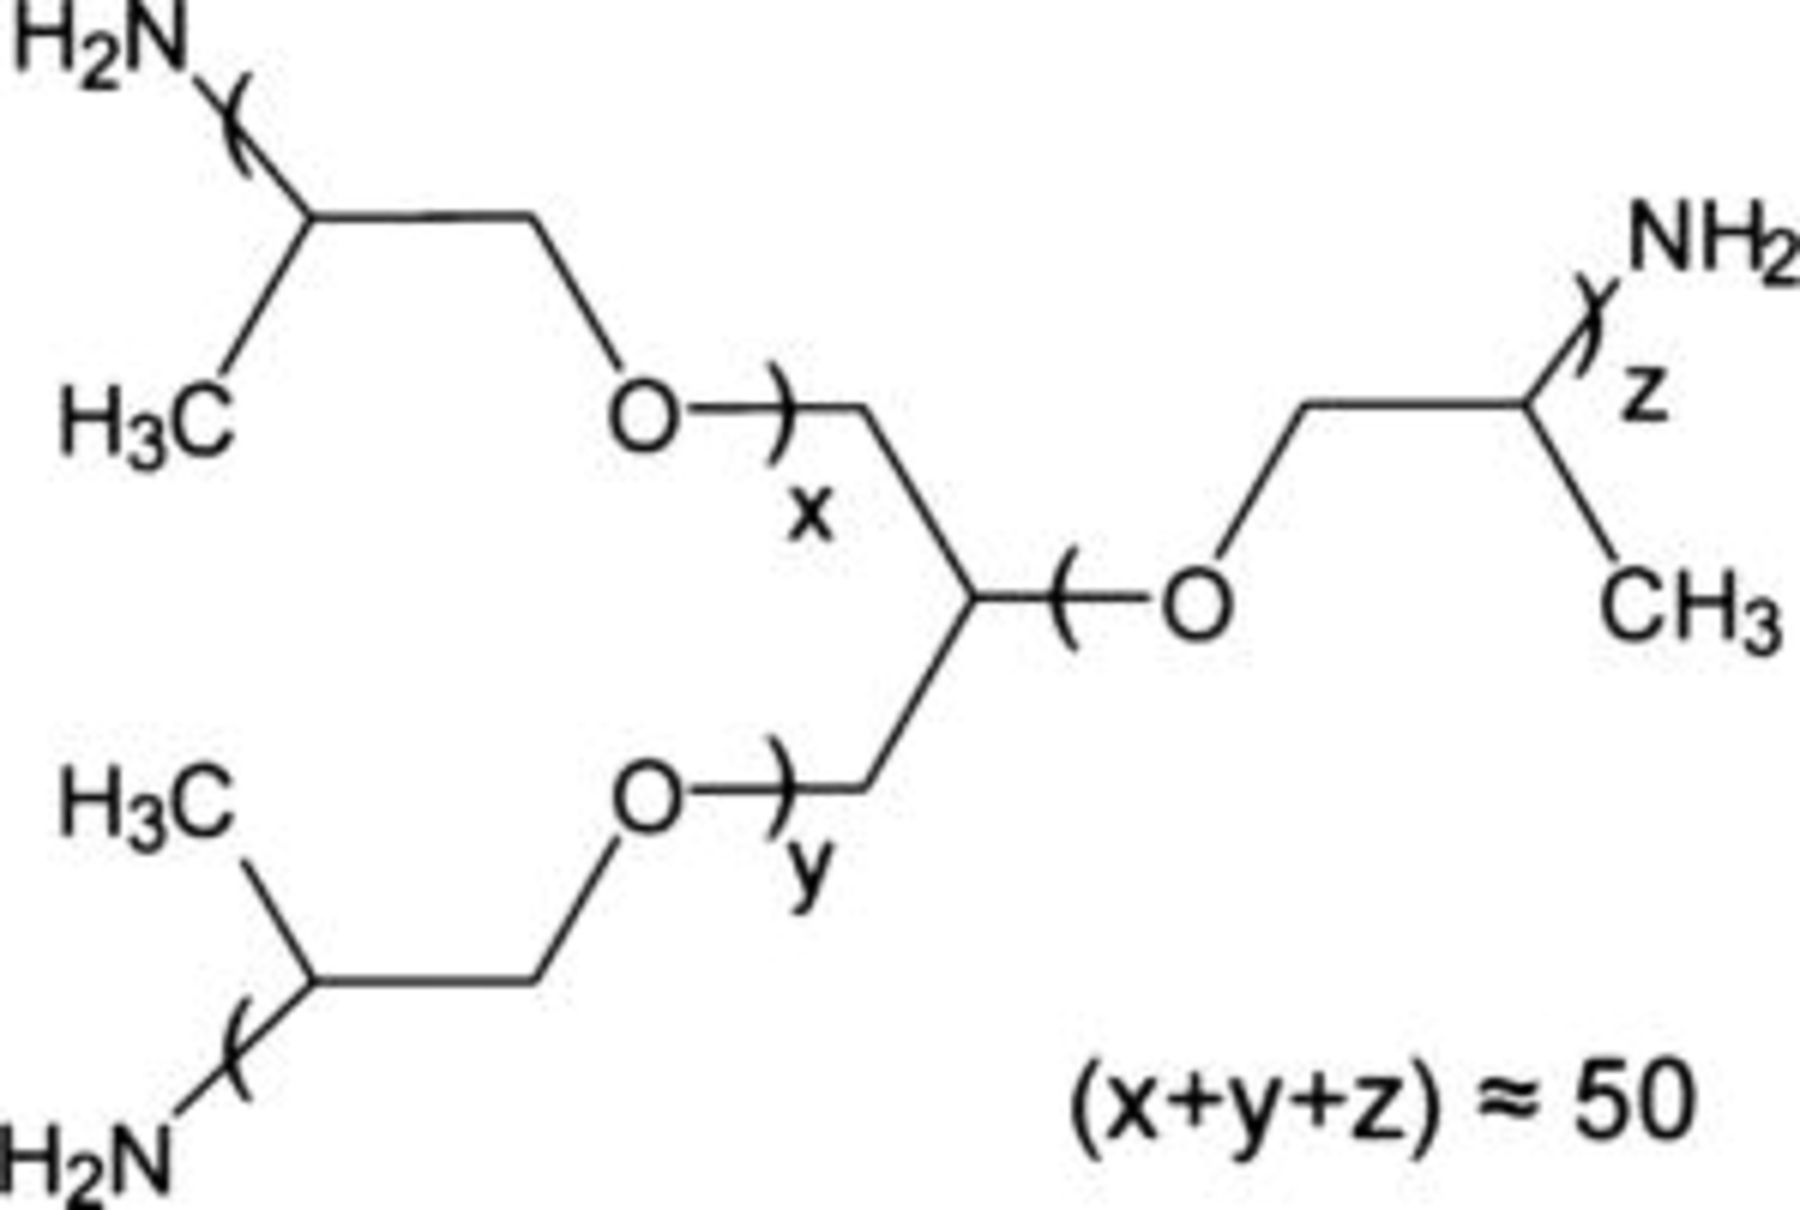
Figure 1. Chemical structure of PEA.
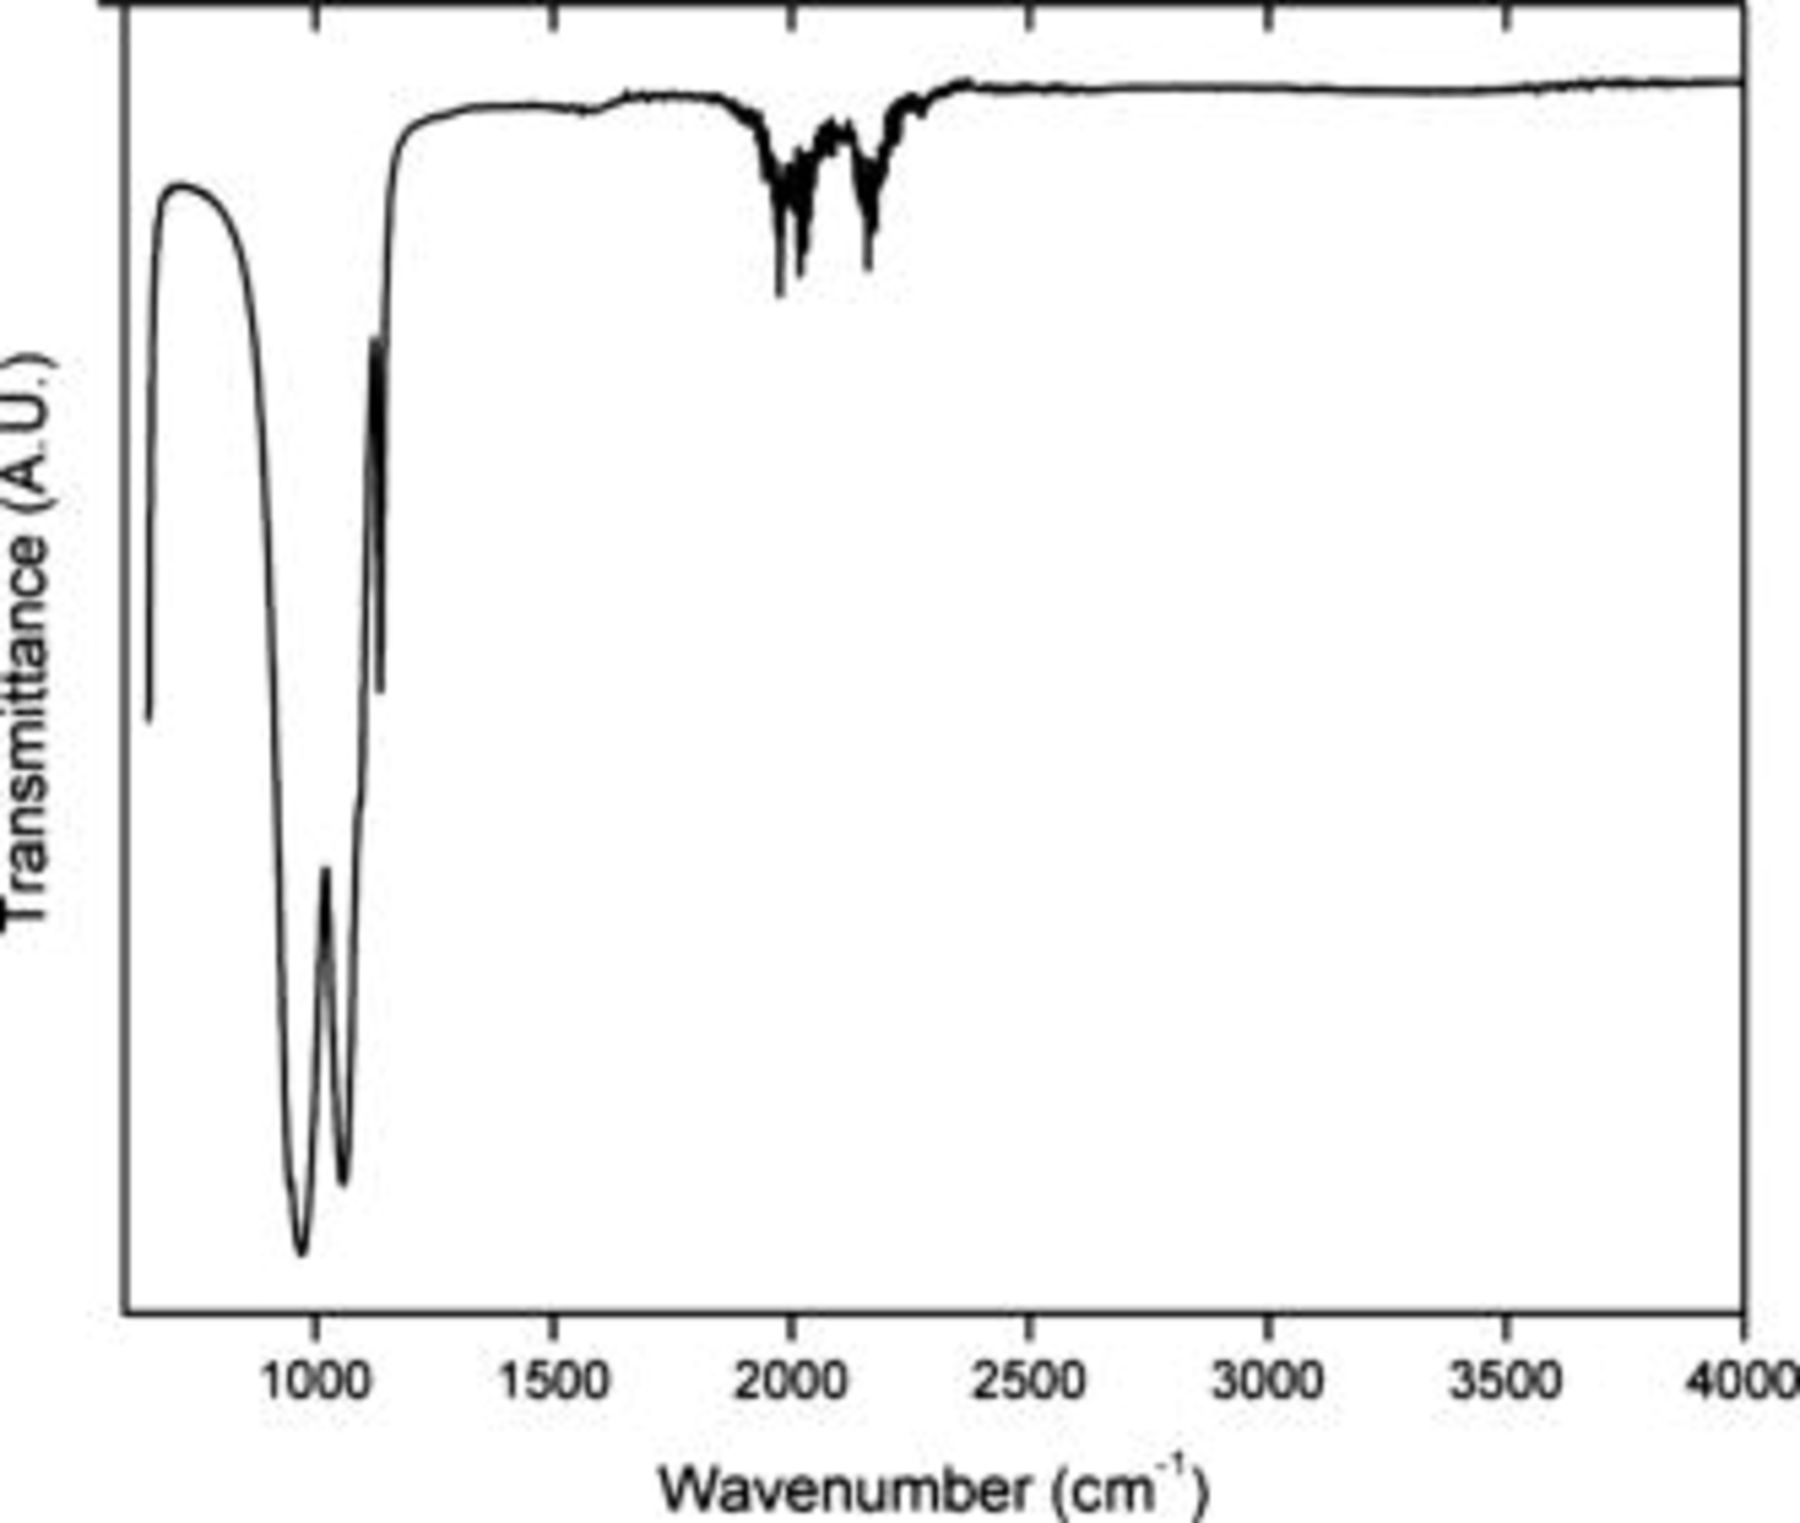
Figure 2. FTIR spectra of Phostech Lithium  treated with ethanol. Bands in the
  wavenumber range originate from the diamond cell.

Figure 3. FTIR spectra of (a) the pure PEA, (b)  15 wt %, (c)
  15 wt % washed with ethanol, and (d)
  1 wt %.
XPS spectra for ethanol-treated and PEA-coated  particles are shown in Fig. 4. It is clear from the appearance of the N 1s peak that PEA is present on the particle surface. The surfactant also remains on the surface after washing the coated particle with ethanol. The N 1s peak shoulder appears at slightly higher binding energy for the coated particle (sample b), possibly due to unattached surfactant accumulated on the particle surface, which then disappears after ethanol washing (sample c). The appearance of the N 1s peak at 400 eV after washing confirms that PEA forms a stable adsorption layer on the
  particle surfaces.28–30 The new peaks that appear for C 1s and O 1s for the surfactant-coated samples (b and c) also confirm the existence of PEA on the particle surface. The C 1s peak at 284.3 eV for sample a comes from the carbon content in the as received.31 In sample b, the C 1s peaks at 285.531 and 286.9 eV32 correspond to PEA carbon and also remain after washing with ethanol (sample c). The oxygen peaks confirm the pattern observed for the N 1s and C 1s peaks: The O 1s peak at 531.2 eV comes from the phosphate oxygens in the
  particles,33 while peaks at 532.8–533.1 eV originate from PEA.34–36

Figure 4. XPS spectra of (a) Phostech Lithium  treated with ethanol, (b)
  15 wt %, and (c)
  15 wt % washed with ethanol.
A schematic interaction between PEA and the particle surface is illustrated in Fig. 5. This proposed structure is based on results from previously performed thermographic analysis and Brunauer, Emmett, and Teller measurements,24 and the FTIR and XPS spectra. The XPS results show that the surfactant coating is stable, which implies that there is strong bonding between the surfactant and the particle surface. The ether oxygen atoms of the poly(oxypropylene) chain can interact with positive sites on the  surface, typically by participating in incomplete Li–O coordination or Fe–O coordination. "Looping" of the ether oxygen chain could occur as a result of the surfactant tail being bonded to the surface. Oxygen atoms in the poly(oxypropylene) chain of PEA can also form H bonds with the
  groups of other molecules to form an irregular surfactant layer, and the possibility of bonds to polar groups in the incomplete carbon coating on the particles can also be envisioned.
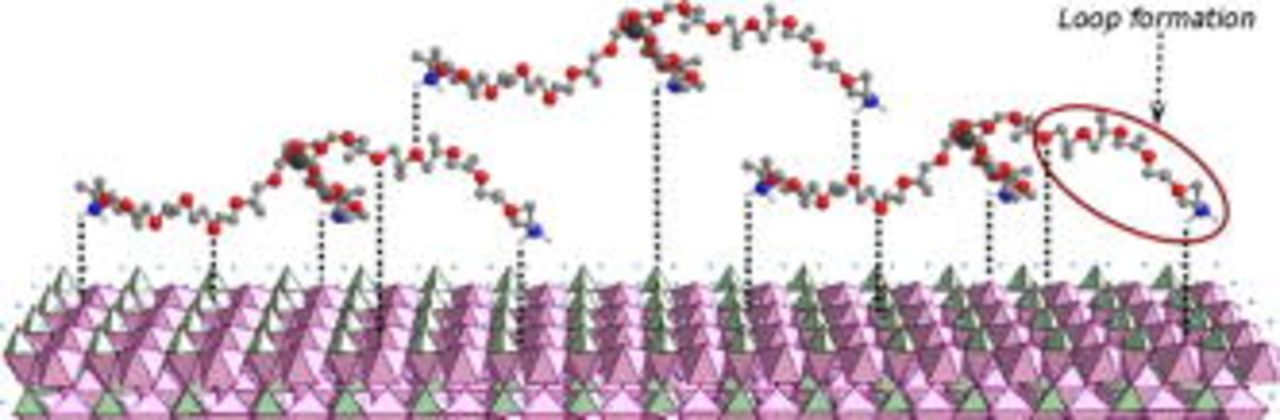
Figure 5. A schematic representation of PEA attachment to the  particle surface.
Figure 6 shows the discharge capacity of  under galvanostatic cycling. As previously discussed,24 all electrodes are relatively stable at room temperature up to 60 cycles at 0.1C.
  with the lowest concentration of PEA coating (1 wt %) is seen to exhibit the best performance; the capacity increases to 159.5(4.0) mAh/g, which is close to the theoretical limit of 169 mAh/g for
  . This represents a ca. 12% capacity increase compared to what we were able to achieve for the as-received
  ; i.e., more Li ions can be extracted from and inserted into the coated cathode material, approaching full utilization of the material. Although the measured capacity for the as-received material is somewhat low, 142.5(3.0) mAh/g, these increased values are still well above the discharge capacity of 153 mAh/g at
  claimed by the manufacturer. However, this capacity decreases systematically for higher concentrations of PEA. The results were reproducible at all concentrations studied; see Table I.
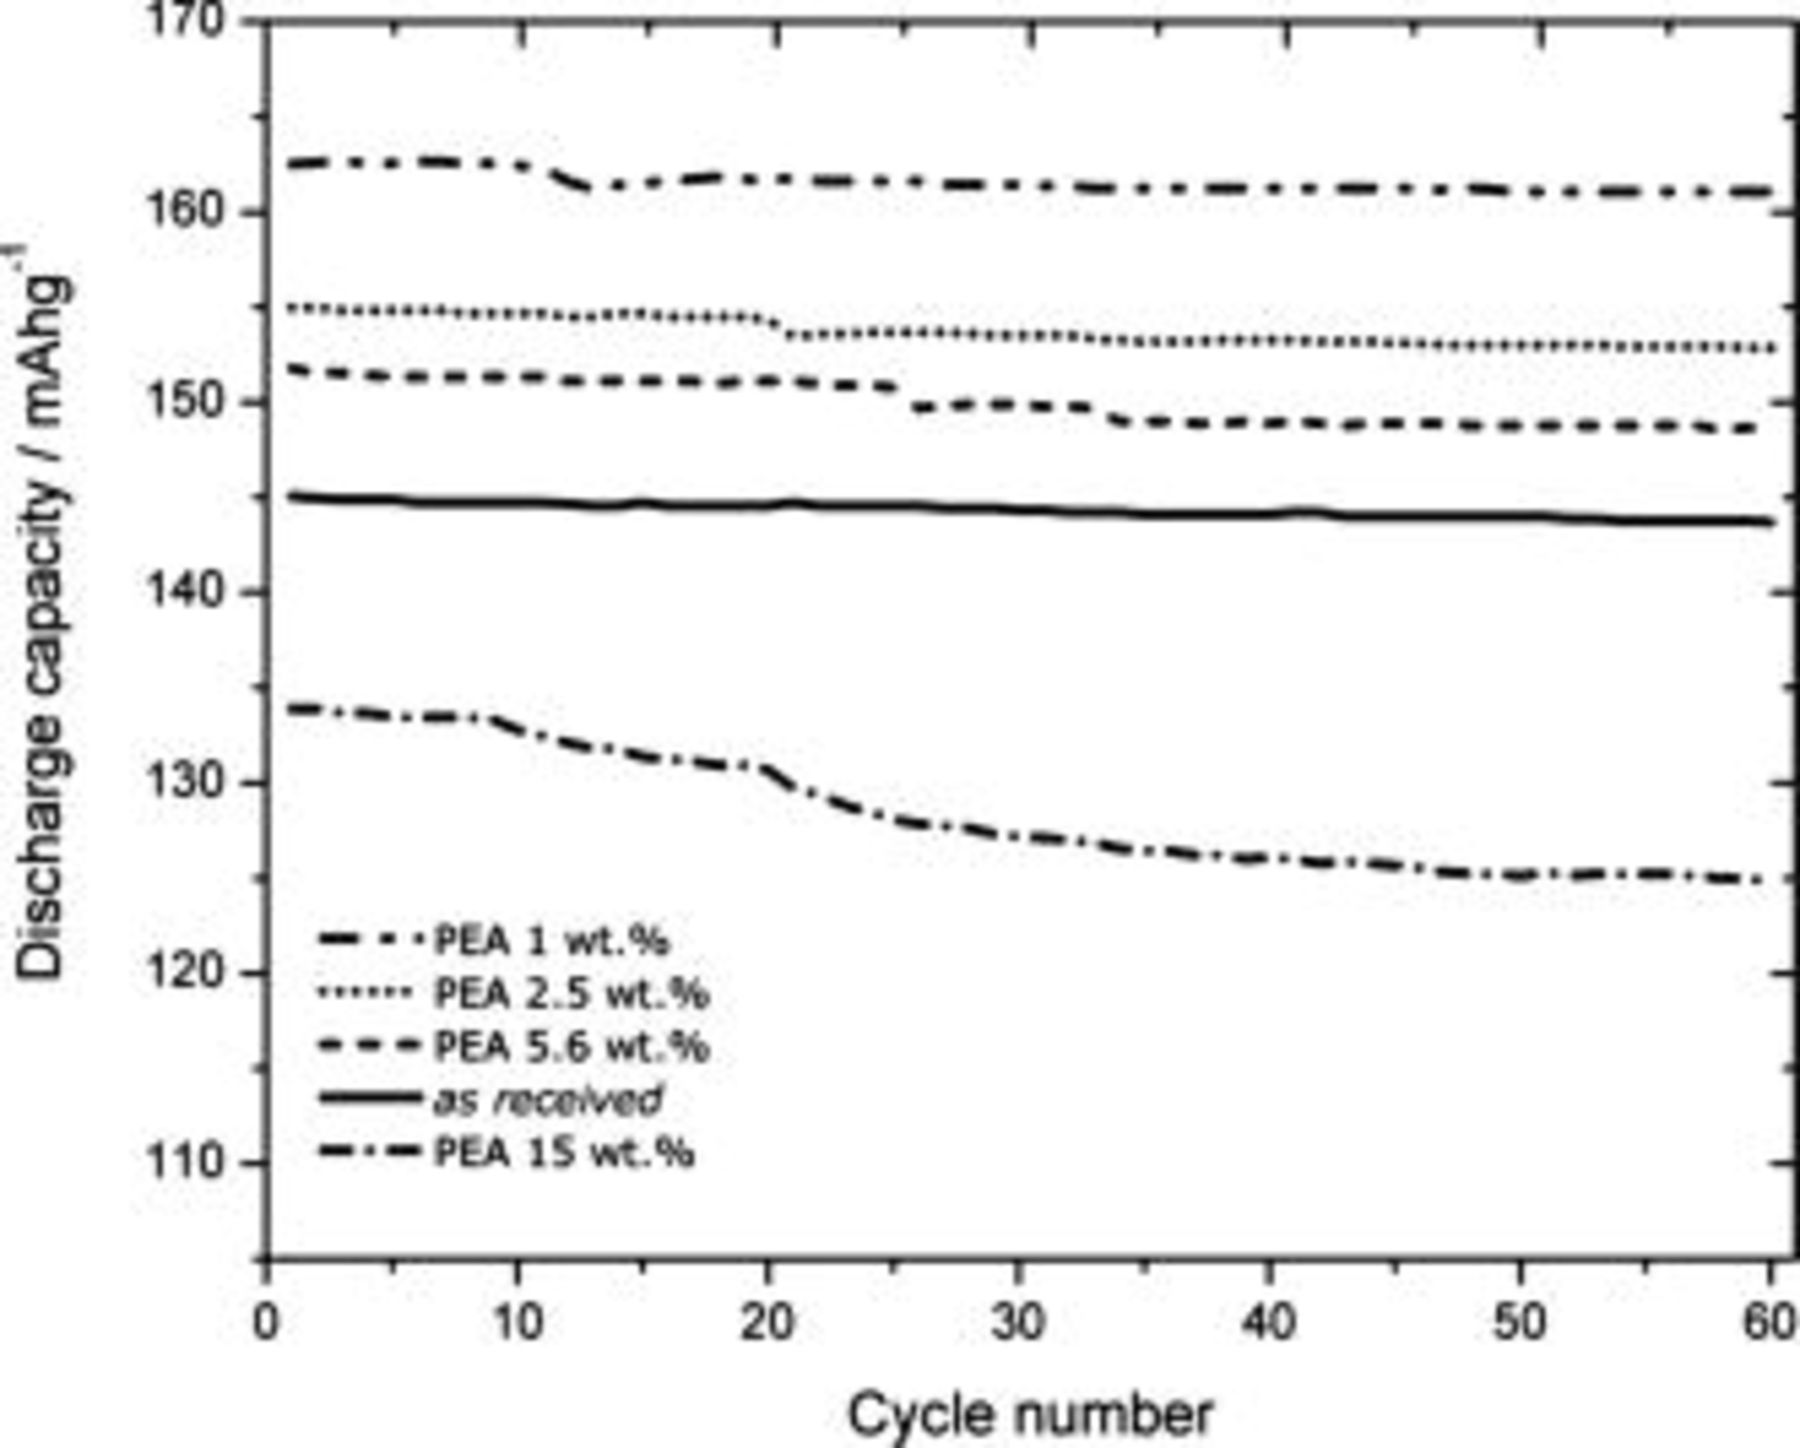
Figure 6. The variation in discharge capacity of  with cycle number for different concentrations of PEA on the surface.
Table I. Discharge capacity measured at 0.1C at room temperature.

|
 
| |||
|---|---|---|---|---|
| Sample 1 | Sample 2 | Sample 3 | Sample 4 | |
| As received | 144 | 146 | 140 | 140 |
| PEA 0 wt % | 153 | 153 | 153 | 152 |
| PEA 1 wt % | 165 | 160 | 157 | 156 |
| PEA 2.5 wt % | 155 | 155 | — | — |
| PEA 5.6 wt % | 153 | 150 | — | — |
| PEA 15 wt % | 134 | 134 | — | — |
The electrochemical performance of the as-received and PEA-coated  for different cycle rates and concentrations of the short-chain amine during the first cycle is summarized in Fig. 7. All materials investigated display a normal capacity decrease with an increasing discharge rate. The discharge capacity drops significantly when the test cell is discharged at a
  rate. Apart from the 15 wt % case, all coated
  give acceptable discharge capacities for discharge rates up to 5C. Remarkably, the cell is not destroyed even under high applied currents
  , as evidenced by the recovered capacity when the cell is discharged at low rate after high rate discharge. The capacity of the 15 wt % PEA material drops to zero already at a
  rate because the Li-ion transport through the layer can well be expected to decrease dramatically when the surfactant layer becomes thicker.
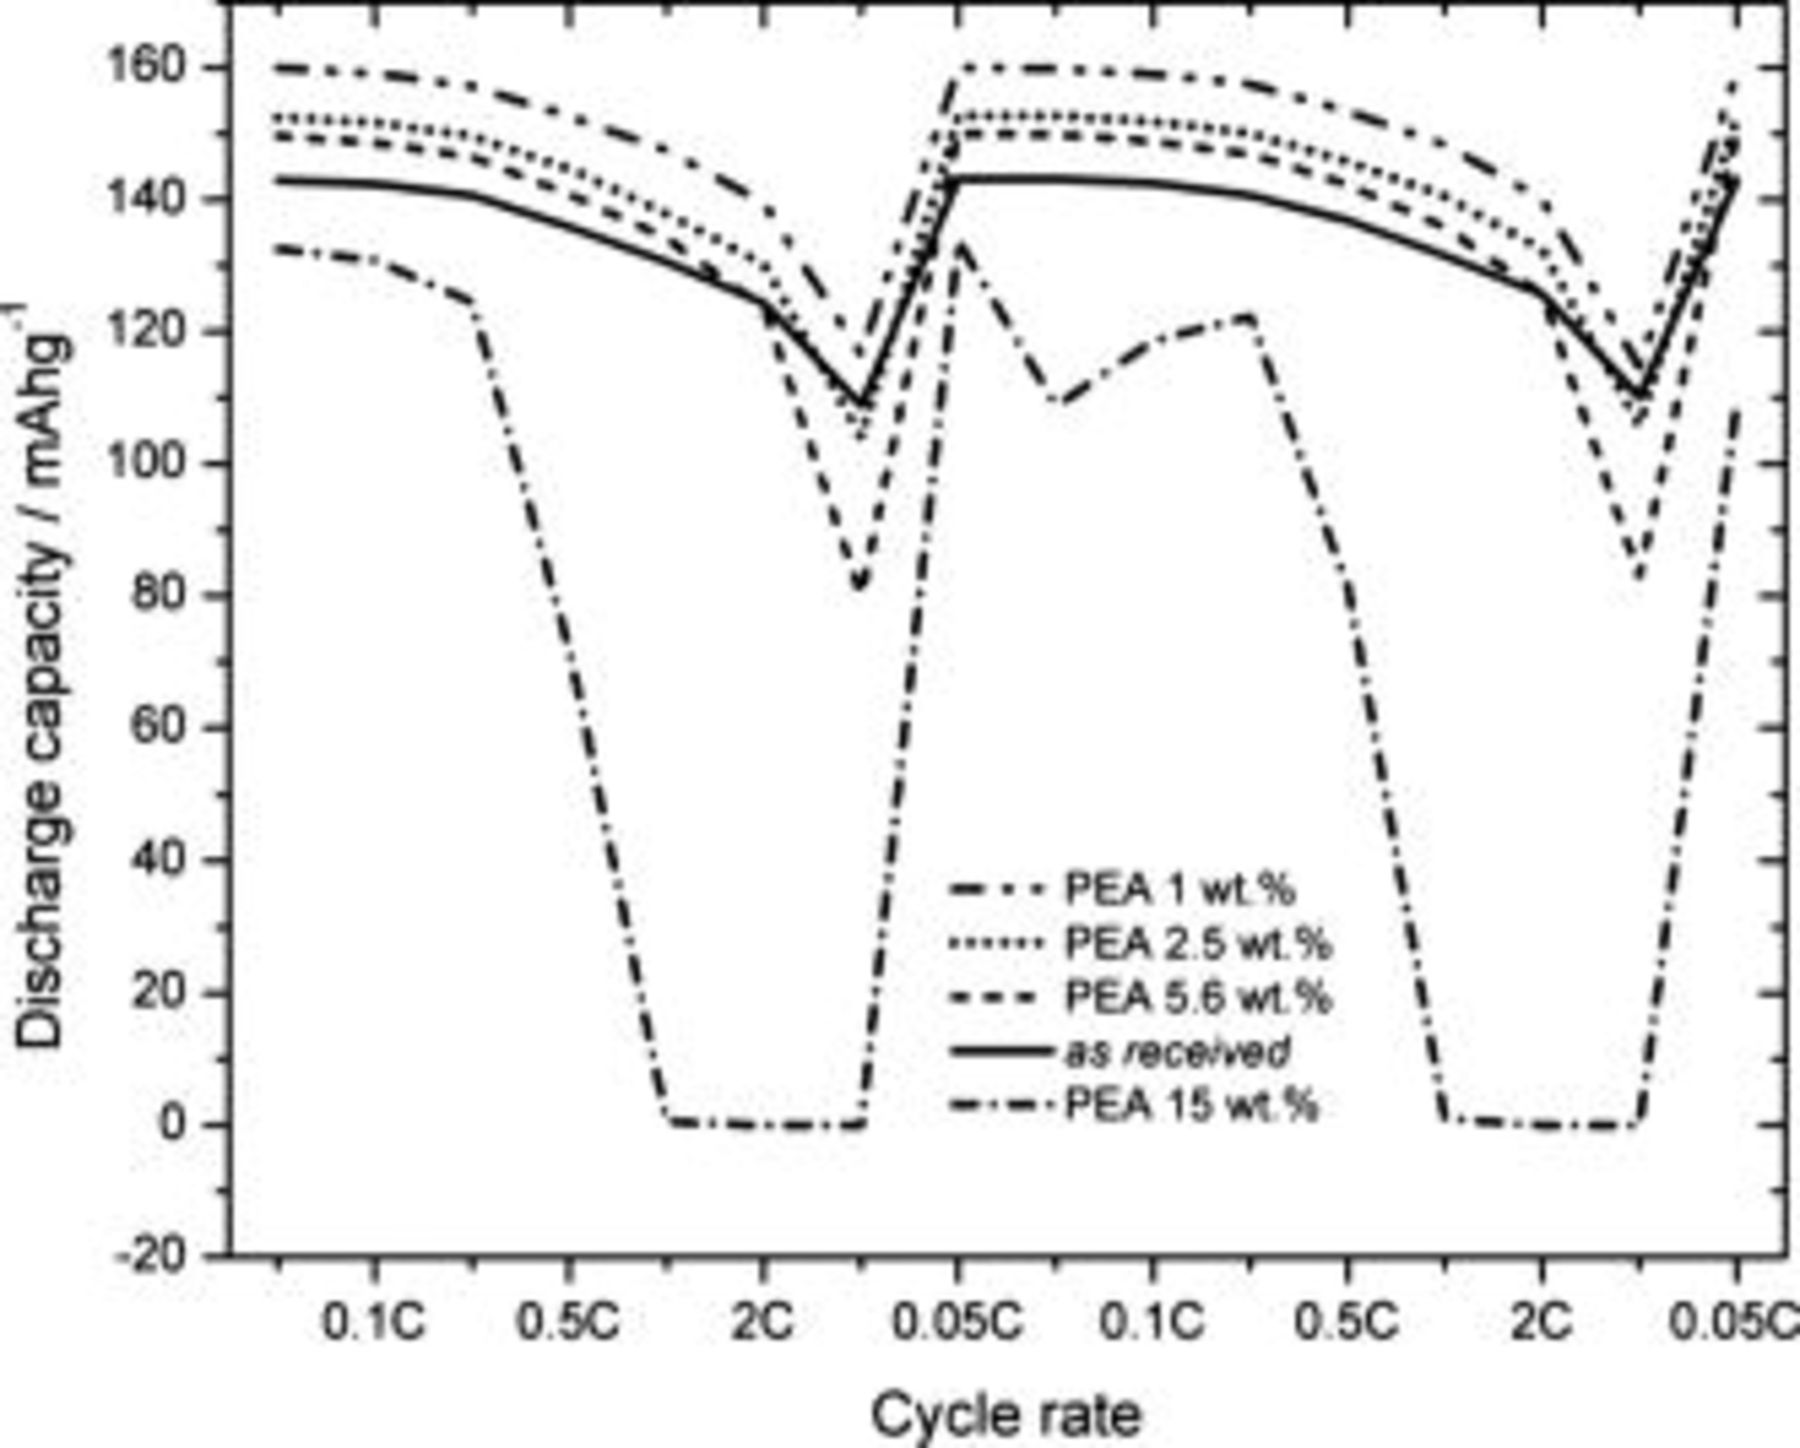
Figure 7. The discharge capacity of  during the first cycle for different amounts of PEA on the particle surface for successive cycles at C/20, C/10, C/5, C/2, C, 2C, 5C, and C/20. The right-hand side of the figure shows the same set of capacities for a second set of rates.
CV was performed on  with and without PEA to better understand the electrochemical reactions; the voltammograms are presented in Fig. 8 and the charges involved in the redox process are summarized in Table II. A first observation is that the blank samples (0 wt %) display an increased capacity as compared with that of the as-received
  , and the oxidation and reduction peak potentials of
  with 0 wt % PEA are more separated than those for the as-received and 1 wt % PEA-coated materials. The treatment with ethanol in an ultrasonic bath results in a loss of some of the electronically conductive carbon coating in the as-received material, thereby increasing the resistance at the particle surface. Second, the reduction charge (corresponding to the discharge capacity) for
  with 1 wt % PEA is ca. 12% higher than that of the as-received
  , which is consistent with the result from the galvanostatic measurement. The general trend of the discharge capacity is consistent for the galvanostatic and potentiostatic results (seen in Tables I and II; the comparison can also be extended to the result of the cathodic potential step shown in Fig. 9 and Table III), except for
  with 15 wt % PEA, which showed insignificantly higher discharge capacity than the as-received material during CV (Table II), but which was cycled over a slightly wider potential window.
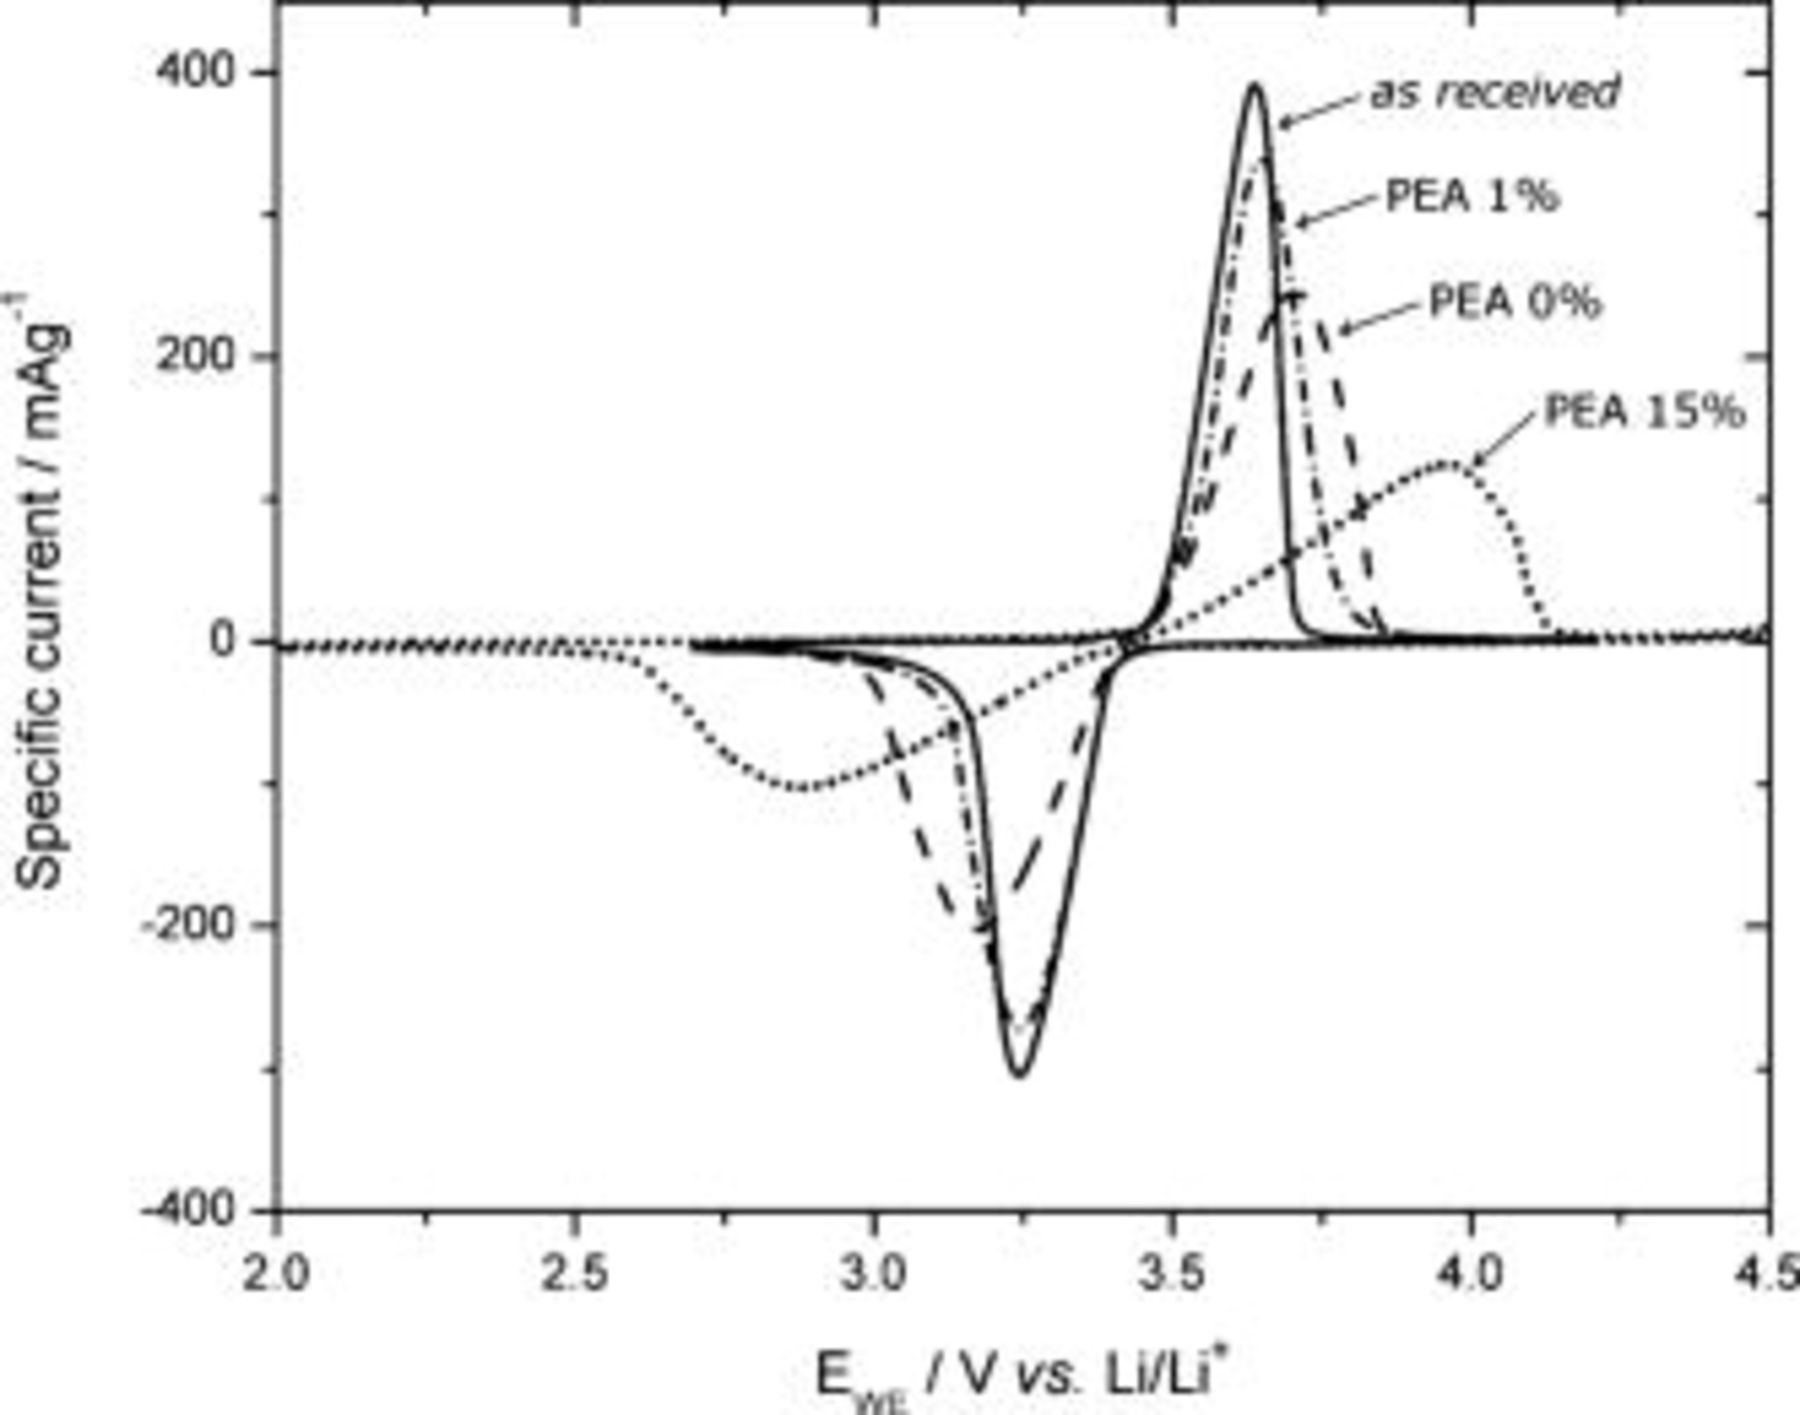
Figure 8. Cyclic voltammograms for as-received, ethanol-treated, and PEA-coated  in the organic electrolyte.
Table II. Resulting charges from reduction and oxidation reactions during CV in organic and aqueous electrolytes.

|
 
|
 
| |
|---|---|---|---|
| Organic electrolyte | As received | 136 | 128 |
| PEA 0 wt % | 145 | 136 | |
| PEA 1 wt % | 151 | 138 | |
| PEA 15 wt % | 123 | 126 | |
| Aqueous electrolyte | As received | 136 | 134 |
| PEA 0 wt % | 90 | 75 | |
| PEA 1 wt % | 166 | 160 | |
| PEA 2.5 wt % | 148 | 143 | |

Figure 9. Current transients resulting from a cathodic potential step from 4.2 to 2.7 V applied to as-received and PEA-coated  in the organic electrolyte.
Table III. Discharge capacities recorded for a cathodic potential step.

|
 
|
|---|---|
| As received | 150 |
| PEA 1 wt % | 163 |
| PEA 15 wt % | 145 |
Figure 8 shows that the oxidation peak potential of  with 1 wt % PEA is shifted
  toward higher potentials than the oxidation peak potential of the as-received material. This is probably because the PEA layer increases the resistance of the particle surface. Despite this increased resistance, the fact that the capacity is higher (Table II) shows that PEA still enhances the capacity when it forms a molecular film on the particle surface. The peak potentials of
  with 15 wt % PEA have the greatest separation, which confirms that the presence of PEA on the surface increases the resistance as the film becomes thicker.
A cathodic potential step from 4.2 to 2.7 V was also applied to some of the samples. Figure 9 and Table III show that  with an ultrathin layer of PEA (1 wt %) responds with higher specific current than the as-received material when a cathodic potential is applied. This again confirms that the discharge capacity is increased.
  with 15 wt % PEA responds to the cathodic potential step with relatively low specific current but for a longer reaction time, which is a clear indication of higher resistance when the surfactant layer increases.
The shift in peak potentials observed in Fig. 8 toward positive and negative potentials for the oxidation and reduction, respectively, implies higher resistance. This could perhaps be explained generally by wetting of the electrode/electrolyte interface. Wetting of the particles has been investigated qualitatively by measuring their sedimentation in the electrolyte; see Fig. 10. As-received and PEA-coated  have good wetting at the electrode/electrolyte interface, which is evidenced by the ability to form stable suspensions. This good wetting is because the graphitic carbon on the particle surface or the PEA has polarities similar to the electrolyte: 1 M
  in EC/DEC 2:1. The blank sample particles sediment quickly and hence display the greatest peak potential separation. This can again be explained by the ethanol and ultrasonic bath treatment, which can result in a more polar particle surface. As a consequence, the organic electrolyte is repelled from the surface, and the resistance of the electrode/electrolyte interface is increased.

Figure 10. (i) As-received  , (ii)
  treated with ethanol, and (iii)
  1 wt % in 1 M
  in EC/DEC 2:1 (organic electrolyte). The mixture was shaken and then left for 30 min.
Wetting can perhaps also explain the capacity enhancement observed for the ultrathin films of PEA, although there are no noticeable differences between the as-received and the 1 wt % PEA-coated particles in the sedimentation experiment (Fig. 10). The PEA ether–oxygen structure is chemically similar to EC and DEC and could therefore be more compatible with the electrolyte. The ether oxygens on the surfactant tails can thus mediate this polarity difference between the electrode particles and the electrolyte, thereby enhancing  extraction. Wetting cannot explain the capacity enhancement also seen for the blank sample, which obviously displays a high difference in polarity toward the electrolyte. Instead, this could be due to the dissolution of particle aggregates, as discussed earlier,24 but these differences could also lie within statistical error.
CV was also performed in an aqueous electrolyte to further study the role of the wetting at the electrode/electrolyte interface; see Fig. 11 and Table II. An increased capacity could be expected for the noncoated samples because the compatibility in the polarity between the particle surface and the aqueous electrolyte could mediate an increased wettability. However, this was not observed. The separation of the peak potentials in the voltammograms for the aqueous electrolyte for the as-received and blank samples is significantly larger  than for the coated samples. This can perhaps be because the as-received
  is not well wetted in the aqueous electrolyte (i.e., 1 M
  ) due to the graphitic carbon on the surface. The separation of the peak potentials for
  with 1 and 2.5 wt % PEA is surprisingly low considering the low polarity of PEA.
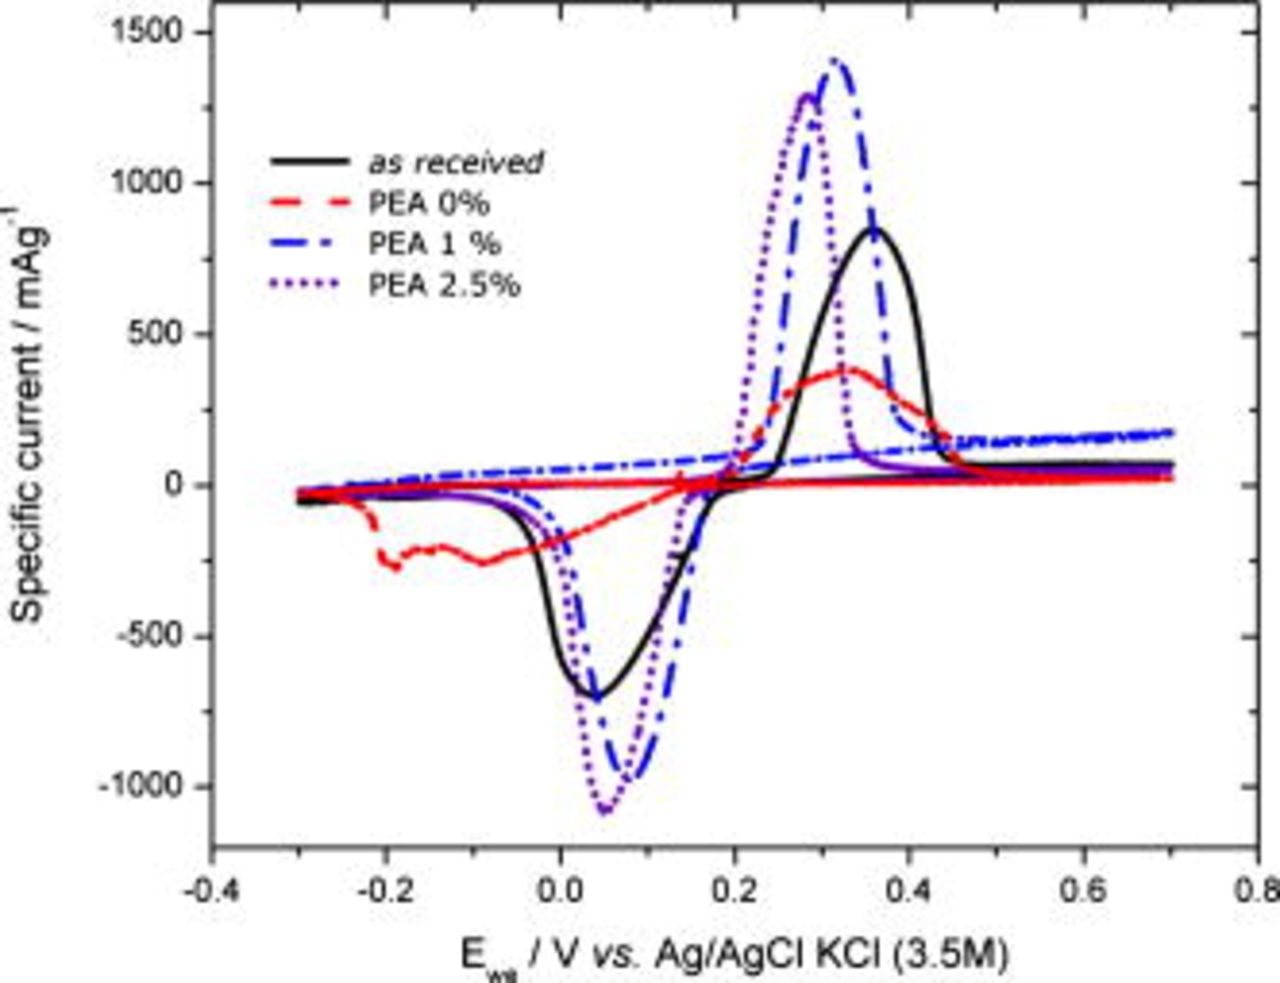
Figure 11. Cyclic voltammograms for as-received, ethanol-treated, and PEA-coated  in an aqueous electrolyte.
The shifting peak potentials and the lower discharge capacity (Table II) of the as-received material could otherwise be explained by the formation of a solid  layer accompanied by the formation of
  -containing solids, which have been observed upon immersing
  in water.37 The
  layer formed can well lead to a subsequent increase in resistance in the electrode/electrolyte interface that we have observed. That the reduction peak potential of the blank sample is shifted furthest toward more negative potentials, and that it displays an even lower discharge capacity, is probably due to dissolution of
  and formation of
  on the surface in the absence of a protective graphite layer. Furthermore, the blank sample partly dissolves during reduction.
Although PEA-coated  should have a surface polarity that is lower than that of the aqueous electrolyte, which could be expected to decrease the wetting of the interface, the coated material still displays a higher specific capacity than the as-received
  . A possible explanation for this could be that the PEA layer protects the surface from unwanted side reactions which form
  -containing solids and
  . This phenomenon could be significant in trying to construct Li-ion batteries with polar electrolytes. However, Fe ions are clearly also dissolved from the coated materials during continuous cycling (not shown).
Conclusions
The presence of PEA on the  particle surfaces changes the surface properties which, in turn, enhance the discharge capacity by up to 12% for ultrathin layers; this effect is retained for at least 60 cycles. Further, this capacity enhancement disappears for a larger amount of PEA coating because thicker layers reduce ion transport to and from the active
  particle. The compatible polarity with the electrolyte can well explain the capacity increase, although the capacity is enhanced also in an aqueous electrolyte, which would suggest that other mechanisms also play a significant role. PEA-coated particles display an increased discharge capacity as well as better reaction kinetics than the as-received
  (Phostech Lithium) in an aqueous electrolyte. This can be due to the inhibiting effect of stable
  - and
- and  -containing solids when
  is oxidized by water.
Surfactant coatings of cathode particle surfaces can have direct relevance to three-dimensional microbattery design. Further work is needed to modify the tail part of the surfactant to match the chemical and physical properties of the polymer electrolyte or separator used in such a battery.
Acknowledgments
This work was supported by the EU FP7 project SUPERLION, the Swedish Energy Agency (STEM), the Swedish Research Council (VR), and the Swedish Governmental Agency for Innovation Systems (VINNOVA). The authors also thank Dr. David Ensling for his assistance with the XPS analyses and Professor Jan Lindgren for fruitful discussions of the FTIR data.
Uppsala University assisted in meeting the publication costs of this article.