
Abstract
A mathematical model for diffusion-induced stress generation in spherical Li-ion active materials has been incorporated into Dualfoil, a Li-ion cell-sandwich model with porous electrodes. The model is used to examine differences in the electrochemomechanical response of "power" vs "energy" cells at high currents. Porous electrode effects, particularly in "energy-type" cells with thick electrodes, amplify the peak stresses encountered during lithium insertion and extraction and may result in nonuniform decrepitation or disordering through the depth of the electrode. We also elucidate the roles of fragment connectivity, volume expansion factors, nonlinear lattice expansion, and variable solid-state diffusion on diffusion-induced stress, stress-induced diffusion, and the voltage response of dual-intercalation cells with porous electrodes. In conventional electrode materials (with small volume expansion), pressure diffusion plays a limited role in determining the galvanostatic voltage response but becomes important in determining the stress response. Pressure diffusion and nonlinear lattice expansion play an important role in determining both the voltage and stress response in large-volume-expansion materials (e.g., alloys and perhaps graphite at low utilization).
Export citation and abstract BibTeX RIS
While recent advances in high energy lithium-ion batteries may herald a new era of cheap, efficient, long-range electric propulsion, a multitude of degradation mechanisms has delayed widespread adoption of electrical energy storage systems by the automobile industry. When a lifetime of 10–15 years or more is expected and typically guaranteed for all major vehicle components, the durability of lithium-ion cells falls short. Unfortunately, most of the common aging mechanisms identified for lithium-ion chemistries are challenging to overcome and, in many cases, are not yet well understood.
The literature dealing with aging mechanisms in lithium-ion cells has predominantly focused on chemical and electrochemical degradation.1–8 While this focus may be warranted, commensurate emphasis on mechanical degradation mechanisms has been somewhat lacking. Moreover, the interplay between chemical, electrochemical, and mechanical aging has received very little attention.
Mechanical degradation of cells can stem from, among other things, gas generation, solid precipitation, material phase changes, movement of particles (i.e., loss of electrical connection), and diffusion-induced stress. The present work focuses on the last of these. Volume changes in electrode particles during Li insertion and extraction generate stress, which may induce disordering or decrepitation of the particles. Alloys, in particular, may undergo up to 300% change in volume,9 and extensive fracturing has been observed after a small number of cycles.9, 10 Thomas suggested that cracking of alloys and subsequent growth of a passivating film (the solid-electrolyte interphase) on the newly formed surface lead to isolation of the active material from the conducting matrix.11
Fracture and stress-related disordering have also been observed in intercalation compounds, including electrolytic manganese oxide,12, 13  ,14, 15
  ,16–18
  ,19, 20 and graph ite.21–24 There is some evidence that microcracks form in layered oxides such as
  , effectively decreasing the intraparticle diffusivity of lithium.25
Recently, Horn and White presented several scanning electron microscopy (SEM) images showing particle fracture in the cathode of a rapidly charged Li-ion cell taken from a notebook computer battery pack.26 The cell, which had a maximum manufacturer-specified charge rate of 0.7C, was cycled 5 times at 2C up to 90% state of charge (SOC). Postmortem images (Fig. 1) showed extensive fracturing of the cathode exclusively in the region closest to the separator (approximately  penetration into
  electrodes). Postmortem analysis of a cell that had failed in the field showed similar features. Whether the fracturing caused or was simply correlated with cell failure is unclear; we shall consider several possible scenarios.
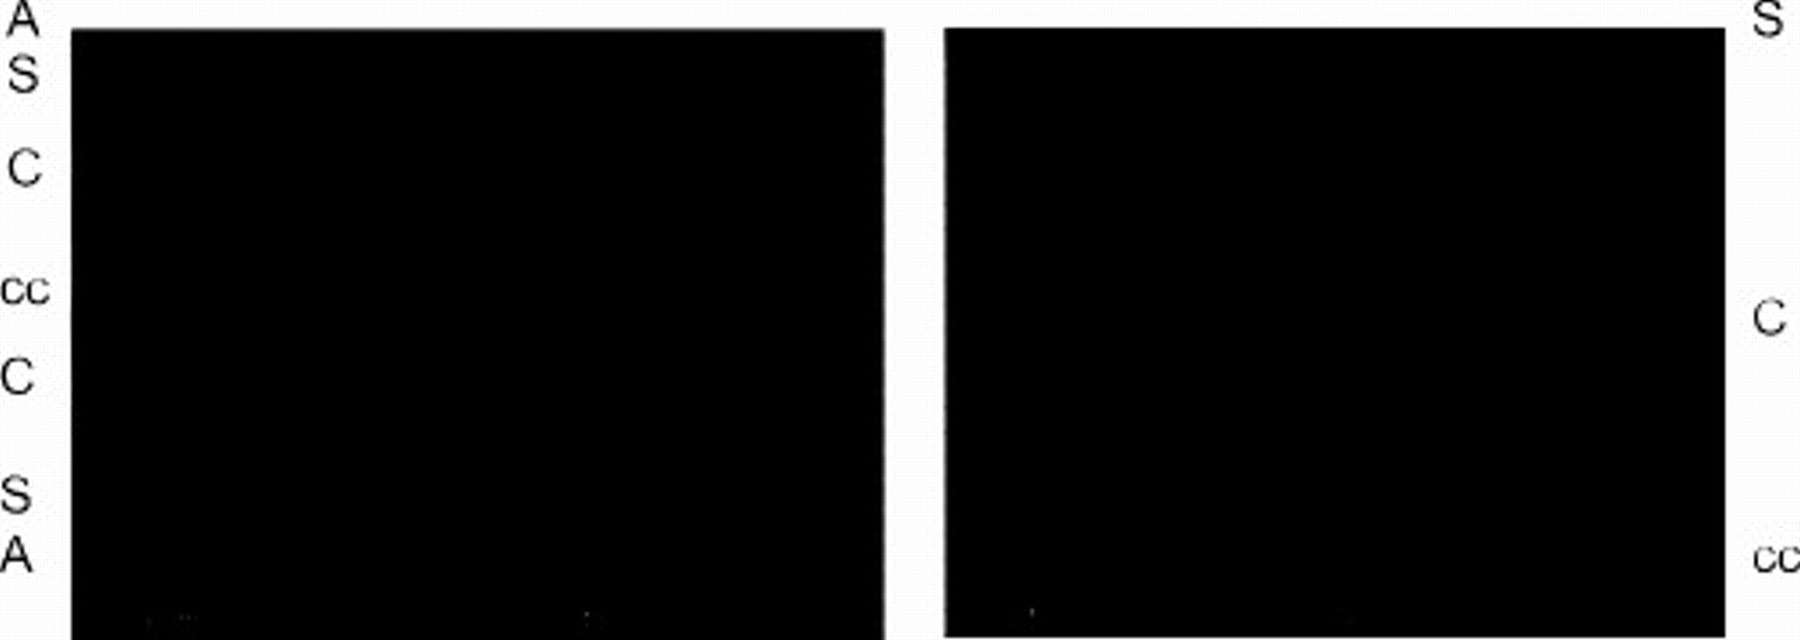
Figure 1. Cross-sectional SEM images of a laptop cell that was charged at currents above the manufacturer's specification. The left image shows fracturing near the separator on both sides of the double-sided cathode; the right image is an expanded region of the cathode. The anode, separator, cathode, and cathode current collector are labeled A, S, C, and cc, respectively. Reproduced with the kind permission of The Electrochemical Society.
The reason that fracturing first occurs close to the separator is intuitively obvious in light of the current distribution predicted by porous electrode theory.27–29 As long as the ohmic and mass-transfer resistances in the electrolyte are higher than those present in the electronically conducting matrix of the solid phase, a situation that is usually realized in commercial Li-ion cells as delivered by the manufacturer, the local transfer current between phases should be higher near the separator than near the current collector. As demonstrated in previous work,30–33 a higher rate of lithium insertion into or extraction from a finite-strain material results in a higher maximum stress in the material. Therefore, regions with higher local pore-wall flux of lithium (i.e., near the separator) would be more likely to fracture.
This fracturing can contribute to cell degradation in several ways. One can imagine that some fragments of a fractured particle may become isolated from the electronically conducting matrix of the electrode, resulting in reduced capacity in that electrode. This effectively increases the C rate associated with a given current passed through the cell, which manifests itself as an apparent impedance rise. However, it has not been shown that such isolation does, in fact, occur in fractured electrodes.
A more subtle capacity fade mechanism involves the increase in surface area associated with particle fracture. Many materials used in lithium-ion batteries operate in a voltage range that either reduces or oxidizes the electrolyte, forming an electronically insulating and ionically resistive layer at the interface. This electrolyte decomposition is an electron-consuming side reaction that shifts the operating window of the anode relative to the cathode, which may effectively lower the cell's capacity.1, 34–37 The impact on cell impedance is less obvious in this case. As long as active material particles remain well connected, their smaller size after fracture should actually improve the rate capability of the cell. The effective C rate is furthermore unaltered by this mechanism because the capacity loss involves side reactions and not loss of active material. However, one or both electrodes may become more susceptible to overcharge or overdischarge reactions.
In this paper, we propose a mathematical model that can be used to explore these fracture-related mechanisms. To understand degradation better, we explore two limiting cases: (i) perfect electronic connection between particle fragments and (ii) complete isolation of particle fragments. By including porous electrode effects, we also examine the differences in "power" vs "energy" cells. Finally, we elucidate the roles of volume expansion factors, nonlinear lattice expansion, and variable solid-state diffusion on diffusion-induced stress, stress-induced diffusion, and the voltage response of dual-intercalation cells with porous electrodes.
Mathematical Model
In recent years, several models have been developed that compute stress generation in lithium-insertion materials due to lithium insertion and extraction.30–33, 38–40 The maximum stress in a lithium-insertion particle tends to be roughly proportional to the concentration gradient developed in the particle, multiplied by the particle size. In other words, the difference in concentrations between the surface and center of the particle determines, to a great degree, the maximum stress. Christensen and Newman showed that the stress increases with the dimensionless current, which is proportional to the particle size and C rate and inversely proportional to the solid-phase diffusivity.30
The set of equations used to compute stress includes a coupling between diffusion and elasticity along with the appropriate material and momentum balances. Garcia et al. developed a two-dimensional (2D) porous electrode model that also accounted for potential and ion concentration distributions in the electrolyte.38 However, their work employed transport equations derived from dilute solution theory, which is generally not adequate for Li-ion systems, and their diffusion equation did not include the pressure driving force that gives rise to chemomechanical or electrochemomechanical coupling.
Zhang et al. developed a semianalytic expression for the stress distribution in a spherical particle as a function of solid-phase lithium concentration, which allowed a decoupling of the diffusion and elasticity equations.32 They extended their one-dimensional (1D) model to a finite-element COMSOL model that could compute stress in ellipsoids of arbitrary aspect ratio. However, their Fickian diffusion equation was strictly valid only for dilute solutions, neglected the influence of a moving boundary, and did not include the correct form of the pressure driving force for diffusion. In a subsequent paper, Zhang et al. explored both intercalation stress and heat generation in single particles.33
Christensen and Newman developed a set of 1D equations for a spherical particle,30 which included moving boundary considerations and was based on the more rigorous multicomponent diffusion equation developed by Hirschfelder et al. and Curtiss and Bird.41, 42 This diffusion equation is valid for concentrated solutions, such as the solid solutions formed in Li-intercalation materials, and properly handles the contribution of pressure gradients to the driving force for diffusion. Additionally, a more general, nonlinear version of Hooke's law was employed. Although computationally more expensive than other approaches, this model has the advantage of applicability to insertion materials that undergo massive volume changes (e.g.,  or
or  alloys), in which second-order terms in Hooke's law and convection terms and pressure driving forces in the diffusion equation become significant. In another paper, stress generation at two-phase boundaries was also explored.31
Recently, Verbrugge and Cheng presented a modification to the approach of Sastry et al. that included surface energy considera tions.39 The surface energy manifests itself as a boundary condition of finite compressive stress at the surface of a particle, which becomes significant for nanomaterials ( diameter). Christensen and Newman showed that a compressive external stress could reduce the likelihood of particle fracture30 because the fracture threshold for the tensile stress is typically much lower than for the compressive stress.
In the present model, we combine porous electrode theory, specifically the Dualfoil Li-ion cell-sandwich model,43, 44 with our diffusion-induced-stress model30, 31 to compute stresses generated during the galvanostatic operation of a Li-ion cell with a graphitic mesophase-carbon-microbead (MCMB) anode and lithium manganese oxide (LMO) spinel cathode. The resulting model is classified as a "pseudo-2D" or "one-plus-1D" model, in which one equation and its Jacobian elements in the primary dimension depend on the solution of a set of subdomain equations in the secondary dimension. In this case, the  -dimension of the "Dualfoil domain," extending from the anode current collector to the cathode current collector, is the primary dimension, while the
  -dimension of the "particle domain" is the secondary dimension. Examples of this approach can be found in battery models with variable solid-phase diffusion coefficients45–47 or with complex two-phase particle submodels,48, 49 as well as in polymer electrolyte membrane fuel cell models with gas reactant flow fields orthogonal to the proton transport direc tion.50
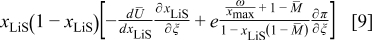
The coupling between the two dimensions in our case is achieved by utilizing the pore-wall flux,  , computed in the Dualfoil domain, as a boundary condition at the surface of the particle domain (see Eq. 9 of Ref. 47)

Including convection of the host lattice, the current density to the particle,  , is given by (see Eq. 72 of Ref. 30)
where  is the particle radius at time
  ,
,  is the reference (or initial) particle radius,
  is the flux of intercalated lithium,
  is the total concentration of occupied and unoccupied lithium sites, and
  is the mole fraction of occupied lithium sites. Note that fluxes in the Dualfoil domain are referenced to the initial particle size, while those in the particle domain are with respect to the actual particle size.
The particle domain equations are in turn solved to yield the surface lithium concentration. The usual zero-dimensional material balance that is included in the Dualfoil domain equations (i.e., the Duhamel superposition integral) is replaced by a dummy equation, which sets the surface concentration, utilized in the Butler–Volmer kinetic expression, equal to the result from the particle domain solution

This dummy equation has a trivial analytic expression for its Jacobian with respect to the surface concentration, but also depends on the transfer current in a nonlinear way. Hence, the derivative of the equation with respect to  is computed numerically via successive calls of the particle domain equations. With these exceptions, all other equations in the Dualfoil and particle domains are identical to those provided in the respective literature,30, 31, 43, 44 to which the reader is referred.
Our approach differs significantly from that of Garcia et al. in the following regard: While porous electrode theory neglects local microstructural phenomena, it avoids potentially spurious phenomena that could result from a 2D finite-element description of three-dimensional (3D) microstructure (e.g., local tortuosity could be much different for a 2D slice of a 3D porous electrode). We instead lump certain microstructural effects into bulk parameters (e.g., average porosity, tortuosity, MacMullin number, mean particle size, etc.).
A limitation of the present model is that it treats only spherical particles of a uniform size, although the general coupling approach could be extended to other arbitrary distributions of shape and size. Moreover, diffusion and elasticity are treated isotropically, which may be an oversimplification for many materials. Nevertheless, qualitative trends extracted from this analysis should be generally applicable to a wide range of materials and electrode configurations, and the specific materials considered here could be considered globally isotropic (e.g., graphitic MCMB is spherical and contains somewhat randomly oriented graphitic domains; secondary LMO spinel particles are spheroids and 3D diffusers).
To explore the propagation of particle fragmentation in a porous electrode, we employ a division of each electrode into "fractured" and "unfractured" domains. This division essentially entails the use of different particle sizes, and corresponding interfacial surface areas, in the two domains. Because the stress is highest for particles adjacent to the separator, we assume that the region closest to the separator comprises the fractured domain. In an effort to reduce the computation time, we restrict the number of mesh points, or nodes, in each electrode to 11, although several benchmark simulations with twice as many nodes did not yield significantly different results. The boundary between fractured and unfractured domains occurs halfway between two chosen nodes, and with 11 total nodes, the percentage of fractured material can be simulated in 10% increments, ranging from 5 to 95%. Electrodes that are 0 or 100% fractured can also be simulated by considering only one domain. Figure 2 illustrates the division described here for the situation in which both anode and cathode are approximately 35% fractured.
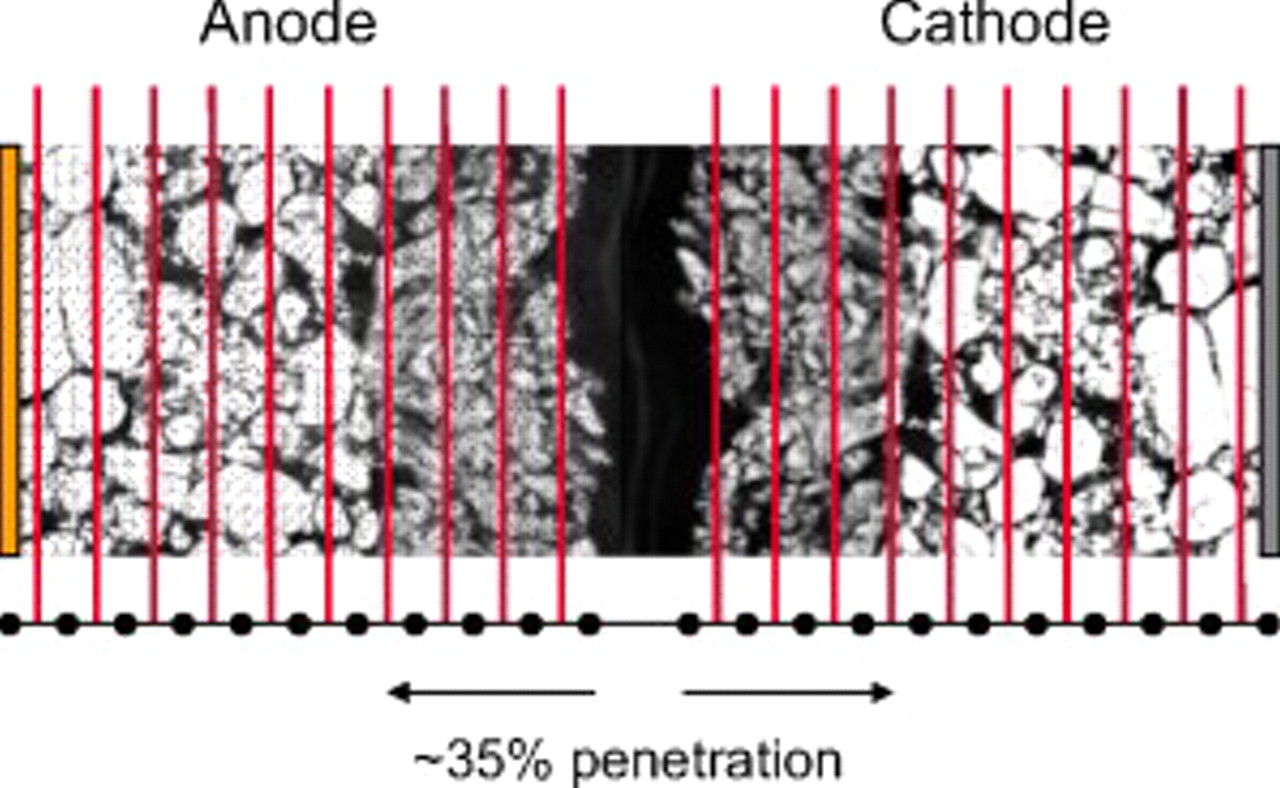
Figure 2. Depiction of a cell with fractured particles near the separator in both the anode and cathode. The fractured region accounts for roughly 35% of each electrode. The vertical lines indicate the approximate position of boundaries chosen for simulations described in the present work (from 5 to 95% of the electrode depth in increments of 10%).
We arbitrarily choose a particle radius 1/2 that of the unfractured particle radius to represent the material fracture (i.e., the fractured particles are assumed to be 1/8th the volume of unfractured particles). A more detailed analysis of crack propagation and the phenomenon of active material decrepitation is required to refine this assumption, but some microscopic depictions of fractured particles (e.g., in Fig. 1) indicate that this ratio is not unreasonable.14, 26
Two limiting cases are considered: complete particle isolation after fragmentation (i.e., in Dualfoil lingo, 100% conversion of active material volume fraction to inactive material volume fraction in the fractured regime) and perfect particle connection (i.e., no change in matrix-phase electronic conductivity between fractured and unfractured domains). Intermediate approximations (e.g., varying solid-phase conductivity or varying active material volume fraction) could also be explored easily but are beyond the scope of this paper.
The above described modifications to the Dualfoil model are relatively minor and fairly straightforward to implement. Rather than impact the equations themselves, they require a parametric segmentation of the Dualfoil domain that is absent from the original model. No new internal boundary conditions are introduced.
The simulation results are organized by topic: voltage and stress response, fracture penetration, large volume change, and nonlinear lattice expansion in graphite.
Voltage and Stress Response in an MCMB/LMO Cell
Nonidealities and pressure diffusion
In previous work, we discussed the impact that pressure diffusion, variable solid-state diffusion coefficient, and variable partial molar volumes (PMVs) have on the stress generated in a single spherical particle.30, 31 Here we extend this examination to the influence of these factors on the discharge voltage and stress generation in a full cell with porous electrodes. The material parameters used here are identical to those used for MCMB30 and LMO spinel31 in our previous work, except that the diffusion coefficient of graphite was taken as the fitted value for MCMB 25-10 from Ref. 51. While this value was extracted for disordered carbon, it also represents the lower end of measured values for graphitized MCMB.52, 53 These parameters, along with additional cell properties, are summarized in Table I. The electrolyte concentration used for the simulations was 1 M, and the electrolyte transport properties were taken from Ref. 54, 55 for  in a mixture of alkyl carbonates [either ethylene carbonate:dimethyl carbonate54 or ethylene carbonate:ethyl methyl carbonate55]. The respective concentration-dependent expressions used for diffusivity (in
  ),54 transference number,54 and conductivity (in S/m)55 were


with the electrolyte concentration given in mol/L.
Table I. Parameters used in the simulations.
| Parameter | Units | Anode | Separator | Cathode |
|---|---|---|---|---|

| 0.75 | 0.2 | ||

|

| 5 | 4 | |

|

|

|
| |
| ω (expansivity) | 0.08 | 0.065 | ||

| GPa | 15 | 10 | |
| ν | 0.3 | 0.3 | ||

|

| 2.2 | 4.4 | |
 (thickness) (thickness) |

| 45,135 | 20 | 55,165 |
| ε (porosity) | 0.45 | 0.55 | 0.413 | |
 (active material volume fraction) (active material volume fraction) | 0.4 | 0.419 | ||

| mAh/g | 372 | 148.26 | |

|

| 0.023 | 0.001 | |
 |
|

|

| |
| σ | S/m | 100 | 100 |
aThe smaller value is used for the simulation of power cells; the larger value is used for energy cells. bThe rate constant,  , is defined in terms of the exchange current density as follows:
 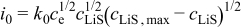 .
.
Figure 3 shows the voltage and open-circuit potential (OCP) for the galvanostatic discharge of an MCMB/LMO cell with several factors included or excluded from the model at a nominal rate of 10C. The cases considered are (1) zero volume change (i.e., identical PMVs for lithiated and delithiated host materials) with constant diffusion coefficient; (2) constant (but different) PMVs, constant diffusion coefficient, with pressure diffusion neglected; (3) constant PMVs, variable diffusion coefficient, with pressure diffusion neglected; (4) variable PMVs, variable diffusion coefficient, with pressure diffusion neglected; (5) constant PMVs, constant diffusion coefficient, with pressure diffusion included; (6) constant PMVs, variable diffusion coefficient, with pressure diffusion included; and (7) variable PMVs, variable diffusion coefficient, with pressure diffusion included. Case (1) is identical to the standard Dualfoil simulation, while cases (2)–(7) all include lattice volume change (i.e., lattice convection) in the flux law as well as material compressibility. These conditions apply to both electrodes in all cases, with the following exceptions: In the anode, only the thermodynamic factor of the diffusivity is varied (i.e., the binary interaction parameter is taken as constant) and the partial molar volume (PMV) is always taken as constant. These conditions reflect the assumptions made in previous work.30, 31
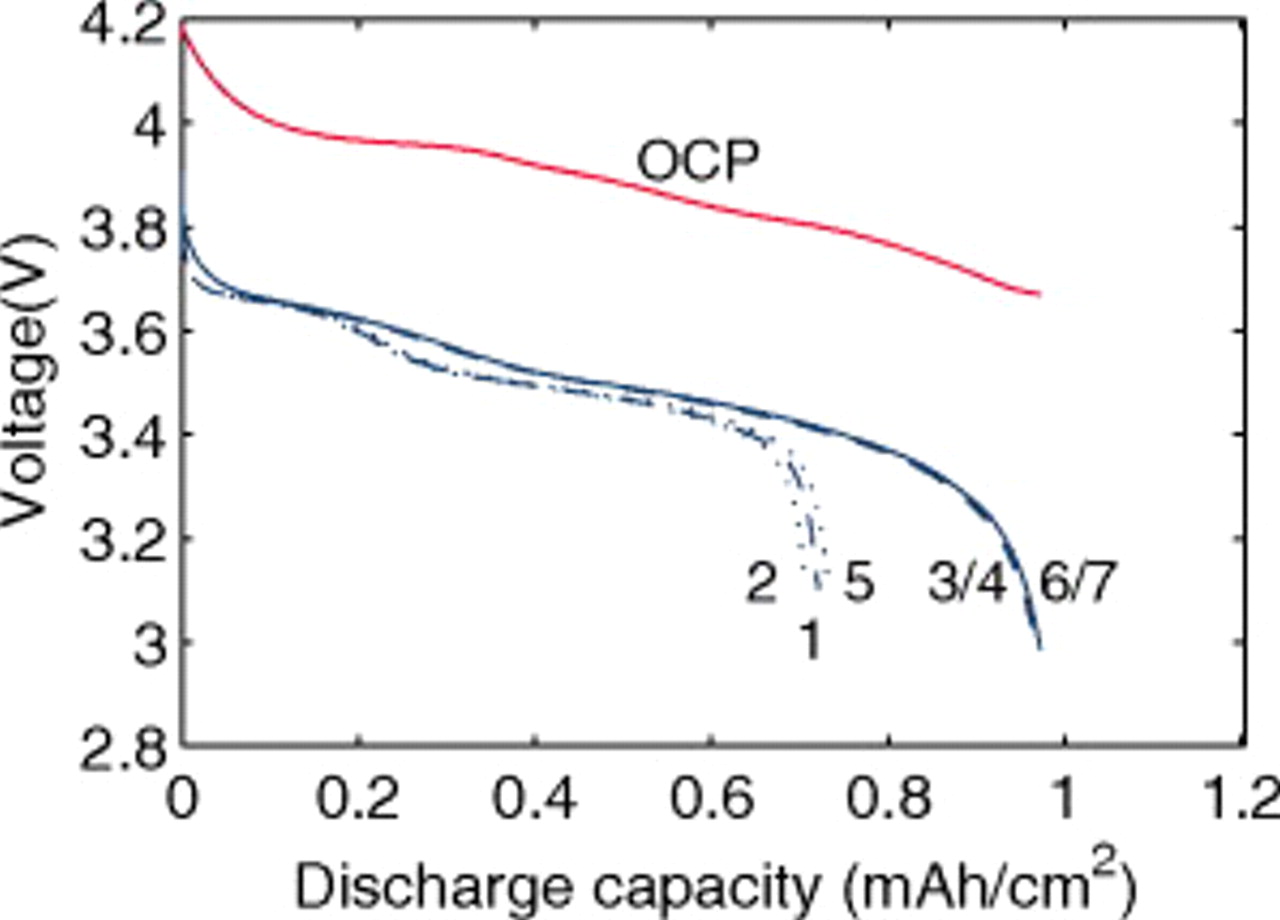
Figure 3. Voltage response for a "power cell" discharged at 10C with various levels of nonideality: (1) zero volume change with constant diffusion coefficient; (2) constant (but different) PMVs, constant diffusion coefficient, and pressure diffusion neglected; (3) constant PMVs, variable diffusion coefficient, and pressure diffusion neglected; (4) variable PMVs, variable diffusion coefficient, and pressure diffusion neglected; (5) constant PMVs, constant diffusion coefficient, with pressure diffusion included; (6) constant PMVs, variable diffusion coefficient, with pressure diffusion included; and (7) variable PMVs, variable diffusion coefficient, with pressure diffusion included. The OCP is also shown.
One can see that the only factor with significant influence on the discharge curve is the diffusion coefficient. The thermodynamic factor, in particular, lowers the overpotential in regions of highly sloping potential, but has a much smaller influence in the plateau regions. This effectively provides a higher discharge capacity than for simulations using constant diffusion coefficients. The other factors (pressure diffusion, variable PMV, compressibility, and convection) do not play a major role in the voltage response for small-expansion materials (i.e., those with volume change of  or less).
The maximum stress response at 10C shown in Fig. 4 tells a much different story, in that all of the factors considered have a significant impact. These influences were previously discussed in great detail,30, 31 but the role of pressure diffusion deserves further elaboration. Notably, for small-expansion materials, the pressure term can have an exceptional influence on the stress but has almost no impact on the voltage response. We repeat the diffusion equation here for the purpose of explanation

where  is the molar flux of Li-occupied lattice sites in the host material,
  is the molar flux of unoccupied (lithiated) sites,
  is the mole fraction of occupied (delithiated) sites,
  is the total concentration of sites,
  is the binary interaction parameter for occupied and unoccupied sites,
  is the radial position in the active material particle,
  is the gas constant,
  is the temperature,
  is the molar mass of occupied sites (including both the mass of the lithium and of the host material that comprises the site), ρ is the undeformed density of the host material,
  is the PMV of occupied sites, and
  is the pressure. The thermodynamic factor,
  , is given by (Eq. 10 of Ref. 30)

where  is Faraday's constant,
  is the OCP (as a function of lithium occupation), and
  is the activity coefficient for occupied sites.
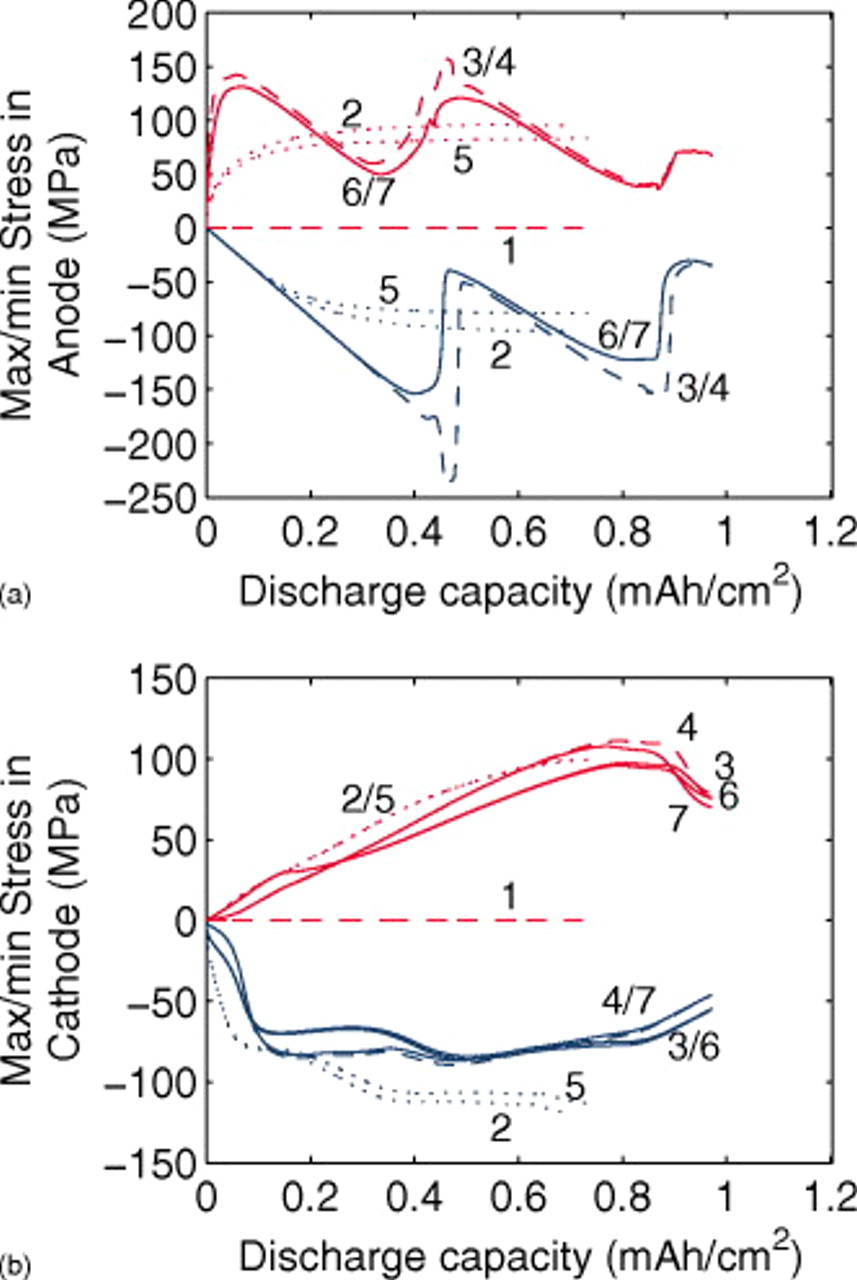
Figure 4. Stress response for a "power cell" discharged at 10C with various levels of nonideality (see Fig. 3).
In dimensionless form, assuming constant PMVs and neglecting material compression, the bracketed term in Eq. 7 can be written (see Eq. 93 and 104 of Ref. 30) as
where ξ is the dimensionless radius, ω is the fractional volume expansion,  is the molar-mass ratio
  ,
,  is the value of
  at which the full expansion
  is obtained,
  , π is the dimensionless pressure
and  is the dimensionless modulus
In the last two expressions,  is the elastic modulus, ν is Poisson's ratio,
  is the density of the undeformed material, and
  is the pressure at the particle surface.
We therefore conclude that pressure diffusion is negligible when
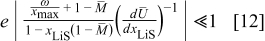
that is, when the thermodynamic factor is large,  is small, or the volume change is small
  . Conversely, pressure diffusion could become important if the thermodynamic factor is small (i.e., plateau regions of the OCP), if the expansion factor is large, or if
  is large. Note that
  is typically close to 1 (for graphite,
  ; for oxide materials, it is closer to 1).
Figure 4 of Ref. 31, which displays the ratio of the pressure gradient term to the concentration gradient term, erroneously omits the thermodynamic factor, giving the false impression that the pressure term is generally a small fraction of the concentration term. For the small-expansion materials simulated in this section, this tends to be true only when  . When
  , pressure diffusion may dominate in these materials, resulting in much lower concentration gradients and therefore much lower stress than if it were neglected. Note that if
  were negative, the pressure term would increase the concentration gradient as well as the maximum stress in the particle, and if by chance it were zero, pressure gradients would not drive diffusion at all. We shall see in later sections that for large-expansion materials or SOC windows, for which
  is large, pressure diffusion may influence diffusion and the voltage response even when the thermodynamic factor is large.
The pressure term has almost no influence on the voltage response of an MCMB/LMO cell because it is primarily active only when the thermodynamic factor is very small  . We can see that in such OCP plateau regions of Fig. 3, the variable diffusion coefficient (i.e., thermodynamic factor) does not strongly influence the voltage response. This behavior at the plateaus is even more apparent for a 1C discharge, as shown in Fig. 5. The OCP plateau regions are SOC regimes in which the OCPs of neither electrode depends strongly on concentration; therefore, surface kinetics, which follow the Butler–Volmer equation, are not significantly impacted by large concentration gradients in the particle. Hence, there is effectively no solid-phase mass-transfer resistance over the plateau. But as soon as the surface concentration reaches the point at which the surface OCP is affected (i.e., where the slope
  increases in magnitude), the thermodynamic factor, and hence the diffusivity, increases dramatically, and the surface concentration remains about the same until the wave of retarded diffusion associated with the plateau has penetrated the particle to its core. The stress gradient, which was much enhanced by the low thermodynamic factor during the period of retarded diffusion, now plummets until the next plateau in the OCP is reached.
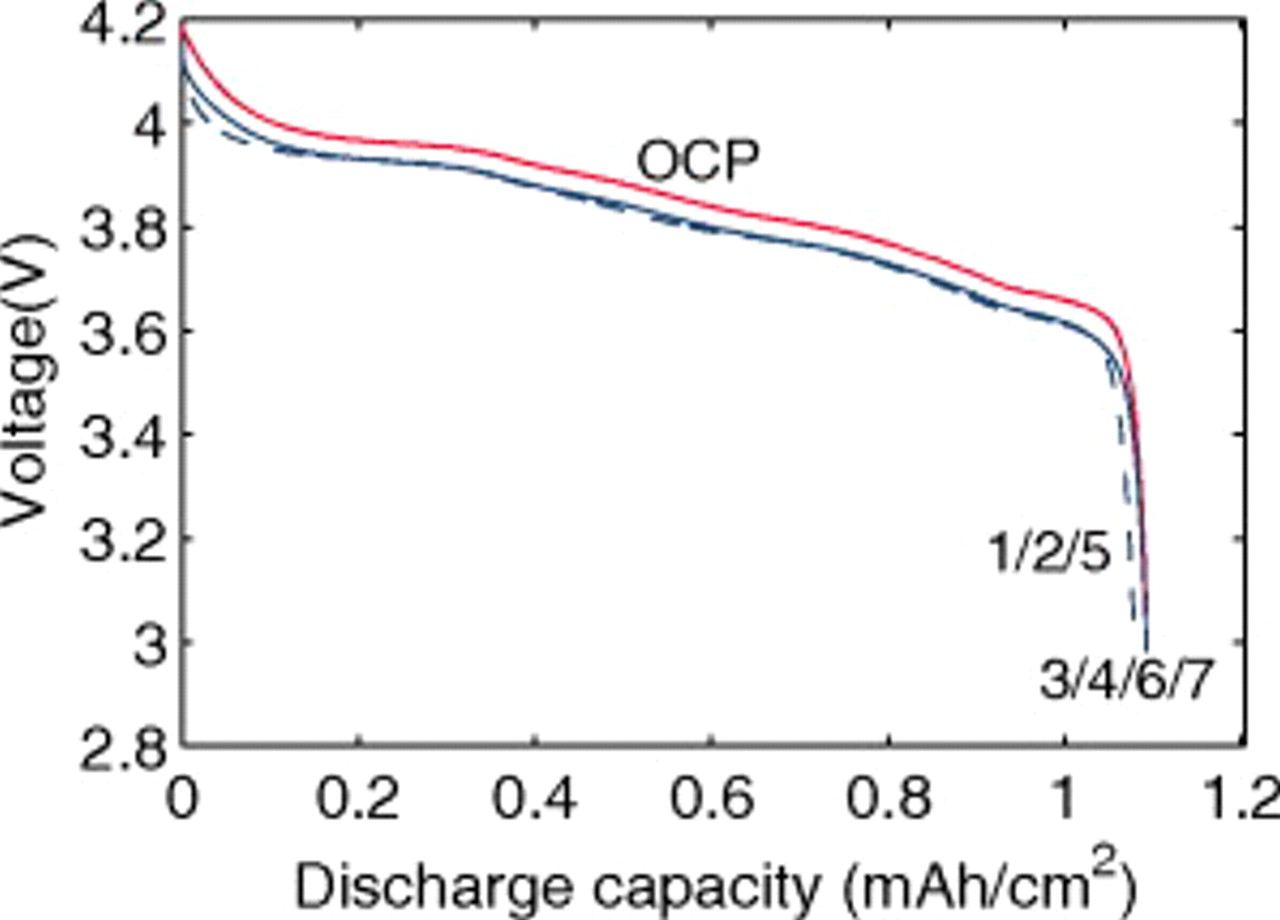
Figure 5. Voltage response for a "power cell" discharged at 1C with various levels of nonideality (see Fig. 3). The OCP is also shown.
To summarize, the thermodynamic factor in a variable diffusion coefficient only influences the voltage response in regions of sloping OCP by decreasing the overpotential. In contrast, the pressure diffusion term, which comes into play primarily when the thermodynamic factor is small, cannot influence plateau regions of the voltage response because mass-transfer limitations do not truly exist there and cannot influence sloping regions because it becomes negligible compared to the chemical diffusion term. However, it does impact the maximum stress by significantly lowering the solid-phase concentration gradient whenever the thermodynamic factor is small.
The impact of pressure diffusion on the peak stress is even more pronounced at lower rates, as seen in Fig. 6. Here, a 1C discharge rate is used. Figure 5 shows the voltage response, with similar features to those seen in Fig. 3, but with much less dissimilarity between simulations with constant diffusion and those with variable diffusion due to the lower polarization.
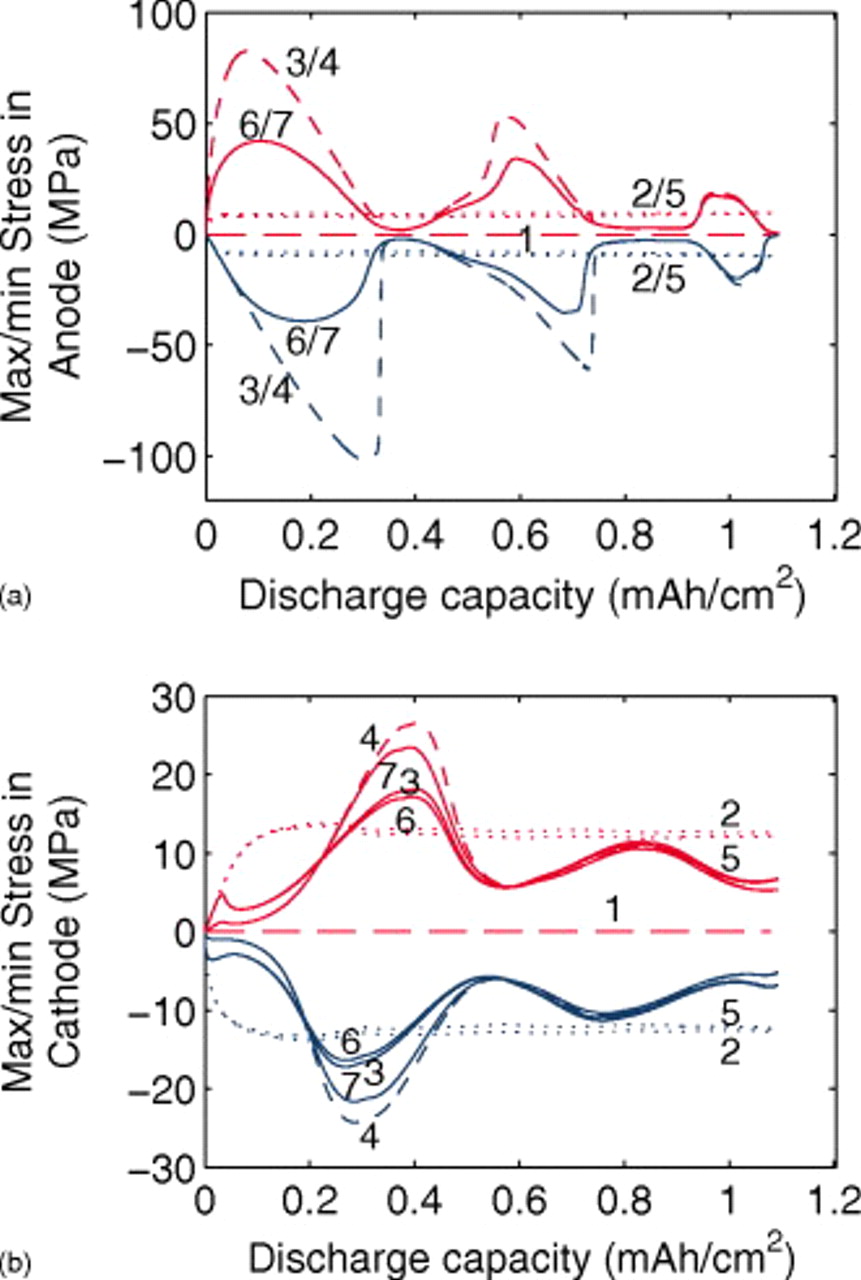
Figure 6. Stress response for a "power cell" discharged at 1C with various levels of nonideality (see Fig. 3).
Overpotential and the thermodynamic factor
To better understand the influence of the thermodynamic factor on the voltage response, it is informative to observe the variation in overpotential at low rate. Figure 7 shows the absolute value of the overpotential during a C/100 discharge for three scenarios: (i) constant diffusion coefficients; (ii) variable thermodynamic factors (but constant binary interaction parameters); and (iii) variable thermodynamic factors, with variable interaction parameter in the cathode. Notice that the overpotential obtained for case (ii) [in contrast to cases (i) and (iii)] is nearly constant over a large SOC range. The reason for this approximately ohmic behavior becomes apparent when one considers the contribution of solid-phase diffusion limitations to the overpotential at low rates, as we elaborate in the Appendix
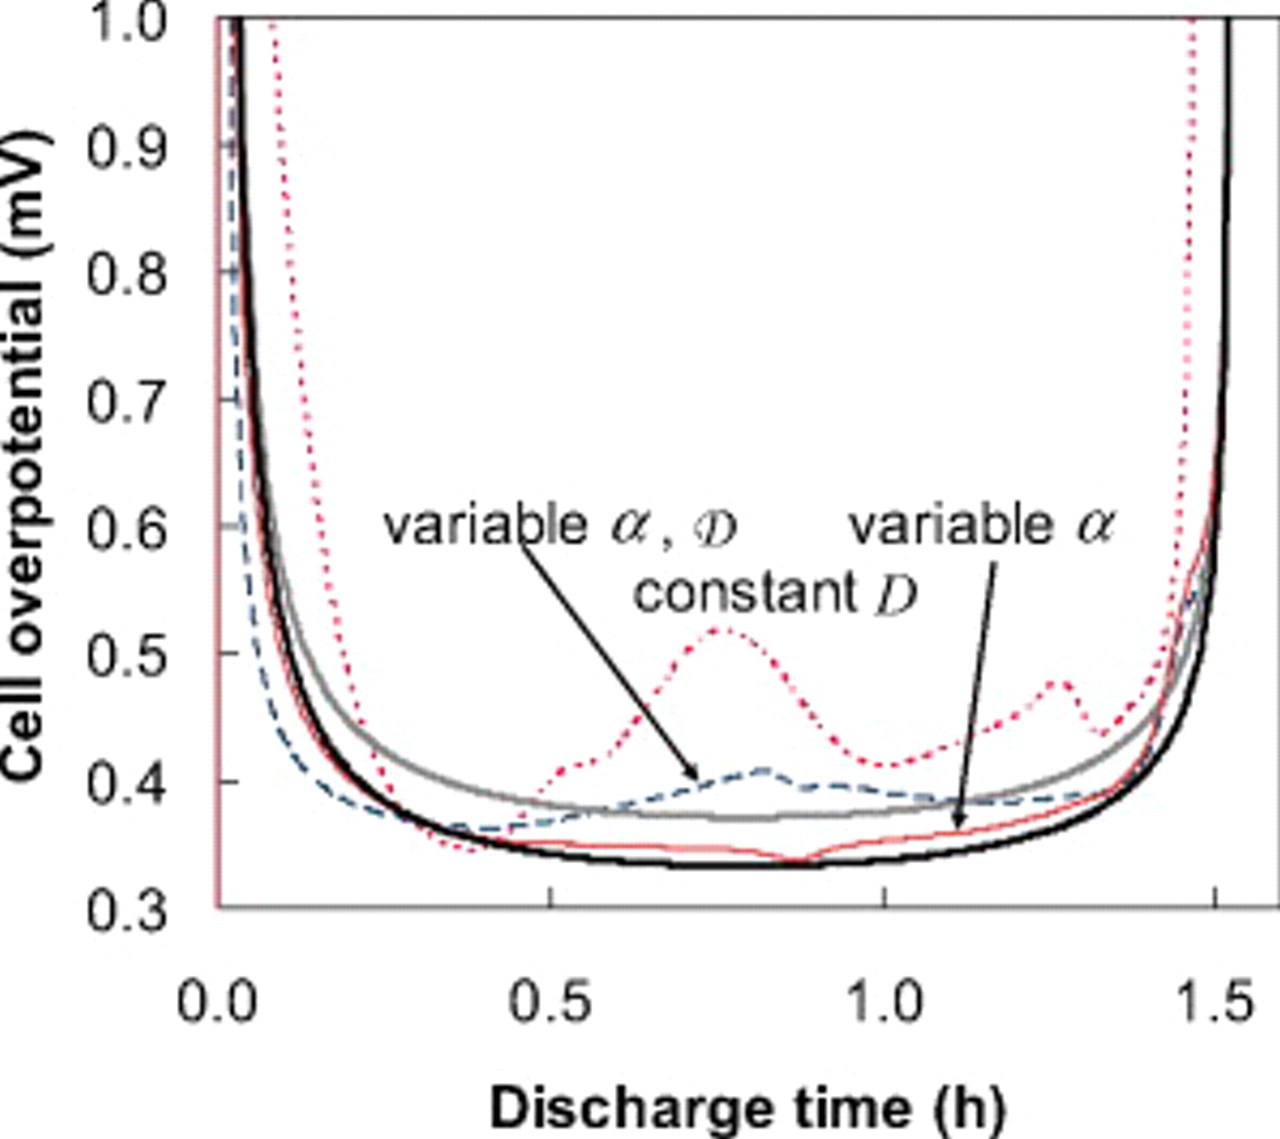
Figure 7. The cell overpotential for a "power cell" discharged at C/100. The dashed, dotted, and thin solid curves represent simulations for three cases for the solid-phase diffusion coefficient, as indicated. The thick solid curves are overpotentials computed from Eq. 14; the lower of the two curves neglects electrolyte ohmic drops in the porous electrodes.
The cell overpotential derived from Eq. 13, 14, 15 is superimposed onto the results in Fig. 7. We can see that the simulated overpotential, which accounts for a thermodynamic factor based on the OCP, but no other variation in the diffusion coefficients, roughly tracks the overpotential computed from Eq. 14, in which the electrolyte ohmic drop in the electrodes is neglected.
Influence of current on maximum discharge stress
The current distribution through the depth of an electrode can have a profound effect on the maximum stress generated in the cell, even at the low rates typical of a high energy cell. To elucidate the influence of current distribution on the maximum stress in porous electrodes, we performed simulations at various C rates for both energy ( electrode) cells and power (
 electrode) cells (see Table I). In addition, we repeated the simulations for a thin-electrode cell (nominal thickness of
  ) to represent intercalation/deintercalation in isolated particles discharged over approximately the same SOC range as in the power cells. In each case, we included the effects of pressure diffusion, variable diffusion coefficient, and variable PMV.
The peak tensile and compressive stresses in the cathode and the anode, as a function of C rate, are shown in Fig. 8 and 9, respectively. Discharge simulations for the energy cell terminated when the electrolyte concentration in the cathode dropped to zero; convergence was not obtained for rates above 12C.
We observed only minor differences  in the maximum stresses computed for 5.5 vs
  cathodes, indicating that current distributions in power-type cells are too small to influence the peak stress. In contrast, a threefold increase in the cathode thickness yields a large increase in both tangential and radial stresses at low rates.
We previously showed that the maximum surface stress during the charge or discharge of a particle increases monotonically with dimensionless current (or C rate).30 However, the maximum stress at the center of a particle exhibits a maximum at the current for which full development of the concentration profile coincides with the surface concentration reaching its maximum or minimum value.31 A similar nonmonotonic behavior occurs in porous electrodes if the cutoff voltage is reached before the full development of concentration profiles in the particles.
The maximum radial tensile stress in the energy cathode (Fig. 8) peaks at a C rate of 8, while for the thin cathodes, the peak occurs at 15C. For the thick electrodes, the end of the discharge occurs before the full development of concentration profiles at a relatively low C rate; for the thin electrodes, a higher C rate is required for this to occur. The surface compressive stress, which peaks much earlier during the discharge than does the internal tensile stress, is much higher for the energy cell than the power cell at every C rate. The nonuniformity in the energy-cell current distribution yields a peak surface stress in particles near the separator that is almost twice as great as the peak stress in the power cell. We point out that commensurate C rates in energy vs power cells imply a much higher current density in the former, and therefore much greater limitations in the electrolyte.
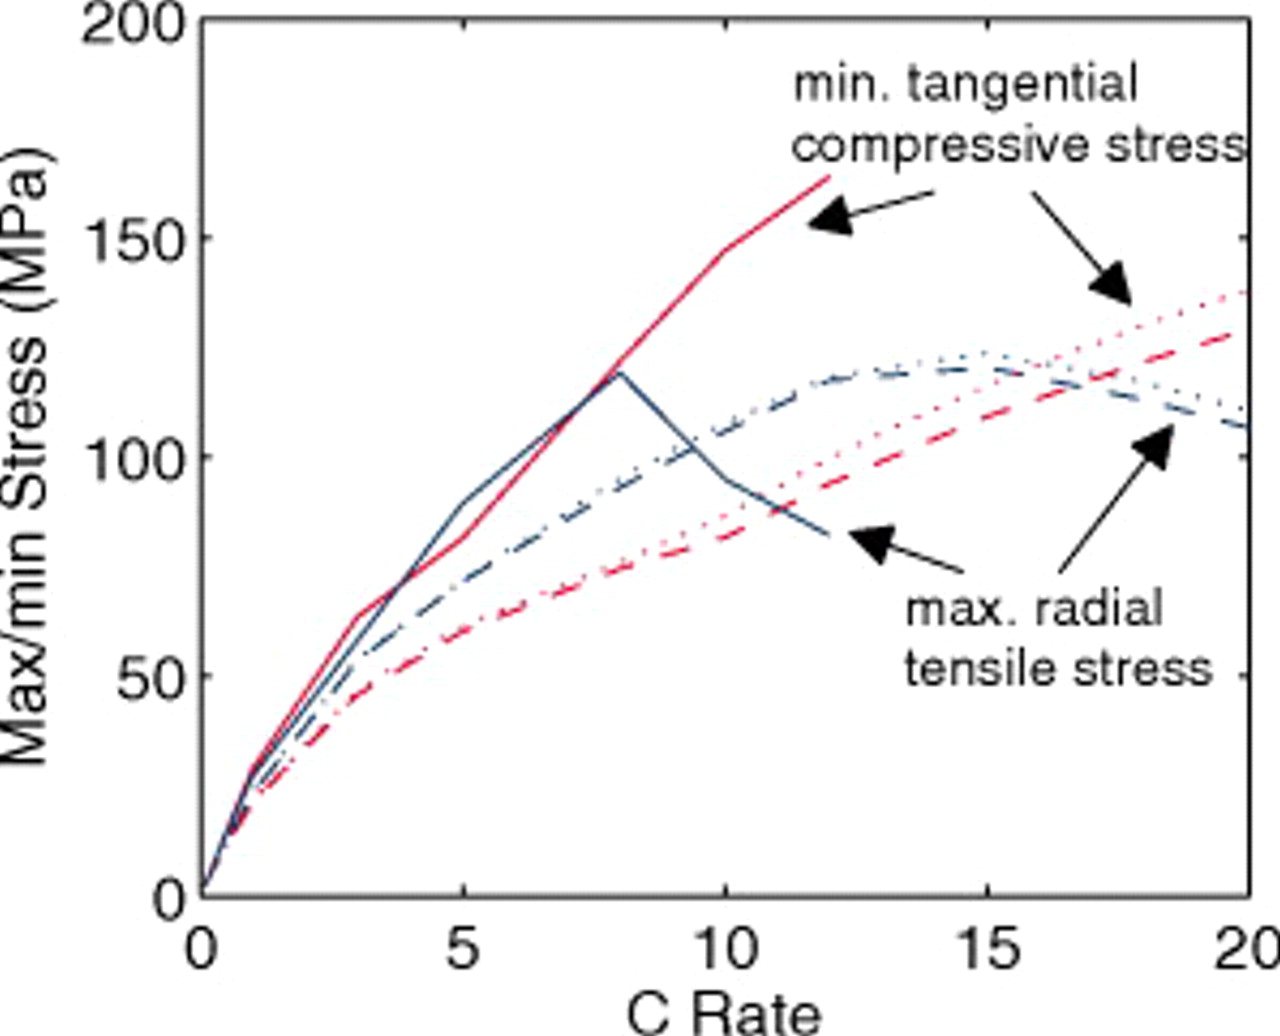
Figure 8. Cathode peak stress as a function of C rate (dashed:  electrodes, dotted:
  electrodes, and solid:
  electrodes). Peak tensile stresses occur at the center of particles and peak compressive stresses occur at the surface.
The peak stresses in the anode (Fig. 9) show similar but less pronounced trends. In this case, the difference between 45 and  electrodes is negligible, and the stresses in the energy anode are not much higher. As discussed in greater detail in the next section, the energy cell's stress distribution through the anode is much more uniform than through the cathode due to the much higher electrolyte conductivity in the anode. The greatest deviation in the anode compressive stress occurs above 8C, above which the energy cell reaches the end of discharge before full development of concentration profiles in the anode.
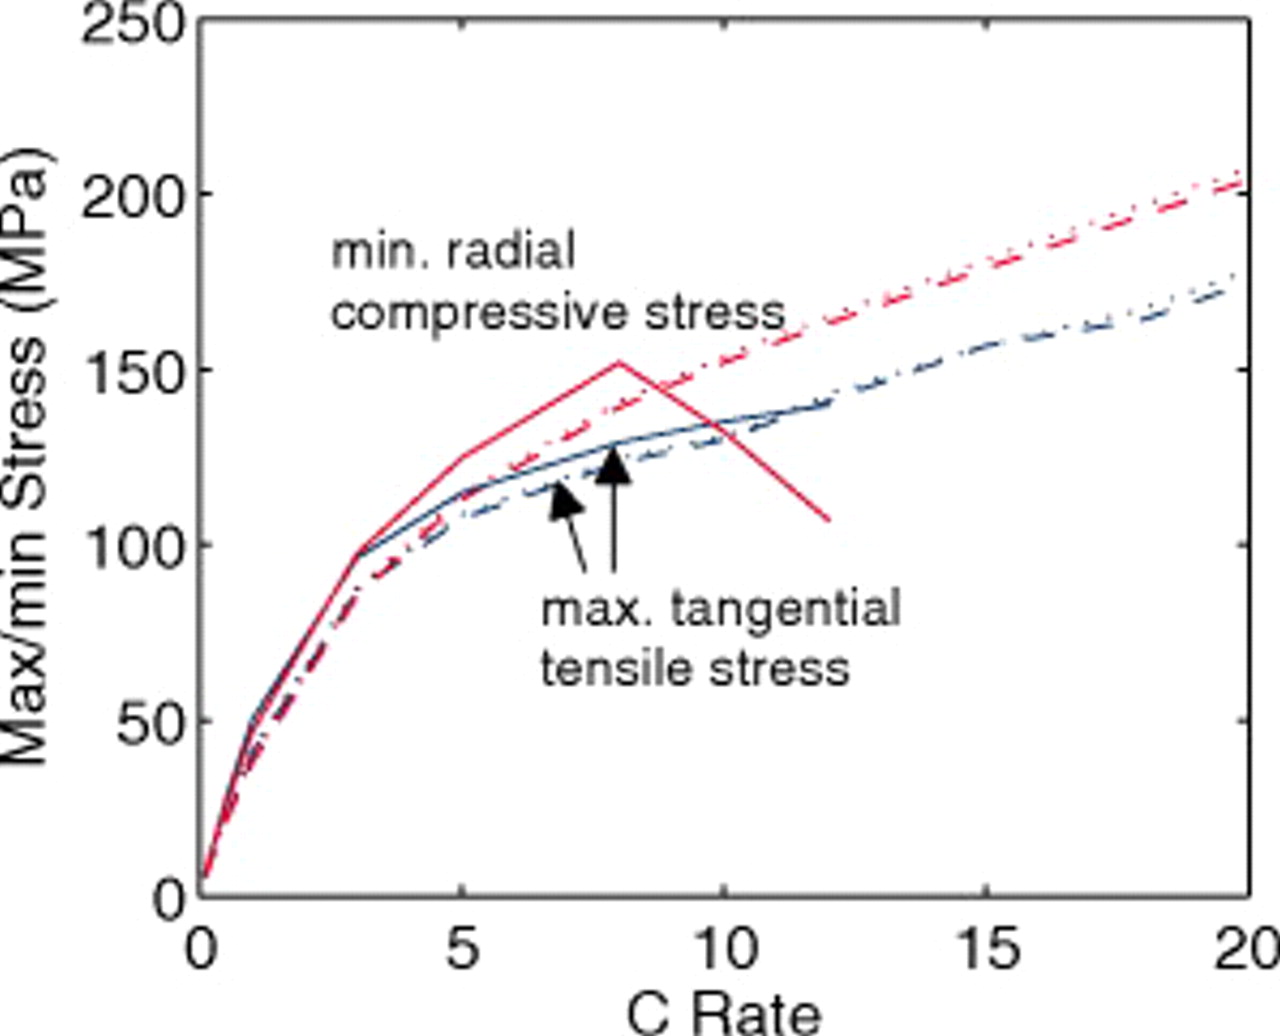
Figure 9. Anode peak stress as a function of C rate (dashed:  electrodes, dotted:
  electrodes, and solid:
  electrodes). Peak compressive stresses occur at the center of particles and peak tensile stresses occur at the surface.
Relaxation phenomena
The 10C discharge and open-circuit relaxation of an energy-type cell with a mean electrode thickness of  were simulated to illustrate the impact of porous electrode effects on relaxation. The duration of the 10C pulse was 36 s, representing a 10% change in SOC of the limiting electrode, in this case the cathode. The simulations included variable solid-state diffusivity and PMVs. Figure 10 shows the evolution of the cell voltage, for simulations with and without pressure diffusion, along with the OCP. The lower figure, a blowup of the first minute, shows that pressure diffusion has only a minor influence on the voltage.
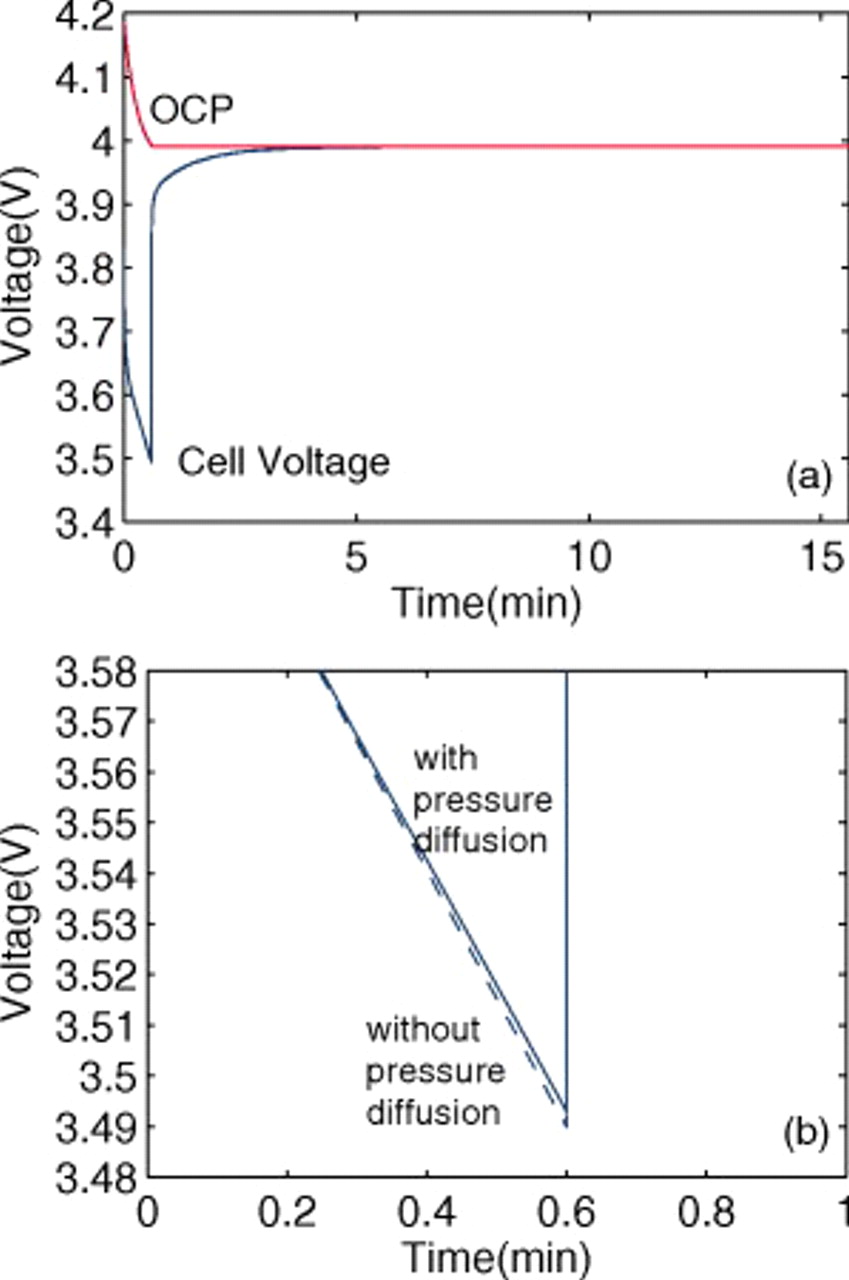
Figure 10. OCP  and voltage response
  for an "energy" cell (
 anode and
  cathode) during a 36 s 10C discharge and subsequent relaxation. The lower figure is a blowup of the first minute highlighting the impact of pressure diffusion on the voltage.
Figure 11 shows the peak stress evolution in the anode, which is much more strongly influenced by the pressure diffusion term. With the pressure diffusion activated (solid lines), there is an added stress-related driving force for relaxation of the solid-phase concentration profiles. However, this enhanced relaxation has little impact on the voltage because the potential of the anode is relatively flat with respect to concentration.
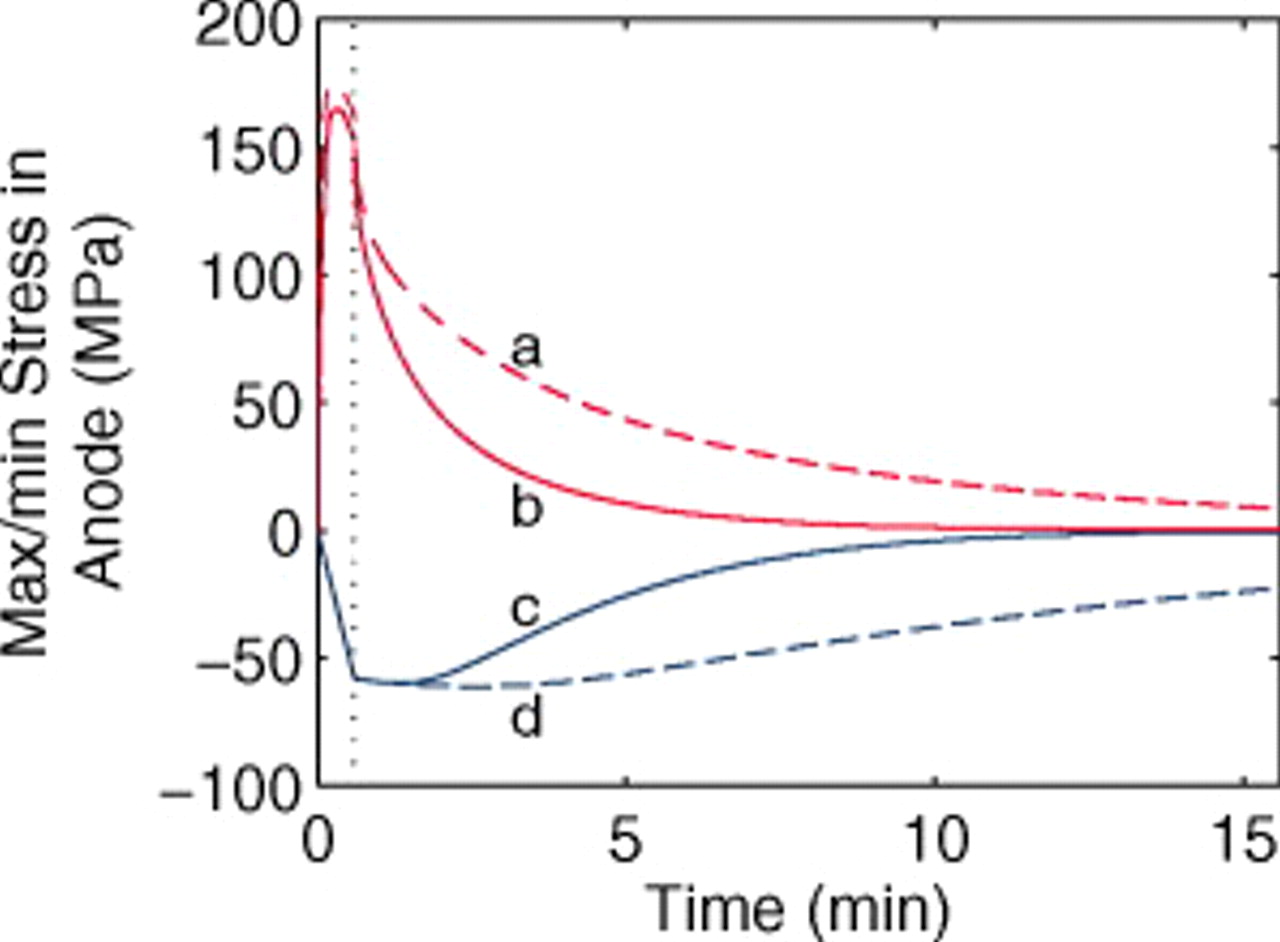
Figure 11. Stress extrema in a  anode ("energy" cell) during a 36 s 10C discharge and subsequent relaxation. (a) Maximum tangential stress (at particle surface), neglecting pressure diffusion; (b) maximum tangential stress, including pressure diffusion; (c) minimum radial and tangential stresses (at particle center), including pressure diffusion; and (d) minimum radial and tangential stresses, neglecting pressure diffusion. The vertical dotted line indicates the time at which the current is interrupted.
Figure 12 shows the peak stress evolution in the cathode. In this SOC regime, where the OCP of LMO is steep, the diffusion coefficient is relatively high, leading to very fast relaxation and an almost imperceptible influence of pressure diffusion.
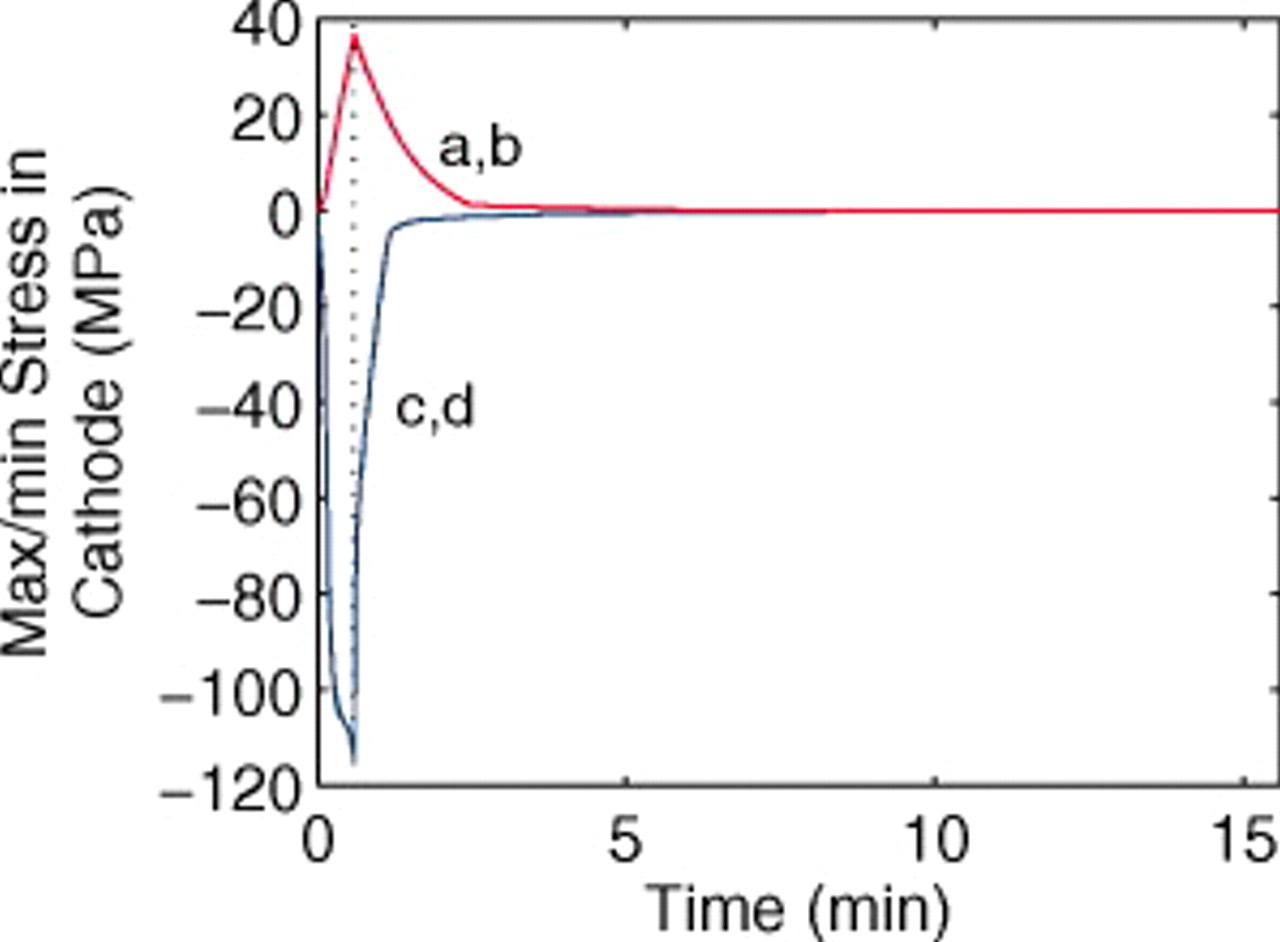
Figure 12. Stress extrema in a  cathode ("energy" cell) during a 36 s 10C discharge and subsequent relaxation. (a) Maximum radial and tangential stresses (at particle center), including pressure diffusion; (b) maximum radial and tangential stresses, neglecting pressure diffusion; (c) minimum tangential stress (at particle surface), neglecting pressure diffusion; and (d) minimum tangential stress, including pressure diffusion. The vertical dotted line indicates the time at which the current is interrupted. The lower figure is a blowup of the first minute highlighting the impact of pressure diffusion on the minimum stress.
We observe that the voltage is fully relaxed within 5 min of current interruption. Likewise, the stress in the cathode relaxes on this time scale. However, relaxation of stress in the anode takes considerably longer, especially when pressure diffusion is not considered. The plateau regions in the anode OCP correspond to the low thermodynamic factor and therefore low diffusivity values for the anode relative to the cathode. While porous electrode features can also play a role in relaxation, simulations of cells with thinner electrodes yield similar relaxation times, indicating that relaxation of the solid-phase concentration profile is the dominant process.
As was demonstrated via simulations by Albertus et al. ,56 a lithium-insertion material with a perfectly flat potential has a zero driving force for the redistribution of lithium (neglecting solid-state diffusion between particles). If such a material is a solid solution, the concentration profile flattens out within each particle, but the concentration level from one particle to the next may be different. Hence, the maximum stress during relaxation in the anode should follow the maximum stress in the active material particles with the highest concentration gradient, in this case at the separator/electrode interface.
The slow relaxation of stress due to concentration profile relaxation and lithium redistribution in a porous electrode may be in part responsible for the observation that electrodes continue to fracture after interruption of the current. Ohzuku et al. monitored such fracture in electrolytic  electrodes using acoustic emission spectroscopy.12 Figure 2 of Ref. 12 shows that the rate of acoustic events corresponding to fracture does not drop immediately to zero, but tapers off after current interruption. Notice that in Fig. 11, the peak compressive stress (at the center of particles) actually increases slightly in magnitude after current interruption, apparently because the concentration profiles near the separator had not fully developed before current interruption. A similar increase in compressive stress after relaxation was not observed for simulations of a power cell with thin electrodes. Thick electrodes receiving high currents experience a locally higher effective C rate near the separator. In this case, the time scale for full penetration of the concentration profile to the center of the active material particles is somewhat greater.
Fracture Penetration
In this section, we employ the modified model depicted in Fig. 2 to investigate voltage and stress evolution in cells with partially fractured electrodes. It is assumed that particles fracture close to the separator first because the local current and therefore stress tend to be higher there. The validity of this assumption is explored for both "power cells" (with thin electrodes) and "energy cells" (with thick electrodes). The implications of fragment isolation are also explored.
Power cells
To simulate fracture penetration in power cells, we chose a mean electrode thickness of  and an anode/cathode capacity ratio of 1.224, such that the anode and cathode thicknesses were 45 and
  , respectively. The initial SOCs of the anode and cathode were set to 0.75 and 0.2, respectively, resulting in a cell that is thermodynamically limited by the anode on discharge and by the cathode on charge.We first examine the voltage response of a fractured power cell, in which particle fragments remain in good electronic contact with one another and with the unfractured section of the electrode, as a function of fragmentation depth.
Figure 13 shows that as the fragmentation depth increases, the impedance of the cell decreases, and therefore the effective 10C capacity increases. Here, we have not accounted for any capacity fade that may occur due to film-forming side reactions on the freshly exposed electrode surface. Doing so would likely not affect the cell overpotential considerably, but would result in capacity fade.
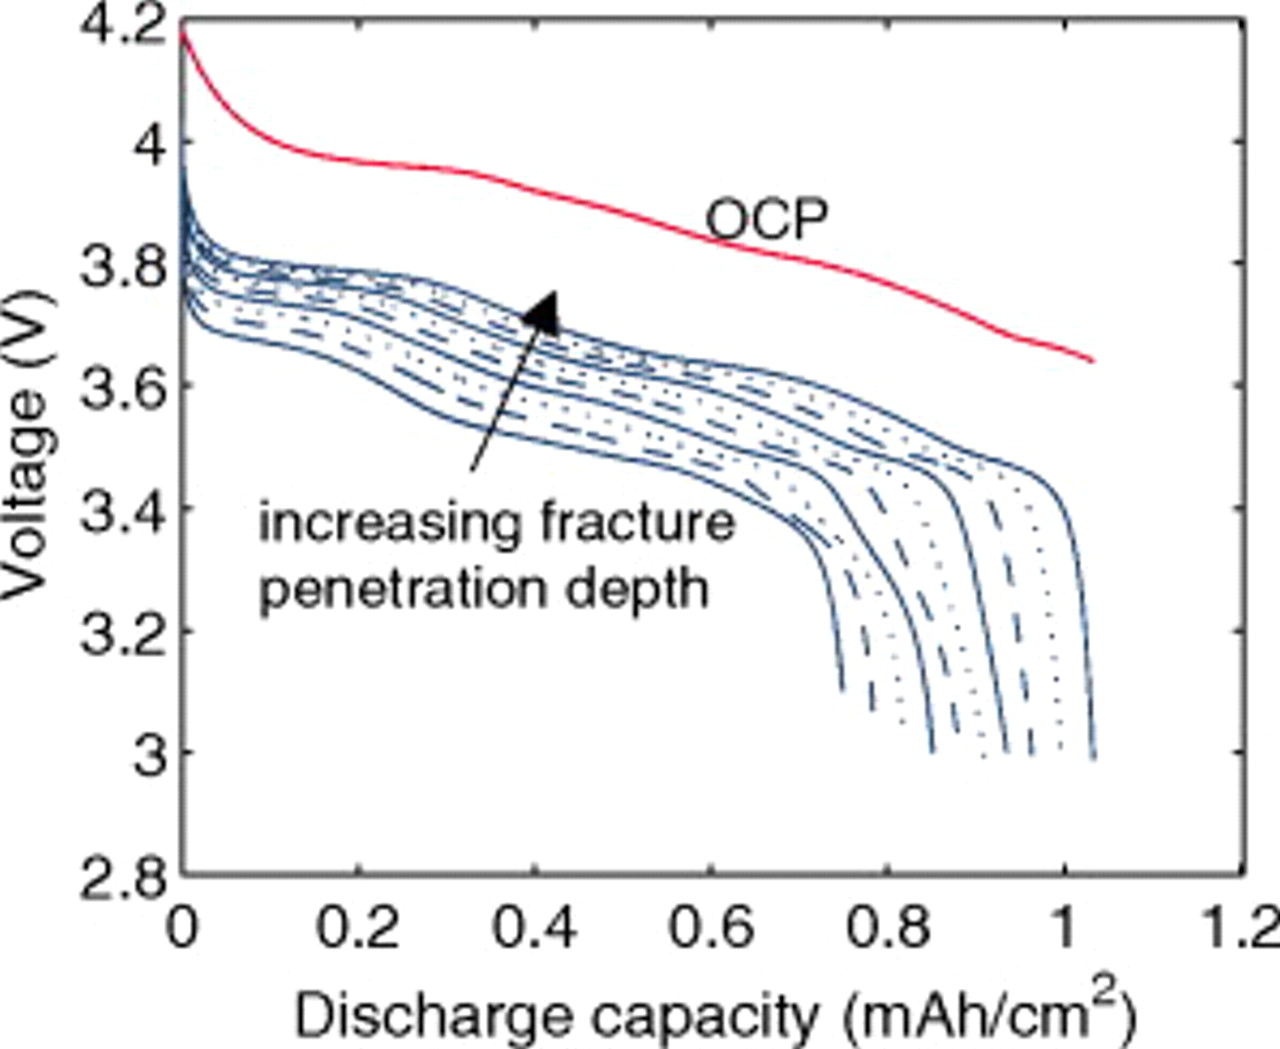
Figure 13. OCP and 10C discharge voltage for a "power" cell showing voltage profile as a function of fracture penetration depth, ranging from 5 to 95% in increments of 10% (see Fig. 2).
We expect that the current distribution in such a cell should be fairly uniform; therefore, the peak particle stress should depend much more strongly on particle size than on particle position through the depth of the electrode. That is, the stress should not vary much within the fractured region of the electrode or within the unfractured region, but will be much different from one region to the next.
Figure 14a, which shows the spatial distribution of the local peak stress during the discharge of a power cell with 35% fragmentation, confirms this expectation. The position is given from the anode current collector to the cathode current collector; the gap in the stress profiles corresponds to the separator region. The vertical dashed lines indicate the fragmentation boundaries in the two electrodes, where there is a discontinuous jump in stress between the fractured region (near the separator) and the unfractured region (near the current collectors). The sloped part of the stress curves through the dashed lines is an artifact of the finite number of mesh points used in the simulations; in an actual cell, there would be a discontinuity at the dashed lines.
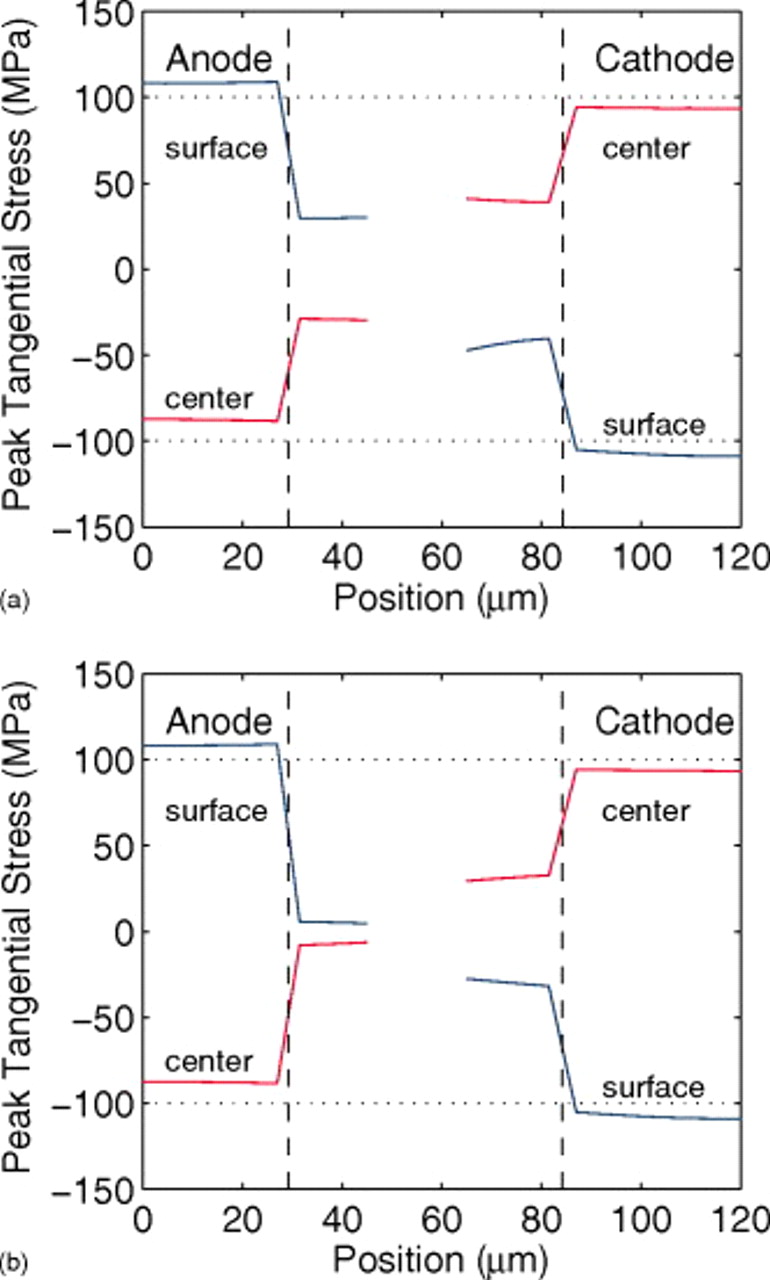
Figure 14. Local peak stresses in the anode and cathode (a) during a 10C discharge and (b) at the end of the discharge of a "power" cell with 35% fragmentation, as indicated by the vertical dashed lines. "Surface" and "center" indicate the location within a spherical particle where these extrema are found. The horizontal dotted lines at  are meant to guide the eyes.
The locations of the maximum and minimum stresses in each electrode correspond to the surface or center of an active material particle, as indicated. During discharge, the lithium flux is out of the anode active material and into the cathode active material, resulting in compressive stress in the center and tensile stress at the surface of anode particles and the opposite for cathode particles. Here, we present only the tangential stress. For a spherical particle, the radial and tangential stresses are identical at the center and, in the absence of surface forces, the radial stress is zero at the surface.30, 31
At the end of discharge (Fig. 14b), the stresses in the unfractured regions (i.e., with large-particle radius) are considerably higher than in the fractured regions. The stress in the fractured region of the anode has dropped almost to zero by the end of discharge, indicating that the active material there has become "saturated" with lithium vacancies; the burden of the current must therefore be carried by the larger unfractured particles. In the cathode, the stress in the fractured region is still significant, indicating that the smaller particles have not yet fully saturated with lithium by the end of discharge.
Figure 15 more clearly illustrates the transitions associated with concentration profile development in the small vs large particles, as well as the impact of fracture penetration depth. The figure shows the evolution of stress extrema as the cell is discharged for various fracture penetration depths. As many as three regions are apparent in the stress evolution: (i) At short times, the peak stress is in the smaller, fractured particles; (ii) the peak stress transitions to the larger unfractured particles once their concentration profiles are fully developed; and (iii) fractured particles reach saturation, resulting in a rapid increase in stress in the unfractured particles.
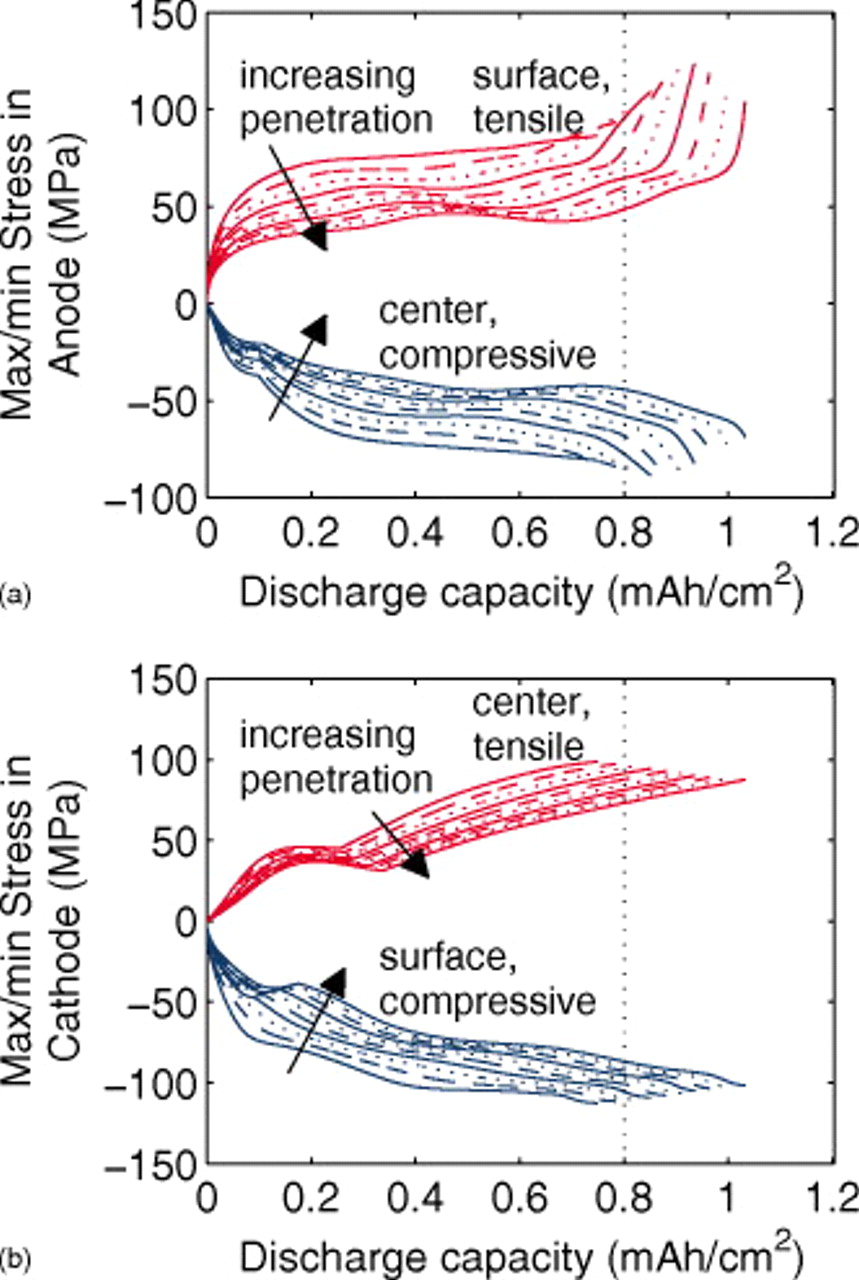
Figure 15. Stress extremum variation in the (a) anode and (b) cathode of a "power" cell during 10C discharge, as a function of fracture penetration, ranging from 5 to 95% in increments of 10%. "Surface" and "center" indicate the location within a spherical particle where these extrema are found. The vertical dotted lines at 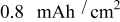 indicate the approximate capacity at which the saturation of small particles is reached in the anode for high fragmentation depth.
Initially, the peak stress is located in the particles closest to the separator, even though they are smaller than the particles closer to the current collector. At very short times, diffusion into a sphere behaves like diffusion into an infinite medium, with all the action taking place in a thin boundary layer near the surface; hence, the impact of particle size on the stress at the surface is not as great as the impact of lithium transport in the electrolyte, which results in a higher current density near the separator than near the current collector.
As the fracture penetration depth increases, the fraction of small vs large particles increases. At a dimensionless depth of 0.05, only 5% of the particles are small; these "low resistance" particles initially receive a significant share of the current. As the fraction of small particles increases, each of them receives a slightly lower current, while each of the "high resistance" large particles receives a slightly higher current. Hence, as we see in Fig. 15, the peak stress decreases as the electrodes become more fractured.
The stress evolution curves in the cathode, as well as the anode compressive stress, show a clear transition from regime 1 to regime 2. The kinks (or temporally local minima for the cathode) correspond to sudden transitions in the positions of the associated node points (i.e., particles) that carry the maximum stress. The peak stress transitions from fractured (small) to unfractured (large) particles once the concentration profiles in the large particles become developed to the point that the difference in maximum and minimum concentrations in the large particles is greater than that in the small particles.
In the anode, a third regime is observed in the stress evolution curves. The stress begins to rise sharply toward the end of discharge. This feature results from saturation of the small particles, which imparts a higher effective C rate to the large particles. Recall that the cell is designed to be anode limited on discharge; hence, the feature is not observed in the cathode.
As the anode fracture depth increases, more of the electrode consists of small particles that saturate before the end of discharge, and a larger share of the current (thus higher C rate) must be carried by the large unsaturated particles. However, at very high penetration, the small particles in the anode do not become fully saturated by the end of discharge; hence, the large unfractured particles experience less stress than at intermediate penetrations. This interplay between small-particle saturation and relative number of large and small particles is what gives rise to the nonmonotonic dependence of the anode's peak stress on fracture penetration depth (Fig. 16).
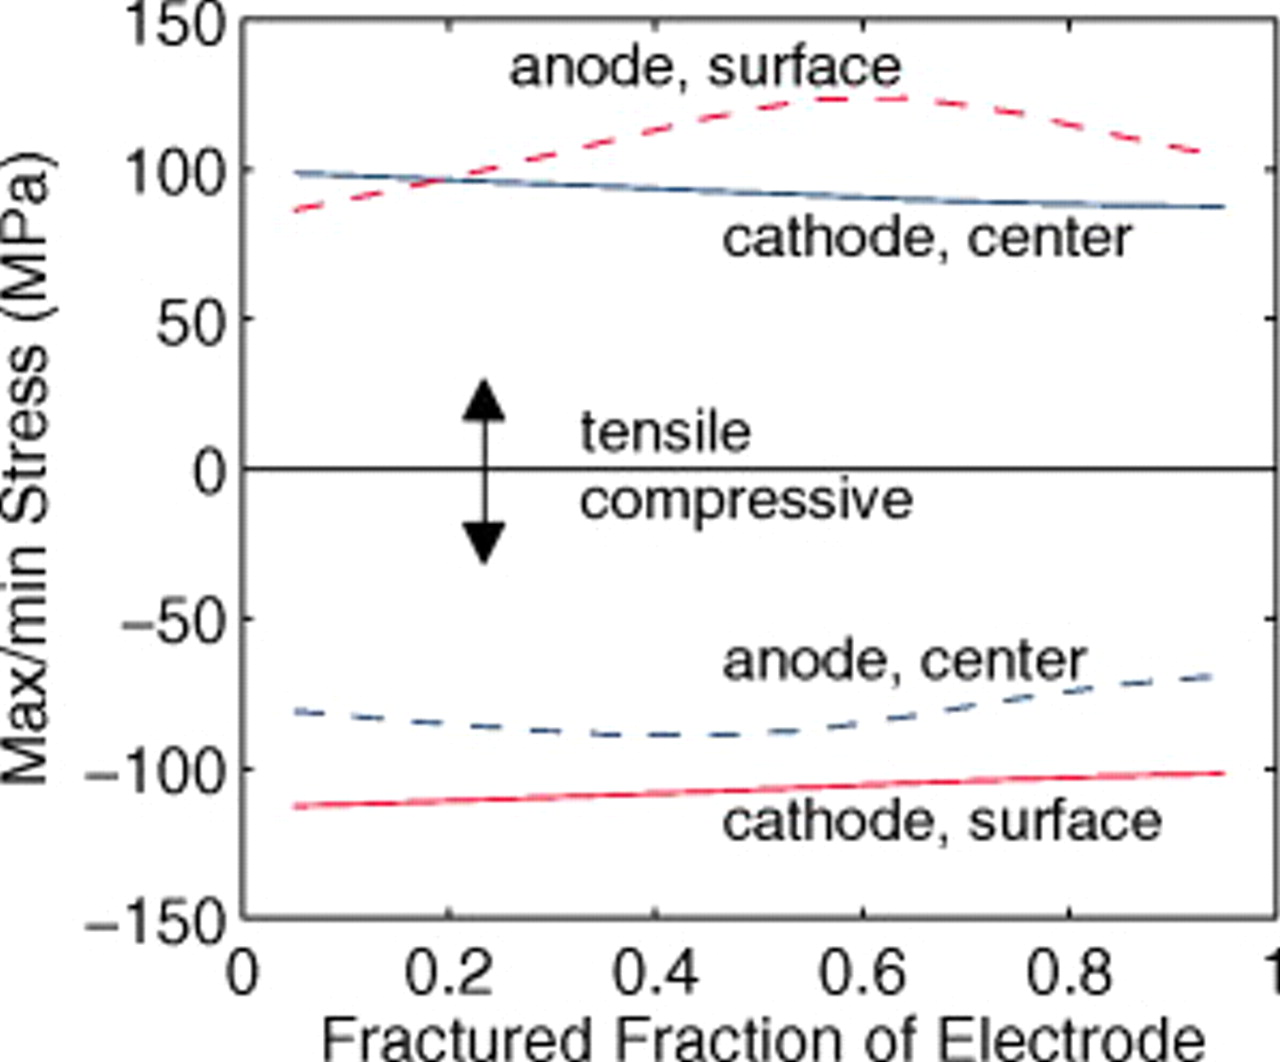
Figure 16. Stress extrema over the course of a 10C discharge in a "power" cell as a function of particle fracture penetration depth. "Surface" and "center" indicate the location within a spherical particle where these extrema are found.
The regimes in which the maximum stress is carried in small vs large particles are clearly seen for stress extrema that occur at the center of particles in both the anode and the cathode. This can be understood easily in terms of the time scale for concentration profile development for the two particle sizes. As the profiles in the larger particles become more fully developed, the stress at the center of the large particles ultimately surpasses that in the center of the small particles. In the cathode, the stress at the center actually begins to bend over before the concentration profile development in the large particles causes the peak stress to rise again. This is because the smaller particles have already begun to saturate with lithium before there is time for sufficient development of the large-particle concentration profiles. In the anode, the time scales are such that the concentration profiles in the large particles develop before saturation of the small particles, and we do not observe a temporary stress decline. This is due to the greater solid-state diffusion coefficient used for the anode compared to the cathode.
For the surface stresses, we see similar behavior in the cathode, but only for high fragmentation penetration depths. At short times, the particle size does not influence the concentration profile at the surface of the active material. Hence, if there are large particles near the separator (i.e., in the case of low fracture penetration depth), the time scale at which size begins to matter may be smaller than the time scale for transport of Li in the electrolyte to the large particles, and we should observe a smooth transition from small to large particles carrying the maximum surface stress. At higher penetration, there is sufficient time for the stress at the surface of the small particles to rise and begin to fall before sizable lithium concentration profiles develop at the surface of the larger pristine particles. Again, because of its larger solid-state diffusion coefficient, we do not observe any such transition in the surface stress of the anode particles.
Figure 17 shows the time evolution of stress extrema in the two electrodes of a cell that is 95% fractured, with the bottom figures indicating the position within each electrode at which the maximum or minimum stress occurs. This figure clearly indicates the stress evolution regimes described above. Initially, the small fractured particles carry the highest stress. The full development of concentration profiles in large unfractured particles is indicated by the first vertical line, at which point we see a sudden change in the position of the node carrying the peak stress. In the cathode, there are really two transitions; the first (at 53 s) is associated with the surface stress transition, and the second (at 101 s) with full concentration profile development. The saturation of smaller particles in the anode is also indicated. Here, the current to the large particles, and therefore the stress, begins to increase rapidly.
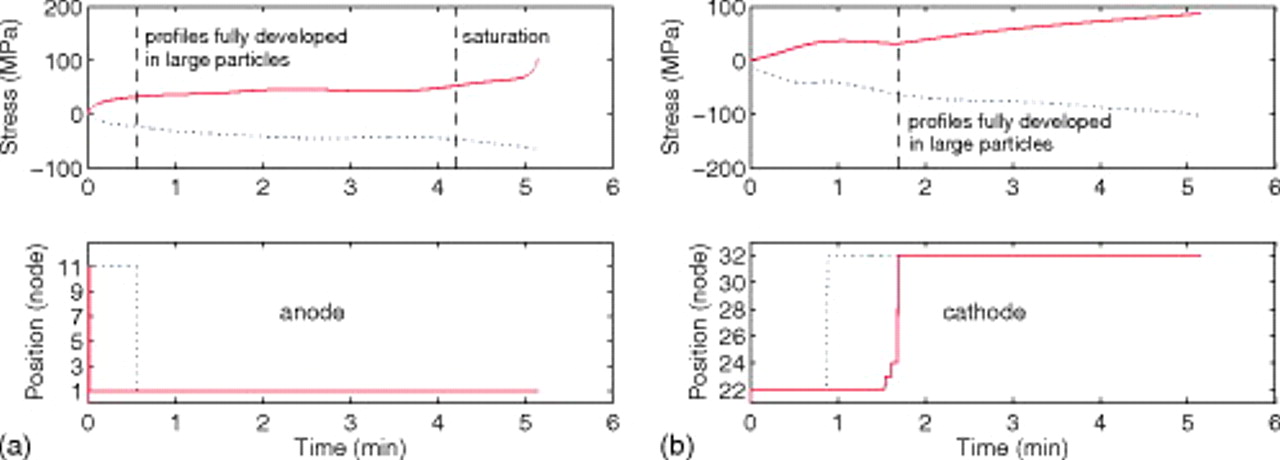
Figure 17. (Top) Time evolution of stress extrema in the (a) anode and (b) cathode of a "power" cell that is 95% fractured. (Bottom) The node position, corresponding to the electrode depth, at which the stress extrema occur. In the anode, nodes 1 and 11 are at the current collector/electrode interfaces and electrode/separator interface, respectively. In the cathode, nodes 21 and 31 are at the separator/electrode and electrode/current collector interfaces, respectively. The times at which concentrations in large unfractured particles become fully developed and the time at which smaller particle fragments in the anode become saturated are marked with vertical dashed lines.
We can conclude from these simulations that if the anode of this particular cell undergoes fracture near the separator, it will probably continue to fracture all the way to the current collector as it is discharged completely. However, if one limits the discharge capacity of the cell to its initial value in the pristine state (see the vertical lines in Fig. 15), it might be possible to limit the fracture penetration depth. This strategy may also restrict fracture penetration in the cathode. However, we observe that the peak stress falls off with penetration depth for the cathode, which in this case is not limiting on discharge. Full decrepitation of nonlimiting electrode may not occur even if the cell is completely discharged.
Particle disconnection
Figures 18 and 19, respectively, show the local stress extrema and voltage evolution with fracture penetration for a power cell in which particle fragments are completely electronically disconnected from the electrode. This scenario can be approximately represented by increasing the thickness of the separator and decreasing the thickness of the electrodes.If the cell current remains the same, the effective C rate experienced by the unfragmented active material increases with penetration depth. Hence, we expect the stress in the active material to increase with fracture penetration. This is observed in all cases (Fig. 18) except for the stress at the center of the particles in the cathode, which exhibits a nonmonotonic behavior. At higher penetration depths, the tensile stress at the center of the cathode particles becomes lower because there is less time for the development of the solid-phase concentration profile before the end of discharge. This is not the case for the anode, which, in addition to being the discharge-limiting electrode, has a larger diffusion coefficient and therefore smaller diffusive time constant than the cathode.
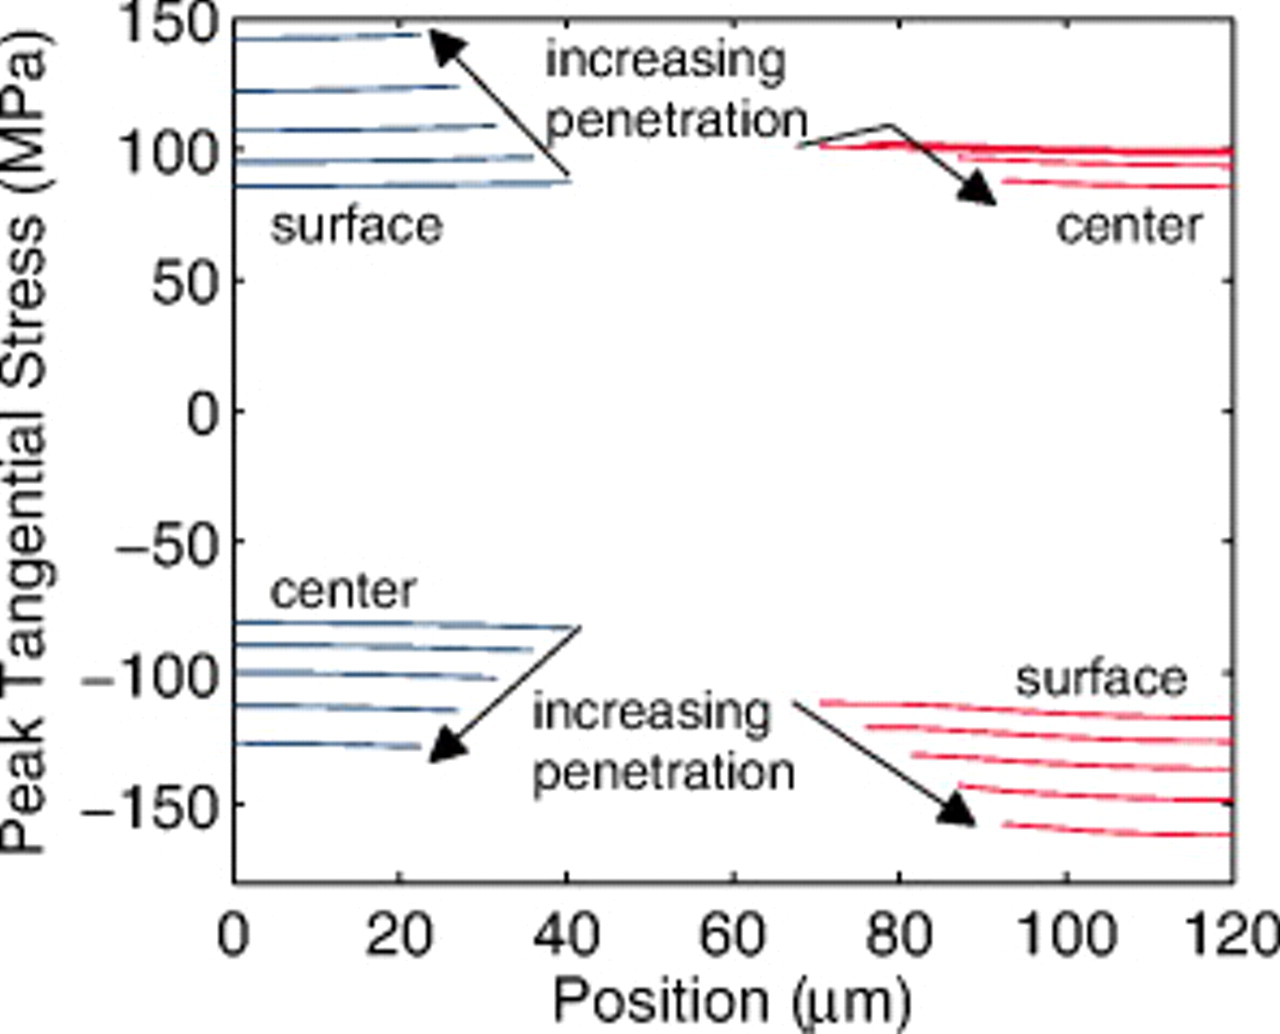
Figure 18. Stress extrema over the course of a 10C discharge in a "disconnected power cell" as a function of position (from the anode current collector to the cathode current collector) for various fracture penetration depths (5–45% in increments of 10%). "Surface" and "center" indicate the location within a spherical particle where these extrema are found.
The discharge voltage profiles in Fig. 19 show that the impedance increases while the effective capacity decreases with increasing fracture penetration (i.e., increasing effective C rate). This is opposite to what we observe for a "connected power cell" and, if other aging phenomena [including fresh solid electrolyte interphase (SEI) formation] are unimportant, could be an experimental indicator of particle connectivity when particle fracture is observed. Another indicator might be the extent of fracture through the electrode depth. For cells with disconnected fragments, continued cycling at the C rate required for fracture (or even lower rates) would likely result in decrepitation of the entire electrode.
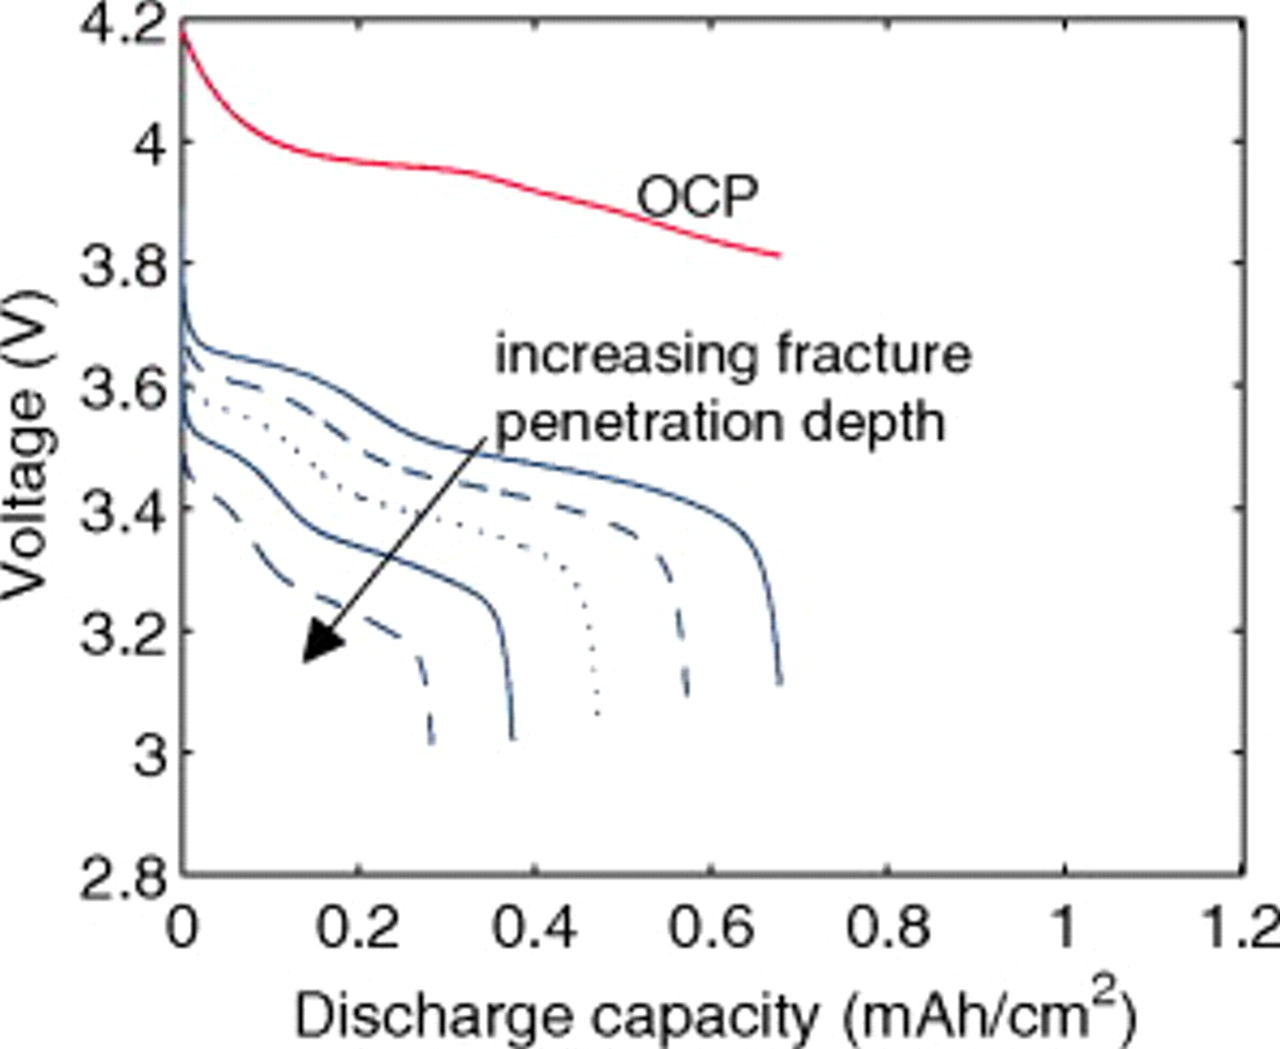
Figure 19. OCP and 10C discharge voltage for a "disconnected power cell" showing voltage profile as a function of fracture penetration depth ranging from 5 to 45% in increments of 10% (see Fig. 2).
Energy cells
While the current distribution in a power cell is more or less dependent only on the particle size distribution, and otherwise not on position within the electrode, significant electrolyte concentration gradients may develop in the thicker electrodes characteristic of energy cells. To understand the impact of electrolyte limitations, we simulated the 10C discharge of cells with an average electrode thickness of  (135 for the anode and 165 for the cathode). All other properties were identical to those of the power cells (see Table I).
Figure 20 shows the evolution of the local stress extrema through the depth of the cell at various particle fracture penetration depths. The superimposition of each set of curves gives rise to two dark bands corresponding to unfractured particles (band with higher stress values) and fractured particles (band with lower stress values). In the gap between each pair of bands, lines connecting the two bands indicate the fracture penetration depth of the electrode. The separation between the bands indicates the influence of particle size on the stress, while the variation in stress within each band indicates the influence of mass-transfer and ohmic resistances in the electrolyte.
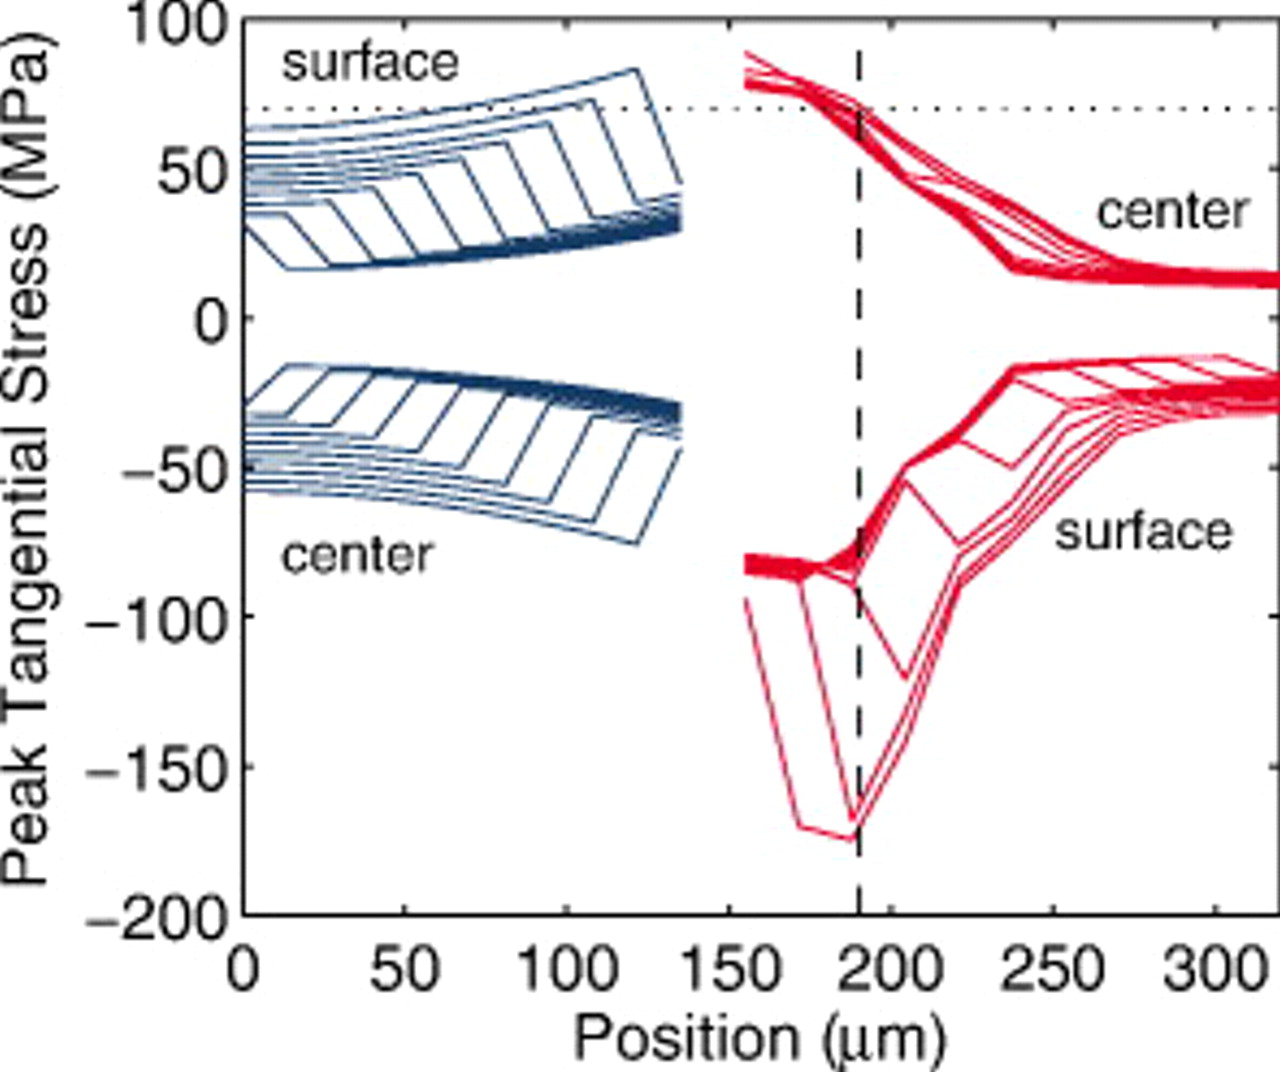
Figure 20. Peak stress profiles for an "energy" cell discharged at 10C, in which fractured particles remain connected, for fracture penetration depths ranging from 5 to 95% in 10% increments (see Fig. 2). The horizontal dotted line represents a tensile yield stress of 75 MPa in the cathode; the vertical dashed line represents the approximate fracture penetration depth for a cathode with 75 MPa yield stress.
The figure shows that the stress at the back of the electrodes increases slightly or even decreases as the electrodes become more fractured. The distribution of the maximum tensile stress in the cathode is dominated by mass-transfer effects in the electrolyte rather than the particle size. Both features play a significant role for the anode as well as for the surface compressive stress in the cathode, where we observe both a particle-related bimodal stress and continuous electrolyte-related gradients. The electrolyte limitations in the cathode are much more severe because the limiting current is reached at this high C rate. It is the electrolyte concentration falling to zero in the cathode that drives the cell voltage to its lower cutoff.
One can imagine that an energy cell discharged repeatedly under these conditions may fracture only in a limited region near the separator. This would be true for the cathode if the yield stress for the cathode material were 75 MPa (see dotted line). In this case, the fracture penetration depth for the cathode would be  (see dashed line), which happens to be consistent with Horn and White's postmortem evaluation of a laptop cell.26
In such cases where porous electrode effects are very important, it may be preferable to simulate the decrepitation by continuing to decrease the particle size in the fractured region until the stress in this region falls below the material's yield stress. The present finite difference code, with some minor modifications, could be used for this purpose, which is beyond the scope of this work.
Although such simulations are also beyond the scope of this paper, we point out that decreasing the electrode porosity, electrolyte cation mobility, or cell temperature would have an impact on the current and stress distributions similar to increasing the electrode thickness.
Large Volume Change
So far, we have seen that the electrochemical properties of a Li-ion cell have a strong influence on the mechanical stress it experiences, while the converse influence is much weaker (see Fig. 3 and 5). Thus, it would seem reasonable to simulate the electrochemical behavior of lithium-insertion cells independent of the mechanics and to compute the electrode stress distributions a posteriori. However, large-expansion insertion materials such as alloys may require coupling of electrochemical and mechanical effects.
Figure 21a shows simulated 10C discharge curves for a power cell with anode and cathode materials that expand by 80 and 65%, respectively (i.e., 10 times the volume change in MCMB and LMO), with and without the pressure diffusion term in the diffusion equation. Figures 21c and 21e show the stress evolution in the anode and cathode, respectively. The results for a standard MCMB/LMO power cell (with 8 and 6.5% expansions) are shown in subplots (a), (d), and (f). It is obvious that pressure diffusion has a much greater impact on the electrochemical and mechanical response of large-volume-change materials. Hence, electrochemomechanical coupling should be considered when modeling alloys and other large-volume-change materials.
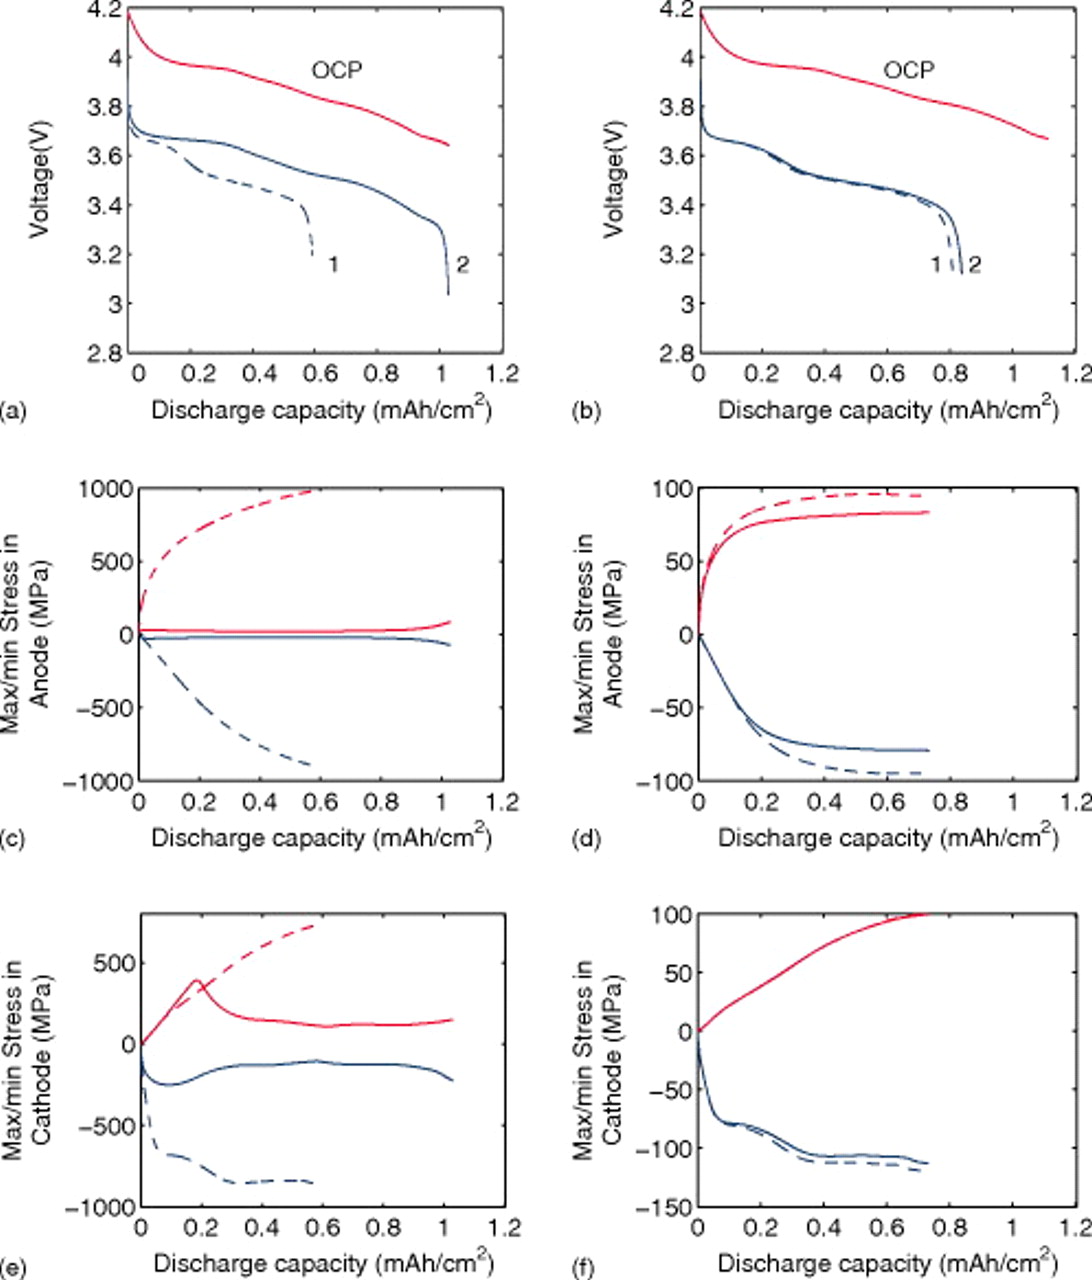
Figure 21. Voltage and peak stress profiles for the 10C discharge of a "power cell." Subplots (a), (c), and (e) show, respectively, the voltage, cathode stress, and anode stress for a cell with large-expansion materials (80% in the anode and 65% in the anode). Subplots (b), (d), and (f) show, respectively, the voltage, cathode stress, and anode stress for a standard MCMB/LMO cell with 8 and 6.5% expansions in the anode and cathode, respectively. The solid curves are for simulations including pressure diffusion, while the dashed curves exclude pressure diffusion. The diffusion coefficients and PMVs were held constant for all materials.
Alloy insertion materials tend to have much higher measured diffusivities than carbon and intercalation oxides; therefore, the influence of pressure diffusion on cell voltage may be much weaker than what we observe here. However, these results beg the question as to whether the true chemical diffusion coefficient is always measured experimentally or whether it may be obscured by the effects of pressure diffusion. Special care should be taken to design experiments that isolate the two driving forces for diffusion.
Nonlinear Lattice Expansion in Graphite
It is likely that graphite electrodes do not deform in the manner described thus far. Experimental evidence suggests that graphite experiences most of its deformation when the material is first lithiated.23, 57 Ohzuku et al. performed acoustic emission spectroscopy on graphite electrodes during discharge and observed that the majority of the fracture events occurred between SOCs of 0 and 0.1 (see their Fig. 3b).23 Hardwick et al. found that the structural disordering of MAG-10 graphite was more severe when cycled below  in
in  than when the cycling was restricted to higher values of
  .57 They proposed the following explanation for this result. When graphite is first lithiated (stage IV), every fourth layer is filled before the next layers begin to take up lithium. However, lithiation may be initiated at several different sites on the surface of a graphite grain, and the lithiated layers need not correspond to one another at different nucleation sites. Hence, the expansion of each grain in the first stage of lithiation may represent a large fraction of the expansion of a fully lithiated grain.
Without resorting to a new mathematical model to describe lithiation in graphite, we can adapt the present model to approximate the observed behavior. To do this, we simply alter the PMV of lithiated graphite as a function of SOC (in previous simulations, it was held constant). We assume that 80% of the lattice expansion in graphite occurs linearly over the utilization window  , and that the remaining 20% occurs linearly over the window
  . The volume expansion factor we used previously (8%) was based on the restriction that the maximum acceptable SOC for graphite does not exceed 0.6. The total volume change in graphite between
  values of 0 and 1 is 13.5%.58–60 To reflect this expansion, we use the following function for the lattice parameter of the host material with respect to lithium utilization

where  is the lattice parameter in the undeformed state,
  ,
,  ,
,  ,
,  , and
, and  . Here, γ represents the lattice expansion at small SOC (80%),
  represents the SOC at which the shift in expansion coefficient occurs (0.1), ω represents the overall expansion (13.5%), and
  and
and  are fitting parameters used to create a smooth transition between the two lattice expansion regimes.
As was shown previously,31 the thermodynamically consistent relationship between the lattice parameter and the PMV of lithiated sites is
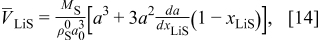
Figure 22 shows the lattice parameter function in Eq. 13 and the corresponding lattice volume compared to the case in which the PMVs of lithiated and delithiated materials are held constant.
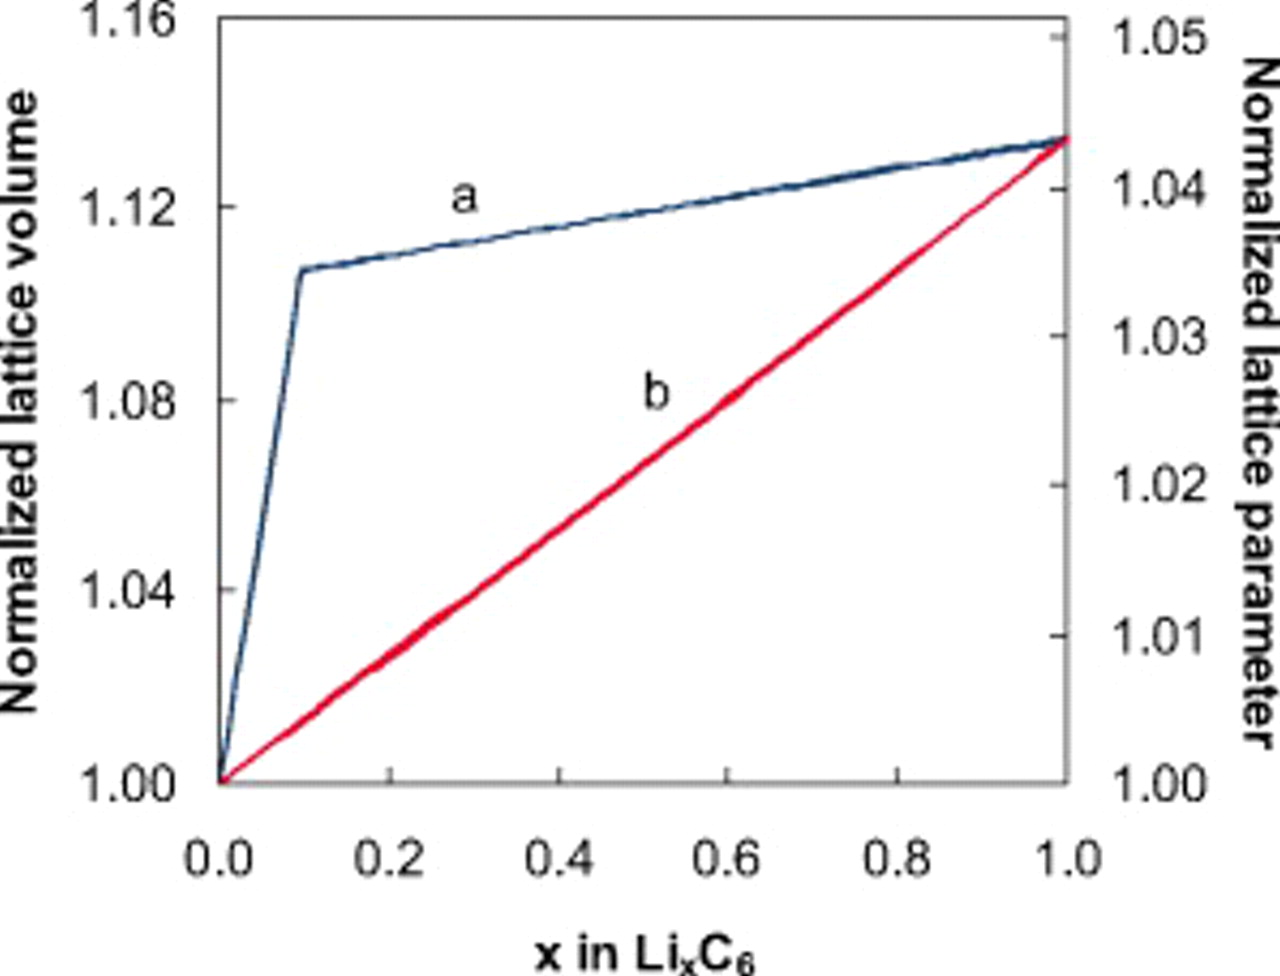
Figure 22. Normalized lattice volume and lattice parameter, as a function of anode utilization, corresponding to (a) variable PMVs according to Eq. 13, 14 and (b) constant PMVs for lithiated and delithiated sites.
Figure 23 compares the 10C discharge results for the two lattice functions for the graphitic anode. The peak stress evolution in the anode (Fig. 23a), as expected, is much different when using a variable PMV in the anode, with higher stresses obtained in regions of rapid change in the lattice parameter. For such an anode material, one might be able to avoid any detrimental decrepitation or disordering by designing the cell such that the cathode is limiting on discharge. Indeed, cells containing layered-oxide cathodes and graphitic anodes often are designed such that the anode is thermodynamically limiting on discharge (i.e., at low rates), while the cathode is kinetically or transport limiting (i.e., at high rates).
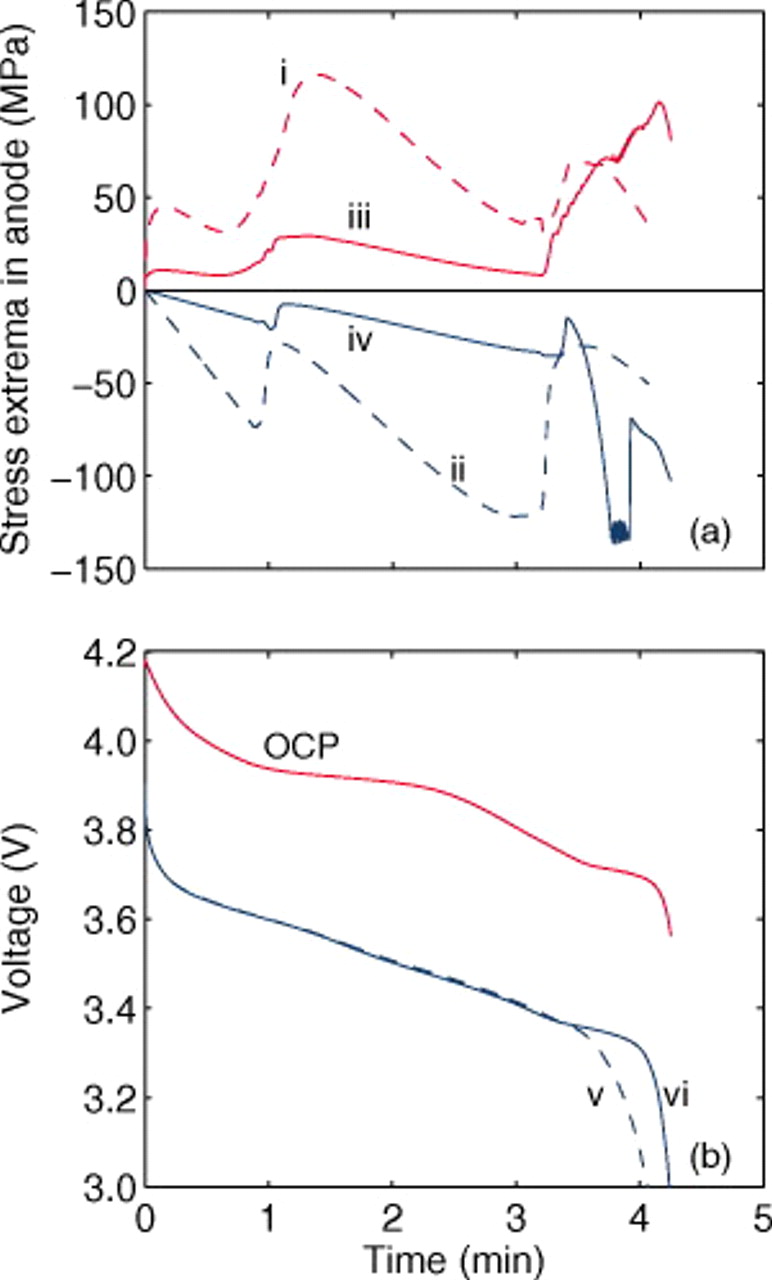
Figure 23. (a) Stress evolution in the anode and (b) voltage response for cells with a constant or variable PMV of lithiated sites in the anode. Equations 13, 14 are used for the variable PMV. (i) Peak surface stress, with constant PMV; (ii) peak internal stress, with constant PMV; (iii) peak surface stress, with variable PMV; (iv) peak internal stress, with variable PMV; (v) 10C discharge voltage, with constant PMV; and (vi) 10C discharge voltage, with variable PMV. Pressure diffusion and variable diffusivity were included in both simulations.
The voltage response (Fig. 23b) shows that, in this case, using a variable PMV can impact the voltage and deliverable capacity via the increased pressure-induced diffusion at low values of  . Despite the difference in PMVs at higher values of
  , these diffusion-related differences are not visible because the mass-transfer limitations kick in only at low
  .
.
Conclusions
A rigorous mathematical model for diffusion-induced stress generation in spherical Li-ion active materials has been incorporated into a full-cell model with porous electrodes. We have shown that in conventional electrode materials (with small volume expansion), pressure diffusion plays a limited role in determining the galvanostatic voltage response but becomes important in determining the stress response, whereas variability in the solid-phase diffusion coefficient can have a significant impact on both the voltage and stress response. Pressure diffusion and nonlinear lattice expansion play an important role in determining both the voltage and stress response in large-volume-expansion materials (e.g., alloys and perhaps graphite at low utilization).
Porous electrode effects, particularly in energy-type cells with thick electrodes, amplify the peak stresses encountered during charge and discharge and may result in nonuniform decrepitation or disordering through the depth of the electrode. Decrepitation may reduce the impedance and increase the effective high rate capacity of a cell if particle fragments maintain good electronic contact and side reactions triggered by the freshly exposed material surface are minimal. Stress evolution in cells with well connected fragments exhibited up to three mechanical response regimes: rapid rise in stress within fragmented particles near the separator, stress increase in larger unfragmented particles once their concentration profiles become fully developed, and stress amplification in unfragmented particles due to the saturation of fragmented particles. If particle fragments become disconnected, continued cycling at the C rate required for fracture (or even lower rates) will likely result in decrepitation of the entire electrode.
Acknowledgments
The author gratefully acknowledges Quinn Horn and Kevin White of Exponent, Inc. for the use of their SEM images of fractured electrodes in Fig. 1. Discussions on numerical techniques with Paul Albertus and John Newman of UC Berkeley, as well as technical discussions with Bosch colleagues Esther Bohn, Thomas Eckl, and Reinhardt Klein, were very much appreciated.
Robert Bosch LLC assisted in meeting the publication costs of this article.
List of Symbols

| lattice parameter, m |

| lattice parameter in the undeformed state, m |

| total concentration, 
|

| concentration of species i, 
|

| C rate, 
|

| specific capacity, mAh/g |

| diffusion coefficient, 
|

| binary interaction parameter, 
|

| dilatational strain; dimensionless elastic modulus |

| elastic modulus, 
|

| Faraday's constant, 96,487 C/mol |

| current density, 
|

| dimensionless current |

| current per particle, A |

| pore-wall flux, 
|

| rate constant, 
|

| electrode or separator thickness, 
|

| molar mass of species i, g/mol |

| molar-mass ratio |

| molar flux of species i, 
|

| pressure, 
|

| external pressure, 
|

| radial coordinate, m |

| gas constant, 8.314 J/mol K |

| film resistance, 
|

| ohmic electrolyte resistance, 
|

| particle radius, m |

| initial particle radius, m |

| time, s |

| cationic transference number |

| temperature, K |

| OCP, V |

| dimensionless OCP |

| cell potential, V |

| PMV of species i, 
|

| mole fraction of species i |

| maximum SOC |
Greek
| α | thermodynamic factor |
| γ | mole-fraction activity coefficient |
| ε | porosity |

| active material volume fraction |

| concentration overpotential, 
|
| κ | ionic conductivity, S/m |
| ν | Poisson's ratio |
| ξ | dimensionless radial position |
| π | dimensionless pressure |
| ρ | density, 
|

| density of pure host material, 
|
| σ | electronic conductivity, S/m |
| ω | fractional expansivity |
Subscripts
| Dualfoil | Dualfoil domain |
| LiS | lithium intercalated host material |
| particle | particle subdomain |
| s | surface |
| S | unoccupied host material |
: Appendix Cell Overpotentials at Low Rates
We start with the assumption that the overpotential is entirely the result of solid-phase limitations at low rate (i.e., concentration and potential gradients in the electrolyte are negligible). In this case, the pore-wall flux is uniform throughout the electrode and, under galvanostatic conditions, is constant over time. The overpotential for each electrode can be computed as the difference between the OCP of the electrode and the OCP at the active material surface lithium concentration

where  is the average concentration of lithium in the electrode solid phase and
  is the surface concentration.
At low rates of charge or discharge, we assume that the concentration profile in the solid phase develops rapidly compared to the time constant for charge/discharge. That is,  , where
  is the C rate. In this case, even if
  is a function of SOC, the rate of change in concentration (and thus
  ) is approximately independent of radius. Neglecting lattice expansion, the diffusion equation for lithium in the solid phase is
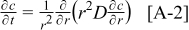
with boundary conditions
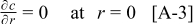
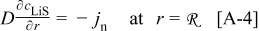
where  (the same as
  in Eq. 1) is the pore-wall flux in the outward normal direction. For spherical particles in a porous electrode with a uniform current density (the prevailing scenario for thin electrodes at low current), the pore-wall flux is related to the current density as follows
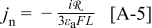
where  is the current density (normalized to the separator area),
  is the volume fraction of active material in the electrode, and
  is the electrode thickness.
We assume the following approximate form for the pseudo-steady-state concentration profile under the conditions described above
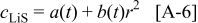
This yields the following solution61
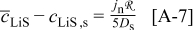
where  is the value of the diffusion coefficient evaluated at
  . The volume-averaged concentration in the particle is computed from the integral
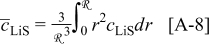
Note that, subject to approximation 6 for  , expression 7 is otherwise valid for a concentration-dependent diffusivity and time-varying pore-wall flux.
To evaluate the overpotential in Eq. 1, we write the Taylor expansion for  at the electrode surface concentration

The concentration overpotential is hence

At sufficiently low rates, we can neglect the second- and higher order terms. Assuming that the variation in the diffusion coefficient stems only from the SOC dependence of the thermodynamic factor (Eq. 4), i.e.

then we obtain for the overpotential
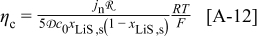
Substitution for  via Eq. 5 yields
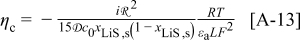
which has a simple inverse quadratic dependence on SOC.
In a cell sandwich with porous electrodes, we must include additional ohmic terms to compute the total cell resistance

where the film resistance in each electrode is  and the ohmic electrolyte resistance in each region (S: separator,
  : cathode, and −: anode) is
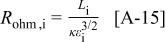
where κ is the electrolyte conductivity and  is the porosity in each region.
Each resistance term is expressed in  referenced to the separator area. One must scale the film resistance terms by the ratio of the electrode surface area to the separator area. We can neglect the kinetic resistance and solid-phase ohmic drops in both electrodes because the exchange current densities and solid-phase conductivities are set to high values. Concentration overpotentials in the electrolyte are also neglected at low current, at which there is negligible variation in the electrolyte concentration.
The ohmic electrolyte resistance in the separator region clearly should be included in the overpotential, but computing the electrolyte resistance in a porous electrode is not straightforward. In a reaction zone model,62 these resistances would increase from zero to some maximum value corresponding to the electrode thickness (or maximum penetration depth); for uniform current distributions, the ohmic drop would correspond to half the electrode thickness. In Fig. 7 we examine two limiting cases: one in which the ohmic drop through the porous electrode is neglected, and one in which it corresponds to the total electrode thickness.
Footnotes
- a
Assuming that the cell is constructed with a fully lithiated cathode
 and delithiated anode , this initial condition corresponds to 8.2% irreversible capacity fade due to solid electrolyte interphase (SEI) formation at the anode. If the cell could be fully discharged (to ), the SOC in the cathode would be 0.935. Even though the anode is thermodynamically limiting on discharge, a lower diffusivity in the cathode could result in mass-transfer limitations that determine the end of discharge.
 - b
In our simulations, we simply set the pore-wall flux,
, in the fractured region to zero, while maintaining distinct porosity values in the two electrodes and separator.


