
Abstract
In this work, photoluminescence properties of  thin-film phosphors were studied in detail.
  thin-film phosphors were prepared by a two-step process: electrodeposition followed by an annealing process. Photoluminescence properties of the
  thin-film phosphors strongly depend on the atomic content of
  . The strongest photoluminescence emission was achieved with the atomic content of
  of 5.02 atom %. The photoluminescence decay behavior of the
  thin-film phosphors was also studied to understand the concentration quenching behavior. Based on the results and calculations, the concentration quenching of
  was caused by the dipole–dipole interaction between
  ions.
ions.
Export citation and abstract BibTeX RIS
Rare-earth (RE)-doped phosphors have been studied for decades since the application of  -doped red phosphors for high pressure mercury lamps and televisions since the 1960s.1 Recently, the development of flat panel displays, field-emission displays, and thin-film electroluminescent devices has quickly made the thin-film phosphor (TFP) an important research topic. Compared with powder phosphors, TFP has advantages of excellent adhesion to substrates, good heat resistance, reduced outgassing, and long-term stability.
Generally, RE TFP can be prepared by methods such as atomic layer deposition (ALD),2, 3 pulsed laser deposition (PLD),4, 5 chemical vapor deposition (CVD),6, 7 sputtering,8–10 sol–gel, and spray pyrolysis.11–13 Up to now, there is no article on the electrodeposition of  TFP. Compared with other methods such as ALD, PLD, and CVD, electrodeposition does not require any expensive high vacuum instruments. Electrodeposition can also achieve a uniform distribution of RE ions in the TFP. In this work,
  TFP was prepared by a two-step process: electrodeposition and postannealing process.
  ions were uniformly distributed in the
  TFP. The photoluminescence (PL) intensity strongly depends on the atomic content of
  . To better understand the quenching mechanism, the PLdecay behavior was studied and analyzed.
Experimental
 and
and  solutions with a concentration of 0.1 M were prepared by dissolving
  and
and  (purity, 99.9%) in deionized water.
  and
and  solutions were mixed together with different volume ratios
 and were used as the precursors for electrodeposition. Deposition was performed in a three-electrode cell. The working electrode was an indium tin oxide coated glass (sheet resistance:
  ), the counter electrode was a platinum foil, and the reference electrode was Ag/AgCl/saturated KCl. Each sample was deposited at
  for 30 min. The applied potential was −1.2 V (vs Ag/AgCl/saturated KCl). After deposition, all the samples were cleaned and then annealed in nitrogen atmosphere at
  for 2 h.
The crystal structures of all the samples were characterized by X-ray diffraction (XRD) by a Thermo ARL X'TRA X-ray powder diffractometer with  radiation (1.54 Å). Surface morphology was characterized by a scanning electron microscope (SEM) with an incident electron energy of 15 kV. The coupled energy-dispersive spectrum (EDS) was used to study the composition and element distribution. PL spectra were taken at room temperature on a Hitachi F-4600 fluorescence spectrophotometer equipped with a 150 W xenon lamp as the excitation source. The wavelength of the excitation radiation was 310 nm.
Results and Discussion
Formation mechanism of the  TFP
TFP

The  TFP was synthesized by a two-step process: formation of
  and
and  followed by an annealing process. As enough negative potential was applied,
  ions around the working electrode in the solution were reduced

The generated  increased the solution pH around the working electrode, which caused the deposition of
  and
and 


The achieved hydroxide films were then annealed in nitrogen atmosphere to achieve the  film.
film.
Structural properties
The structural properties and morphology of the  TFP were characterized by XRD and SEM. The diffraction pattern shown in Fig. 1a indicates that the prepared TFP is composed of polycrystalline
  with a body-centered cubic structure (JCPDS card no. 43-1036). The sharp diffraction peaks indicate that
  TFP has good crystallinity. The inserted SEM image in Fig. 1a shows that
  TFP is not very dense and has a bunched fiberlike surface morphology.
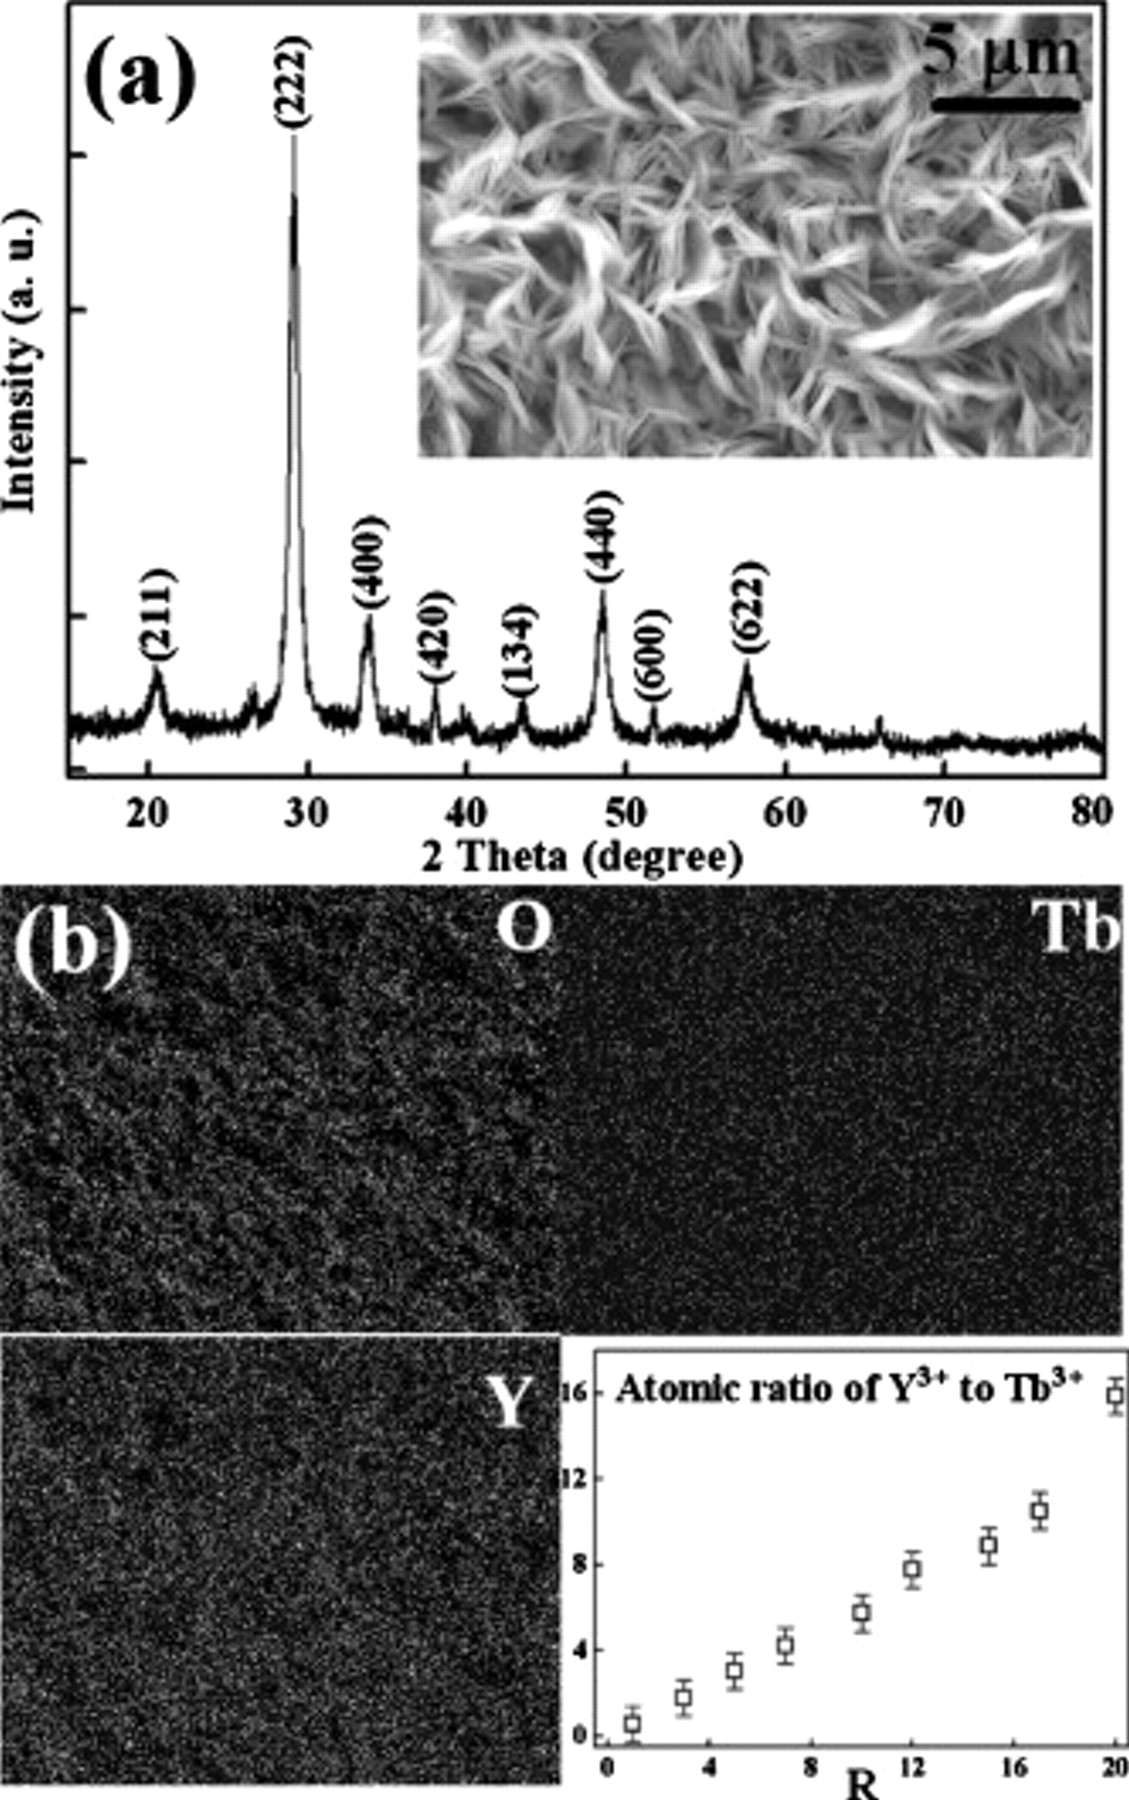
Figure 1. (a) XRD pattern and SEM image of the  TFP with 5.02 atom %
  and (b) EDS mapping of the
  TFP with 5.02 atom %
  and calculated atomic ratio of
  to
to  as a function of
  .
.
The EDS mapping result is shown in Fig. 1b.  is uniformly distributed in the film. The atomic ratio of
  to
to  is calculated from the EDS data and plotted as a function of
  [volume ratio of
  and
and  solutions]. The atomic ratio of
  to
to  increases linearly with
  , which indicates that the doping concentration of
  in the film can be roughly controlled by
  values.
PL properties
All the samples have similar PL characteristics and a typical PL emission spectrum, as shown in Fig. 2a. Three emission peaks at 491.8, 544.5, and 585.6 nm are ascribed to the  ,
,  , and
, and  transitions of
  , respectively. Among these peaks, the green emission at 544.5 nm is the predominant one.
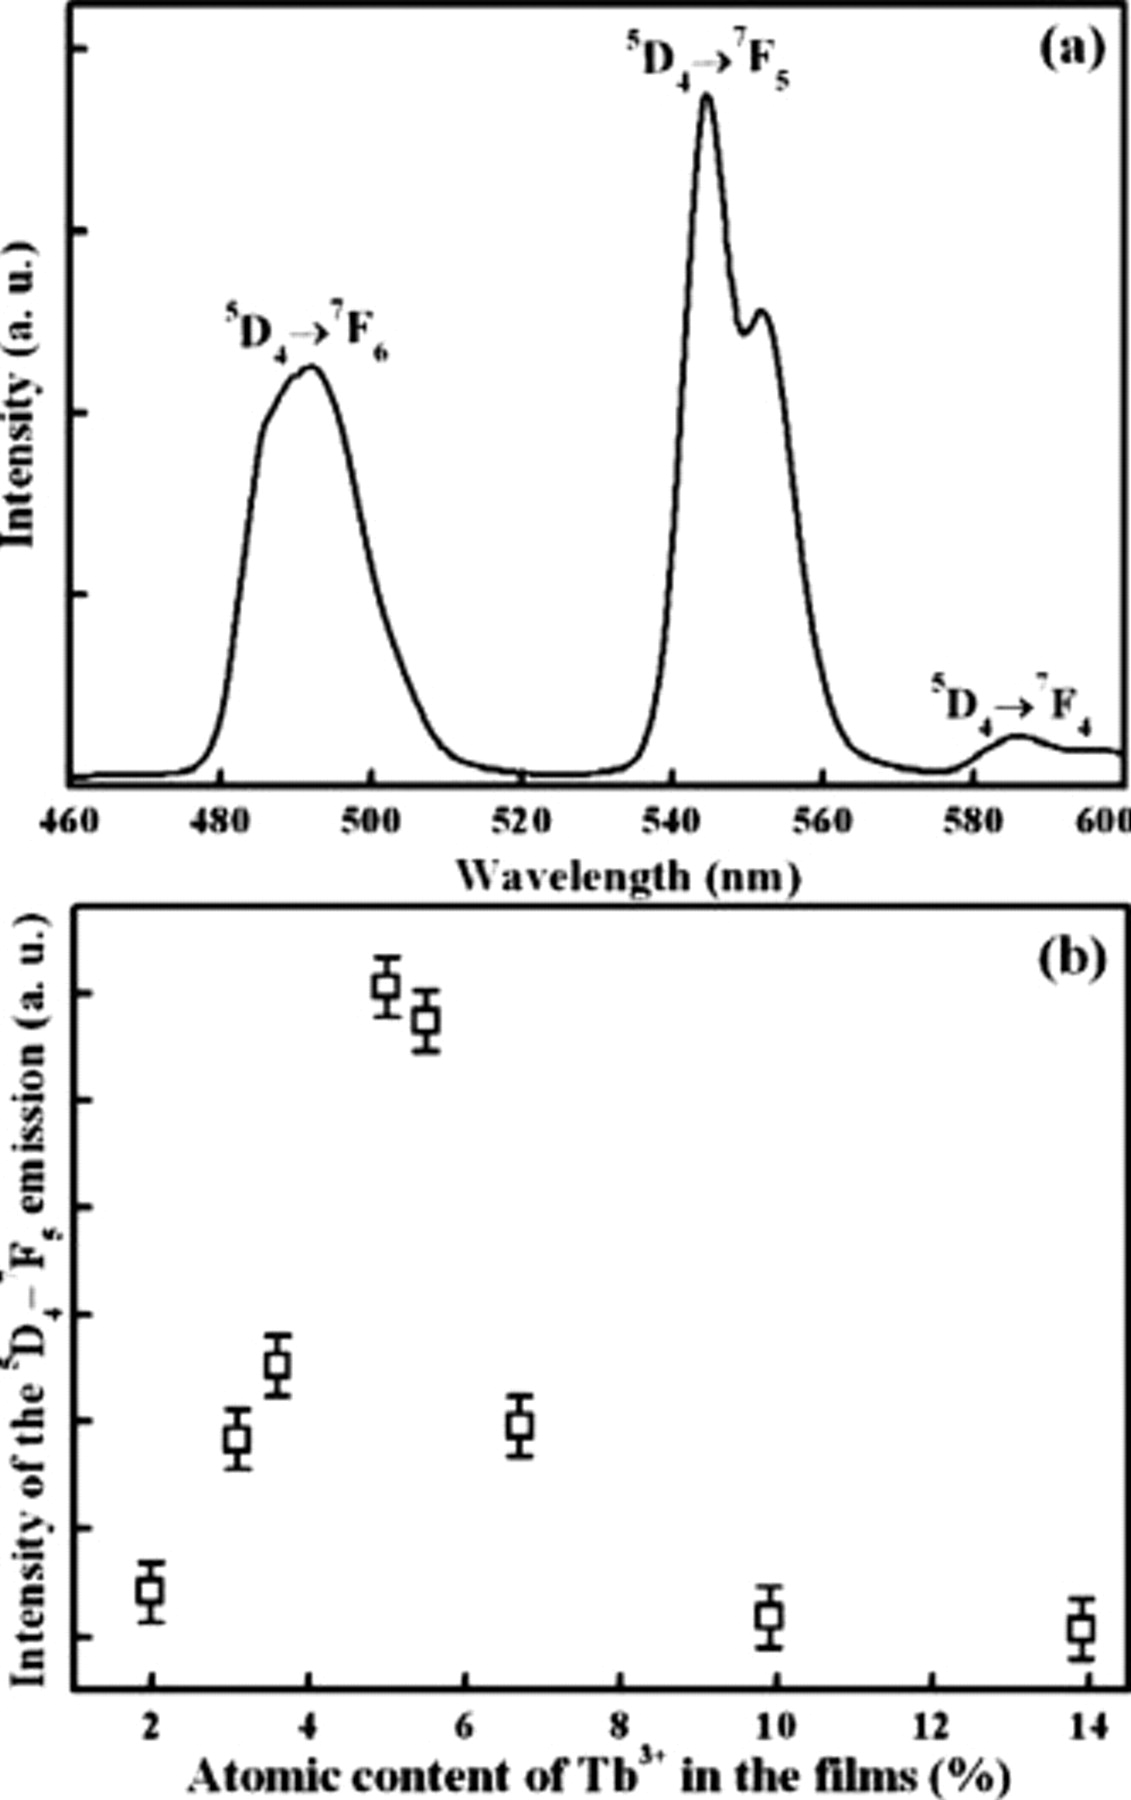
Figure 2. (a) Emission spectrum of the  TFP with 5.02 atom %
  and (b) intensity of the
  transition as a function of the atomic content of
  in the films.
The effect of the  atomic content on the PL properties of the
  TFP was studied. Figure 2b shows the dependence of the
  transition intensity on the atomic content of
  in the film. Clearly, the
  transition intensity reaches a maximum value as the atomic content of
  is around 5.02 atom %. As the atomic content of
  exceeds 5.02 atom %, the
  transition intensity decreases dramatically. Reasons for the concentration quenching behavior of RE-doped materials are generally attributed to the pairing or clustering of RE ions. According to the equation suggested by Blasse14
where  is the critical distance,
  is the volume of the unit cell,
  is the number of
  ions in the unit cell, and
  is the critical concentration. The calculated critical distance is 35.7 Å.
To better understand the quenching mechanism, the PL decay curves of 
 in the
  TFP were characterized, as shown in Fig. 3a. The decay curves cannot be fitted by a single exponential function, and the average lifetime was calculated by the following equation15
In Fig. 3b, the average lifetime is plotted as a function of the atomic content of  . Apparently, the average lifetimes of all the samples are below 3 ms and decrease as the atomic content of
  increases.
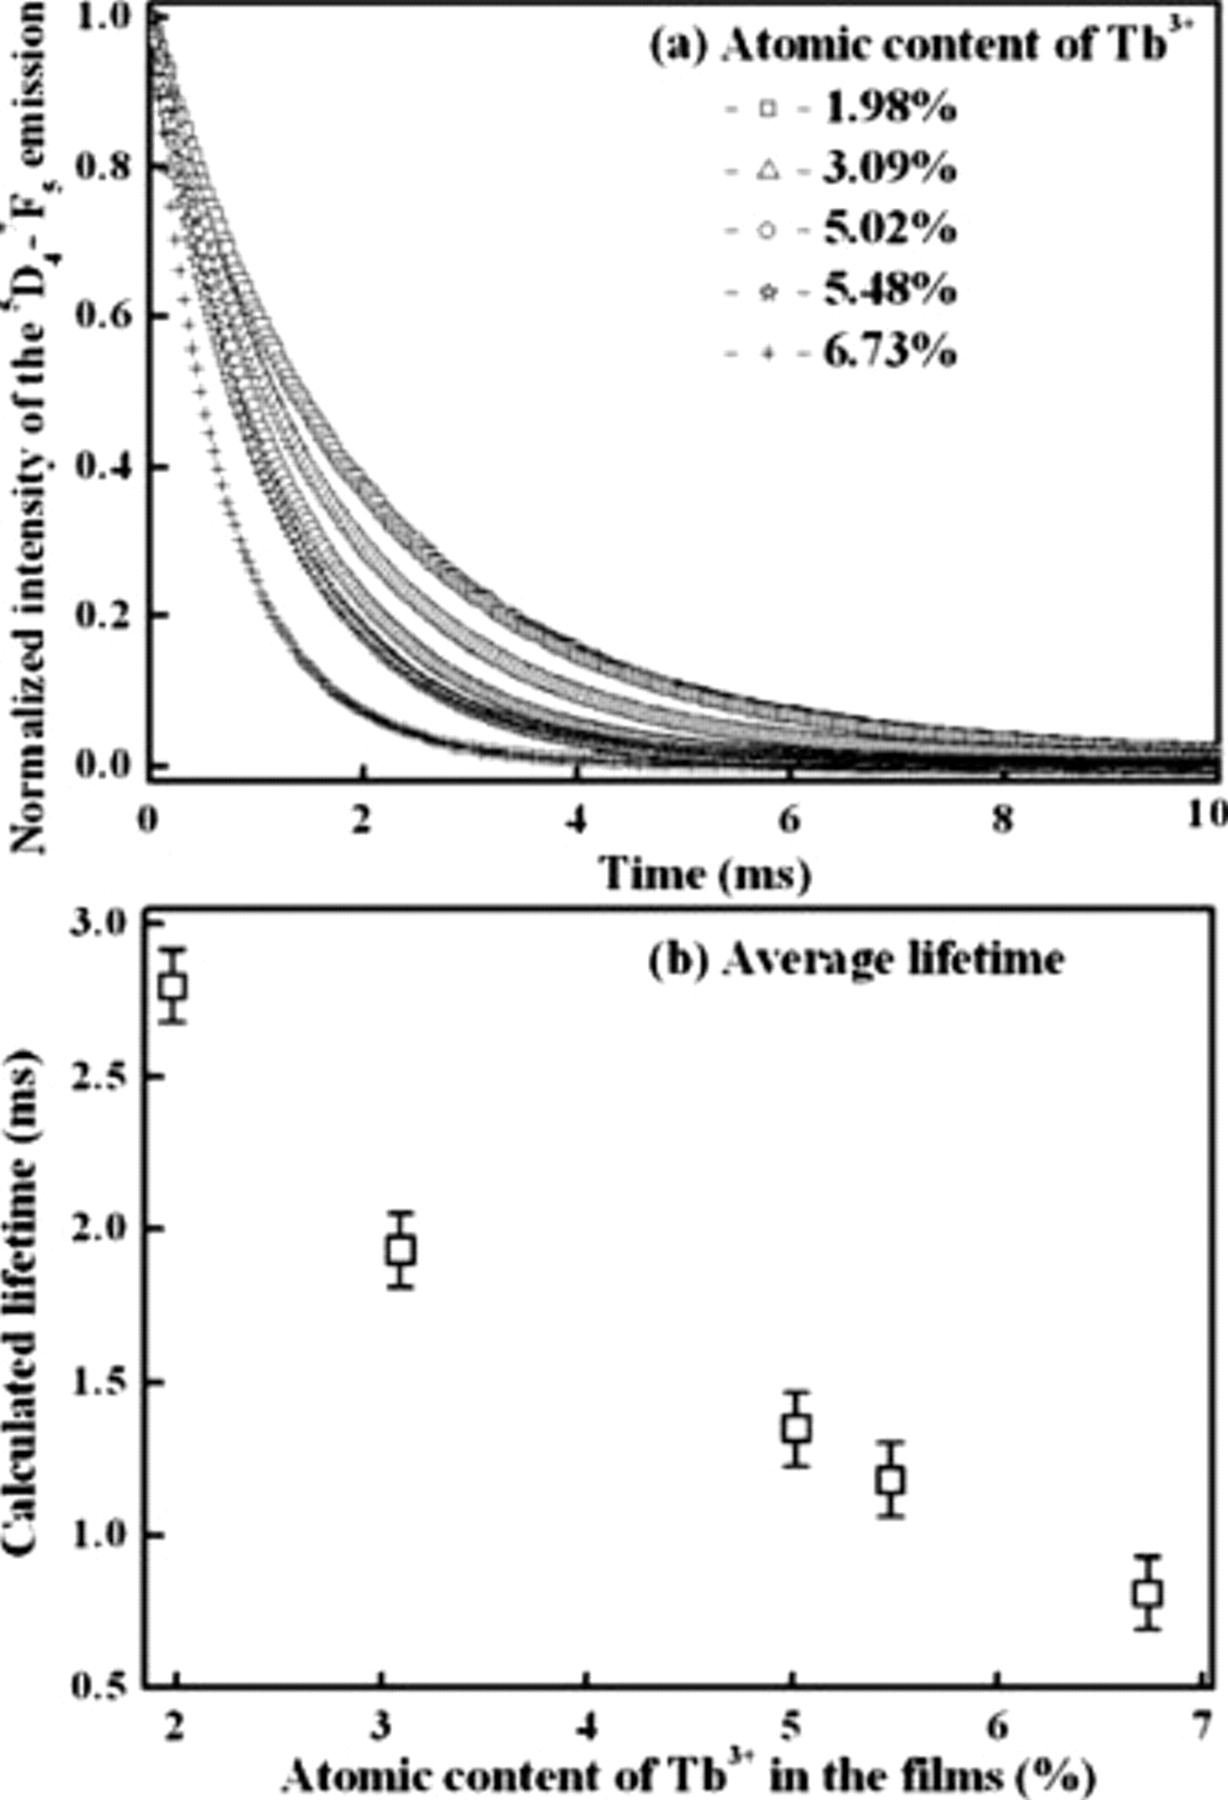
Figure 3. (a) Decay curves of the  transition of the
  TFP. (b) Calculated lifetime as a function of the atomic content of
  in the films.
The deviation from the single exponential behavior may be due to the nonradiative process involving cross-relaxation.15–19 Assuming that this process was caused by the multipolar interaction, decay curves were analyzed by the direct quenching scheme, and the Inokuti and Hirayama equation was used20
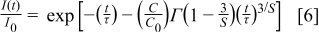
where  is the number of acceptors per unit volume and
  (
( is the critical distance).
  is an indication of the electric multipole character:
  , 8, and 10 for the dipole–dipole, dipole–quadrupole, and quadrupole–quadrupole interactions, respectively. A plot of
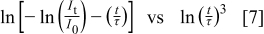
should be a straight line, the slope of which is equal to  . In Fig. 4a, a typical plot achieved from Eq. 7 is shown, and the
  values calculated from the decay curves are shown in Fig. 4b. The
  values of all the
  TFPs are less than 6; therefore, it might be concluded that the concentration quenching of the
  TFP is caused by the dipole–dipole interaction between
  ions.
ions.
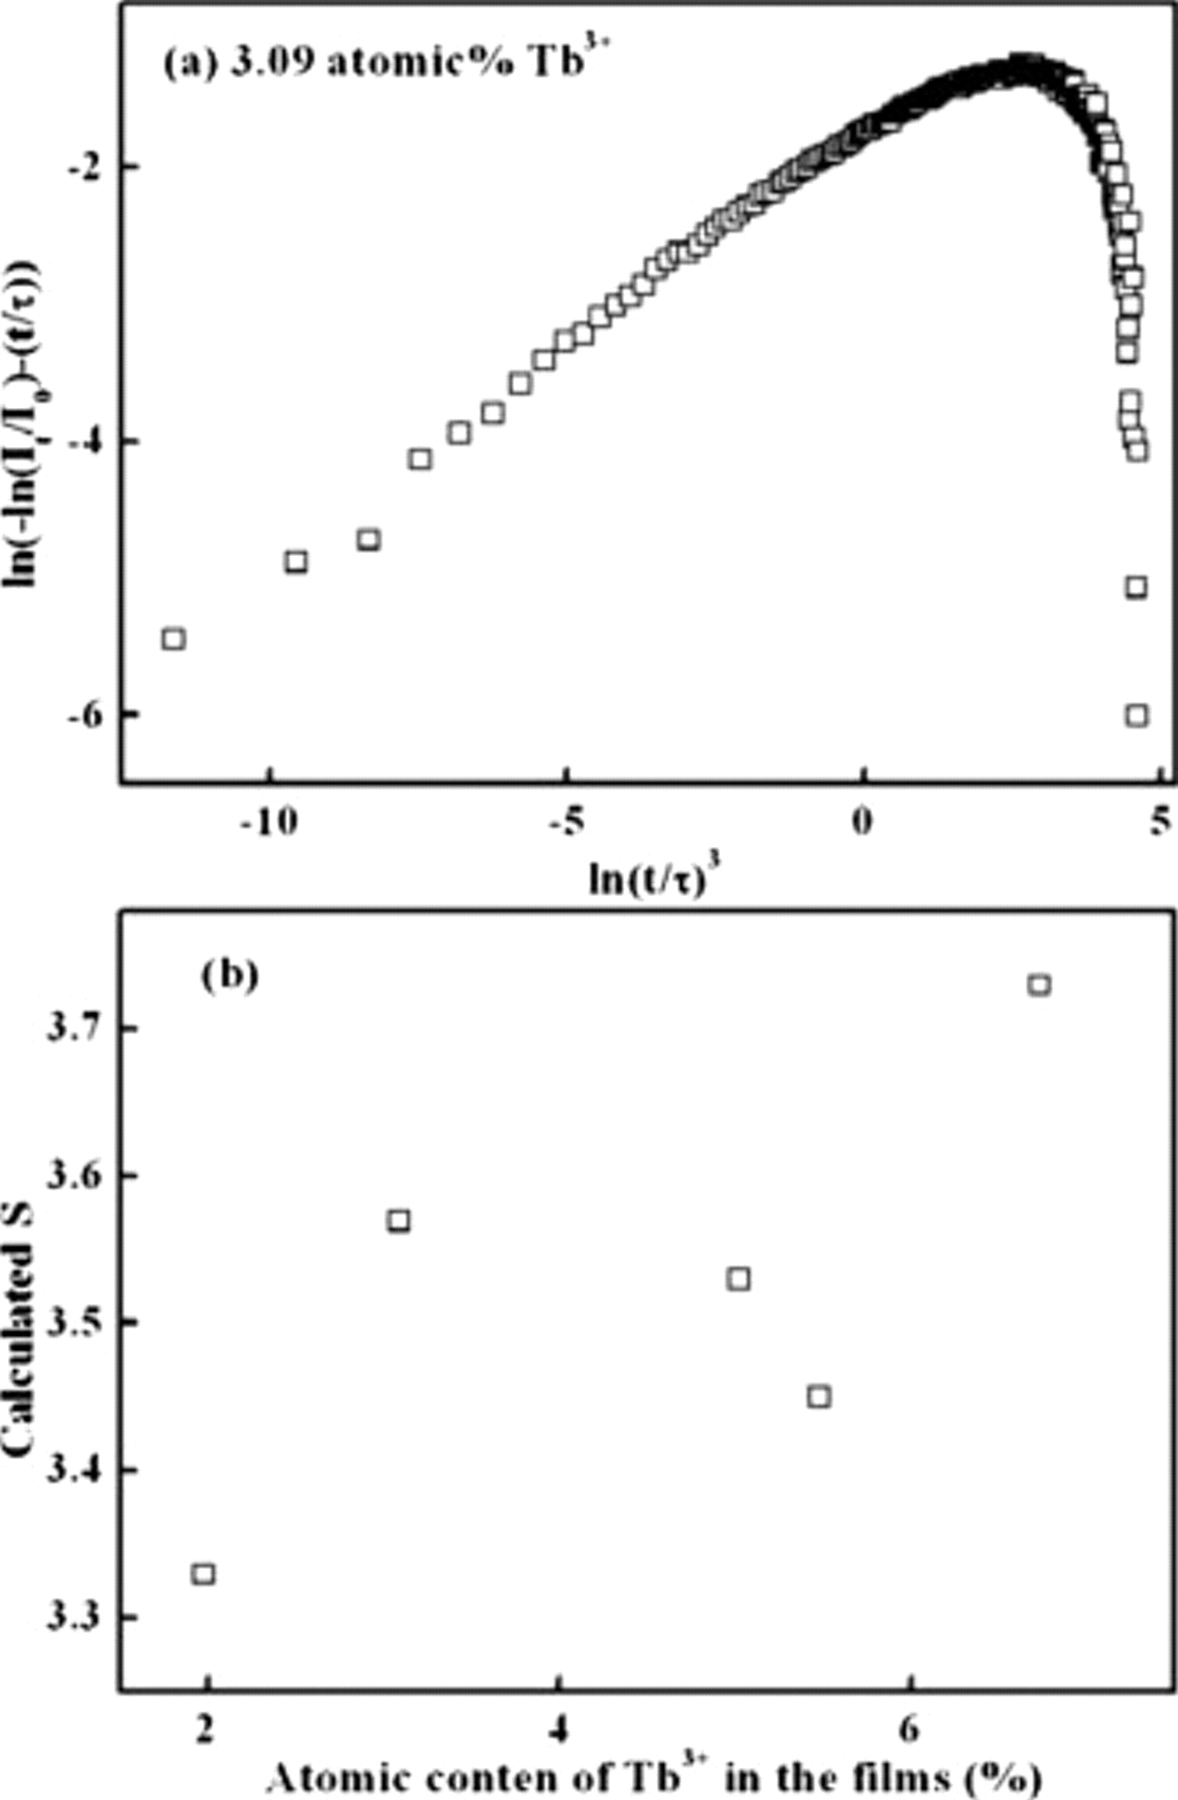
Figure 4. (a) Calculated plot of  vs
vs  for the
  TFP with 3.09 atom %
  . (b) Calculated
  as a function of the atomic content of
  in the films.
Back to Eq. 6, the  values can be calculated. According to the relation
  ,
,  can be easily achieved. The calculated value is around 27.8 Å, which deviates a little from the critical distance value obtained from Eq. 4. The deviation indicates that there might be other mechanisms besides the dipole–dipole interaction between
  ions, which causes the concentration quenching of the
  TFP.
TFP.
Conclusions
 TFP prepared by electrodeposition shows a dominant green emission at a wavelength of 544.5 nm with high brightness. Electrodeposition provides a uniform distribution of
  and simple control over the
  atomic content in the TFP. The PL intensity of
  TFP depends greatly on the
  atomic content with the a critical concentration of 5.02 atom % of
  . The quenching mechanism was studied by analyzing the PL decay behavior. The dipole–dipole interaction of
  is the major reason for the concentration quenching.
Acknowledgments
This work is supported by the National Science Foundation of China under grant 60906031 , the Zhejiang Provincial Natural Science Foundation of China under grant Y1090742 , the Qianjiang Talent Programme of Zhejiang province under grant 2009R10018 , the Preferred Foundation for the Overseas Chinese Scholars (Zhejiang Provincial Personnel Department), and the Science Foundation of Zhejiang Sci-Tech University under grant 111383A4Y07050 .
Zhejiang Sci-Tech University assisted in meeting the publication costs of this article.