
Abstract
The role of Mo alloying in the pit initiation process at MnS inclusions in stainless steels was investigated by measuring polarization curves, depassivation pH, and scanning electron microscopy. Molybdenum existed in the steel matrix but was not detected in the MnS inclusions in Type 316 stainless steel. While Mo alloying did not inhibit the dissolution of the MnS inclusions in a NaCl solution, neither a metastable nor a stable pit occurred in the small areas with the MnS inclusions in the Mo-added specimen. The MnS/steel matrix boundary preferentially dissolved in the Mo-free specimen, with deep trenches formed. However, no deep trench was observed in the Mo-added specimen at low potentials. The depassivation pH of the Mo-added specimen in a 0.1 M NaCl-1 mM Na2S2O3 solution was lower than that of the Mo-free specimen, suggesting that Mo alloying prevents the depassivation of the steel matrix at the boundary and inhibits the formation of trenches. In a 1 M HCl-1 mM Na2S2O3 solution, the active dissolution rate of the steel was suppressed by Mo alloying. This suggests that, even after trenching at high potentials, Mo alloying inhibits the initiation of pitting inside the trenches.
Export citation and abstract BibTeX RIS

This is an open access article distributed under the terms of the Creative Commons Attribution 4.0 License (CC BY, http://creativecommons.org/licenses/by/4.0/), which permits unrestricted reuse of the work in any medium, provided the original work is properly cited.
Alloying with a few percent of molybdenum is one of the most well-known ways to improve the pitting corrosion resistance of stainless steels.1 Considerable research has been carried out to understand the beneficial role of the Mo addition, and several mechanisms for the inhibitory role played by Mo in pitting corrosion have been proposed. It has been suggested that the presence of Mo in passive films inhibits film breakdown and promotes the repair of the passive films.2 It has also been proposed that dissolved Mo species reduce the active dissolution rate of bare stainless steel surfaces in highly acidic environments inside the pits.3–8 While the role of Mo in passive films and the active dissolution of stainless steels has been intensively studied, the beneficial effect of Mo on the inhibition of pitting at MnS inclusions has not been systematically investigated. The pit initiation sites for commercial stainless steels have been attributed to sulfide inclusions, such as MnS.9 Thus, a deeper understanding of the effect of Mo on the pit initiation process at MnS inclusions is required.
Pit initiation at MnS inclusions in Mo-free stainless steels has been investigated in a large number of articles, and the anodic dissolution of the inclusions is recognized as the initial step of the pit initiation process.10–14 The dissolution of MnS inclusions produces S species, such as thiosulfate ions, and exposes the bare surface of the steel matrix, resulting in high pitting susceptibility near the inclusions. However, the role of Mo alloying in the dissolution process of MnS inclusions remains unclear. In addition, recent research has demonstrated that trenching at the boundaries between the MnS inclusions and the steel matrix is one of the important steps in the pit initiation process.13–16 Chiba et al. reported that the MnS/steel matrix boundaries preferentially dissolve and that trenches are formed during anodic polarization of a type 304 stainless steel in NaCl solutions.13 They attributed this preferential dissolution at the boundaries to a synergistic effect of chloride ions and dissolution products from the MnS inclusions and proposed that the occurrence of pitting is actually the local active dissolution of the steel matrix inside the trench.15 Lillard et al. and Mehrazi et al. investigated the effect of minor alloying elements on pit initiation at MnS inclusions.14,16 They suggested that Cu ions are released from the steel matrix inside the trench and that the ennoblement of the inclusions by Cu deposition accelerates pit propagation. In general, Mo alloying has been demonstrated to reduce the incidence of pit nucleation events.17-19 It is therefore predicted that the addition of Mo to the steels affects either or both the dissolution and trenching of MnS inclusions.
The objective of this study is to clarify the role of Mo alloying in the pit initiation process at MnS inclusions in stainless steels. The microscale polarization of small surface areas of stainless steels with MnS inclusions was measured in NaCl and Na2SO4 solutions to characterize the dissolution and pit initiation behavior of the inclusions in Mo-free and Mo-added specimens. The corrosion morphology of the inclusions and the steel matrix around the inclusions in the early stage of the pit initiation process was observed. The potential-pH diagram for the Mo-H2O system was calculated to determine the kind of Mo species likely to dissolve from the steel matrix. The role of Mo addition in the pit initiation process at MnS inclusions was investigated in terms of dissolved Mo species and the depassivation pH of the steel matrix. Finally, the relationship between the pitting corrosion resistance and the effect of Mo addition on the pit initiation process was considered.
Experimental
Specimens and electrolytes
Four types of stainless steels were prepared by vacuum induction melting (50 kg ingot) and then hot-rolled. The chemical compositions of the steels are listed in Table I. Sulfur was added to steel A and steel B to form MnS inclusions. Molybdenum was added to steel B and steel D. The sulfur concentration in steel C and steel D was reduced to levels less than 0.001 mass% to prevent the formation of sulfide inclusions. Steel C and steel D were used to simulate the steel matrix surrounding the MnS inclusions in the Mo-free and Mo-added steels, respectively. To reduce the amount of the delta-ferrite phase in the steels, the steels were heat-treated at 1273 K for 96 h, hot-rolled at 1473 K from 20 mm down to ca. 12 mm in thickness, and finally reheated at 1273 K for 96 h.20,21 Afterward, the steels were solution-treated at 1323 K for 0.5 h. After heat-treatment, the steels were cut into specimens with dimensions of 15 mm × 25 mm × 5 mm. The specimens were ground with a series of SiC papers up to 1500 grit and then polished by a diamond paste down to 1 μm. The specimens were finally rinsed with ethanol.
Table I. Chemical composition of the specimens (mass%).
| Steel | C | Si | Mn | P | S | Ni | Cr | Mo | Cu | Al | Ti | N | O |
|---|---|---|---|---|---|---|---|---|---|---|---|---|---|
| A | 0.010 | 0.59 | 0.78 | 0.019 | 0.030 | 9.9 | 18.0 | <0.01 | 0.02 | <0.001 | 0.002 | 0.0083 | 0.007 |
| B | 0.010 | 0.61 | 0.78 | 0.020 | 0.030 | 10.1 | 18.1 | 2.31 | 0.01 | <0.001 | 0.002 | 0.0063 | 0.008 |
| C | 0.011 | 0.59 | 0.78 | 0.019 | <0.001 | 10.1 | 18.1 | <0.01 | 0.01 | 0.001 | 0.002 | 0.0059 | 0.009 |
| D | 0.011 | 0.58 | 0.78 | 0.019 | <0.001 | 10.0 | 18.1 | 2.27 | 0.01 | <0.001 | 0.002 | 0.0075 | 0.011 |
Polarization measurements were performed in 0.1 M NaCl, 0.1 M Na2SO4, 0.1 M NaCl-0.01 M Na2MoO4, and 1 M HCl-1 mM Na2S2O3 solutions. The pH of the 0.1 M NaCl, 0.1 M Na2SO4, and 0.1 M NaCl-0.01 M Na2MoO4 was 5.5, 5.8, and 6.4, respectively. All solutions were prepared from deionized water and analytical grade chemicals.
Macroscale anodic polarization
Potentiodynamic anodic polarization was carried out at 298 K under naturally aerated conditions. The electrode area was ca. 10 mm × 10 mm. All the potentials reported in this study refer to the Ag/AgCl (3.33 M KCl) electrode (0.206 V vs. standard hydrogen electrode at 298 K). The potential scan rate was 3.8 × 10⁻⁴ V s−1 (23 mV min−1).
Microscale anodic polarization
A microscale electrode was used for the analysis of the pit initiation process at the MnS inclusions. A silicone sealant (Shin-Etsu KE 45 RTV) was spread on the specimen surface to make an electrode area of ca. 100 μm × 100 μm containing a single MnS inclusion. The sealant was cured for 24 h. Potentiodynamic anodic polarization was carried out at an ambient temperature of ca. 298 K under naturally aerated conditions. An acrylic cell was placed on the masked specimen to preserve the solutions. A small Ag/AgCl reference electrode and a Pt wire counter electrode were fixed to the acrylic cell. The details of the electrochemical setup have been published elsewhere.13 The small Ag/AgCl reference electrode was calibrated with a Ag/AgCl (3.33 M KCl) electrode before the measurements. The potential scan rate was 3.8 × 10⁻⁴ V s−1 (23 mV min−1), which was the same as that of the macroscale polarization. A battery-powered potentiostat12 was used for the microscale polarization to reduce electrical noise.
Measurement of depassivation pH
The open circuit potentials of steel C and steel D were measured in the 0.1 M NaCl-1 mM Na2S2O3 solution to analyze the depassivation pH of the steels. In the measurements, HCl was added for the stepwise lowering of the pH, and the open circuit potential was monitored at each pH for 600 s. The electrode area was ca. 10 mm × 10 mm. The measurements were performed at an ambient temperature of ca. 298 K under naturally aerated conditions.
Surface observation of specimens
An optical microscope and a field emission scanning electron microscope (FE-SEM) equipped with an energy-dispersive X-ray spectroscopy (EDS) system were used to capture images of the specimen surfaces before and after polarization. The secondary electron images were taken at accelerating voltages of 5 and 20 kV, and the EDS maps were taken at 20 kV. The chemical compositions of the inclusions were characterized by a field emission electron probe micro analyzer (FE-EPMA). The EPMA maps were taken at an accelerating voltage of 10 kV and a current of 0.15 μA, and quantitative analysis was conducted at an accelerating voltage of 15 kV and a current of 2.5 × 10⁻² μA.
Results and Discussion
Characterization of specimens
The morphology and chemical composition of the non-metallic inclusions were characterized. Figure 1shows the optical micrographs of the as-polished surfaces of steel A (the Mo-free specimen) and steel B (the Mo-added specimen). The small black and gray spots indicate the inclusions. Most were less than 5 μm in diameter; however, some inclusions were elongated and found to be 20–30 μm in length and 1–5 μm in width. Since the inclusions are darker in color under an optical microscope compared to the steel matrix, they can clearly be discerned in the as-polished condition without etching. Figure 2 shows the backscattered electron (BSE) images and EPMA maps of the inclusions. Table II shows the results of the quantitative analysis at points 1 and 2 in Fig. 2. In Fig. 2a, the inclusion enriched in Mn and S was present in steel A. The relative atomic percentage of Mn:S:Cr:O at point 1 was 45:50:5:<1, indicating the formation of typical sulfide inclusions composed of Mn, S, and a small amount of Cr (approximately 5 at.%). In the BSE image, small black spots were observed in the inclusion. They were determined to be Ti-oxides by the EPMA mapping. As seen in Fig. 2b, the enrichments of Mn and S were also observed in the inclusion of steel B. The relative atomic percentage of Mn:S:Cr:O:Mo at point 2 was 45:50:5:<1:<1. As indicated in Fig. 2b, Mo certainly existed in the steel matrix but was not detected in the inclusion. There was little or no difference in the chemical compositions of the inclusions in steel A and steel B. The inclusions investigated in this paper are simply referred to as MnS. In the microscale polarization measurements, the relatively large and elongated MnS inclusions were chosen for examination because their electrochemical dissolution behavior appears clearly on the microscale polarization curves. Additionally, the large inclusions were expected to provide a better visual understanding of the corrosion morphology.
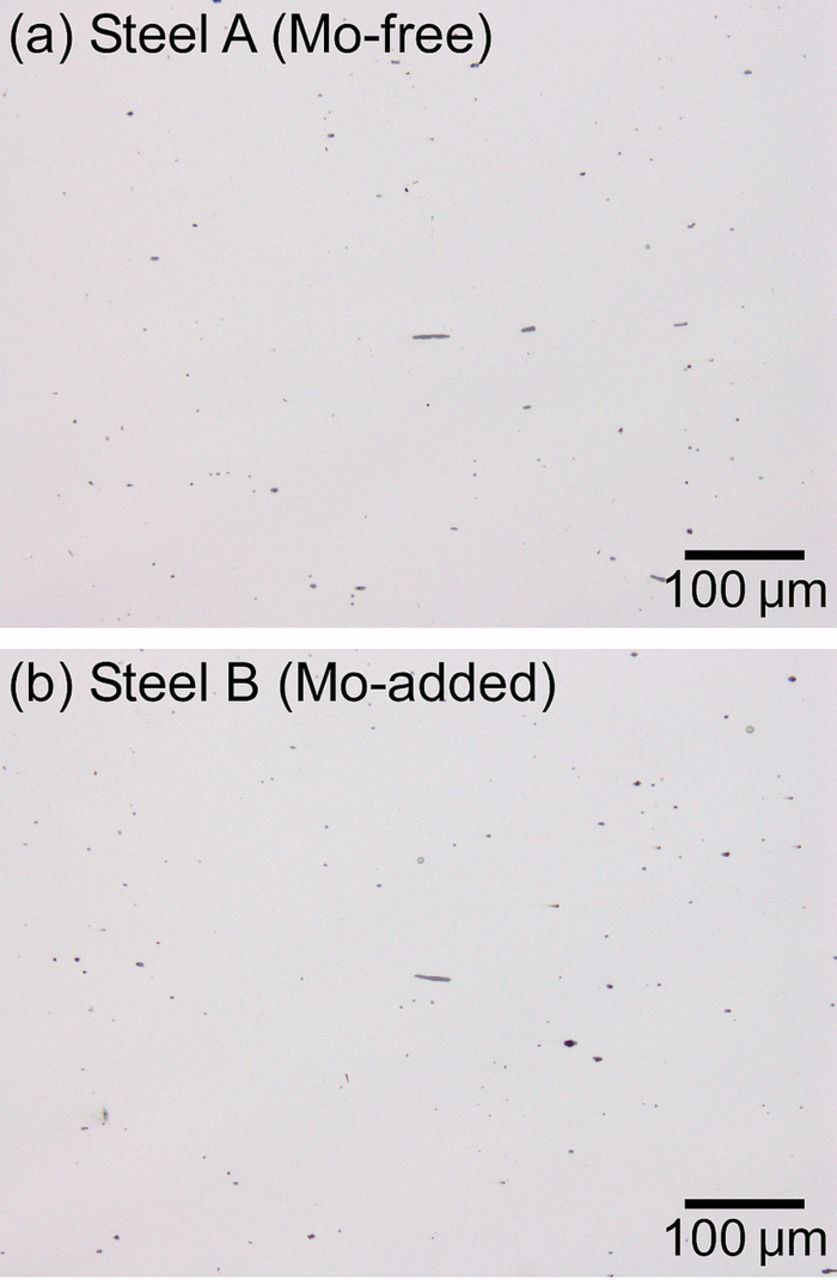
Figure 1. Optical micrographs of as-polished specimen surfaces: (a) steel A and (b) steel B.
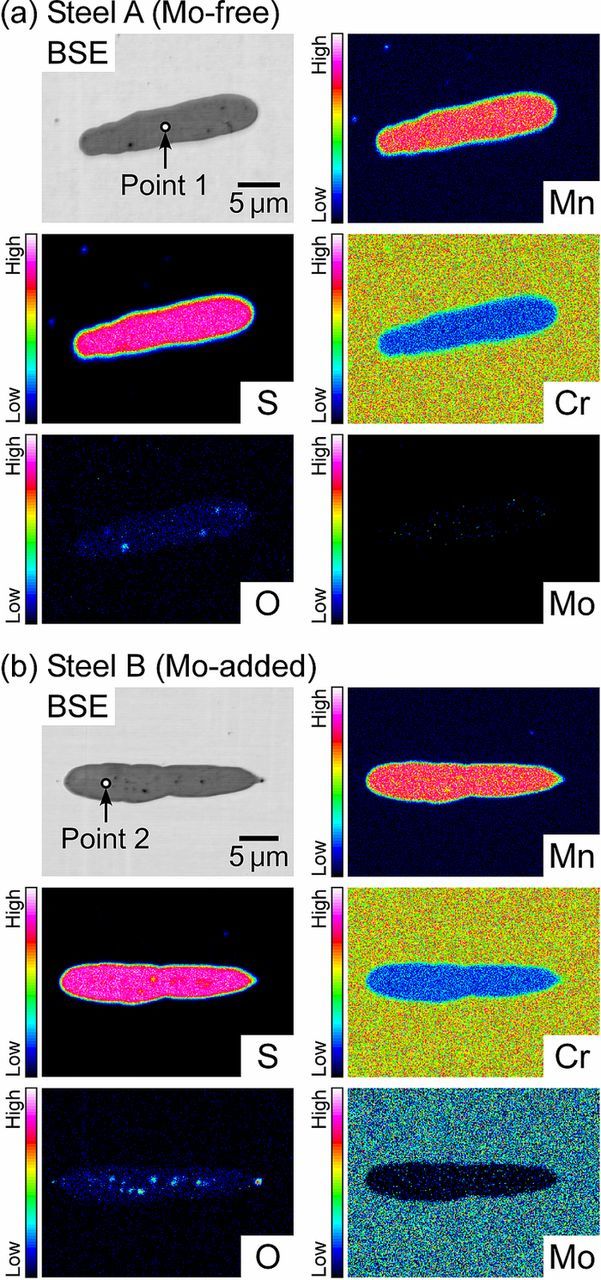
Figure 2. Compositional images in backscattered electron (BSE) mode and EPMA maps of the inclusions: (a) steel A and (b) steel B.
Table II. Relative composition (at.%) at point 1 and point 2 shown in Fig. 2.
| Point | Mn | S | Cr | O | Mo | Ti | Fe | Ni |
|---|---|---|---|---|---|---|---|---|
| 1 | 44.0 | 49.5 | 4.5 | 0.0 | 0.2 | 0.5 | 1.2 | 0.1 |
| 2 | 44.0 | 49.1 | 4.8 | 0.0 | 0.3 | 0.3 | 1.3 | 0.1 |
Macroscale anodic polarization was conducted to confirm the pitting potentials of steel A and steel B. Figure 3 shows the polarization curves of steel A and steel B measured in the 0.1 M NaCl solution. The potentiodynamic polarization was started at −0.2 V. A cathodic current flowed at first, and then an anodic current was measured above approximately −0.05 V. In steel A, metastable pitting events were observed, and then a stable pit occurred at 0.34 V. In steel B, fewer metastable pitting events appeared to occur than in steel A. As expected, Mo addition into the steel inhibited metastable pitting. A small increase in the current density was observed above 0.34 V. This increase was thought to be attributed to the dissolution of the MnS inclusions. The specimen surface was observed using FE-SEM after polarization, and it was confirmed that many MnS inclusions partially dissolved. It is known that MnS inclusions dissolve in the potential range of ca. 0.2 to 0.5 V.10,11,22 Since steel A and steel B were resulfurized and contained many MnS inclusions, the dissolution current of the MnS inclusions is likely to appear even on the macroscale polarization curve. At 0.42 V, a stable pit occurred on steel B. Figures 3b and 3c show the optical micrographs of the electrode surfaces after polarization. Pits with lace-like covers were initiated in both specimens. Figure 3d shows the SEM image and the EDS maps of the pit in steel B. There were the enrichments of Mn and S at the center of the pit, indicating that the MnS inclusion was the initiation site of pitting.
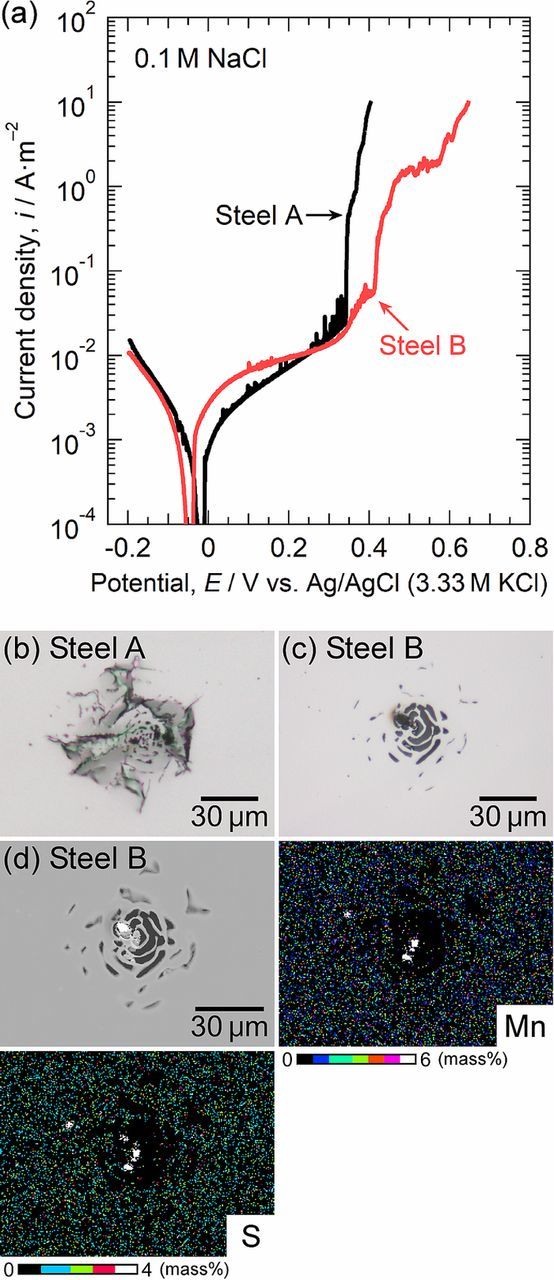
Figure 3. (a) Macroscale polarization curves of steel A and steel B measured in 0.1 M NaCl at 298 K. Optical micrographs of the specimen surfaces after polarization: (b) steel A and (c) steel B. (d) SEM image and EDS maps of the surface of steel B after polarization.
Polarization behavior of MnS inclusions in the Mo-free specimen
Microscale anodic polarization was carried out to characterize the dissolution and the pit initiation behavior at the MnS inclusions in steel A (the Mo-free specimen). Figure 4a shows the polarization curves of a small area with the MnS inclusion in steel A measured in 0.1 M NaCl and 0.1 M Na2SO4. Potentiodynamic polarization was started at −0.2 V. Anodic currents were measured above approximately −0.03 V. In 0.1 M Na2SO4, the current density gradually increased with the electrode potential and then decreased to 1 × 10⁻² A m−2, corresponding to the passive current density of stainless steels, at approximately 0.5 V. The current increase from ca. 0.1 to 0.5 V was supposed to be mainly due to the anodic dissolution of the MnS inclusion.10,11,22 To confirm this speculation, the charge passed owing to the MnS dissolution and the depth of dissolved MnS were calculated by the following expression:

where d is the average depth of dissolved MnS (μm), q is the charge passed by MnS dissolution (C), n is the number of electrons involved in the MnS dissolution reaction, F is the Faraday constant (C mol−1), M is the molar mass of MnS (g mol−1), D is the density of MnS (g cm−3), and S is the surface area of MnS (μm2). The charge passed owing to MnS dissolution, q, was calculated after subtracting the current on the steel matrix from the total current. The current on the steel matrix was estimated by the dashed line in Fig. 4a. Four electrons are involved in the MnS dissolution reaction:23–26
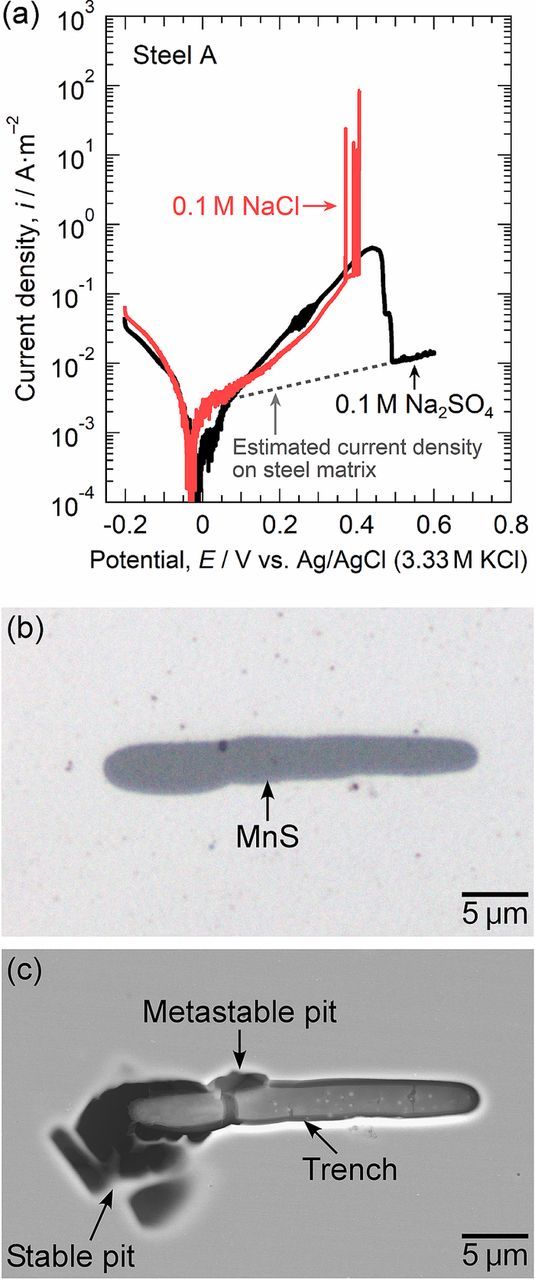
Figure 4. (a) Microscale polarization curves of a small area with the MnS inclusion in steel A measured in 0.1 M NaCl and 0.1 M Na2SO4 at 298 K. (b) Optical micrograph of the inclusion before polarization in 0.1 M NaCl. (c) SEM image of the inclusion after polarization in 0.1 M NaCl.
The molar mass and the density of MnS were 87.003 g mol−1 and 4.0 g cm−3, respectively.27 The surface area of the MnS inclusion was 117.41 μm2. The charge passed by MnS dissolution was 1.73 μC. The average depth of the dissolved MnS inclusion during polarization in 0.1 M Na2SO4 was calculated to be 0.83 μm. Before polarization, the size of the MnS inclusion was 26 μm in length and 4.5 μm in width, so that the depth of the inclusion was speculated to be more than 0.83 μm. Therefore, it is reasonable to consider that the current increase from ca. 0.1 to 0.5 V was attributed to the anodic dissolution of the MnS inclusion.
In 0.1 M NaCl, a gradual increase in anodic current density was also observed. Current spikes above 0.37 V are indicative of pit initiation. The continued increase in the current density at 0.41 V was attributed to the initiation of a stable pit. It is confirmed that the pits were initiated in the dissolution potential range of the MnS inclusions. Figure 4b shows the optical micrograph of the MnS inclusion before polarization, and Figure 4c provides the SEM image after polarization in 0.1 M NaCl. As shown in Fig. 4c, the metastable and stable pits were generated at the boundary between the MnS inclusion and the steel matrix. The inclusion surface dissolved slightly, and a trench was formed at the MnS/steel matrix boundary. Many researchers have reported the formation of trenches between MnS inclusions and steel matrix.10,13,14,23,28 Trenching at the boundaries is likely to trigger pit initiation at the inclusions. While the partial dissolution of the MnS inclusion was observed, a large part of the inclusion remained. Some inclusions did not completely dissolve even after the pit growth, as seen in Fig. 3d. MnS is thermodynamically unstable in acidic environments on the basis of the potential-pH diagram for Mn-S-MnS-H2O system.15 Shimahashi et al. reported that the composition of (Mn,Cr)S changes to CrS under anodic polarization, and oxide films were developed on CrS.29 The surface oxide films were likely to inhibit rapid dissolution of the inclusions. Lillard et al. reported that MnS inclusions are passivated by Cu deposition during pit propagation.14
Polarization behavior of MnS inclusions in the Mo-added specimen
Figure 5a shows the polarization curve of a small area with the MnS inclusion in steel B (the Mo-added specimen) measured in 0.1 M Na2SO4. The optical micrograph of the MnS inclusion before polarization is presented in Fig. 5b, and Fig. 5c provides the SEM image after polarization. In Fig. 5a, the polarization curve of the small area with the MnS inclusion in steel A, which is shown in Fig. 4a, is given as a reference (the black curve). The anodic current density increased above ca. 0.1 V and decreased to the level of the passive current density of the steel matrix at ca. 0.55 V, indicating that the dissolution of the MnS inclusion occurred in this potential range. As seen in Fig. 5c, the MnS inclusion partially dissolved. This suggests that the Mo addition into the steel did not inhibit the dissolution of the MnS inclusion. The dissolution current of the MnS inclusion in steel B was higher than that of the inclusion in steel A. This may be related to the difference in the size of each MnS inclusion examined in the measurements. The surface area of the MnS inclusion was 154.94 μm2. The charge passed by MnS dissolution was 3.17 μC. The average depth of the dissolved MnS inclusion during polarization was calculated to be 1.15 μm. In Fig. 5a, the difference in the polarization curves near the corrosion potential is remarkable. However, we consider that the microscale polarization curves in this paper have a wide range of error near the corrosion potential. The corrosion potential of steel B in NaCl and Na2SO4 solutions varied from −0.13 to −0.03 V in this paper. The exact reason is unclear, but an air-formed oxide film was maybe related to these differences in the polarization curves. Polarization in 0.1 M Na2SO4 was performed independently twice, and almost the same dissolution behavior was observed in both cases.
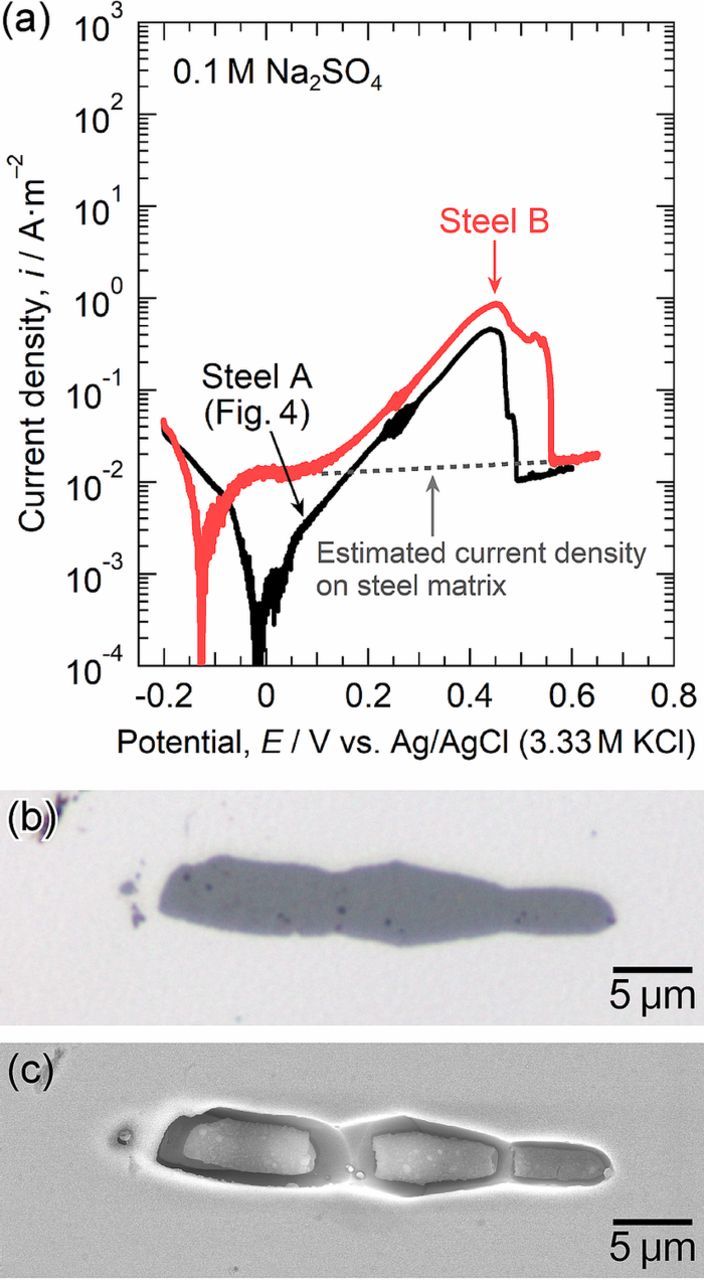
Figure 5. (a) Microscale polarization curve of a small area with the MnS inclusion in steel B measured in 0.1 M Na2SO4 at 298 K. (b) Optical micrograph of the inclusion before polarization. (c) SEM image of the inclusion after polarization.
Figure 6a shows the polarization curve of a small area with the MnS inclusion in steel B measured in 0.1 M NaCl. The optical micrograph of the inclusion before polarization is exhibited in Fig. 6b, and Figure 6c provides the SEM image after polarization. In Fig. 6a, the polarization curve of a small area with the MnS inclusion in steel A, which is shown in Fig. 4a, is given as a reference (the black curve). For steel B, the dissolution current of the MnS inclusion was observed in the potential range of ca. 0.1 V to 0.48 V. The MnS/steel matrix boundary dissolved preferentially, and the trenches were formed. However, no pit was initiated. Interestingly, even metastable pitting events did not occur. Polarization in 0.1 M NaCl was repeated independently twice. Neither metastable nor stable pitting events occurred. If the measurements were replicated many times, a pitting event would occur at the inclusions because stable pitting was observed in the macroscale polarization (Fig. 3). It is confirmed that the pitting corrosion resistance at the MnS inclusions in steel B was clearly higher than that at the MnS inclusions in steel A.
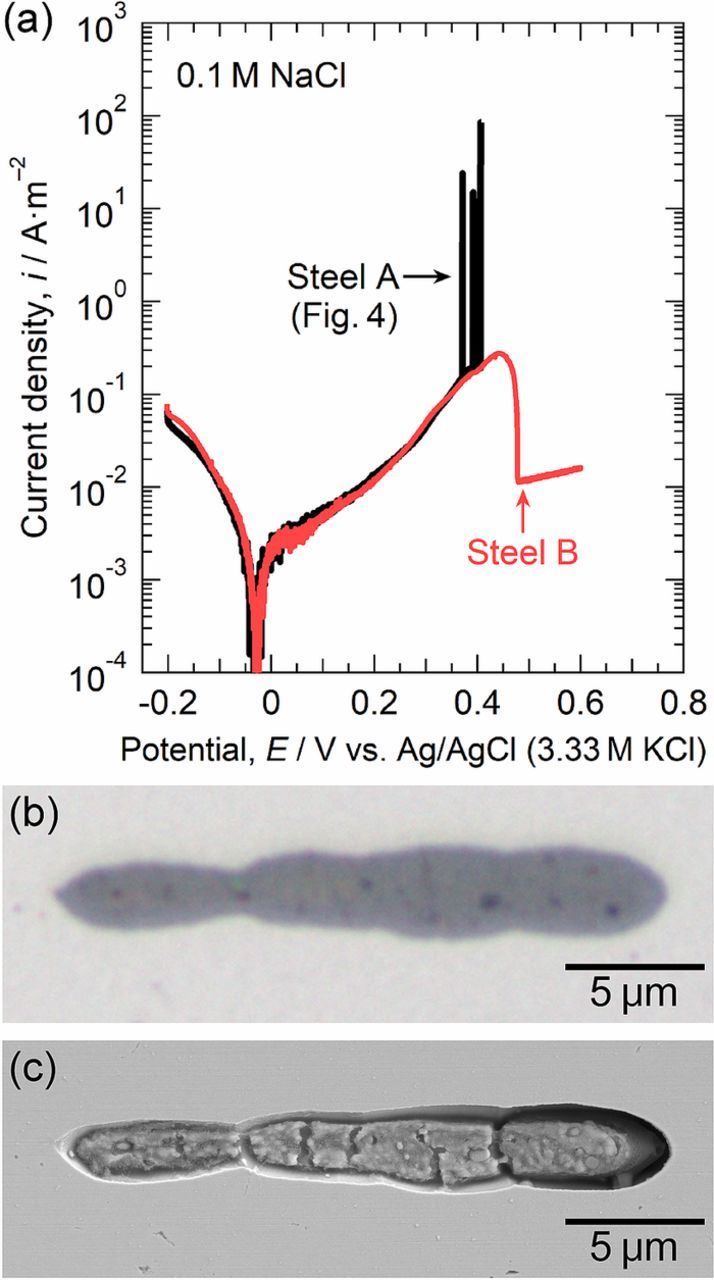
Figure 6. (a) Microscale polarization curve of a small area with the MnS inclusion in steel B measured in 0.1 M NaCl at 298 K. (b) Optical micrograph of the inclusion before polarization. (c) SEM image of the inclusion after polarization.
As indicated in Figs. 4–6, the anodic dissolution of the MnS inclusions was observed both in steel A (the Mo-free specimen) and steel B (the Mo-added specimen). Even for steel B, S species were thought to be released by the MnS dissolution, and the bare steel surface was certainly exposed to the solutions because the trenches were generated, similar to these of steel A. However, no pitting event was initiated at the inclusion in steel B during microscale anodic polarization. This implies that the Mo addition to the steel affected the transition process from trenching to pitting at the MnS inclusions.
Effect of Mo addition into the steel on trenching at the MnS/steel boundary
It was proposed by Chiba et al.15 that the pit initiation process at MnS inclusions in stainless steels proceeds as follows: 1) the dissolution of MnS inclusions in chloride solutions leads to the release of thiosulfate ions and weak acidification on and around the inclusions, 2) elemental sulfur is deposited on and around the inclusions through the disproportionation reaction of the thiosulfate ions in the weak acidic environment, 3) the synergistic effect of the elemental sulfur and chloride ions causes the formation of trenches at the MnS/steel matrix boundary due to the decrease in the protective ability of the passive film on the steel matrix, and 4) a pit is initiated due to a local active dissolution process when severe acidification was generated inside the trench by the hydrolysis reaction of Cr3+ released from the steel matrix dissolution. As mentioned above (Figs. 5 and 6), the Mo addition into the steel had no effect on the dissolution of the MnS inclusions themselves. According to this mechanism, the trench morphology at the MnS/steel matrix boundary is strongly related to the pitting corrosion resistance.10,26,28,30 To characterize the trench morphology just before the initiation of pitting, the microscale polarization curves of a small area with the MnS inclusion in steel A (the Mo-free specimen) and steel B (the Mo-added specimen) were measured in 0.1 M NaCl. Figure 7a shows the polarization curves measured in 0.1 M NaCl. Polarization was stopped at 0.35 V in these measurements because pits tend to occur at approximately 0.4 V, as shown in Fig. 4a. In Fig. 7a, the gradual increase in anodic current density above approximately 0.1 V can be attributed to the dissolution of the MnS inclusions. After polarization, the electrode surfaces were observed using FE-SEM. Figures 7b and 7c show the SEM images of the MnS inclusions after polarization. In steel A, the boundary between the MnS inclusion and the steel matrix dissolved selectively, and deep trenches were formed (Fig. 7b). However, little or no trenching was observed in steel B, and only slight dissolution of the surface of the inclusion was observed (Fig. 7c). Polarization was repeated three times on different specimens. In all cases, it was found that the trenching at the MnS/steel matrix boundary was prevented in steel B. This suggests that the Mo addition inhibits the trenching at the MnS/steel matrix boundary at low potentials. The formation of trenches was observed even in steel B when a small electrode area with the MnS inclusion was polarized up to 0.6 V, as shown in Fig. 6c.
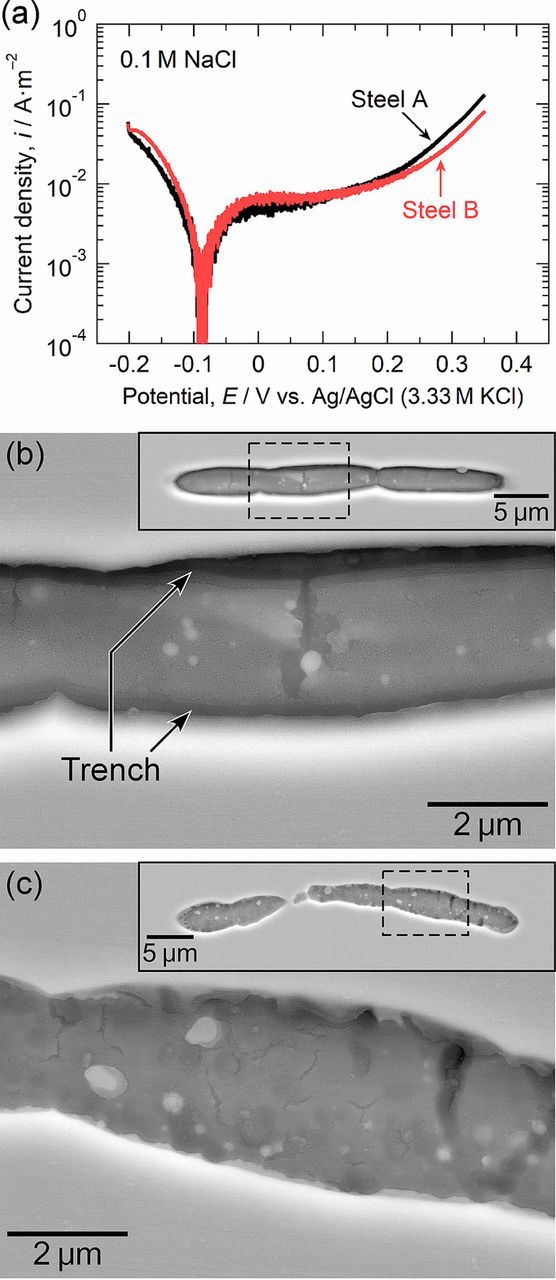
Figure 7. (a) Microscale polarization curves of a small area with the MnS inclusion in steel A and steel B measured in 0.1 M NaCl at 298 K. The measurements were stopped at 0.35 V. (b) SEM image of the inclusion in steel A after polarization. The inserted SEM image is the whole view of the inclusion, and the area surrounded by the dashed lines was enlarged. (c) SEM image of the inclusion in steel B after polarization.
Effect of MoO42− on trenching at the MnS/steel boundary in the Mo-free specimen
The trenching at the MnS/steel boundary in steel B (the Mo-added specimen) was inhibited at low potentials as described above. One possibility is that Mo species are released from the exposed bare steel surface and inhibit dissolution at the boundary. To estimate the Mo species dissolved from the steel matrix, the potential-pH diagram was calculated. Figure 8 shows the Pourbaix diagram of the Mo-H2O system at 298 K.31 The concentration of the soluble species in the calculation was 1.0 × 10⁻⁶ mol kg−1 (H2O). The experimental condition of the anodic polarization in 0.1 M NaCl (Fig. 7a) is indicated by the slashed rectangle and is located in the stable region of HMoO4−. This diagram suggests that molybdate ions were likely produced during the anodic polarization in 0.1 M NaCl. The solution chemistry of Mo species in artificial corrosion pits on Mo-added stainless steels was investigated by Kimura et al.32 and Davenport et al.33 Kimura et al. analyzed Mo species in artificial pits grown in LiCl solution using X-ray absorption fine structure (XAFS) and X-ray absorption near edge structure (XANES).32 They reported that the Mo K edge XANES spectra in the pit were similar to that of Na2MoO4. Davenport et al. also used XANES to explore the chemistry of Mo in artificial pits in HCl and LiCl solutions.33 They reported that the Mo K edge XANES spectra of solutions inside the pits were consistent with the presence of Mo(III) species. It is still debated how Mo exists in the pit solutions. These XANES studies focused on the strongly acidic solutions formed inside artificial corrosion pits. Webb and Alkire monitored the pH at 20 μm above a single MnS inclusion during microscale polarization in a 0.1 M Na2SO4 solution and reported that the pH decreased to approximately 4.0 by the dissolution of the inclusion.24 In Fig. 7c, there was neither a trench nor an occluded area at the MnS/steel matrix boundary, so the pH near the inclusion was probably not very low before the trenching occurred. Thus, MoO42− ions were likely produced during the anodic polarization. Therefore, the inhibitory effect of MoO42− ions on the trenching was simply examined in this paper.
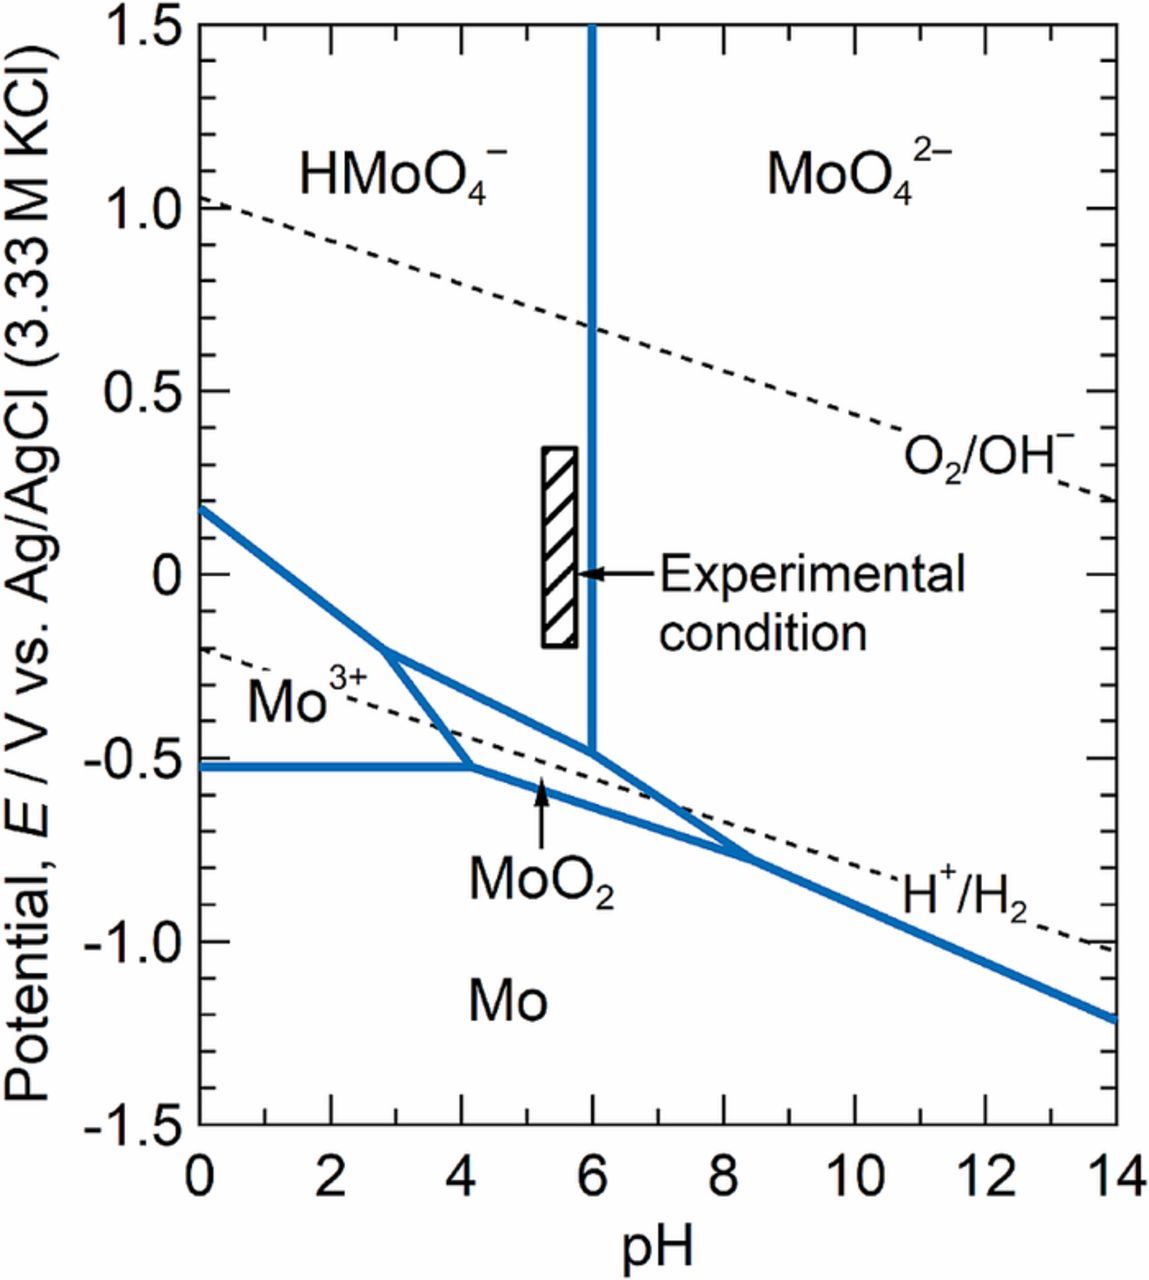
Figure 8. Pourbaix diagram for Mo-H2O system at 298 K. The concentration of soluble species is 1.0 × 10⁻⁶ mol kg−1 (H2O).
If MoO42− ions are released from the bare steel surface and act to prevent trenching at the MnS/steel matrix boundaries, it is reasonable to assume that trenching around the MnS inclusions in the Mo-free specimen (steel A) would be suppressed in the solution containing MoO42− ions. To evaluate the effect of MoO42− ions on trenching at the MnS/steel matrix boundary, microscale polarization was performed in the 0.1 M NaCl-0.01 M Na2MoO4 solution. Figure 9a shows the effect of MoO42− ions on the microscale polarization of a small area with the MnS inclusion in steel A. In this polarization, the measurements were also stopped at 0.35 V, and the electrode surface was observed by FE-SEM. The microscale polarization curve of steel A measured in 0.1 M NaCl, shown in Fig. 7a, is given as a reference (the black curve). As explained previously, the gradual increase in anodic current density above ca. 0.1 V was attributed to the dissolution of the MnS inclusions. Figure 9b displays the SEM image of the inclusion after polarization. Also in the case of the 0.1 M NaCl-0.01 M Na2MoO4 solution, the boundary between the inclusion and steel matrix dissolved preferentially, and trenches were formed. This suggests that the MoO42− ions did not inhibit trenching at the MnS/steel matrix boundary. Additionally, the anodic dissolution current of the inclusions was not inhibited by the MoO42− ions. It is likely that a sufficiently high concentration of Na2MoO4 would inhibit trenching. However, it appears that the concentration of Mo species is not so high on the boundary before trenching. As shown in Fig. 7c, for the Mo-added specimen (steel B), the steel matrix side of the MnS/steel matrix boundary did not dissolve, and no occluded area was formed. After deep-trenching and/or pitting, a large increase in the concentration of Mo species likely occurs, and this high concentration of Mo species inhibits pitting corrosion, as has been reported by many researchers.19,34–37 In the initial period of pitting, it is likely that there are other factors that prevent trenching at the MnS/steel matrix boundaries in the Mo-added specimen. In this work, the target of our investigation was limited to the role of Mo addition in preventing trench formation by measuring the depassivation pH and active dissolution rate of the steel matrix surrounding MnS inclusions.
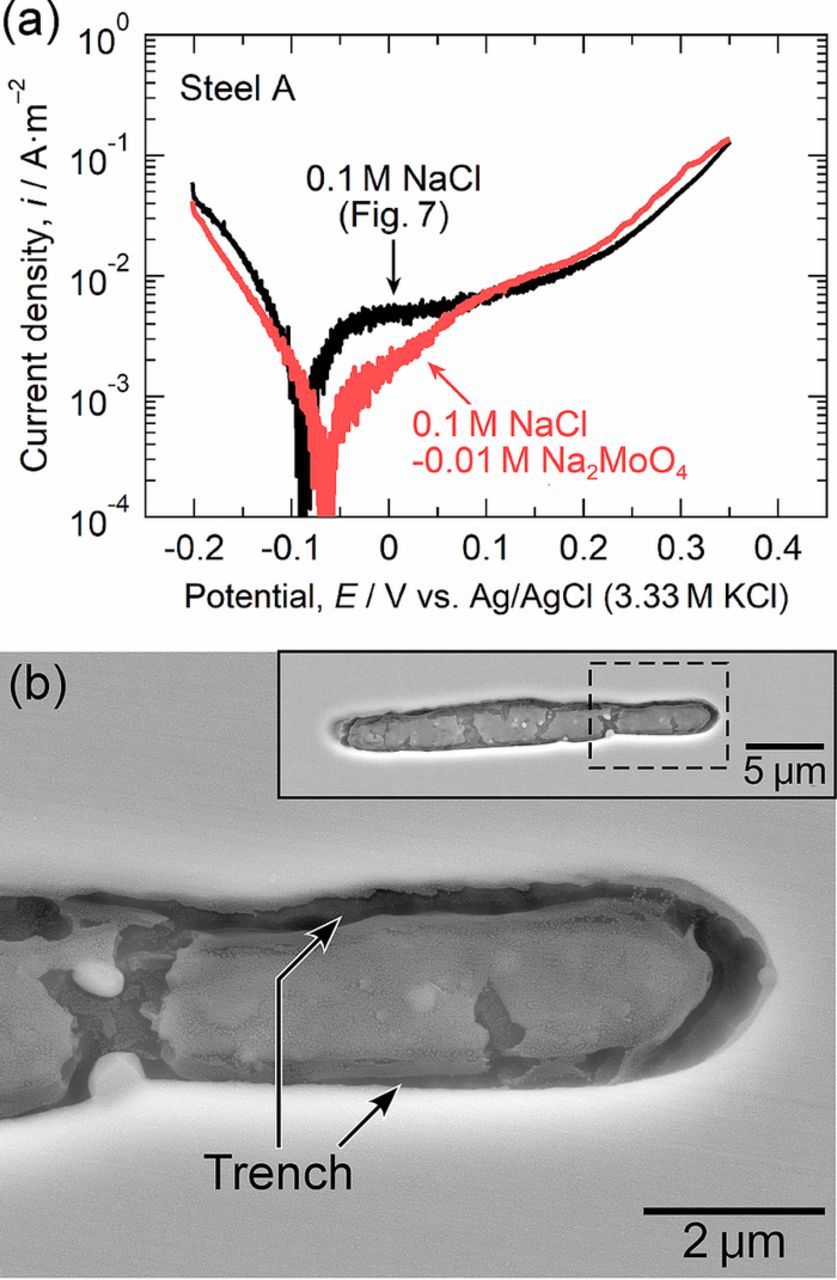
Figure 9. (a) Microscale polarization curves of a small area with the MnS inclusion in steel A measured in 0.1 M NaCl-0.01 M Na2MoO4 at 298 K. Polarization was stopped at 0.35 V. (b) SEM image of the inclusion after polarization. The inset SEM image is the whole view of the inclusion: the area surrounded by the dashed lines was enlarged.
Effect of Mo addition into the steel on depassivation pH and active dissolution rate
The depassivation pH values of steel C (the low-S and Mo-free specimen) and steel D (the low-S and Mo-added specimen) were measured in a 0.1 M NaCl-1 mM Na2S2O3 solution. Elemental sulfur is suspended in the solution through the disproportionation reaction of S2O32− ions due to weak acidification below ca. pH 4.0.15,38 This promotes the depassivation of the steel. This experimental condition simulates the environment at the MnS/steel matrix boundaries in the NaCl solution. Figure 10a shows the time variations of the open circuit potentials (OCPs) of steel C and steel D measured in 0.1 M NaCl-1 mM Na2S2O3 solution. The initial pH value of the solution was 5.5, and HCl was added every 600 s to lower the pH. The gradual change in the solution from transparent to an opaque whitish color as the pH decreased was evidence of the sulfur suspension in the solution. Figures 10b and 10c show the optical micrographs of the specimen surfaces after the measurements. In Fig. 10a, the OCP of steel C gradually decreased with decreasing pH and dropped to approximately -0.45 V when the pH was changed from 2.0 to 1.5. This large decrease in the OCP indicates the depassivation of the steel. As shown in Fig. 10b, the grain boundaries appeared faintly, and the specimen surface became brown. In contrast, the depassivation of steel D was suppressed until a pH of 0.9 was reached. It is therefore suggested that the Mo addition into the steel inhibited the depassivation of the steel matrix at the MnS/steel boundary. The results in this study are consistent with the reports that Mo alloying inhibited the depassivation of Ni-Cr-Mo-Fe alloys39 and stainless steels40 in H2S-Cl− environments. Additionally, the OCP of steel C slightly decreased between a pH 4.0 and 2.0 (before depassivation), whereas the OCP of steel D gradually increased. This indicates that the passive film on the Mo-added specimen is more protective than that on the Mo-free specimen when S species and Cl− ions coexist. Monnot et al. reported that a higher content of Mo in stainless steel led to a lower passive current density in the H2S-Cl− environment.40 The prevention of trenching, as shown in Fig. 7c, can be explained by the low depassivation pH and the improved protective ability of the passive film of the Mo-added specimen.
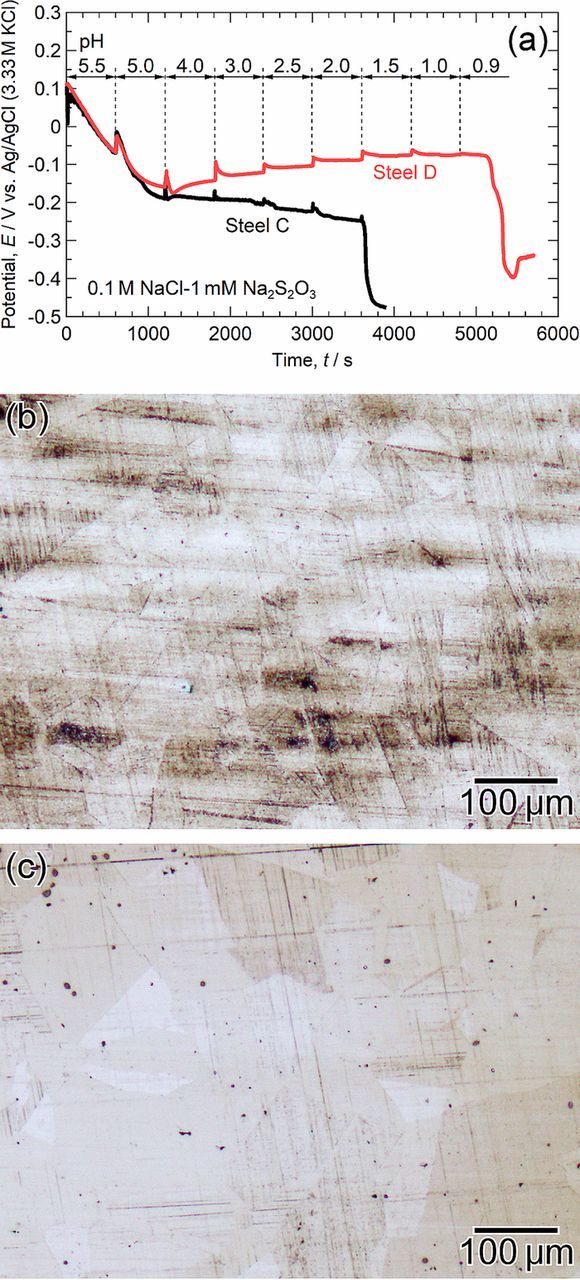
Figure 10. (a) Time variations of open circuit potentials of steel C and steel D measured in 0.1 M NaCl-1 mM Na2S2O3 at 298 K. The initial pH value of the solution was 5.5, and HCl was added every 600 s to lower the pH. (b, c) Optical micrographs of the specimen surfaces after the measurements: (b) steel C and (c) steel D.
As indicated in Fig. 7, Mo alloying prevented trenching at the MnS/steel boundary below 0.35 V. However, the formation of trenches was also observed in the Mo-added specimen when a small electrode area with the MnS inclusion was polarized up to 0.6 V (Fig. 6). The MnS inclusions continue dissolving while the depassivation of the steel is being prevented by Mo, and S species are released from the inclusions. The depassivation of the Mo-added steel would occur at high potentials when the total amount of chloride ions and S species exceeds a critical concentration for depassivation. In such cases, the active dissolution rate of the steel matrix would determine whether pitting (local active dissolution) occurs inside the trench. Figure 11 shows the macroscale polarization curves of steel C (the low-S and Mo-free specimen) and steel D (the low-S and Mo-added specimen) measured in a 1 M HCl-1 mM Na2S2O3 solution. The pH value of this solution was approximately zero, and elemental sulfur was suspended in the solution. This solution simulates the environment inside the trench at the MnS/steel matrix boundaries. The corrosion potential of steel D was ca. 0.1 V nobler than that of steel C. The active dissolution was clearly suppressed by the addition of Mo into the steel, suggesting that Mo alloying inhibits the initiation of pitting inside the trenches at the MnS/steel matrix boundary.
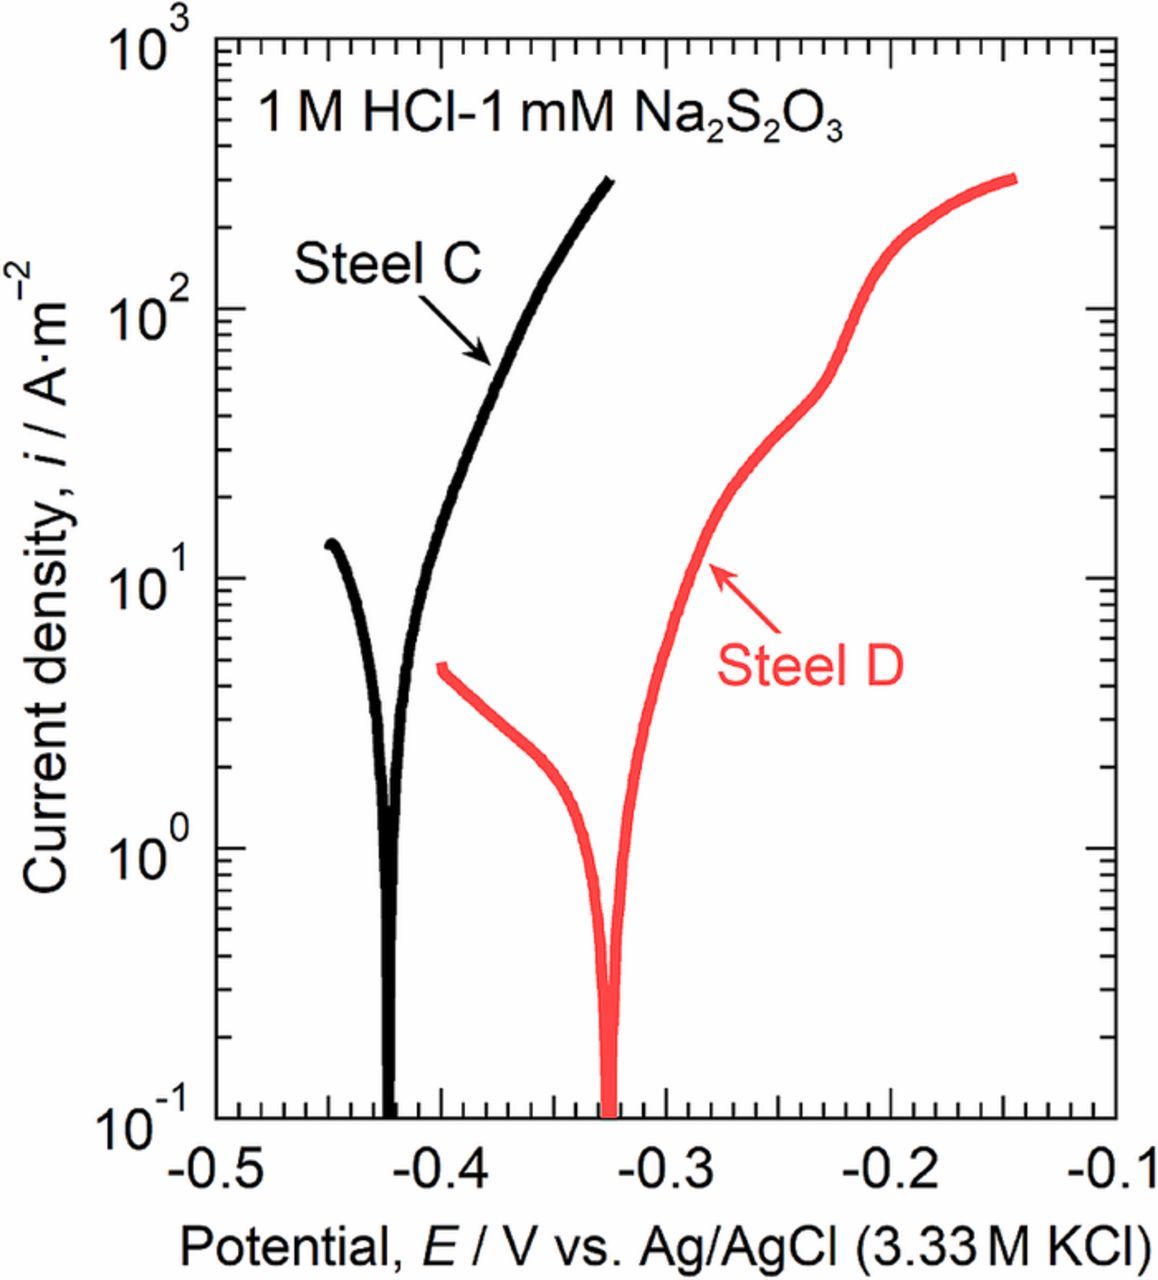
Figure 11. Macroscale polarization curves of steel C and steel D measured in 1 M HCl-1 mM Na2S2O3 at 298 K.
In the case of the Mo-free specimen (steel A), it would appear that the dissolution of the MnS inclusion causes the deposition of elemental sulfur and the formation of a deep trench at the MnS/steel matrix boundary. The synergistic effect of the elemental sulfur and chloride ions was proposed to cause the formation of trenches because the protective ability of the passive film on the steel matrix at the boundaries decreases.15 The trenching at the boundary is closely related to the initiation of pitting. The decrease in pH caused by the hydrolysis reaction of metal ions and the IR-drop occur inside the trenches. The pitting is supposed to be the localized transition from the passive to the active state of the steel matrix inside the trench. Metastable pits tend to occur in the shallow trenches. The solution inside the pits is open to the bulk solution when the pits grow, and the dilution of the solution inside the pits leads to repassivation. On the other hand, stable pits tend to occur in the deep trenches. The solution inside the pits is not sufficiently exposed to the bulk solution while the pits are growing larger. In the case of the Mo-added specimen (steel B), the low depassivation pH and the improved protective ability of the passive film of the Mo-added specimen prevent trenching at the MnS/steel matrix boundaries at low potentials. Even after trenching at high potentials, the low active dissolution rate of the steel matrix inhibits the initiation of pitting inside the trench. It was concluded that the addition of Mo to the steel inhibits trenching around MnS inclusions and the transition from trenching to pitting, resulting in higher pitting potentials compared to that of the Mo-free steel.
Conclusions
- (1)The chemical composition of MnS inclusions in Mo-free and Mo-added austenitic stainless steels was analyzed by FE-EPMA. Mo existed in the steel matrix but was not detected in the inclusion of the Mo-added specimen. There was little or no difference in the chemical composition of the inclusions in the Mo-free and Mo-added specimens.
- (2)In the microscale polarization measurements, the MnS inclusion in the Mo-free specimen dissolved in the potential range of ca. 0.1 to 0.5 V. Metastable and stable pits were generated in the dissolution potential range of the inclusion. In the case of the Mo-added specimen, the dissolution of the MnS inclusion was also observed in the potential range of ca. 0.1 to 0.5 V. The trench was formed at the MnS/steel matrix boundary. However, neither metastable nor stable pitting events occurred.
- (3)A characteristic difference in the trench morphology at the MnS/steel matrix boundaries just before pit initiation was observed. When a small electrode area with the MnS inclusion was potentiodynamically polarized up to 0.35 V, the MnS/steel matrix boundary in the Mo-free specimen dissolved preferentially, and deep trenches were formed. However, no trench was observed at the MnS/steel matrix boundary in the Mo-added specimen.
- (4)Trenching at the MnS/steel matrix boundary in the Mo-free specimen was not inhibited in the 0.1 M NaCl-0.01 M Na2MoO4 solution. Although the depassivation pH value of the low-S and Mo-free specimen was between a pH of 2.0 and 1.5 in the 0.1 M NaCl-1 mM Na2S2O3 solution, the depassivation of the low-S and Mo-added specimen was suppressed until a pH of 0.9 was reached. In addition, the OCP of the low-S and Mo-free specimen slightly decreased with decreasing pH before depassivation, whereas the OCP of the low-S and Mo-added specimen gradually increased. This suggests that the lower depassivation pH and the higher protective ability of the passive film of the Mo-added specimen prevent trenching at the boundary. In the 1 M HCl-1 mM Na2S2O3 solution, the active dissolution rate of the steel was suppressed by the addition of Mo into the steel, suggesting that Mo alloying inhibits the initiation of pitting inside the trenches at the MnS/steel matrix boundary. It was concluded that Mo alloying inhibits pit nucleation at MnS inclusions in two steps: 1) the low depassivation pH and the improved protective ability of the passive film of the Mo-added steel prevent trenching at low potentials, and 2) the low active dissolution rate of the Mo-added steel inhibits the transition from trenching to pitting (local active dissolution inside the trenches) at high potentials.
Acknowledgments
This work was supported by a Grant-in-Aid for Scientific Research A (grant No. JP17H01331) from the Japan Society for the Promotion of Science. The first author (M. Nishimoto) was supported by a Grant-in-Aid for JSPS Research Fellow (grant No. JP17J03625). This work was also supported by the Program for Leading Graduate Schools, "Interdepartmental Doctoral Degree Program for Multi-dimensional Materials Science Leaders, Tohoku University", funded by the Ministry of Education, Culture, Sports, Science and Technology (MEXT), Japan.