Abstract
A combination of in-situ Scanning Vibrating Electrode Technique (SVET) and time-lapse immersion optical microscopy (TLM) is used to investigate the effect of microstructural refinement on patterns of localized corrosion affecting zinc-aluminum-magnesium (ZAM) galvanized coatings on steel. Model ZAM coatings comprising Zn-2.7 wt% Al-1.5 wt% Mg are produced on 0.7 mm mild steel sheet by hot dipping, and the resulting coating microstructure is systematically refined by increasing the cooling (solidification) rate from 5°C.sec−1 to 1000°C.sec−1. The intact ZAM coated surface is immersed in 0.17 M aqueous NaCl, and SVET and TLM are used to follow the resulting localized corrosive attack. TLM shows that corrosion initiates preferentially within MgZn2 and spreads laterally over the ZAM surface by preferentially following MgZn2 rich phases. In coarse microstructures, large primary zinc grains tend to deflect and constrain lateral spreading whereas in fine microstructures the smaller primary zinc grains do not. Consequently, lateral spreading rate increases with microstructural refinement. SVET shows that global corrosion rates are similar for all the ZAM coatings but that increased lateral spreading results in lower rates of through-coating penetration for the refined microstructures. These findings are explained in terms of the lateral diffusion of aggressive anolyte species.
Export citation and abstract BibTeX RIS

This is an open access article distributed under the terms of the Creative Commons Attribution 4.0 License (CC BY, http://creativecommons.org/licenses/by/4.0/), which permits unrestricted reuse of the work in any medium, provided the original work is properly cited.
Both zinc (Zn) and Zn based alloy coatings are commonly applied to steel and used in many industrial sectors, most notably automotive and construction. Such galvanized coatings provide cathodic corrosion protection by acting sacrificially to the underlying steel substrate. Efforts to reduce coating thickness and material costs have led to the development of zinc-aluminum coatings including Zn-5 wt% Al and Zn-55 wt% Al,1–5 which have been claimed to provide twice, and four times the corrosion resistance of Zn based coatings respectively.6 More recently magnesium (Mg) has been investigated as an alloying addition and Zn-Mg and Zn-Al-Mg (ZAM) coatings have been applied to steel, used within building and automotive industries, via both hot dipping3,5,7–15 and physical vapor deposition (PVD).16–17 However, varying the amount of each alloying element results in the formation of a variety of phases of different shape, size, composition and distribution, and the corrosion behavior of such alloys can therefore be unpredictable.2,18
The kinetics and mechanism of corrosion observed on Zn based alloy coatings in a range of environments has been investigated extensively.3–5,7–15,19–23 In the case of Zn-Al and ZAM alloys, the Al containing phases were found to be stable relative to the surrounding zinc matrix.8,10,14,24 In the case of Zn-Mg and ZAM alloys, Mg containing phases such as MgZn2 and MgZn11 have consistently been shown to dissolve preferentially and a magnesium oxide layer has been observed on such phases.7,21–22 The replacement of the zinc oxide by this more insulating layer results in reduced rates of the cathodic oxygen reduction reaction (ORR).10–17,19–21 Mg2+ ions, released during the dissolution of Mg rich phases, can react with the OH− ions, produced at the cathode, to form Mg(OH)2. The solubility product Ksp for Mg(OH)2 is 1.8 × 10⁻¹¹ mol3.dm−9. Mg(OH)2 corrosion product is therefore able to 'buffer' the local electrolyte pH to 10.5, at which pH the zinc surface is passive.8,19 For Zn-Al-Mg alloys, the oxidation of Al at values of pH near to 10.5 will produce aluminate Al(OH)4− anions. Aluminate can then react with Mg2+ to form layered double hydroxides (LDH).8,12–14,19,20
From the above it is clear that the corrosion of hot-dipped ZAM alloys is likely to be highly localized. Furthermore, localization is likely to persist as corrosion proceeds. Localized anodic and cathodic reactions result in variations in local pH and composition of the contacting electrolyte which, in turn, determine the stability of protective corrosion product layers. Furthermore, the nature and extent of that localization is likely to be influenced by changes in process parameters (e.g. heating and cooling rate) during coating production, which means coatings of the same nominal composition can vary significantly in microstructure.1,18,24 This is especially true of the thinner coatings which are currently of interest to manufacturers. The effect of microstructure on the polarization resistance of Zn-2 wt% Mg alloys has previously been investigated by systematic variation of cooling rate during solidification from the melt.18 Elsewhere Zn-5 wt% Al and Zn- 3 wt% Al- 2 wt% Mg alloys were heat treated to obtain distinctly different microstructure and then subjected to cyclic corrosion testing.24 The scanning vibrating electrode technique (SVET) has also been used to study the effect of microstructure on the corrosion performance of a Zn-5 wt% Al alloy.1
The present paper investigates the relationship between microstructural refinement and localized corrosion kinetics for a ZAM coating of fixed composition. In so doing, a Rhesca hot dip simulator is used to prepare a series of hot dip Zn-2.7 wt% Al-1.5 wt% Mg (Zn2.7Al1.5Mg) alloy coatings on steel. These samples are prepared with cooling rates ranging between 5 and 1000°C.s−1 to produce a systematic refinement in microstructure. The localized corrosion behavior of the intact coated surface is then studied under immersion in 0.17 M aqueous NaCl. The general aim of this work is to determine the relationship (if any) between the physical size of microstructural phases and the kinetics of localized corrosion. One particular aim is to determine whether or not microstructural refinement produces any effect on lateral spreading rate, and depth penetration rate, of corrosive attack.
In attempting the above, a combination of in-situ ad ex-situ techniques is used. Ex-situ techniques are used to characterize the prepared (un-corroded) alloy coatings. Scanning electron microscopy (SEM) and electron back scattered diffraction (EBSD) are used to determining microstructural morphology and grain size. Scanning Kelvin probe force microscopy (SKPFM) Volta potential mapping is used to determine the relative nobility of the various microstructural phases. In-situ techniques are used to follow the process of localized corrosion under immersion conditions. A combination of optical microscopy and time-lapse microscopy (TLM) are used to resolve areas of local phase dissolution on a microstructural length scale (10-100 μm). The scanning vibrating electrode technique (SVET) is used to follow the lateral propagation (spreading) kinetics of areas on net anodic and net cathodic activity on a macroscopic scale (100 μm−10 mm).
Experimental
Materials
Coatings were applied to a steel substrate, using a hot dip Rhesca simulator, by the steel manufacturer Voestalpine AG. Table I outlines the cooling rates used during the production of each coating. In all cases the strip entry temperature was 465°C and the bath temperature was 460°C. N2 was used as the wiping gas. In the case of ZAM 3, the coated steel was reheated to above 400°C and quenched in water at room temperature.
Table I. Process parameters for the production of ZAM coatings using a Rhesca hot dip simulator.
| Code | Steel gauge (mm) | After pot cooling rate (°C/s) |
|---|---|---|
| ZAM1 | 0.70 | 5 |
| ZAM2 | 0.70 | 30 |
| ZAM3 | 0.70 | 1000 |
NaCl and all other chemicals were of analytical grade purity and supplied by Sigma Aldrich Chemical Co. A 0.17 M NaCl electrolyte was used throughout. The bulk solution pH was adjusted to pH 7 by the drop-wise addition of NaOH (aq).
Methods
Inductively coupled plasma (ICP)-optical emission spectroscopy (OES)
120 mm diameter disks were punched out from larger coated samples and the side which was not subject to analysis was sealed off. The coating was then removed using a hydrochloric acid (HCl) solution following EN 10346 (Annex A).25 Once the coating had been removed the solution was transferred to a volumetric flask and a ICP-OES spectrometer Spectroblue SOP FMX 26 (Spectro Analytical Instruments) was used to analyze its composition.
EBSD; 10 mm × 20 mm sized samples were ground with 1 μm diamond particles on a "Mol-towel" for one minute. A further polishing step was then performed using 1.1 Aerodisp G1220 and pure ethanol on a "Chem-towel". Measurements were conducted on a Zeiss Supra35 SEM with an Oxford NordlysNano EBSD-detector using an electron beam at 20 kV (60 μm aperture, high current, working distance 10 mm). Images of size 1097 × 822 pixels were captured with a measuring step of 0.3 μm and a capture time of 25.2 ms.
TLM
20 mm × 20 mm samples were cut from larger sheets and mounted in nonconductive phenolic resin. A 1 μm diamond slurry was used to remove any surface oxide formed, whilst ensuring that the coating remained intact. The sample was then etched to reveal the microstructure using a 2 wt% Nital solution, and subsequently rinsed with ethanol and water. TLM was completed using a Meiji MT8000 microscope, following a procedure developed previously, which allowed for corroding samples to be imaged at a microstructural level.7,23 A polyethylene shroud, with an integrated glass window, was placed over the lens of the microscope and allowed for imaging of the immersed sample corroding within an electrolyte. A 1 mm diameter circle was cut out of PTFE tape (type 5490 HD supplied by 3 M) and applied to the sample surface so as to expose a 0.785 mm2 area. The sample was secured to the bottom of glass dish which was then filled with 250 ml of 0.17 M NaCl. The exposed area of the sample was imaged every two minutes for 24 hours using an infinity 2 camera attachment. The still images were compiled to produce videos using Windows Movie Maker.
SVET
The SVET can be used to monitor the spatial and temporal corrosion behavior of a material, immersed within an electrolyte, by detecting an alternating potential at the frequency at which it vibrates. This alternating potential is proportional to the potential gradient (in the direction of vibration) established within the electrolyte when an ionic current flows between the anodic and cathodic region of the sample.26–31
Design of the SVET instrumentation and operating procedure, along with the calibration process which allows for the calculation of current flux density along the axis of probe vibration (jz), have been described in detail elsewhere.26–31 A 125 μm diameter platinum wire microtip is encased in glass and vibrated in the z direction above the sample at a constant frequency (140 Hz), amplitude (25 μm) and height (100 μm).
Samples were prepared in the same way as described for TLM studies. 50 measurements were made along the sample width and length, this creating a mesh of 2500 data points. Measurements were taken over a 24-hour time period at 1 hour intervals. Three experiments were conducted in the case of each different sample. The bulk dissolved oxygen and carbon dioxide concentrations in the electrolyte were assumed to be in line with equilibrium concentration values for air saturated water, these being 2.8 × 10⁻⁴ mol. dm−3 and 1.32 × 10⁻⁵ mol. dm−3 respectively.32
Data obtained using the SVET can be used in a semi quantitative manner to provide an estimate of the total metal lost over the experimental time period.
The numerical integration (Equation 1) of all the anodic jz(x, y) values over the sample area allows for the determination of the time dependent total anodic current, I(t), for each of the jz distribution maps.26,33
![Equation ([1])](https://content.cld.iop.org/journals/1945-7111/166/11/C3147/revision1/d0001.gif)
A is the sample area, X and Y are the length and width of the scanned area and t is the time. An area averaged anodic current density value J(t) can then be obtained by dividing I(t) by A.
The fraction of I, ϕ(a, z), detected through the integration of jz over a 2a × 2a square area concentric with a point source, has previously been shown to tend toward 1 as a/z →∞ following Equation 2.33 Using Equation 2 it was shown that ϕ(a, z), = 0.5, 0.9, and 0.99 when a = 1.555z, 9z, and 90z, respectively.33
![Equation ([2])](https://content.cld.iop.org/journals/1945-7111/166/11/C3147/revision1/d0002.gif)
The total charge density emitted from the local anodes over the entire experimental time period is then calculated using Equation 3, and the mass loss calculated using Faraday's law1–2,7,23,26,39
![Equation ([3])](https://content.cld.iop.org/journals/1945-7111/166/11/C3147/revision1/d0003.gif)
where q is the total charge density, m is the mass loss per unit area, M is the atomic weight of zinc (65.38 Da), n is the valence of metal ions 2, F is the Faraday constant, tmax is the total immersion time. In all cases it is assumed that j(t) remains constant between scans.
It should be noted that only localized corrosion separated by distances ≫ h (100 μm) will be resolved by the SVET. When h ≫ the distance of separation, the anodic current flux lines associated with the local feature will not necessarily pass normally through the plane of scan (Figure 1a) and ϕ will be reduced.26,33–34 Values of mass loss will therefore approach the true value when the anodic feature has a diameter significantly greater than the scan height (100 μm). Under these circumstances the anodic current flux will tend to cut the plane of scan in an approximately normal fashion (Figure 1b). In the case of a point source the theoretical width at half maximum (whm) of the SVET response peak is 1.53h. 30 The lateral resolution of the SVET deviates from this value due to the peak broadening which occurs due to the finite width of the electrically sensitive portion of the SVET probe tip. For the SVET used during this work, it has previously been shown that the whm is 260 μm in the case that h = 100 μm.29
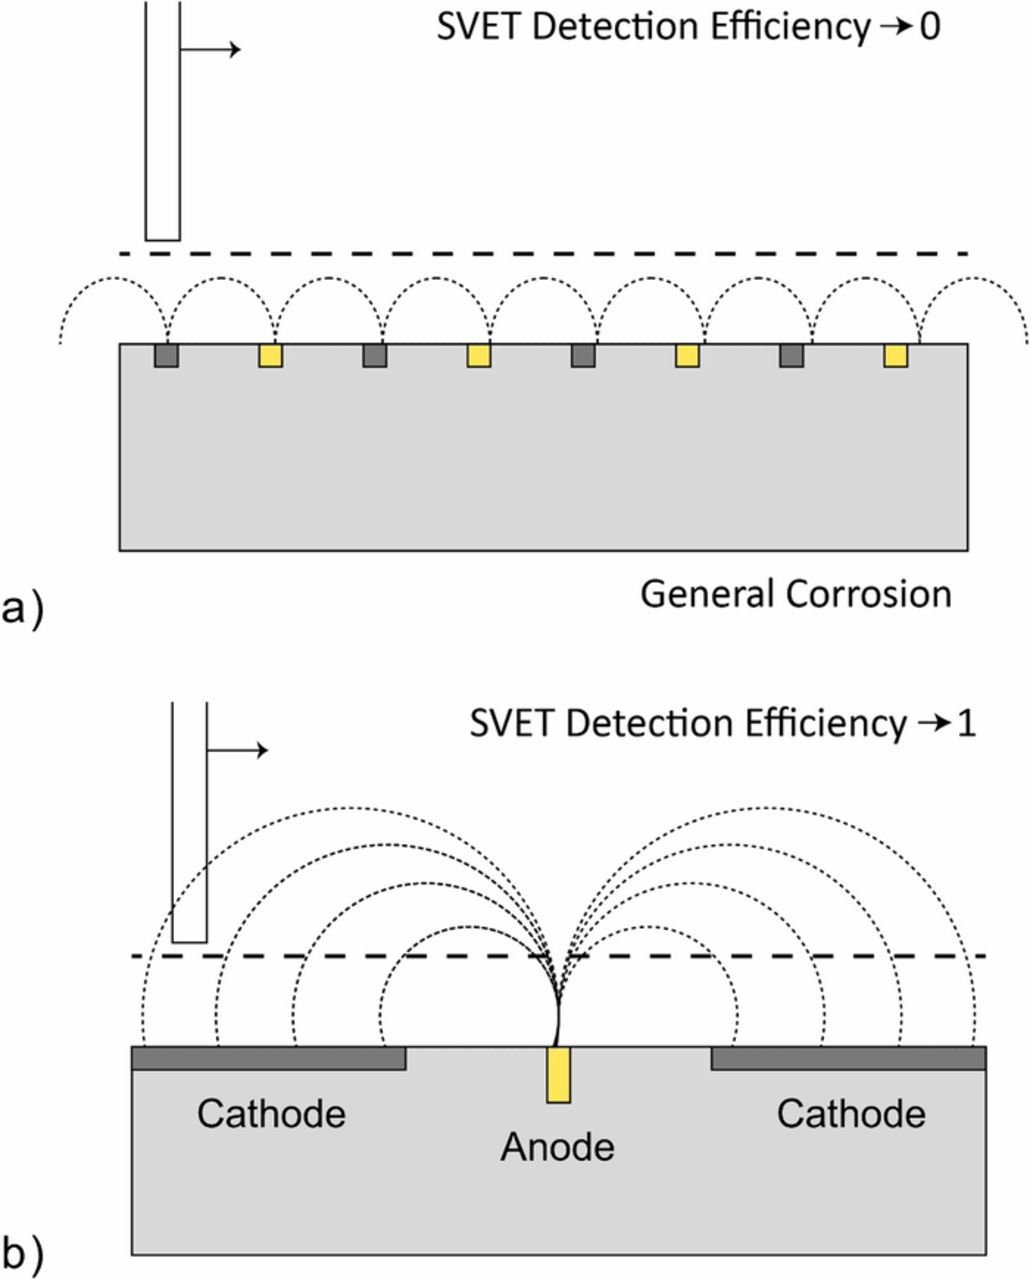
Figure 1. Schematic explaining the extent to which the SVET can efficiently resolve localized corrosion in the case that a.) corrosion separation is less than the scan height and the lines of current flux do not cross the plane of scan and b.) corrosion separation is greater than the scan height and the lines of current flux are able to cross the plane of scan.
Despite limitations of the technique, SVET derived mass loss values calculated previously were comparable with external weather Zn run off tests.35 Similarly, Faraday's law can be used to calculate hydrogen gas evolution rates from area averaged cathodic current data and values obtained have previously been shown as comparable to those obtained when measuring H2 evolution via a volumetric technique.34 Elsewhere, SVET derived corrosion inhibition efficiency values were found to correlate well with those calculated using EIS, gravimetric mass loss and polarization data.36
SKPFM
The potential difference between phases present within ZAM samples were investigated using SKPFM. Samples were prepared in the same way as those used for TLM. A JPK NanoWizard3 atomic-force microscope (AFM) with scanning Kelvin probe (SKP) equipped with a FM-50 Pointprobe tip, was used to perform measurements in AC mode. The SKP scanning was performed at 20 nm above the surface at 20 μm/s speeds.
A Hitachi desktop SEM TM3000 was used to obtain images of coating morphology and microstructure.
Results
Materials characterization
The chemical composition of each coating, as obtained using ICP-OES, alongside the coating thickness, as obtained using ICP-OES can be seen in Table II. In all three cases the coatings contained ∼2.7 wt% Al, 1.5 wt% Mg and were ∼ 11 μm thick.
Table II. Chemical composition and thickness of each coating obtained using ICP-OES.
| Chemical composition wt% (Zn balance) | |||||
|---|---|---|---|---|---|
| Al | Fe | Mg | Thickness (μm) | Zn Grain Size (μm) | |
| ZAM1 | 2.72 | 0.15 | 1.49 | 10.9 | 85 |
| ZAM2 | 2.72 | 0.15 | 1.51 | 11.0 | 20 |
| ZAM3 | 2.67 | 0.18 | 1.51 | 10.4 | 2.5 |
SEM images of the alloy microstructure are shown in Figure 2. ZAM1 (a) and ZAM2 (b) both consist of zinc dendrites within a ternary eutectic phase. As observed previously, the ternary eutectic consists of Zn, a Zn rich Al phase and MgZn2.7,14 For the highest cooling rate (ZAM3) a very fine microstructure is observed. The composition of the primary dendrites is similar to that observed for both ZAM1 and ZAM2. Both the dendrites and the eutectic take a 'globular' form.
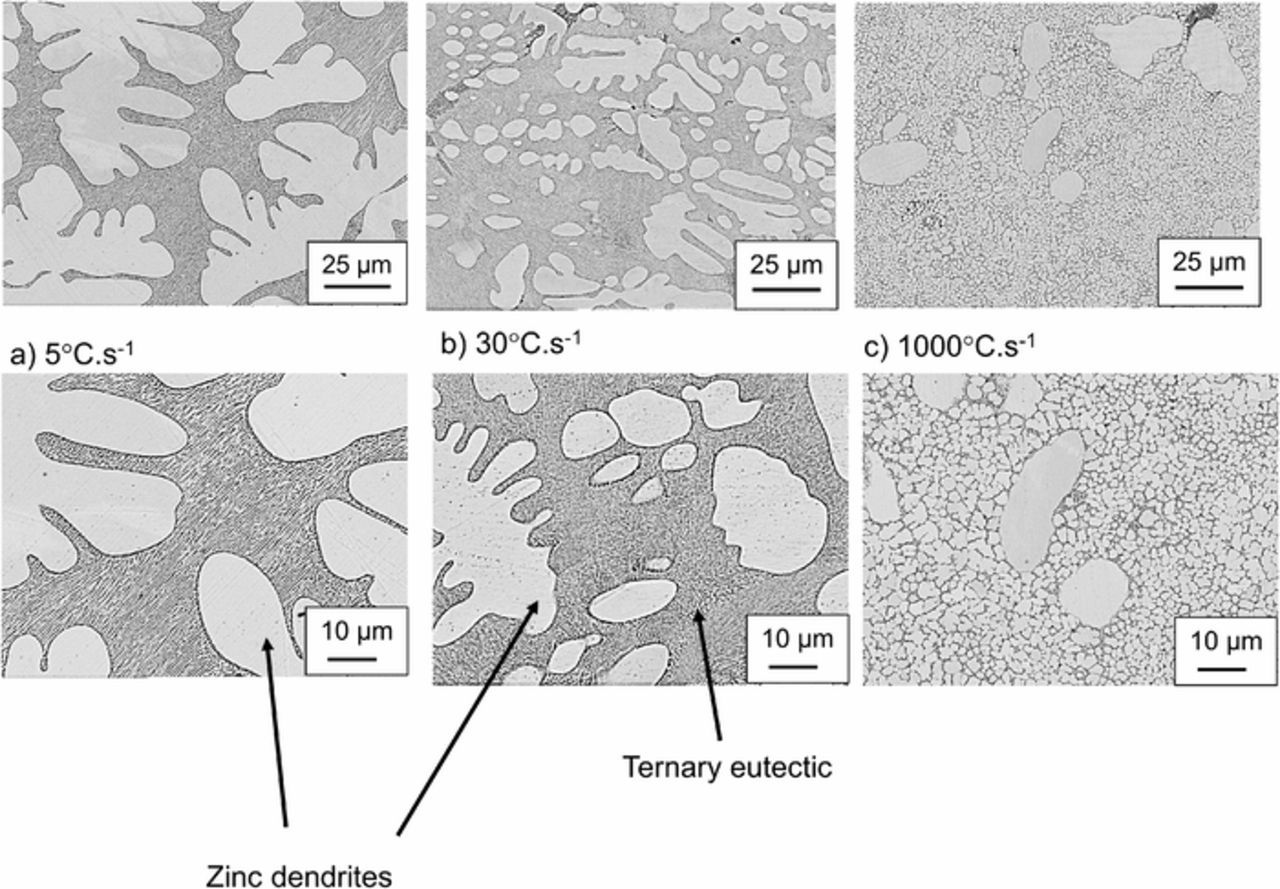
Figure 2. SEM images showing the microstructure of a.) ZAM1, b.) ZAM2 and c.) ZAM3.
The average zinc dendrite grain size, obtained using EBSD, decreases with increased cooling rate and is 85 μm, 20 μm and 2.5 μm respectively for ZAM1, ZAM2 and ZAM3. (Table II).
SKPFM
Figure 3 shows the topography (a) and Volta potential (b) maps of an area of Zn-2Al-2Mg (with similar dendrite and eutectic composition) produced under industrial conditions. The slightly raised regions are associated with primary zinc dendrites. In comparison, the eutectic phase is lower, this being expected in the case that the MgZn2 (present within the eutectic phase) preferentially dissolves during etching. The Volta potential differences observed in Figure 3b correlate well with the features in the topography map (a) and we can be confident that any differences in potential observed result from the variation in microstructure. As such, the eutectic is associated with a lower potential value (more active) with respect to the zinc dendrites. It is concluded that, thermodynamically, anodic attack is more likely to occur preferentially within the eutectic phase.
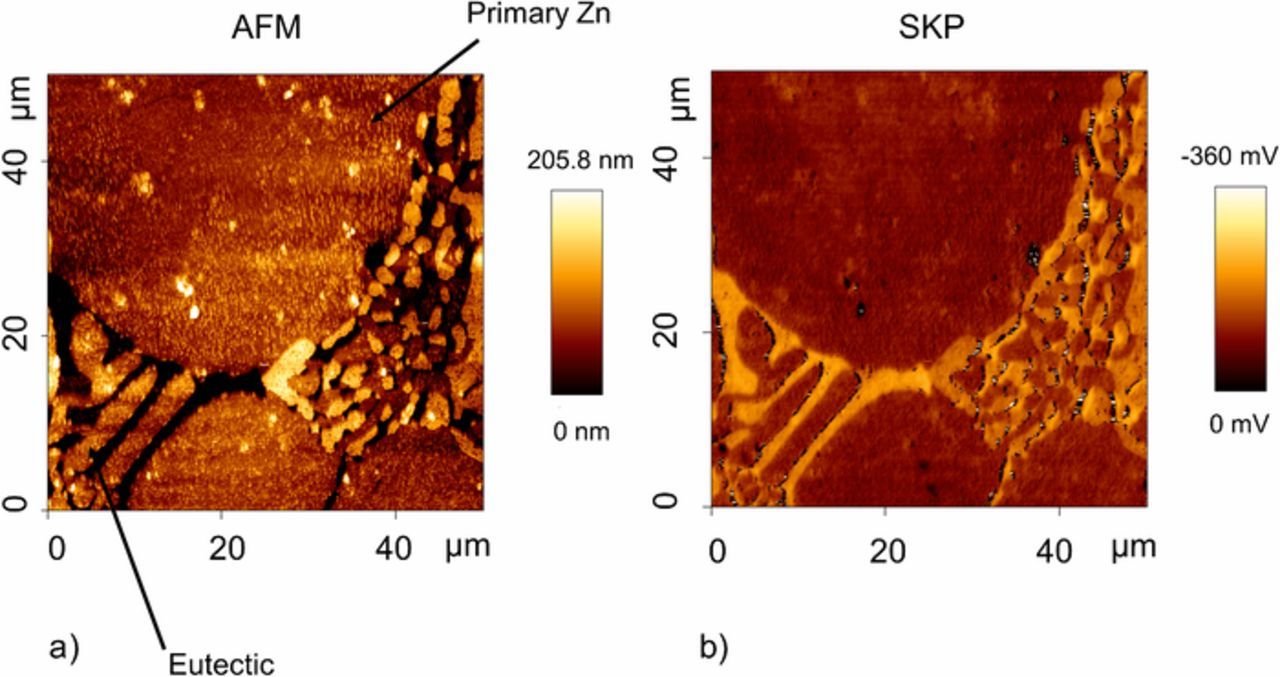
Figure 3. Topography (a) and Volta potential (b) maps of an area of ZnAlMg.
TLM
Figure 4 shows the surface of the ZAM1 (a) ZAM2 (b) and ZAM3 (c) at 8 hour intervals during in situ immersion in pH 7 0.17 M NaCl. Localized anodic features (indicated on Figure 4), which expand preferentially into the eutectic phase, are observed in all cases. The preferential corrosion of MgZn2 within the eutectic of ZAM coatings has been observed previously using this technique.7 The video of the ZAM1 surface (S1) clearly shows the spread of corrosion in the eutectic phase. Anodic attack appears to be constrained and 'deflected' by the boundaries of the less reactive zinc dendrites. The lateral spreading of the anodic features appears to increase at faster cooling rates (finer microstructures) and in the case of the alloy with the finest microstructure (ZAM3) the propagation of corrosion into the zinc dendrites does not appear to be restricted to the same degree (S2). Corrosion product rings (also labelled), which have previously been suggested to form at the boundary of the anodic and cathodic regions at which the ionic counter currents meet, are also apparent.7 It is evident from both the TLM images (Figure 4) and videos (S1 and S2), that the conductivity of the 0.17M NaCl electrolyte used throughout allows local anodes to couple with cathodic regions beyond the "halo" of corrosion product (i.e > 100 microns).
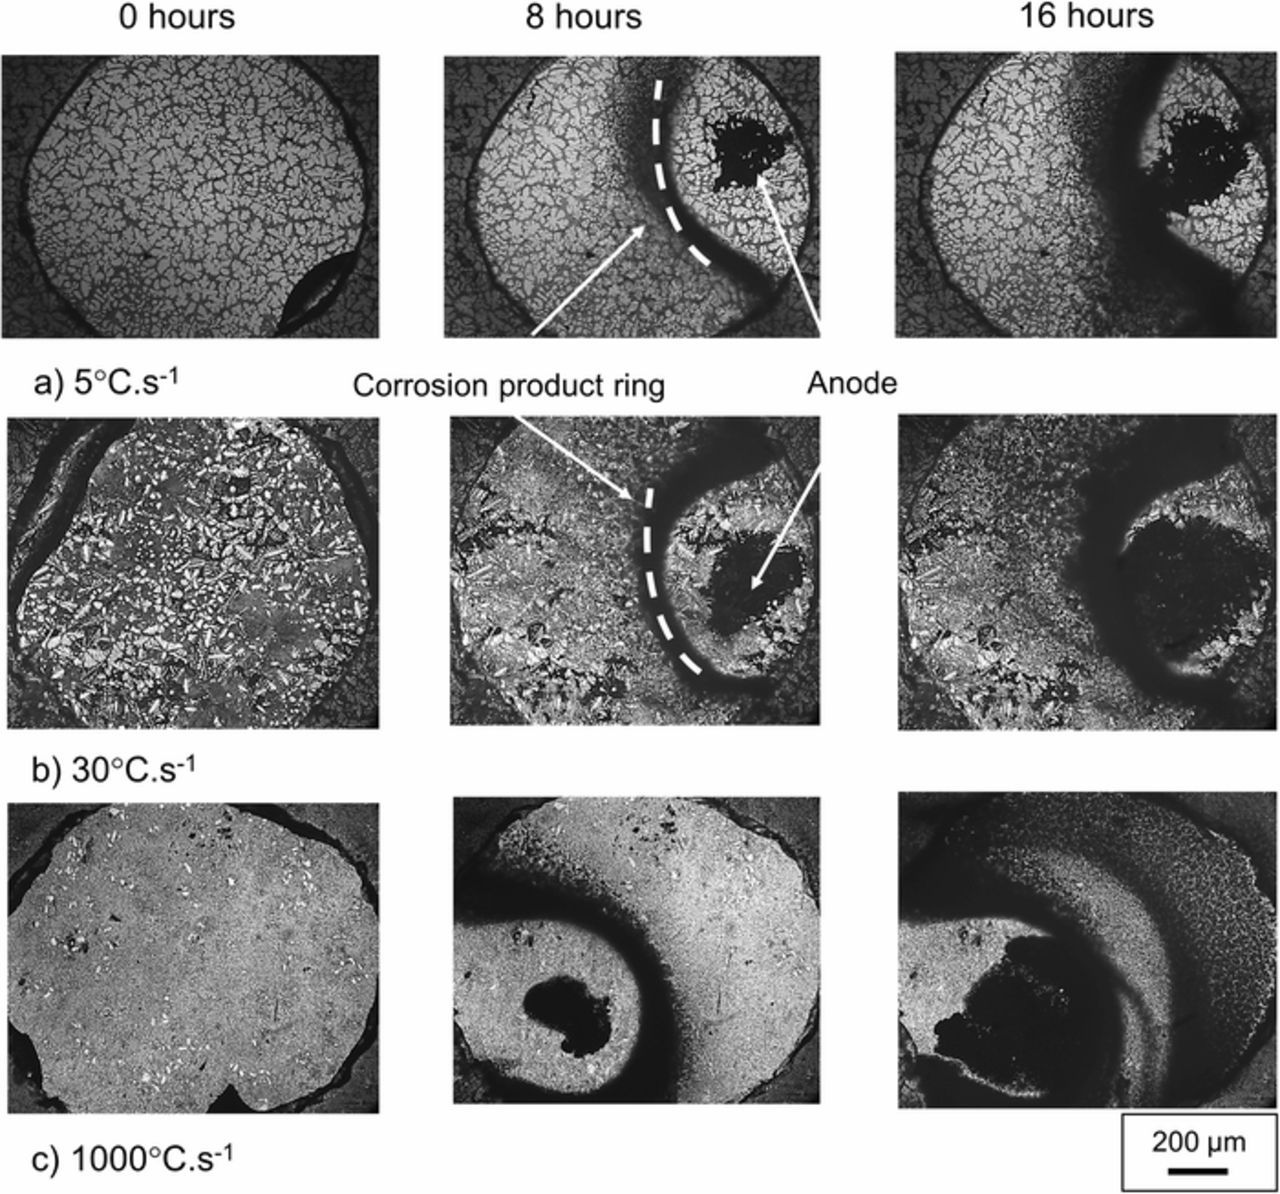
Figure 4. Optical microscope images of a.) ZAM1, b.) ZAM2 and c.) ZAM3 taken in situ under immersion conditions in pH 7 0.17 M NaCl (aq) electrolyte. Images shown were taken at 8 hour intervals.
By assuming that the corrosion spreads only laterally (across the sample surface as opposed to deep into the coating), the TLM images can be used to estimate corroded area. Figure 5 shows the corroded area obtained for each of the three samples as a function of time. The corroded area after 24 hours is shown in Table III. Confidence limits (errors) shown correspond to ± one standard deviation on the mean of three measurements. The corroded area observed in the case of the highest cooling rate (ZAM3) is almost three times greater than that calculated in the case of the sample produced using the lowest cooling rate (ZAM1). At this point it is worth mentioning that the corroded area values obtained from TLM data will only account for 2D corroded area and any differences between the samples with respect to corrosion penetration depth will therefore not be accounted for.
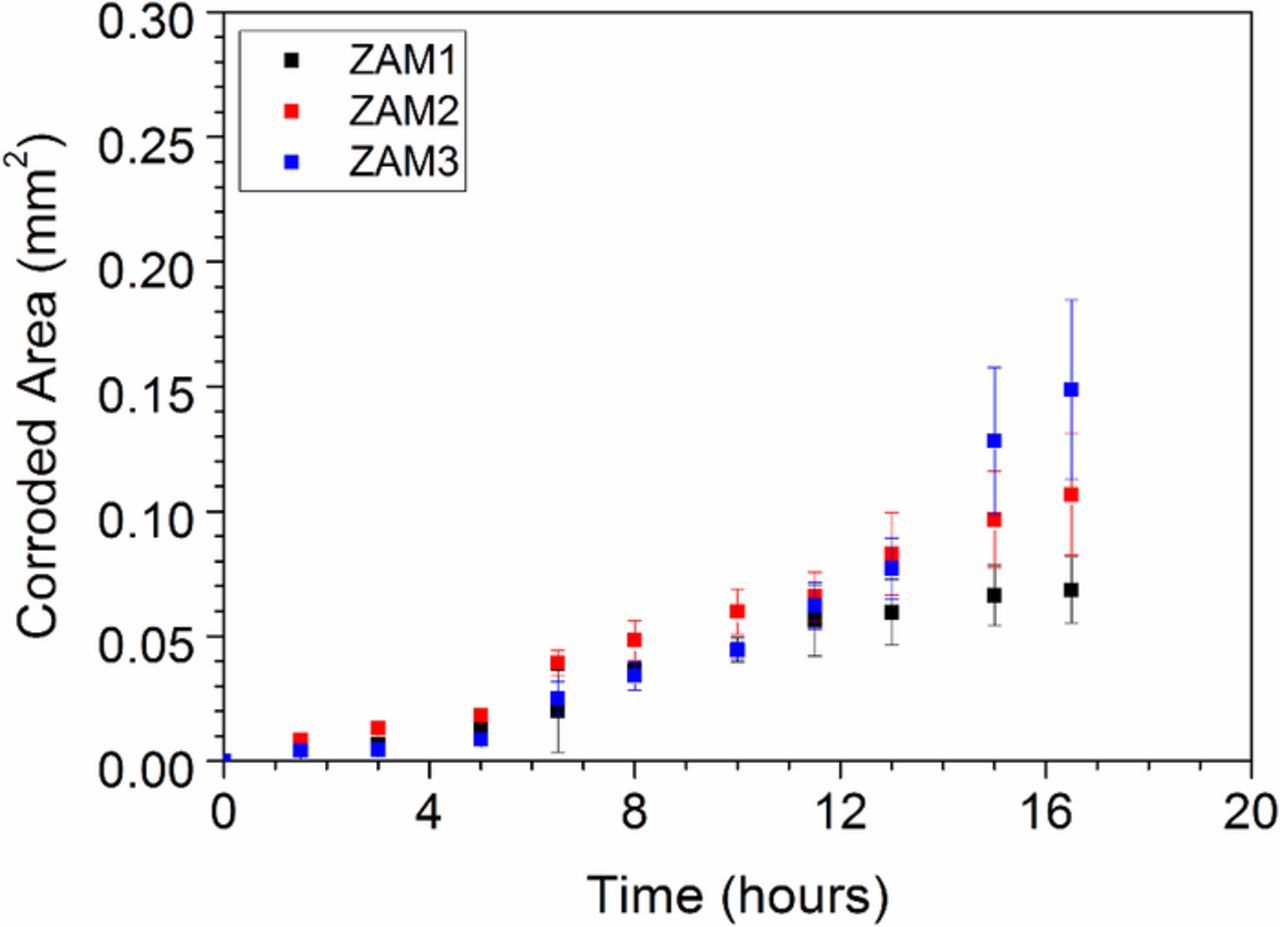
Figure 5. TLM derived corroded area as a function of time for ZAM1, ZAM2 and ZAM3 samples immersed in pH 7 0.17 M NaCl (aq) electrolyte.
Table III. TLM derived corroded area of ZAM1, ZAM2 and ZAM 3 after 16 hours of immersion in pH 7 0.17 M NaCl.
| Sample | Corroded Area (mm2) |
|---|---|
| ZAM 1 | 0.07 ± 0.01 |
| ZAM 2 | 0.10 ± 0.02 |
| ZAM 3 | 0.15 ± 0.04 |
The physical size of a typical anode is less than the instrumental whm (∼250 μm) of the SVET. However, the net anode – net cathode spacing (that between the anode and corrosion product ring) is much greater, and would be easily resolved by SVET. As such, the SVET can be used to accurately measure corrosion current with high efficiency (ϕ→1)33 and a corroded volume can be obtained using Faraday's law (Equation 3).
SVET
Figure 6 shows the SVET derived surface plots of the normal current density above the surface of ZAM1 (a), ZAM2 (b) and ZAM3 (c) freely corroding in pH 7 0.17 M NaCl. The areas associated with positive current density values are shown in red and represent localized anodic corrosion features reminiscent of those observed using TLM (Figure 4). The jz(x, y) peaks observed exhibit whm values of between 300 μm and 1500 μm, which are all greater than the instrumental whm (theoretical whm + electrical size of probe 260 μm). We can therefore be confident that the localized anodic features visible in the maps are generally larger than point current sources and that we are working within the SVET limitations. The negative cathodic current (blue) is distributed evenly across the remainder of the sample surface. The anodic features grow laterally in size, and the degree of this spreading increases with increasing cooling rate, this finding being consistent with results obtained using TLM. Figure 7a shows SVET derived surface maps of the distribution of normal current density jz above the surface of ZAM1 (5°C.s−1) and ZAM3 (100°C.s−1) samples. The maps shown were obtained after 16 hours of immersion in 0.17 M NaCl but are used here to show the region from which data was obtained at each time point shown in b.) and c.). The jz values recorded along axis X-X' in the case of ZAM1, and Y-Y' in the case of ZAM3, are shown at 4 hour intervals in Figure 7b. For ZAM1 coatings the lateral size of the anodic region increases from ca. 0.5 mm to ca. 1.5 mm after 12 hours. After 12 hours the maximum value of jz (ca. 6.5 A.m−2) is observed, after which any further lateral spreading is limited. For ZAM3 coatings the lateral size increases from ca. 1 mm after 4 hours to ca. 2 mm after 12 hours, after which the maximum jz of ca. 4 A.m−2 is recorded. After 12 hours the value of jz falls rapidly and deactivation is observed in the center of the anodic feature. Figure 7c shows the corresponding penetration depths and will be discussed in further detail later.
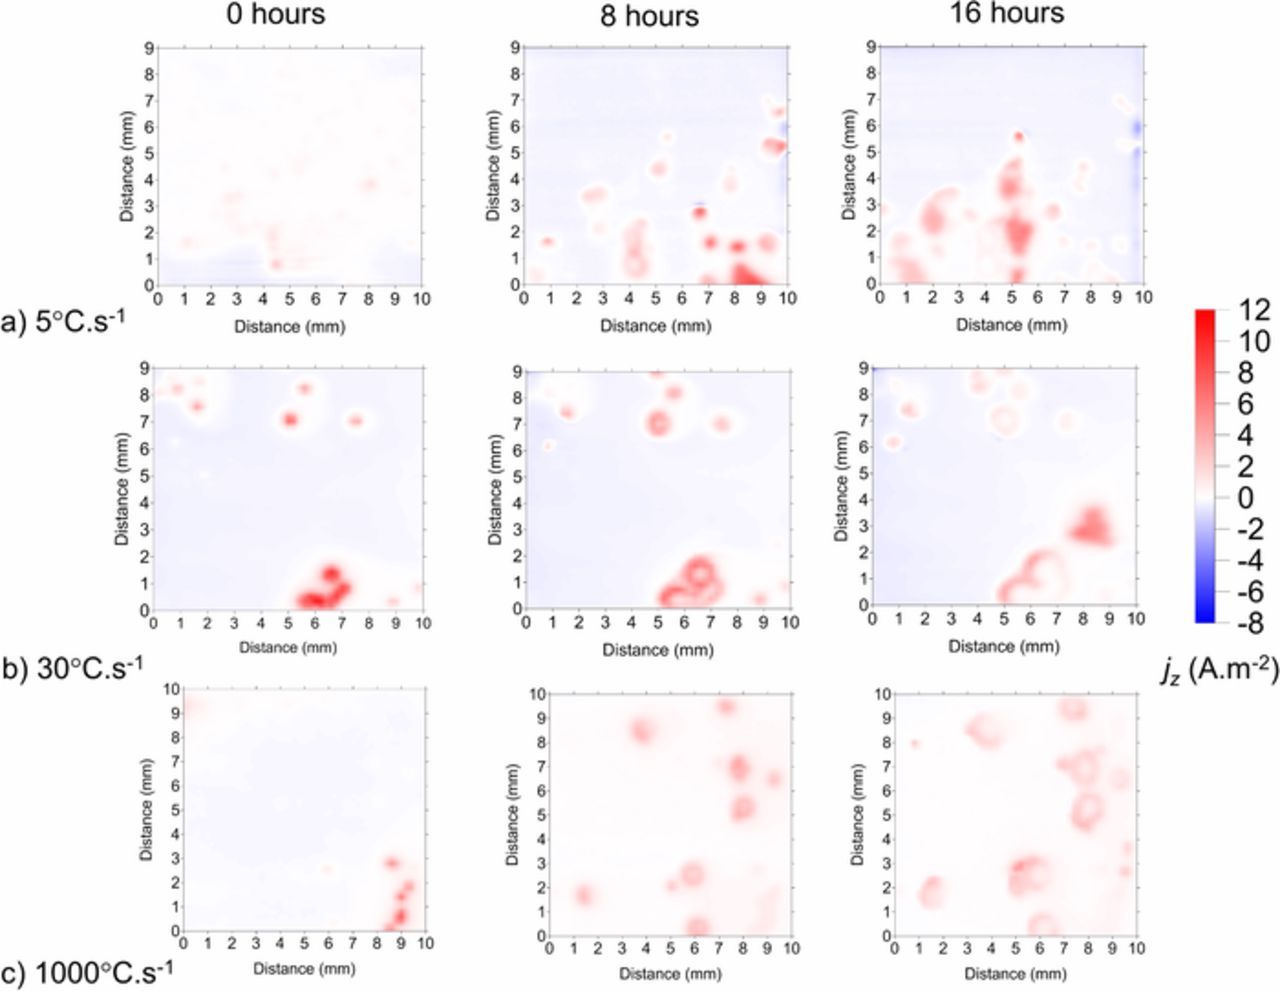
Figure 6. SVET derived surface maps showing the distribution of normal current density jz above a a.) ZAM1, b.) ZAM2 and c.) ZAM3 sample freely corroding in pH 7 0.17 M NaCl (aq) electrolyte.
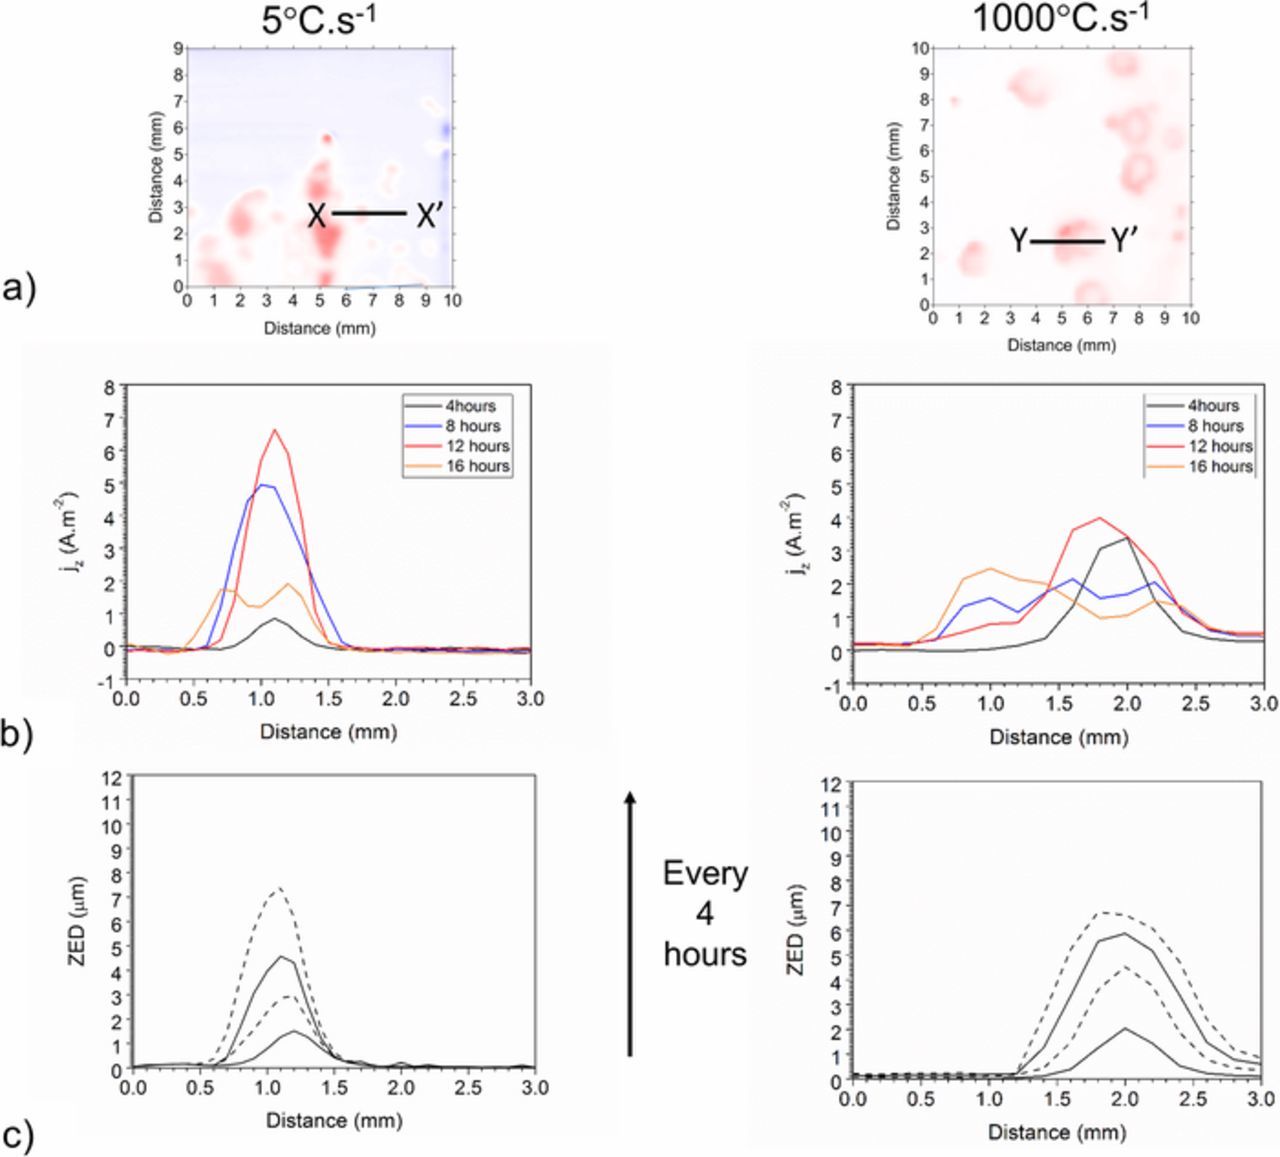
Figure 7. a.) SVET derived surface maps showing the distribution of normal current density jz above the ZAM1 and ZAM3 sample surface after 16 hours of immersion in 0.17 M NaCl. b.) Current density recorded along axis X-X' (ZAM1) and Y-Y'(ZAM3) and c.) penetration depth along axis X-X' (ZAM1) and Y-Y' (ZAM3).
The total mass loss over the 16 hour experimental time period was calculated by numerical integration (Equation 1) of all the anodic jz(x, y) values over the sample area for each hourly scan. The values obtained after 16 hours (assuming all mass is lost as zinc and scaled to an area of 1 m2) is given in Table IV. Confidence limits (errors) shown correspond to ± one standard deviation on the mean of three measurements. The mass lost from each of the three sample variations is comparable (ca. 5 g.m−2) after a 16 hour period. Similarity in mass loss values is consistent with corrosion occurring in a highly corrosive environment, such as NaCl, which is expected to be controlled by the rate of oxygen diffusion.37 The comparable rates obtained are therefore a result of using the same working electrode area for all samples.
Table IV. SVET derived mass loss from ZAM1, ZAM2 and ZAM 3 after 16 hours of immersion in pH 7 0.17 M NaCl.
| Sample | Mass Loss (g.m−2) |
|---|---|
| ZAM 1 | 4.14 ± 0.33 |
| ZAM 2 | 5.16 ± 2.62 |
| ZAM 3 | 4.60 ± 1.39 |
Despite the similarity in mass lost from all three samples, anodic sites appear to be spread over a greater area, and are associated with lower jz values in the case of higher cooling rates. These findings are indicative of corrosion being less penetrating in the case of alloys produced using faster cooling rates.
The influence of cooling rate, and resulting microstructure, on the penetrative depth of corrosion was subsequently investigated further. The use of topographical measurements, made post immersion, were not considered suitable for such a study due to the non-uniform nature of MgZn2 de-alloying which occurs during ZAM corrosion.7 The depth of corrosion was therefore calculated, semi quantitatively, using data obtained by SVET.
As discussed previously, the SVET records the normal component of current flux density in the plane of scan jz(x, y). The charge per unit area (C.m−2) passing vertically (normally) through the plane of scan, q(x, y) can be thought of as the faradaic charge density and is given by Equation 4 where t is the total immersion time and n is the number of scans.
![Equation ([4])](https://content.cld.iop.org/journals/1945-7111/166/11/C3147/revision1/d0004.gif)
At this point it is important to point out that although q(x, y) is an absolute value the jz(x, y) value, with which it is associated, is recorded at a scan height (h) of 100 μm and it should not be considered a surface charge density.
Equation 4 was used to calculate values of q(x, y) for each of the 16 maps obtained during hourly scanning. Maps of the distribution of total q(x, y) over the sample surface are shown in Figures 8a–8c. Points of q(x, y) maximum are generally considered to be associated with persistent or stable sites of local anodic attack, and can be identified from the maps by eye. The mass loss per unit area m(x, y) can be calculated for each q(x, y) maximum using Faraday's law.
![Equation ([5])](https://content.cld.iop.org/journals/1945-7111/166/11/C3147/revision1/d0005.gif)
where M is the atomic weight of zinc (65.38 Da), n is the valence of metal ions (2), F is the Faraday constant. In order to better visualize the relationship between the SVET charge density integral and the extent of local attack we will define a quantity ZED (zinc equivalent depth). This is the thickness of zinc calculable using Equation 6, where D is the density of the metal (7.14 g.mL−1), assuming uniform dissolution. However, it should be noted that ZED does not correspond to a directly measurable topographical depth in corroded ZAM, which does not dissolve uniformly (as shown in Figure 4 and S1 and S2).
![Equation ([6])](https://content.cld.iop.org/journals/1945-7111/166/11/C3147/revision1/d0006.gif)
In all cases, the value of ZED calculated will be conservative (underestimated). Values of ZED will therefore approach the true value when the anodic feature has a diameter significantly greater than the scan height (100 μm). Under these circumstances the anodic current flux will tend to cut the plane of scan in an approximately normal fashion (Figures 1b) and ϕ→1.
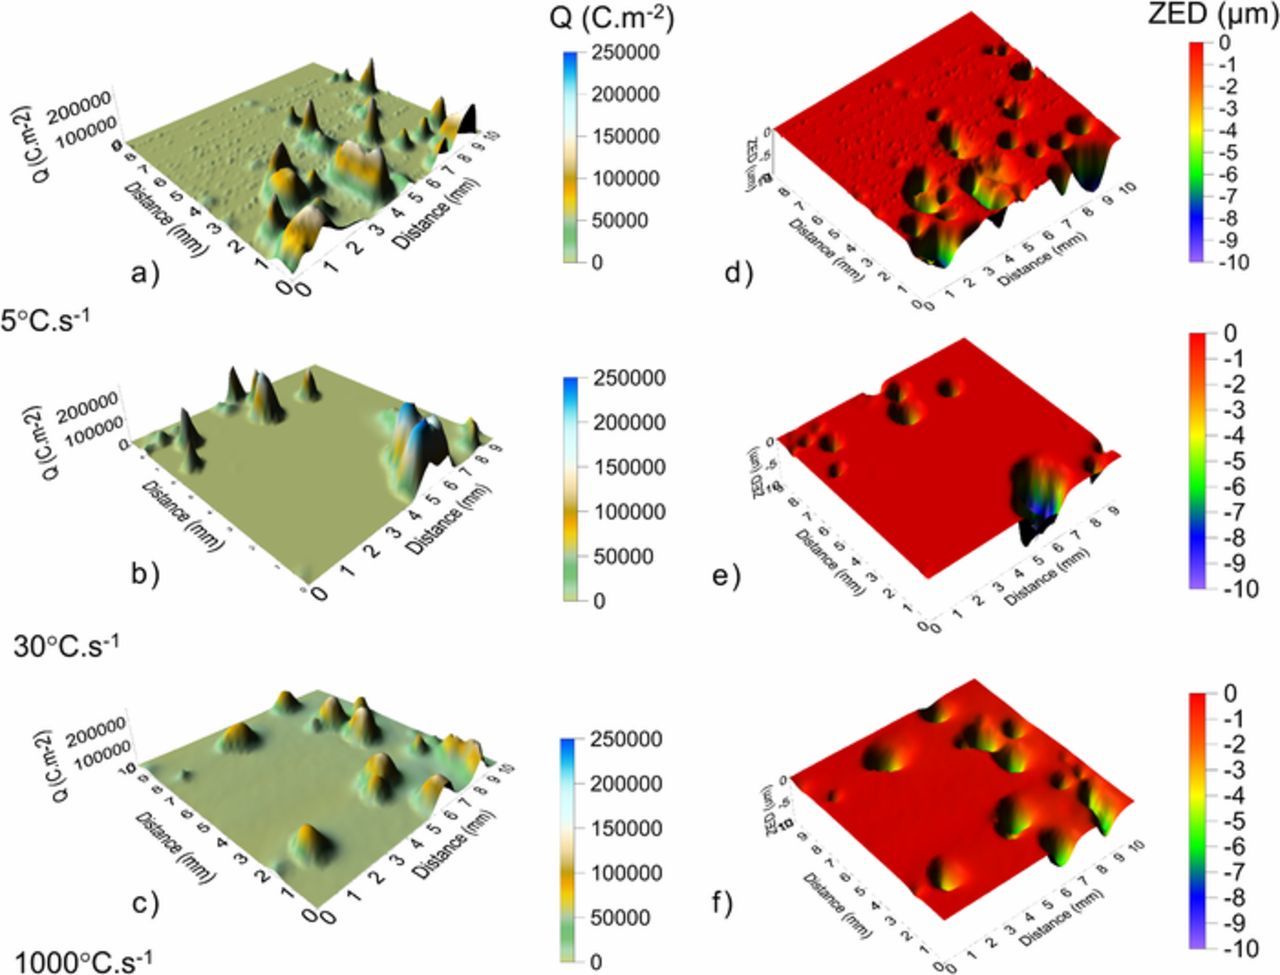
Figure 8. SVET derived surface maps showing the distribution of normal charge density running normally through the plane of scan, q(x, y), for a.) ZAM1 and b.) ZAM2 and c.) ZAM3 and zinc equivalent depth ZED for d.) ZAM1 and e.) ZAM2 and f.) ZAM3.
Maps of ZED (Figures 8d–8f) obtained using Equation 6 are showed alongside the q(x, y) from which they are derived (a-c). The lateral size of features is greater, and ZED values lower, in the case of ZAM 3 (Figures 8c, 8f). It is important to point out that the values of ZED shown by these maps do not correspond to topography of the sample.
The values of ZED (calculated using Equation 6) along axis X-X' in the case of ZAM1, and Y-Y' in the case of ZAM3, are also shown in Figure 7c. In the case of ZAM1 the penetration depth increases almost uniformly with time. In comparison, change in penetration depth in the case of ZAM3 decreases substantially with time.
The distribution of the q(x, y) and ZED values calculated are shown in Figure 9. By assuming that the data follows a normal distribution in all cases, the mean values of q(x, y) and ZED can be obtained. For both ZAM1 and ZAM2 the mean value of ZED is ca. 6 μm and values of up to 9 μm are recorded. In comparison, all ZED values fall below 5.5 μm for ZAM3 and a mean value of ca. 4.5 μm is observed.
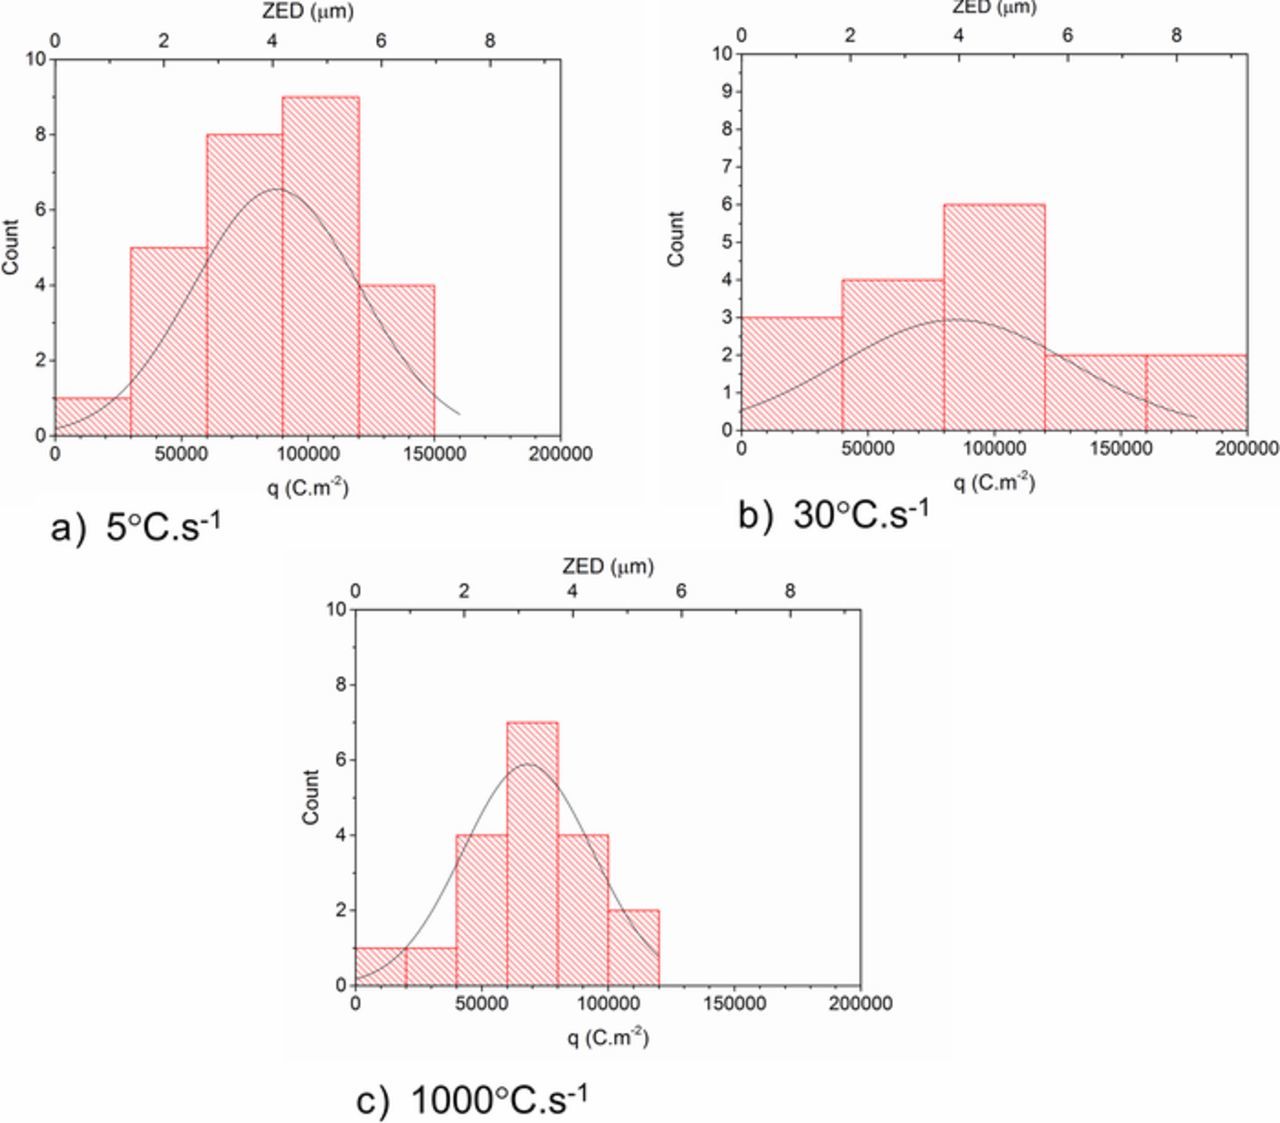
Figure 9. Distribution of the q(x, y) and ZED associated with stable anodic features visible on the surface of a.) ZAM1, b.) ZAM2 and c.) ZAM3 samples after 16 hours of immersion in pH 7 0.17 M NaCl (aq) electrolyte.
Discussion
The ZED values observed in the case of alloys with a fine microstructure are consistent with an earlier study in which it was found that deep pit like metal dissolution occurred in ZAM alloys with a coarse microstructure, whereas shallower anodic pits were found in alloys of a finer microstructure.38 It has previously been proposed, in explanation of this phenomenon, that Mg is more uniformly distributed in the case of fine microstructures, and that the availability of Mg2+ in the surface electrolyte allows for the efficient reaction with OH− (produced at the cathode) to produce magnesium hydroxide.18,24 It has further been proposed that an increase in fineness of the microstructure may also result in a more uniform distribution of electrolyte pH, that is to say it reduces the excursion to high pH values at the cathode, and the low pH values at the anode.18 The resultant neutral to slightly alkaline pH values facilitate precipitation of a denser, more adherent zinc corrosion product18
The work described here expands upon these proposals and the following mechanism is suggested. For all three samples, local anodes expand preferentially into the eutectic phase, this being consistent with the galvanic dissolution of the more active MgZn2 component, and supported by the SKPFM data shown in Figure 3.7,21–22 In this respect Mg is acting principally to activate the phase which forms the anode in a galvanic couple (with the corollary that primary zinc is made cathodic). Under the (relatively concentrated) electrolyte conditions used during these experiments, an ohmic limitation on the distance over which phases can couple is not predicted or observed (Figure 4) and it has previously been shown that the localization of corrosion on zinc is only ohmically controlled at [NaCl]< 1 wt%.39 Under these circumstances, the location of the anode and cathode will be determined by only the local composition of the metal surface and local electrolyte composition. Generally, it is the corrosion product solubility which determines its ability to precipitate. The value of this constant is determined by local electrolyte pH as well as the concentration of ions available within the solution. For example, a pH change may occur as a result of OH− ion production (at the cathode) or H+ production which occurs as a result of the hydrolysis of metal ions.
The cathodic ORR will tend to increase pH near the metal surface, to a value which disfavours anodic attack, by lowering the solubility of both Mg and Zn (hydr)oxides. In comparison, the anolyte, which forms as a result of eutectic phase dissolution, is (still) mainly composed of zinc chloride salts. Zinc cations are slightly acidic (pKa1 = 9)40 and will act to decrease the local pH and the local alkalization which occurs as a result of the ORR. Decreasing the electrolyte pH only slightly (from 11 to 9.2) has previously been shown to reduce the concentration of chloride ions necessary for pit initiation from 105 ppm to 70 ppm.41 A decrease in pH would result in the increased solubility of surface hydr(oxides) and autocatalytic propagation of anodic attack. (Note that Mg2+ (pKa1 = 11.4)40 would not behave in this way). This mechanism is supported by the findings of an in-situ TLM study of the aqueous corrosion of Zn–(1–2 wt% Mg)–(1–2 wt% Al). 1% Phenolpthalein (which is colorless < pH 8 and pink > pH 8) was added to the 0.1% NaCl to demonstrate the establishment of a pH gradient with a circular area of pH<8 surrounding the dominant anodic site bordered by an area of pH>8.23
In a different piece of work, a scanning zinc disk electrode was used to investigate the spatial distribution of Zn2+ during the corrosion of Zn/steel galvanic couple. Phenolphthalein was added to the 0.01 M NaCl electrolyte solution and zinc corrosion product formed at the region between the pink (alkali) and clear (neutral, acidic) regions. Zn2+ ions were believed to suppress the increase in pH (caused by the cathodic ORR) on the steel surface nearest the zinc.42 In a similar study, in-situ current profiles were measured over a galvanized steel cut edge and numerical simulations were used to model the occurrence of electrochemical processes. The results were used to show that the ORR was strongly inhibited in the vicinity of zinc.43 It has been concluded that the increased acidity, which occurs as a result of zinc metal dissolution and cation hydrolysis, can undermine the formation of a passive layer on zinc.44
The lateral propagation (spreading) of anodic attack is then produced as a result of the lateral spreading of the anolyte, primarily, through the process of diffusion. This propagation will tend to become arrested upon encountering primary zinc dendrites, firstly, because primary zinc is cathodically protected by galvanic coupling to the eutectic phase, and secondly, because the alkalinity produced through the ORR on primary Zn will tend to oppose the spread of anodic attack. The lateral spreading of anodic attack will be able to propagate "beyond" (to the other side of) the primary zinc dendrite only if the dendrite is sufficiently small (fine microstructure), otherwise it will have to propagate around (coarse microstructure). The reason for this dependence on dendrite size is explained below.
The diffusion reaction problem in the region of ultra-micro electrodes (UME), with length scales similar to ZAM microstructural features, has been described in depth elsewhere.45 Here we will use the simplest available description of the time-independent (steady state) hemispherical diffusion problem around the local anode. This has the advantage of yielding simple analytical solutions.
In the case of small anodic areas, anolyte diffusion into the surrounding electrolyte will closely follow a (hemi)spherical diffusion problem (schematically shown in Figure 10). If in the hollow hypothetical sphere (a ⩽ r ⩽ b) the surface r = a is kept at constant concentration (C1), and r = b at a constant concentration (C2), then the steady state solution of the relevant differential equation predicts that the concentration (C) of aggressive species decreases with 1/r according to Equation 7.46 Figure 11a shows  as a function of
  for the case that C1 is normalized to 1 and C2 is 0 (as shown schematically in Figure 11). The critical factor in determining the fall off of C is
  , that is the number of multiples of the inner radius (in our case the radius of the anode). Equation 7 and Figure 11a can thus be used to show how varying the size (width) of the primary zinc dendrite affects the steady state concentration of aggressive species at distance r away from the center of the anode.
![Equation ([7])](https://content.cld.iop.org/journals/1945-7111/166/11/C3147/revision1/d0007.gif)
The minimum dendrite size needed to prevent trans-propagation (i.e. the initiation of anodic eutectic dissolution on the far side of a dendrite) was obtained by visually observing instances in the TLM images. One such example is shown in Figure 11b. The minimum dendrite size obtained was (15±5) μm. The physical size of an anode cannot be resolved by SVET, and it is unknown whether the black regions in TLM images relate solely to active regions and to what extent once-active regions are incorporated. However, in the case that the width of the dendrite is similar to a, it can be shown that the concentration of the aggressive anolyte C falls to ∼ 50% C1. This is best shown in Figure 11b for the case that the dendrite width is the same as the anodic radius (a). It is shown that when  then C, at the far side of the zinc dendrite, will be ∼ 50% C1. It is therefore predicted that if this calculated value is above a certain critical concentration, anodic attack will commence on the far side of the dendrite (trans lateral propagation). In the case that it is not, the dendrite will effectively 'block' the trans lateral propagation of anodic attack, this in turn resulting in the increased likelihood of contiguous propagation (Figure 11b) or coating penetration.
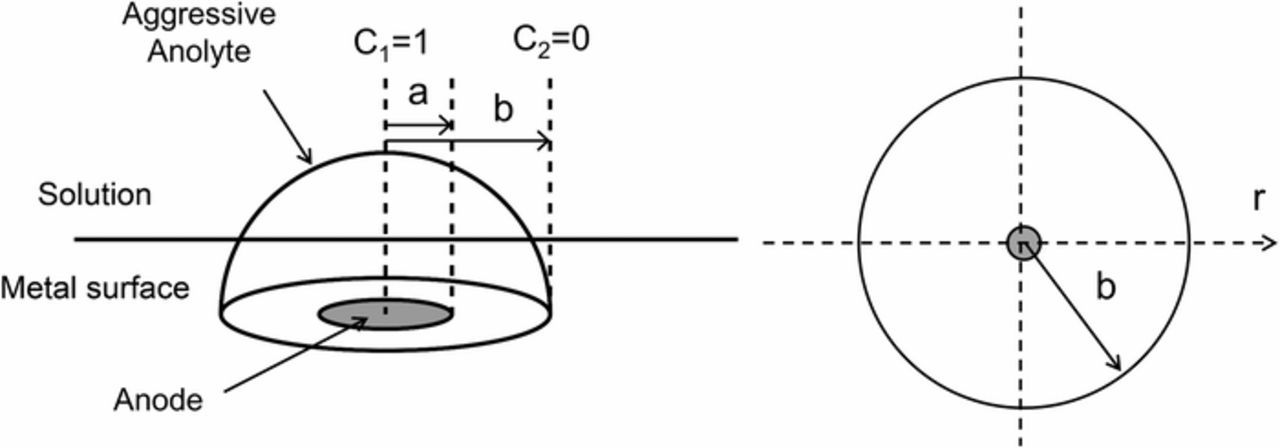
Figure 10. Schematic showing the (hemi)spherical diffusion problem in the case that aggressive anolyte diffuses into the solution, where a is the anode radius at which the anolyte concentration is C1 and b is the position at which the concentration C2 falls to zero.
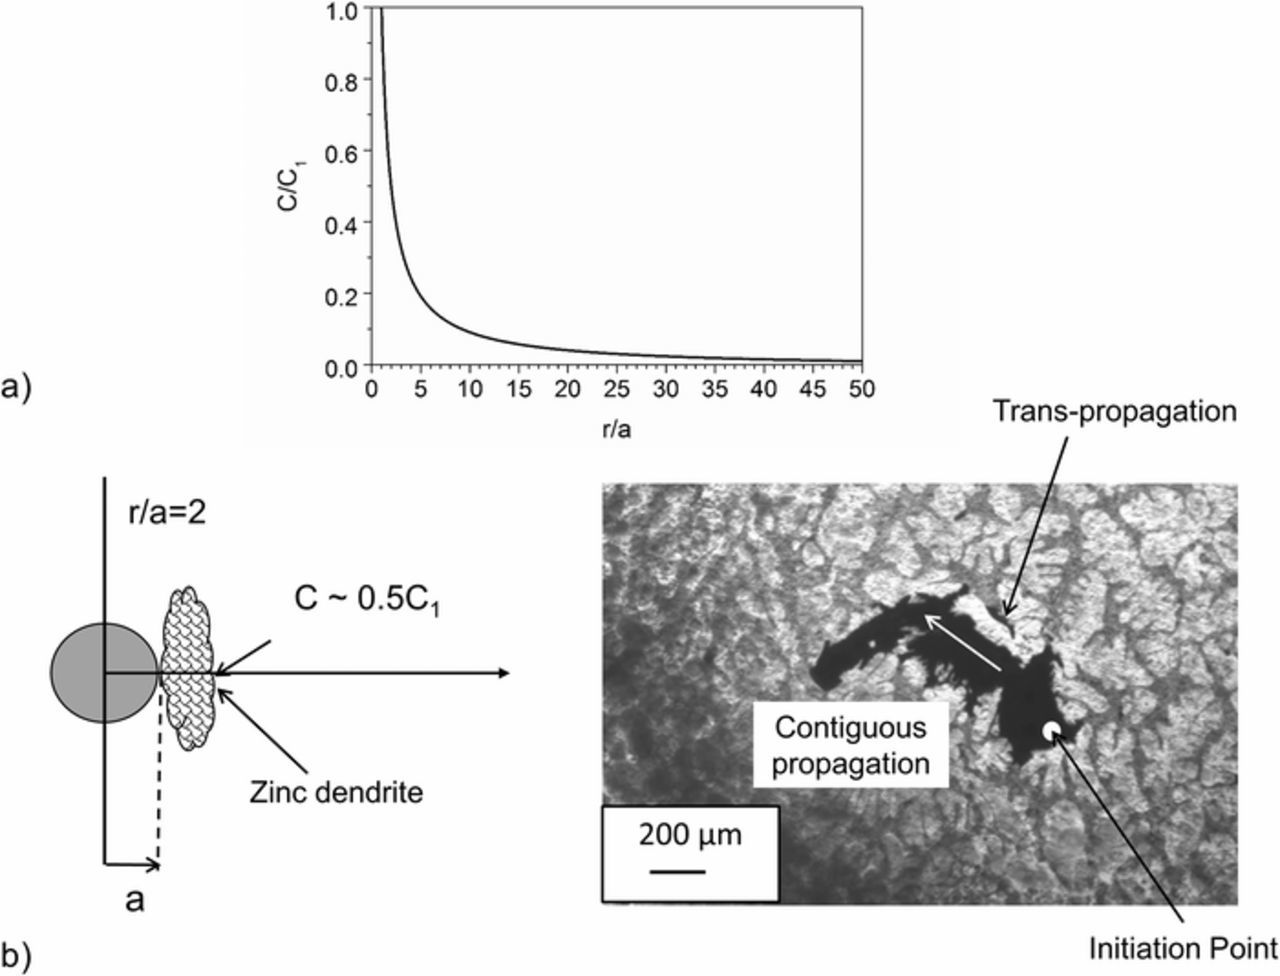
Figure 11. a.) Steady state solution for the hemi(spherical) diffusion problem showing that the concentration, C, of aggressive species decreases with 1/r and b.) The value of C in the case that r/a = 2 alongside a TLM image showing the minimum dendrite size to prevent trans-propagation.
In the case of the lowest cooling rate (ZAM1) the less reactive, primary zinc dendrites are large in size (∼80 μm) and, as TLM images (Figure 4) and videos (S1) show, act as effective physical barriers which constrain anodic attack (Figure 12a). Contiguous propagation travels slower than trans-propagation (lateral spreading) meaning that metal dissolution penetrates further into the coating. In comparison, for the highest cooling rate (ZAM3), the average size of a primary zinc dendrite is ∼ 2.5 μm and the anolyte travels over the necessary distance to reach the more reactive eutectic, where anodic dissolution can occur (Figure 12b).
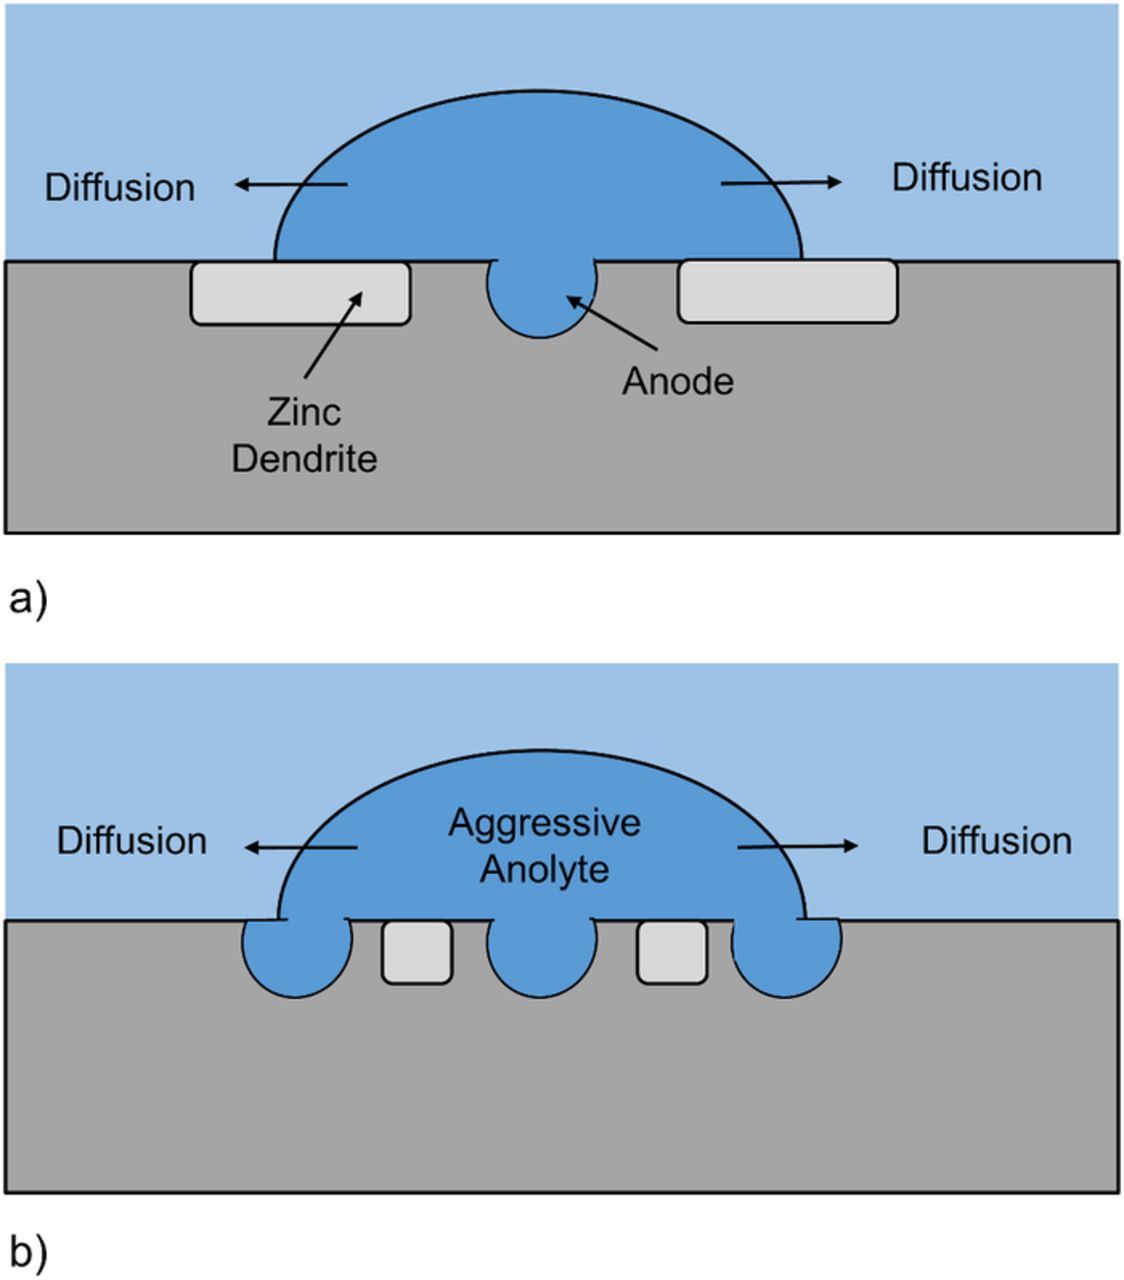
Figure 12. Schematic comparing the mechanism of localized corrosion observed in the case that Zn2.7Al1.5Al is produced using a.) slow cooling rates and the large dendrites formed are able to 'block' trans lateral propagation and b.) fast cooling rates for which the smaller dendrites are unable to prevent trans lateral propagation.
It should, at this point, be considered that the stochastic nature of corrosion is not accounted for, for example contiguous corrosion may still occur even when dendrite size is below the minimum needed to prevent trans-propagation, due to other factors such as incomplete surface films. Nevertheless, the results obtained here are consistent with previous work during which chemical factors in solution were found to play an important role in determining the ability of a localized corrosion features to either develop into a pit or spread out (leading to general attack).47
Conclusions
Three different Zn-2.7Al-1.5Mg coatings were produced using a hot dip simulator. The cooling rate of the molten metal, following hot dipping, was varied in such a way that each coating had a different microstructure. A combination of SVET and TLM were used to investigate the effect of microstructure on the corrosion properties and showed that;
- In all cases the ZAM microstructure comprised: primary zinc dendrites and eutectic phases consisting of primary zinc dendrites (<0.1 wt% Al), a binary eutectic (Zn rich Al phase and MgZn2 and a ternary eutectic (Zn, Zn rich Al phase and MgZn2).
- As ZAM cooling (solidification) rate was increased from 5°C.s−1 to 1000°C.s−1 a significant refinement was observed for all phases in the microstructure.
- When immersed in 0.17 M aqueous NaCl, TLM showed that anodic dissolution always initiated within the MgZn2 lamellae with thin eutectic phases. It then spread laterally over the ZAM surface by preferentially following MgZn2 rich eutectic regions.
- TLM also showed that in coarse microstructures (produced at slow cooling rates) large primary zinc grains tend to deflect and constrain lateral anodic spreading. Conversely, in fine microstructures (produced at high cooling rates) smaller primary zinc grains do not. Consequently, lateral spreading rate increases with microstructural refinement.
- SVET measurements, and numerical calculation of the anodic charge integral, indicate that global corrosion rates are similar for all three ZAM measurements.
- However, SVET also indicates that increased lateral spreading in the refined microstructures coincides with lower rates of through-coating depth penetration. Depth penetration (expressed as zinc equivalent depth, ZED) after 16 hours of immersion fell from a mean value of 4 μm for the 5°C.s−1 to 3.2 μm for the 1000°C.s−1 cooling rate.
- On the basis of the above, it is likely that substrate (steel) exposure will occur later in the case of more refined ZAM microstructures. This is a finding which could be of interest when a desire exists to reduce coating thickness.
It has been proposed that anodic dissolution produces aggressive species in solution (an aggressive anolyte) comprising hydrolysable zinc chloride complexes. The lower local pH and higher Cl− activity associated with this anolyte are responsible for the localization and propagation of anodic attack. When the less reactive (primary zinc) grains in the microstructure are physically large (coarse microstructure) the aggressive anolyte species have to diffuse further to initiate attack on reactive MgZn2 on the far side of the primary grain (trans-propagation). Under these circumstances anodic attack is more likely to be constrained to the near side of the previous grain (continuous propagation). As microstructural refinement increases, the balance shifts from contiguous toward trans-propagation of anodic attack, with consequent increases in lateral spreading rates.
Acknowledgments
The authors acknowledge the financial support of the RFCS (Research Fund for Coal and Steel, grant number: RFSR-CT-2015-00011) support and all the partners: ArcelorMittal (France), OCAS (Belgium), Max Planck Institut (Germany), Tata Steel Europe (Netherlands), Voestalpine (Austria) for the supply of samples; Chimie ParisTech (France), University of Chemistry and Technology in Prague (Czech Republic) and Dominique Thierry and Nathalie LeBozec of Institut de la Corrosion, France for coordinating the project.
ORCID
N. Wint 0000-0002-9229-5728