
Abstract
Understanding and controlling the electrochemical deposition of lithium is imperative for the safe use of rechargeable batteries with a lithium metal anode. Solid block copolymer electrolyte membranes are known to enhance the stability of lithium metal anodes by mechanically suppressing the formation of lithium protrusions during battery charging. Time-resolved hard X-ray microtomography was used to monitor the internal structure of a symmetric lithium-polymer cell during galvanostatic polarization. The microtomography images were used to determine the local rate of lithium deposition, i.e. local current density, in the vicinity of a lithium globule growing through the electrolyte. Measurements of electrolyte displacement enabled estimation of local stresses in the electrolyte. At early times, the current density was maximized at the globule tip, as expected from simple current distribution arguments. At later times, the current density was maximized at the globule perimeter. We show that this phenomenon is related to the local stress fields that arise as the electrolyte is deformed. The local current density, normalized for the radius of curvature, decreases with increasing compressive stresses at the lithium-polymer interface. To our knowledge, our study provides the first direct measurement showing the influence of local mechanical stresses on the deposition kinetics at lithium metal electrodes.
Export citation and abstract BibTeX RIS

This is an open access article distributed under the terms of the Creative Commons Attribution 4.0 License (CC BY, http://creativecommons.org/licenses/by/4.0/), which permits unrestricted reuse of the work in any medium, provided the original work is properly cited.
There is increasing interest in the transport of ions at lithium metal electrodes due to the current focus on increasing the energy density of rechargeable lithium batteries.1 In theory, replacing a graphite electrode with lithium metal in a lithium-ion battery will result in a 40% increase in gravimetric energy density.2 Battery chemistries with energy densities that are substantially larger than that of the lithium-ion chemistry, such as lithium-sulfur and lithium-air, rely on the availability of a rechargeable lithium metal anode. Electrodeposition of metallic films is also an integral step in the manufacture and use of a broad range of devices spanning consumer electronics to energy storage.3–5 Conventionally, in both batteries and electrochemical processing, metals are electrodeposited from liquid electrolytes.6–8 However, recent advances in polymer and ceramic electrolytes have allowed for the deposition (and stripping) of metals from electrolytes with a high modulus.9–11 These stiff electrolyte materials influence the mechanism of metallic electrodeposition. Notably, stiff polymer electrolytes are known to suppress the growth of dendrites in batteries containing a lithium metal anode.12,13 Suppressing the growth of protruding metallic lithium structures, like dendrites and globules, is imperative for the safe and reliable use of high energy density, rechargeable batteries with metallic anodes.14,15
Numerous experimental studies have addressed the issue of dendrite growth in lithium batteries.8,16–25 While the increase in current density in the vicinity of a dendrite or globule is, perhaps, the most important driving force in the process, this increase has thus far escaped experimental scrutiny. To our knowledge, only the average current density has been reported in previous studies on cells containing lithium metal electrodes.26–28 In this study, we use time-resolved X-ray microtomography to quantify the topology of the lithium metal electrode and local current density over the entire electrode of a symmetric lithium-lithium cell with a solid block copolymer electrolyte as a function of charge passed. We naturally focus our attention on regions within the cell in the vicinity of growing globules. Our experiments also enable determination of the local strain in the solid polymer electrolyte, which in turn enables estimation of local stress. We present data on the interplay between local stress and lithium deposition in the vicinity of the protrusion tip.
Conventionally, when one models lithium dendrite growth, the projected area, or cross-section of the dendrite at the interface between the electrode and the electrolyte, is assumed to stay constant as it propagates through the electrolyte, like a lengthening needle.29–31 In the case of globule growth through a solid electrolyte, we show that this projected area grows as the globule propagates through the electrolyte. This increase in area blunts the tip, significantly slowing the vertical growth rate of the lithium globules. Consequently, increasing the electrolyte modulus not only suppresses globule growth by slowing deposition kinetics at the globule tip, but also results in an increased radius of curvature at the tip, which leads to slower growth through current delocalization.
This paper is part of a series on the study of lithium-lithium cell cycling by X-ray microtomography. After initially detecting the formation of lithium globules in cycled cells using ex situ X-ray microscopy, a variety of experiments were performed to determine the influence of parameters like temperature and charging time on the globule morphology in cells using a solid block copolymer electrolyte membrane.13,32,33 Next, cells were designed to fit into the X-ray microtomography beamline for stop-motion characterization of globule growth. A qualitative description of these results was reported previously.2 The present study seeks to quantify the kinetics of lithium deposition on and near a globule as it grows through a solid polymer electrolyte.
Experimental
Polystyrene-b-poly(ethylene oxide) was synthesized by anionic polymerization as described previously.34,35 The molecular weight of the block copolymer was 240–260 kg/mol with a poly(ethylene oxide) volume fraction of 0.5 and a dispersity of 1.26. After its synthesis, the polymer was freeze-dried and stored in a glove box filled with argon where oxygen and water levels were controlled and remained less than 5 ppm.
To prepare an electrolyte membrane, the block copolymer was dissolved in N-Methyl-2-pyrrolidone (NMP) with lithium bis(trifluoromethane)sulfonamide salt (LiTFSI) at a concentration of 0.085 Li+ to ethylene oxide moieties. The solution was poured onto a flat surface covered with nickel foil and spread into a film using a doctor blade. The film was allowed to dry on the flat surface at 60°C overnight. At this point, the film was peeled off of the nickel foil with tweezers. The freestanding film was allowed to dry for an additional 24 hours at 90°C under vacuum in a glove box antechamber. Once dry, the 30 μm thick freestanding solid polymer electrolyte film was wrapped in nickel foil and stored in a sealed container inside of the glove box. 99.9% pure lithium metal foil was purchased from FMC Lithium. The roll of 150 μm thick foil was stored in a desiccator inside of the glove box.
Symmetric lithium – polymer electrolyte – lithium samples for stop-motion X-ray microtomography imaging were assembled as follows. First, a 13 mm diameter round metal punch was used to punch out a piece of electrolyte from the freestanding polymer electrolyte film. Three layers of lithium metal foil were stacked on top of each other on a clean piece of nickel foil to create a 450 μm thick lithium electrode backed with nickel foil. An 11 mm diameter round metal punch was used to punch out two lithium electrodes from the stack of lithium on nickel foil. The two lithium electrodes were placed on either side of the polymer electrolyte membrane. A 0.57 mm stainless steel shim was placed on one side of the sample and a 0.35 mm stainless steel shim was placed on the other side of the sample. These shims kept the sample flat, which was important for imaging. Aluminum current collector tabs were placed on both sides of the sample, and the sample was vacuum sealed in nylon and polypropylene lined aluminum pouch material.
This thick lithium electrode backed with nickel foil was helpful for stop-motion X-ray microtomography imaging because the lithium created a region of low X-ray absorption around the lithium-polymer interface. If materials that are highly absorbing of 22 keV X-rays, like nickel or stainless steel, are in the path of the X-ray beam, they tend to cause significant artifacts in the reconstructed volumes, obscuring features of interest at the lithium-polymer interface. The thick lithium electrodes moved these highly absorbing materials away from the region of interest, allowing for clear reconstructed volumes. The aluminum tabs were X-ray transparent enough to achieve good quality images even though they did block the path of the beam. The tabs were not contacted directly with the lithium foil because aluminum is known to react with lithium. The stainless steel shims sandwiching the sample were of different thicknesses so that when vacuum sealed, the lithium-polymer interface was positioned slightly above the central plane of the sample where excess pouch material from the vacuum seal may have added noise to the resulting tomography images. A series of six samples of this type were assembled.
One of the samples was cycled until it failed by short circuit using the following routine. A current of 0.175 mA/cm2 of lithium was passed for four hours followed by a 45 minute rest. Then, a current of −0.175 mA/cm2 was passed for four hours followed by a 45 minute rest. This cycling routine was repeated until the sample failed by short circuit after 32 cycles. The other five samples were then cycled in the same way but were stopped after 17 cycles. The intention was to get the samples close to failure in order to reduce the beamtime required to see the sample fail by short circuit.
At this stage, one of the five samples was imaged using hard X-ray microtomography then polarized for an additional 4.5 hours. This polarization, where charge was passed in a single direction for 4.5 hours, was repeated fourteen times with X-ray microtomography images taken at each 4.5 hour increment. The sample was then polarized for 31 hours before the next image. Finally, the sample was polarized for an additional 114 hours when it finally failed by short circuit and was imaged. All electrochemical polarization and cycling was done while the sample was maintained at 90°C in an oven. Due to limited access to the tomography instrument, stop-motion imaging was performed on only one sample. Lithium globules of similar size and shape were seen in post mortem experiments with two additional samples that were cycled and polarized in the same manner.
The sample was removed from the electrochemical cycling equipment and cooled to room temperature before each imaging session. Imaging was performed at the hard X-ray microtomography beamline at the Advanced Light Source (Beamline 8.3.2). Parameters used to image the sample are tabulated in supplementary Table 1. The largest globules were found in the final reconstructed volumes and were tracked back to the initial image where they had not yet begun to form. The image processing program Avizo was used to measure the globule height, volume, and area.
The large reconstructed volumes were cropped to contain only the globule that shorted the cell. The sequence of cropped reconstructed volumes were binarized for subsequent analysis in Matlab. The position of the bottom lithium-polymer interface was calculated in Matlab relative to a fixed reference, the bottom of the electrode. The current density, ijk, at a pixel with indexes j, k was calculated using the volume of lithium deposited, Vjk, at that pixel:
![Equation ([1])](https://content.cld.iop.org/journals/1945-7111/163/10/A2216/revision1/d0001.gif)
where ρ is the density of lithium metal, F is Faraday's constant, MLi is the molecular weight of lithium metal, a is the pixel area in cm2, and t is time. This calculation assumes that all of the charge deposited on the lithium anode is deposited in the form of lithium metal. SEI formation was assumed to occur during the conditioning cycles.
The tomography data directly yielded the displacement on the polymer electrolyte at the electrode interface. These measurements were used to determine local stresses near the lithium globule in the following manner. First, because the globule is approximately axisymmetric, a smooth, axisymmetric surface was constructed, as described in the Supplementary Information, to approximately represent the interface between the globule and electrolyte for each of the imaged states. The smoothed surface was then fit to a parabolic shape so that the slope of the curve at the globule tip was zero, consistent with the tomography images.
For each surface, a cylindrical coordinate system was defined, with the z axis coinciding with the axis of symmetry for the surface. The variable r was defined to be the perpendicular distance to the z axis. Except in the immediate vicinity of the globule, the lithium surfaces are approximately parallel planes, so the origin was taken to be the intersection of the z axis with the plane from which the globule is growing. The positive z direction was defined as the direction of globule growth.
As the system is axisymmetric and the mechanical response of the electrolyte is the phenomenon of interest, it was only necessary to solve for electrolyte displacement within any r-z plane.
The electrolyte regions in the vicinity of globules experienced severe displacements. Stresses were computed using a large-deformation formulation. The numerical implementation closely follows parts of the work detailed in a previous paper.36 An overview of the mathematical formulation for the present model is described below and additional implementation details are provided in the supplementary material.
Momentum equation
As inertia is negligible under the experimental conditions, displacement of the electrolyte is described by the equation of mechanical equilibrium, expressed in the spatial description as:
![Equation ([2])](https://content.cld.iop.org/journals/1945-7111/163/10/A2216/revision1/d0002.gif)
The subscript x indicates that differentiation is performed with respect to present positions; in finite-deformation models in which material can experience significant displacement, it is necessary to clearly define the meaning of position. The Cauchy stress tensor, σ, is modeled using Hooke's law of linear elasticity:
![Equation ([3])](https://content.cld.iop.org/journals/1945-7111/163/10/A2216/revision1/d0003.gif)
where Young's modulus E has been determined from experimental rheological measurements, ν is Poisson's ratio, I is the identity tensor, and tr E is the trace of Almansi's strain tensor E. The shear modulus for this polymer was previously measured and is about 1 × 10⁶ Pa in the low deformation rate limit.13 This shear modulus value was converted to the Young's modulus assuming a Poisson's ratio of 0.33. In this finite-deformation model, E may be computed as
![Equation ([4])](https://content.cld.iop.org/journals/1945-7111/163/10/A2216/revision1/d0004.gif)
where the deformation gradient F is given by
![Equation ([5])](https://content.cld.iop.org/journals/1945-7111/163/10/A2216/revision1/d0005.gif)
The subscript x0 likewise indicates that differentiation is to be performed with respect to initial positions, and x refers to present position of material.
We note that the use of the Hooke's law as a constitutive equation is likely to lead to over-predictions of stresses under large displacements; however, there are presently no available constitutive equations which are specifically tailored to describing this electrolyte material.
Boundary conditions
The simulated electrolyte region extends in the z direction from one lithium electrode to the other. A simple inspection of the tomography data does not provide all of the required boundary displacement information because the electrolyte region does not contain identifiable markers, so some assumptions must be made. It is assumed that the electrolyte remains firmly attached to both lithium surfaces, so that there is no displacement along the top interface. The displacement along the bottom interface (which includes the interface with the globule) is assumed to be in the z direction only. In addition, as this is an axisymmetric system, there is no displacement in the r direction at the axis, and there is zero stress in the axial direction on a control surface coinciding with the axis.
At the outer radial surface of the initially cylindrical control volume a simple displacement boundary condition is imposed, as shown in Figure 1. The electrolyte is fixed at the top and bottom interfaces, so the outer surface of the initially cylindrical control volume can be described by a curve describing the displacement as a function of z. The true displacement of the outer radial surface could be described in terms of a Fourier sine series. For simplicity, it is assumed that there is no vertical displacement, and that the horizontal displacement of this outer surface (initially at r = R) is given by
![Equation ([6])](https://content.cld.iop.org/journals/1945-7111/163/10/A2216/revision1/d0006.gif)
Figure 1 shows a schematic of the computational domain in the initial and the deformed state.
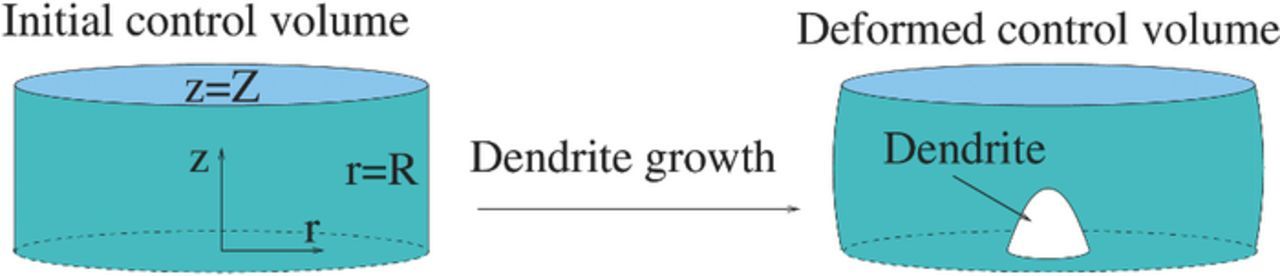
Figure 1. Diagram of computational domain in initial and deformed states. The top and bottom surfaces remain stationary, except in the globule region. The outer edge of the domain displaces outward to compensate for the intrusion of the globule and the limited compressibility of the electrolyte.
This form uses only the first non-constant term of a Fourier sine series. Here, z = Z is the vertical position of the upper lithium surface. The magnitude A was determined from an estimate of the total volume change experienced by the electrolyte within the control volume, and was calculated by solving the following quadratic equation in A:
![Equation ([7])](https://content.cld.iop.org/journals/1945-7111/163/10/A2216/revision1/d0007.gif)
The derivation of this equation is given in the Supplementary Information. A Poisson's ratio of 0.33 and a shear modulus of 1 × 10⁶ Pa were assumed for the polymer electrolyte in these simulations.
In our approach, local current density was calculated from differences between consecutive images while stress was calculated based on an individual image alone. The amount of charge passed before the first of two images used to calculate the current density is reported in the figure legends. For example, when the charge passed is reported as 0 C/cm2 for a series of current density data, that current density was obtained by analyzing images where the amount of charge deposited prior to the images was 0 C/cm2 and 8.27 C/cm2.
Results and Discussion
Theoretically, the electrolyte modulus should be about twice that of lithium metal to completely suppress lithium dendrite growth.37 Lithium metal has a room temperature shear modulus of about 4 × 10⁹ Pa.38 Polystyrene-b-poly(ethylene oxide) with a molecular weight of 240–260 kg/mol has a shear modulus that is 2–3 orders of magnitude lower than that at about 106–107 Pa at 90°C.13 Poly(ethylene oxide) homopolymer with a molecular weight of 360 kg/mol has a shear modulus of about 105 Pa.12 The ratio of the shear modulus of the electrolyte to lithium metal is approximately 0.0003 for our polystyrene – b – poly(ethylene oxide) membrane and 0.00003 for poly(ethylene oxide) homopolymer. Given that these ratios are far less than two, even the stiffened block copolymer electrolyte membrane is far too soft to completely suppress dendrite growth according to the theoretical models.
Figure 2a shows the height of a globular protrusion as a function of time for the two fastest growing lithium globules measured in our study, named globule 1 and globule 2. Figure 2b shows an X-ray microtomogram of a lithium globule after it punctured the electrolyte and caused the cell to fail by short-circuit. The dark gray phase in the image is lithium metal while the light gray phase is the polymer electrolyte. An impurity particle is visible at the base of the lithium globule. This particle was initially at the lithium-polymer interface as shown in Figure 3. The white arrow indicates the height of the portion of the globule that protrudes into the block copolymer electrolyte and into the top lithium electrode. Additionally, the protrusion height of a globule monitored as it grew through 300 kg/mol poly(ethylene oxide) homopolymer in a study performed by Rosso et al. is shown for comparison.23 In both studies, the applied current density was 0.175 mA/cm2, and the voltage response was about 0.07 V. The primary difference between the two studies is the sample thickness. In the Rosso study, the electrolyte thickness was 1.2 mm, while the electrolyte thickness in our study was 30 μm. One would expect a more severe salt concentration gradient to form in a thicker electrolyte with similar transport properties for a given current density. The effect of this thickness difference on globule morphology is unknown.
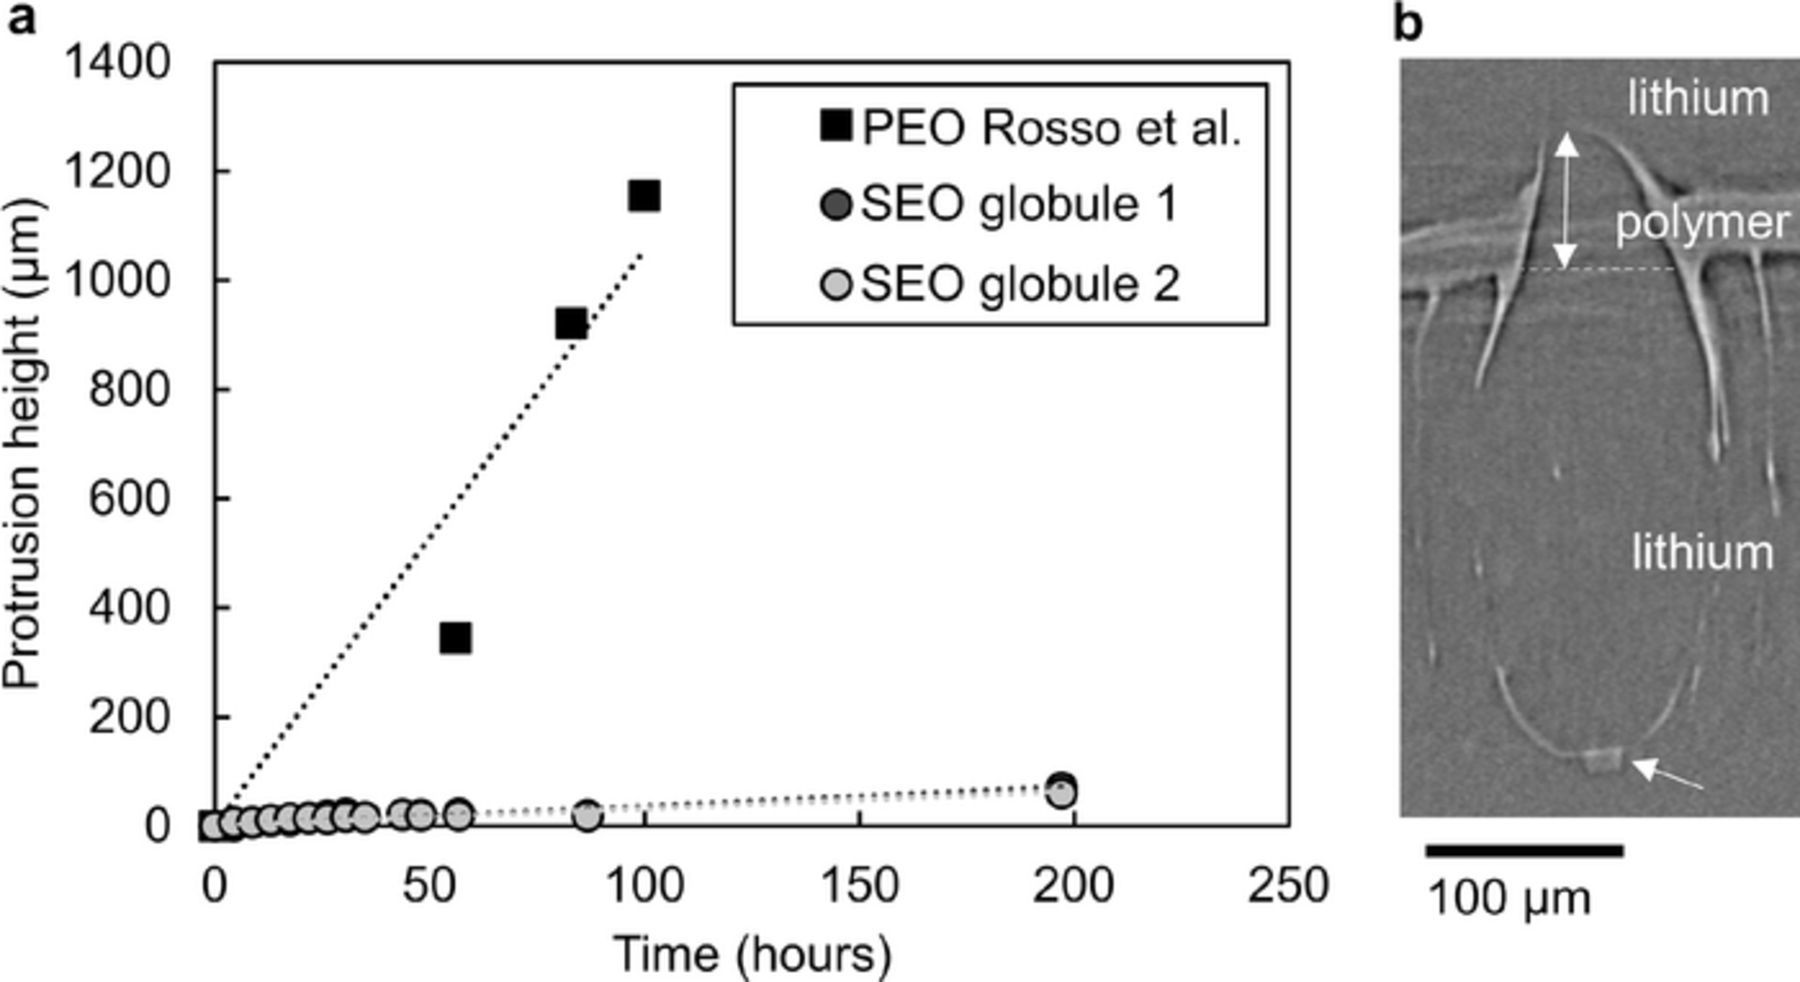
Figure 2. a The growth rate of the lithium globules through a poly(ethylene oxide) stiffened by copolymerization with polystyrene (SEO) is compared to the growth rate of a lithium dendrite through a traditional poly(ethylene oxide) homopolymer electrolyte as reported by Rosso, M. et al. in 2006. The protrusion height is given by the height of the portion of the lithium globule protruding into the polymer electrolyte layer as indicated by the double white arrow in b. An impurity particle is visible at the base of the globule as indicated by the lower white arrow. b An X-ray tomogram showing globule 2 puncturing an SEO electrolyte membrane. The dark gray phase is lithium metal and the light gray phase is the polymer electrolyte.
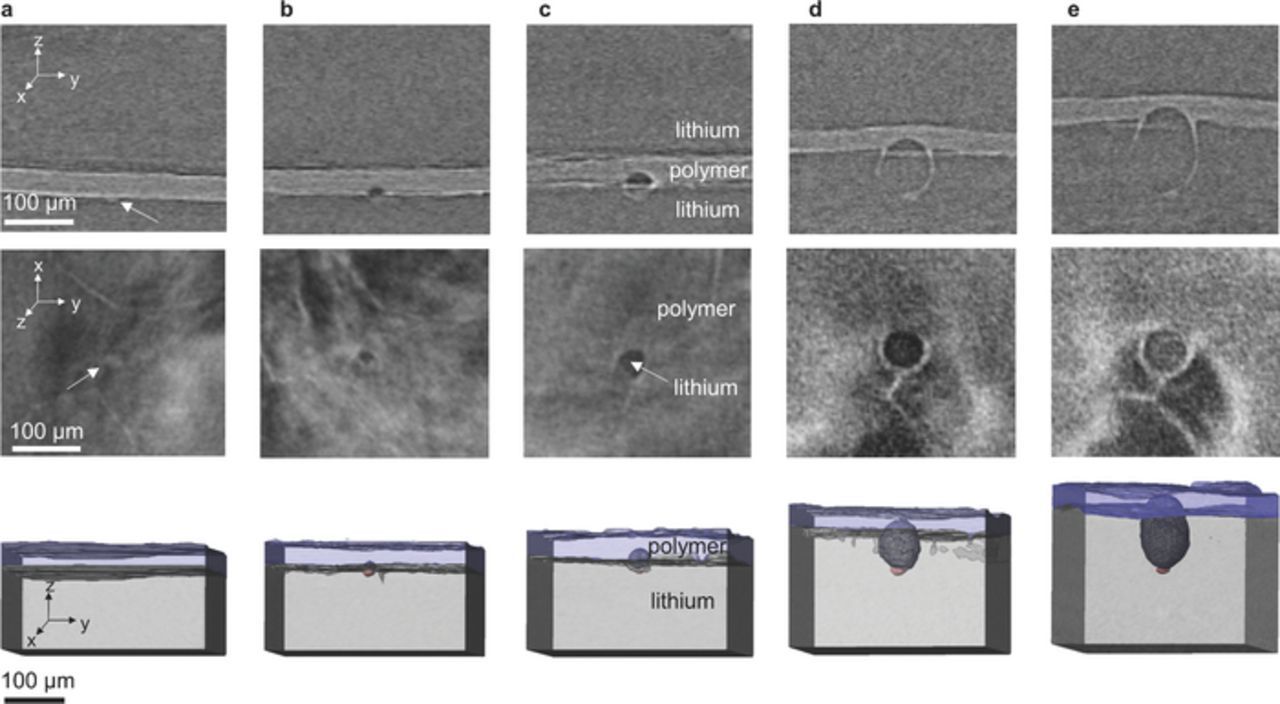
Figure 3. Top row: X-ray tomograms of the yz plane in a symmetric lithium – polymer electrolyte – lithium cell showing the growth of a lithium globule. The dark gray phase is lithium metal and the light gray phase is the polymer electrolyte. The small, light gray spot at the base of the globule is an impurity particle that was initially present in the lithium foil. Middle row: The corresponding xy plane showing the interface between the bottom lithium electrode and the polymer electrolyte. The circular structure in the center of the image is the growing lithium globule. Bottom row: 3D renderings from X-ray microtomography images showing the growth of the lithium globule. The light gray region is the lithium electrode where lithium is deposited. The light blue region is the solid polymer electrolyte membrane. The light red structure at the base of the globule is an impurity particle that was initially in the lithium metal foil. The gray lithium globule is outlined with a wire mesh for clarity. The white arrows are pointing at the impurity particle that was initially present at the lithium-polymer interface. The amount of charge passed before each image is a 0 C/cm2 b 8.27 C/cm2 c 16.53 C/cm2 d 35.82 C/cm2 e 54.72 C/cm2.
It is evident from the data shown in Figure 2 that the growth rate of the lithium protrusions is significantly slower through the polystyrene reinforced block copolymer electrolyte. The fastest growing lithium globule measured in this experiment protruded into the polystyrene-b-poly(ethylene oxide) electrolyte at a rate of 0.37 μm/hr. In the poly(ethylene oxide) homopolymer case, the globule grew at a rate of 11 μm/hr, over an order of magnitude faster than in the block copolymer. It is surprising that changing the electrolyte modulus from 105 to 107 Pa has such a large effect on lithium deposition because both values are significantly lower than modulus of lithium metal. The following series of figures will help us understand this phenomenon.
Figure 3 shows X-ray tomograms and 3D renderings of globule 2 at five stages during its growth through the block copolymer electrolyte. The initial image, shown in part 3a, shows an impurity particle at the lower lithium-polymer interface. The globular structure seen in subsequent images had not yet begun to form. The following images shown in part 3b, 3c, 3d, and 3e show the same location in the sample after 8.27 C/cm2, 16.53 C/cm2, 35.82 C/cm2, and 54.72 C/cm2 of lithium was deposited on the entire lower lithium electrode, as measured from the potentiostat readings. The top row shows the yz plane through the growing lithium globule. The images are aligned to the bottom of the lithium electrode such that the absolute position of the image is consistent from frame to frame. The polymer electrolyte rises as lithium is stripped from the upper electrode and deposited on the lower electrode. The impurity particle that was initially at the lithium-polymer interface in Figure 3a remains at the base of the lithium globule as it grows. The bright streak extending in the y direction from the interface of the polymer electrolyte through the lithium globule is an image artifact caused by the long and bright lithium-polymer interface. The central row shows the xy plane through the interface between the bottom lithium electrode and the polymer electrolyte for the same lithium globule. Images in the zy, xy, and yz planes are obtained by rendering orthoslices through the stack of reconstructed X-ray microtomography images. The bottom row shows a 3D rendering of the growing lithium globule. The bottom gray layer is the bottom lithium metal electrode in the lithium – polymer – lithium symmetric cell. In the volume renderings, the light blue layer is the block copolymer electrolyte membrane. The top lithium electrode was not included in the rendering for clarity. The dark gray globule forming in the center of the images is filled with lithium. The bottom lithium electrode became thicker as lithium was stripped from the top electrode and deposited on the bottom electrode. The lithium globule grew into the electrolyte as the lithium deposited. Eventually, the lithium globule punctured the electrolyte membrane, causing failure by short-circuit.
Figure 4 shows the globule height, volume, and area as a function of the thickness of lithium deposited in the vicinity of the globule, tLi. The abscissa in Figure 4 represents the thickness of lithium deposited about 5–10 μm from the edge of the globule measured from the X-ray microtomography images. The globule height, measured from the base of the ellipsoidal globule to the tip, increases only slightly faster than the surrounding lithium electrode. Positive deviation from the y = x line in Figure 4a corresponds to the height of the globule tip protruding into the electrolyte. The rest of the globule becomes buried by the planar lithium deposition surrounding the globule.
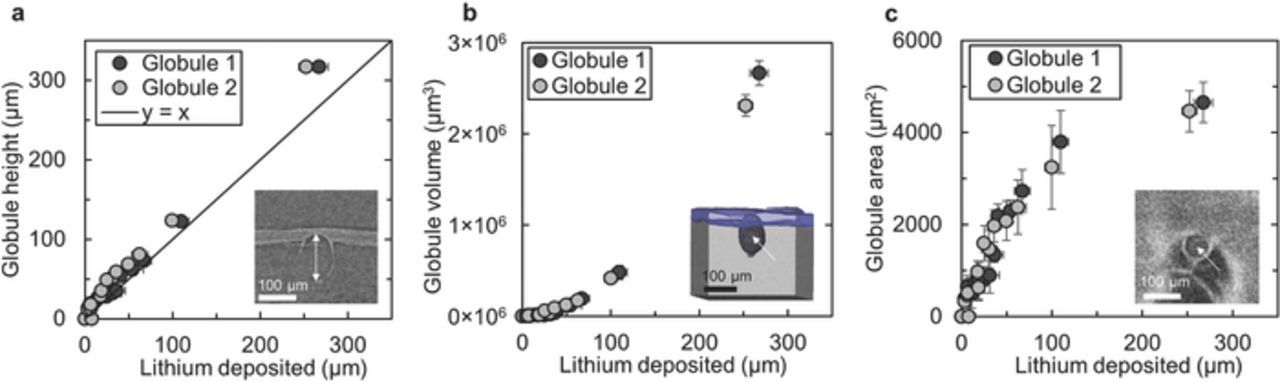
Figure 4. The height (a), volume (b), and area (c) of the two fastest growing lithium globules is shown as a function of the amount the lithium deposited. Note that all of these quantities, including the amount of lithium deposited, are directly measured from X-ray microtomography images. The inset images indicate what is defined as the globule height, volume, and area. The difference between the globule height shown in a and the y = x line is the height of the globular protrusion into the polymer electrolyte membrane.
Since the X-ray microtomography images give three-dimensional information about the interior of the sample, one can measure the volume of the globule as a function of the lithium deposited, tLi. The globule volume, Vg, increases quadratically as a function of tLi (the curve in Figure 4b represents Vg = 33t2Li + 915tLi − 4437). One can also measure the area of the globule at the planar interface between the bottom lithium electrode and the electrolyte. Curiously, it is evident from Figure 4c that the globule grew in area in addition to height. The globule broadened quickly in the initial stages of growth then began to level off as it reached an area of about 4000–5000 μm2.
Because the X-ray microtomography imaging technique allows one to measure the thickness of lithium deposited at every position on the bottom lithium electrode, one can use Faraday's law to calculate the amount of charge deposited at every point on the lower lithium electrode surface. With two consecutive images, one can map the amount of charge deposited at a given pixel on the lithium surface. Dividing this value by the time interval between images gives the local current density (Equation 1). Figure 5 shows current density maps for four distinct stages of growth of lithium globule 2. The maps shown on the top row give the topography of the interface between the bottom lithium electrode and the polymer electrolyte. The tip of the lithium globule is seen in the center of the maps. The color corresponds to the current density. The overall average current density provided by the potentiostat was 0.175 mA/cm2. A current density of 0 mA/cm2 appears as black on the color scale, while 0.175 mA/cm2 appears as a dark blue. Note that in early stages of globule growth, most of the current map is dark blue. This indicates quantitative agreement between local current determined by X-ray microtomography and that applied by the potentiostat.
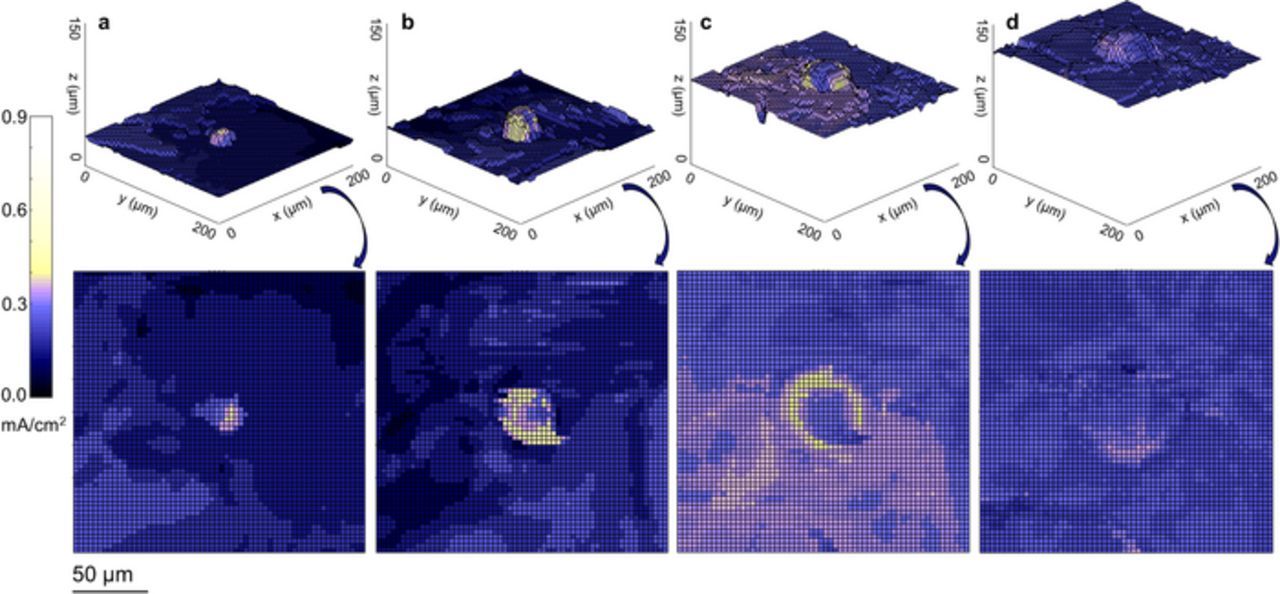
Figure 5. Local current density is mapped for four stages during the growth of lithium globule 2. a In the initial stages, a perturbation at the lithium/electrolyte interface resulted in a higher than average current density at the tip of the small globule. This current density was measured between time points 0 C/cm2 and 8.27 C/cm2. b As the globule grew, the current delocalized away from the tip of the globule. This map was measured between time points 8.27 C/cm2 and 16.53 C/cm2. c This delocalization was more pronounced between 16.53 C/cm2 and 35.82 C/cm2. d As the globule's area increased in the late stages of globule growth, the current concentration caused by the globule was greatly reduced. This map was measured between time points 35.82 C/cm2 and 54.72 C/cm2.
In Figure 5a, the current density was concentrated at the tip of the protruding lithium globule. This current concentration at the protrusion tip is expected based on traditional dendrite growth theories.29,30 As the globule grew, however, the current density delocalized from the protrusion tip to the perimeter. This gives a clear picture of the broadening of the lithium globule. Eventually, the globule became wide enough that the current density was only slightly higher on the lithium globule than on the surrounding planar electrode.
We hypothesize that the current delocalization effect shown in Figures 5b and 5c is caused by the mechanical stiffness of the polymer electrolyte. Since the block copolymer electrolyte is stiff, there is a penalty for a lithium ion reduction event at the globule tip, where the polymer is highly strained. To quantify this effect, we use previously measured moduli values coupled with the X-ray microtomography renderings reported in this study to calculate and map the stress in the polymer.13
Figure 6 shows a map of the vertical component of the stress vector on initially horizontal control surfaces in the polymer electrolyte from the growing lithium globule. The stress vector is based on the initial area and force relative to a fixed amount of material. The 1D profile of the globule is the colorless region in the lower left portion of the plot. The globule tip lies at a radial position of 0 μm. This stress vector, reported in Pa, is shown by the color in the plot. Stress maps were calculated based on the globule shape after 8.27 C/cm2, 16.53 C/cm2, 35.82 C/cm2, and 54.72 C/cm2 of lithium was deposited on the lower lithium electrode as shown in Figures 6a–6d. The plot in Figure 6d shows the maximum compressive and tensile stresses in the polymer as a function of the charge passed. In early stages of growth, the globule grew mainly in height, and, consequently, both the compressive stress at the globule tip and the tensile stress at the globule perimeter increased substantially between 8.27 C/cm2 and 16.53 C/cm2 as shown in Figure 5e. These stresses relaxed as the globule broadened in intermediate stages of growth. The maximum compressive stress occurred at a finite distance above the tip, not at the tip. This is a consequence of severe stretching experienced by the electrolyte.
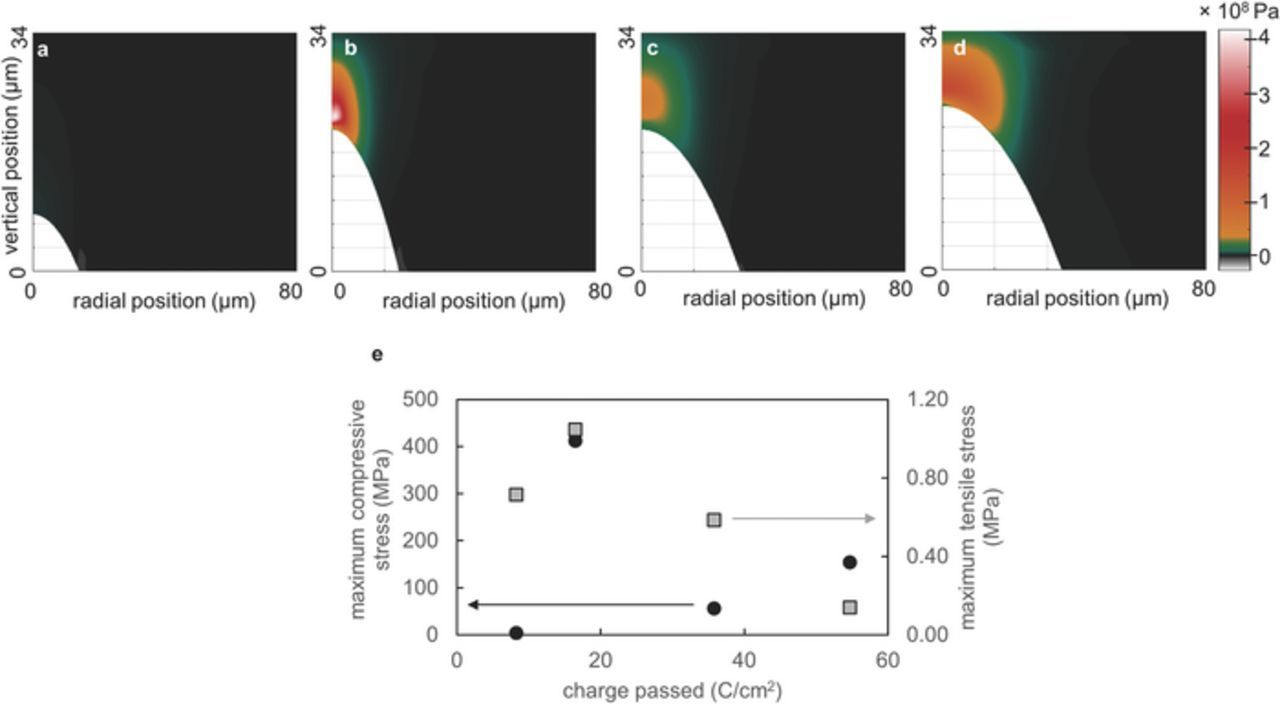
Figure 6. Maps of stresses in the polymer electrolyte due to compression from the growing lithium globule. Stresses are based on an electrolyte modulus of 106 Pa. The polymer electrolyte experienced compressive stresses at the tip of the lithium globule and tensile stresses at the perimeter. a 8.27 C/cm2 b 16.53 C/cm2 c 35.82 C/cm2 d 54.72 C/cm2 e The maximum compressive (black circles) and tensile (gray squares) stresses are plotted as a function of the charge passed.
The current density maps shown in Figure 5 were radially averaged about the globule tip and the resulting curves are shown in Figure 7a. The peak current density shifts from the globule tip toward the perimeter as the globule grew. When the charge passed was less than 16.53 C/cm2, the current density at radial positions between 20 and 80 μm away from the globule center was about 0.175 mA/cm2 as expected based on the potentiostat setting. During the later stages of deposition, the current density at radial positions between 50 and 80 μm away from the globule center increased to a value as high as 0.3 mA/cm2. The cause of this increase in average current density is unknown. It is worth noting however, that the thickness of the lithium layer deposited based on the potentiostat setting at this juncture is 48 μm, which is substantially larger than the thickness of the electrolyte. Small imperfections in the cell may influence local current densities in this regime.
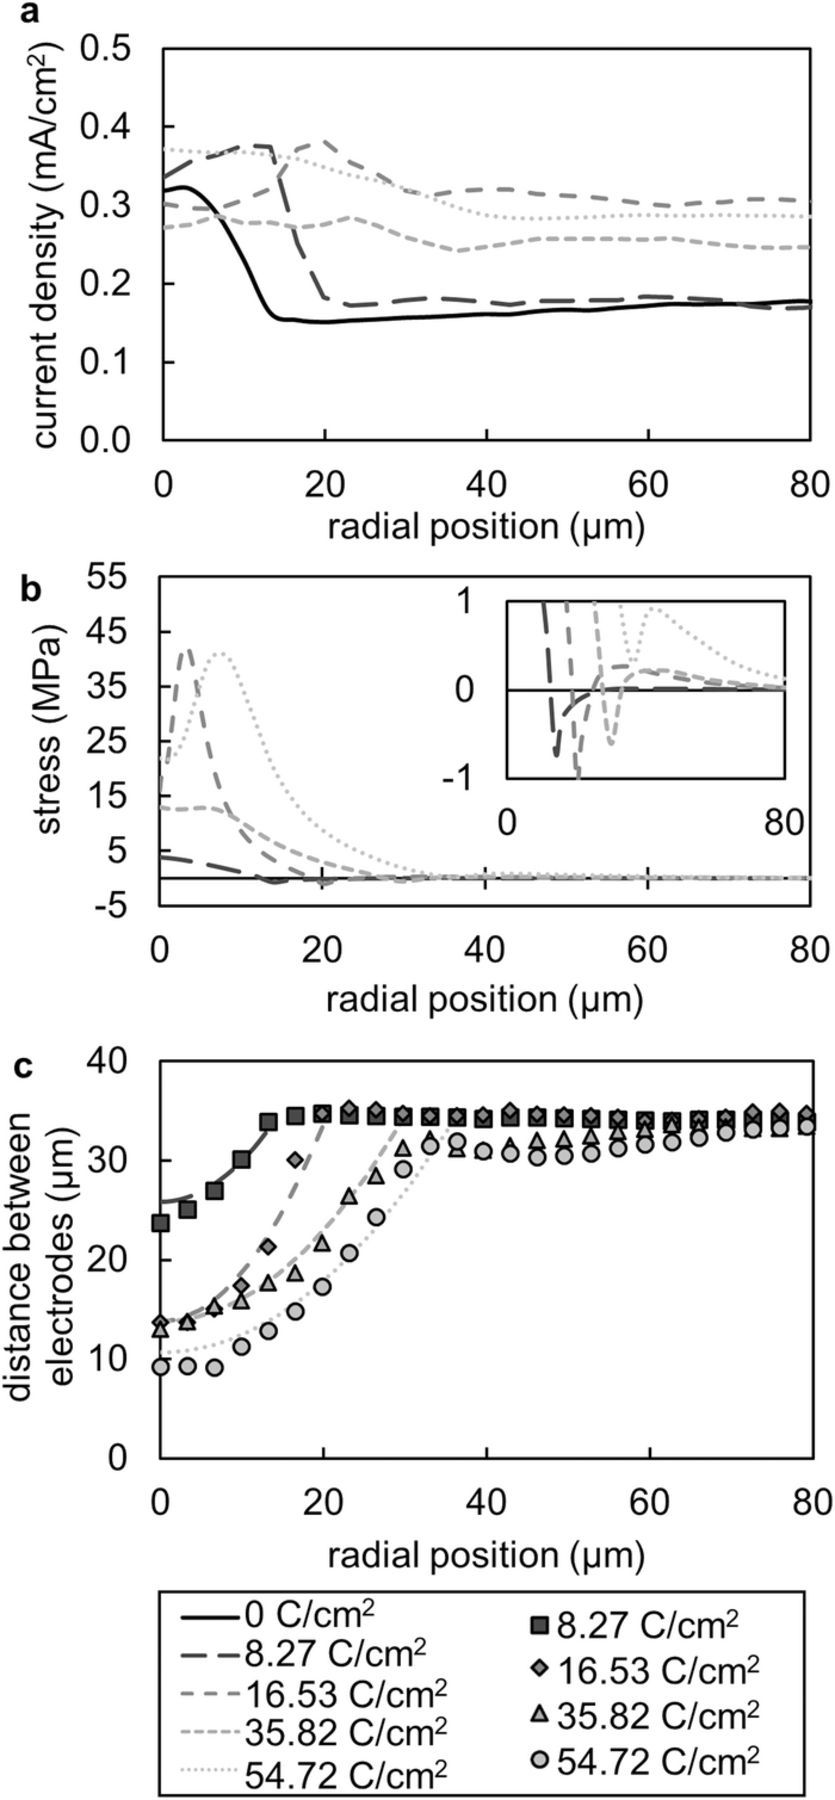
Figure 7. a Curves showing the current density as a function of the radial distance from the globule tip for five stages of globule growth. b The stress at the lithium-polymer interface as a function of radial distance from the globule tip. Note that the radial position at which the stress becomes negative aligns with the maximum current density for the subsequent time step shown in part a. The inset shows a magnified view of the stresses near zero MPa. The negative, or tensile, stresses are evident in this plot. c The parabolic fits to the lithium globule used to simulate the stress in the block copolymer electrolyte (lines) and the corresponding electrolyte thickness data from the X-ray tomograms (markers).
The vertical component of the stress vector at the lithium-polymer interface is plotted as a function of radial position in Figure 7b. Stress at the interface increased substantially as the globule grew significantly in height. These stresses in the electrolyte relaxed as the globule broadened in intermediate and late stages of growth. At later stages, stress at the interface peaked at a radial position of 6 μm. This is due to the delocalization of the stress maximum away from the tip as described above. Figure 7c shows the radially averaged distance between the electrodes extracted from the X-ray microtomography images and the corresponding parabolic fits used to simulate the stresses in the polymer. In Figure 7b, the stress dips below zero at radial positions that align with the edge of the globule as shown in Figure 7c. Furthermore, the radial positions that have the peak current density shown in Figure 7a align with the radial positions that show negative, or tensile, stresses in Figure 7b. In the latest stage of globule growth, charge passed equals 54.72 C/cm2, the stresses at the globule perimeter were compressive and there was no longer a corresponding peak in the current density (Figure 7a).
Based on the theory developed by Newman and Monroe, one would expect for the deposition kinetics of lithium to slow in regions of compressive stress and quicken in regions of tensile stress.37 Consistently, we see that the globule broadens as lithium is preferentially deposited at the globule perimeter. As the globule continues to grow, the stresses at the globule tip relax slightly, likely due to the flattening of the globule tip. Importantly, one would expect for the geometric current concentration effect at the globule tip to lessen as the globule tip flattens.30
In Figure 8a, we plot local current density versus local stress. Current density does not show a strong dependence on stress in this plot. In early stages, the current density appears to decrease with increasing stress, as expected. However, in later stages of growth, the current density appears to increase with stress. An important parameter to consider in this case is the radius of curvature of the growing globule. The globule broadens as it grows, lessening the driving force for globule growth since current tends to concentrate at regions with small radii of curvature. Therefore, it is important to normalize the current density for this changing radius of curvature at the lithium electrode. The charge density, C, at the surface of a conductor is known to be approximately proportional to the fourth root of the Gaussian curvature, K, of the surface in an electrostatic system.39,40
![Equation ([8])](https://content.cld.iop.org/journals/1945-7111/163/10/A2216/revision1/d0008.gif)
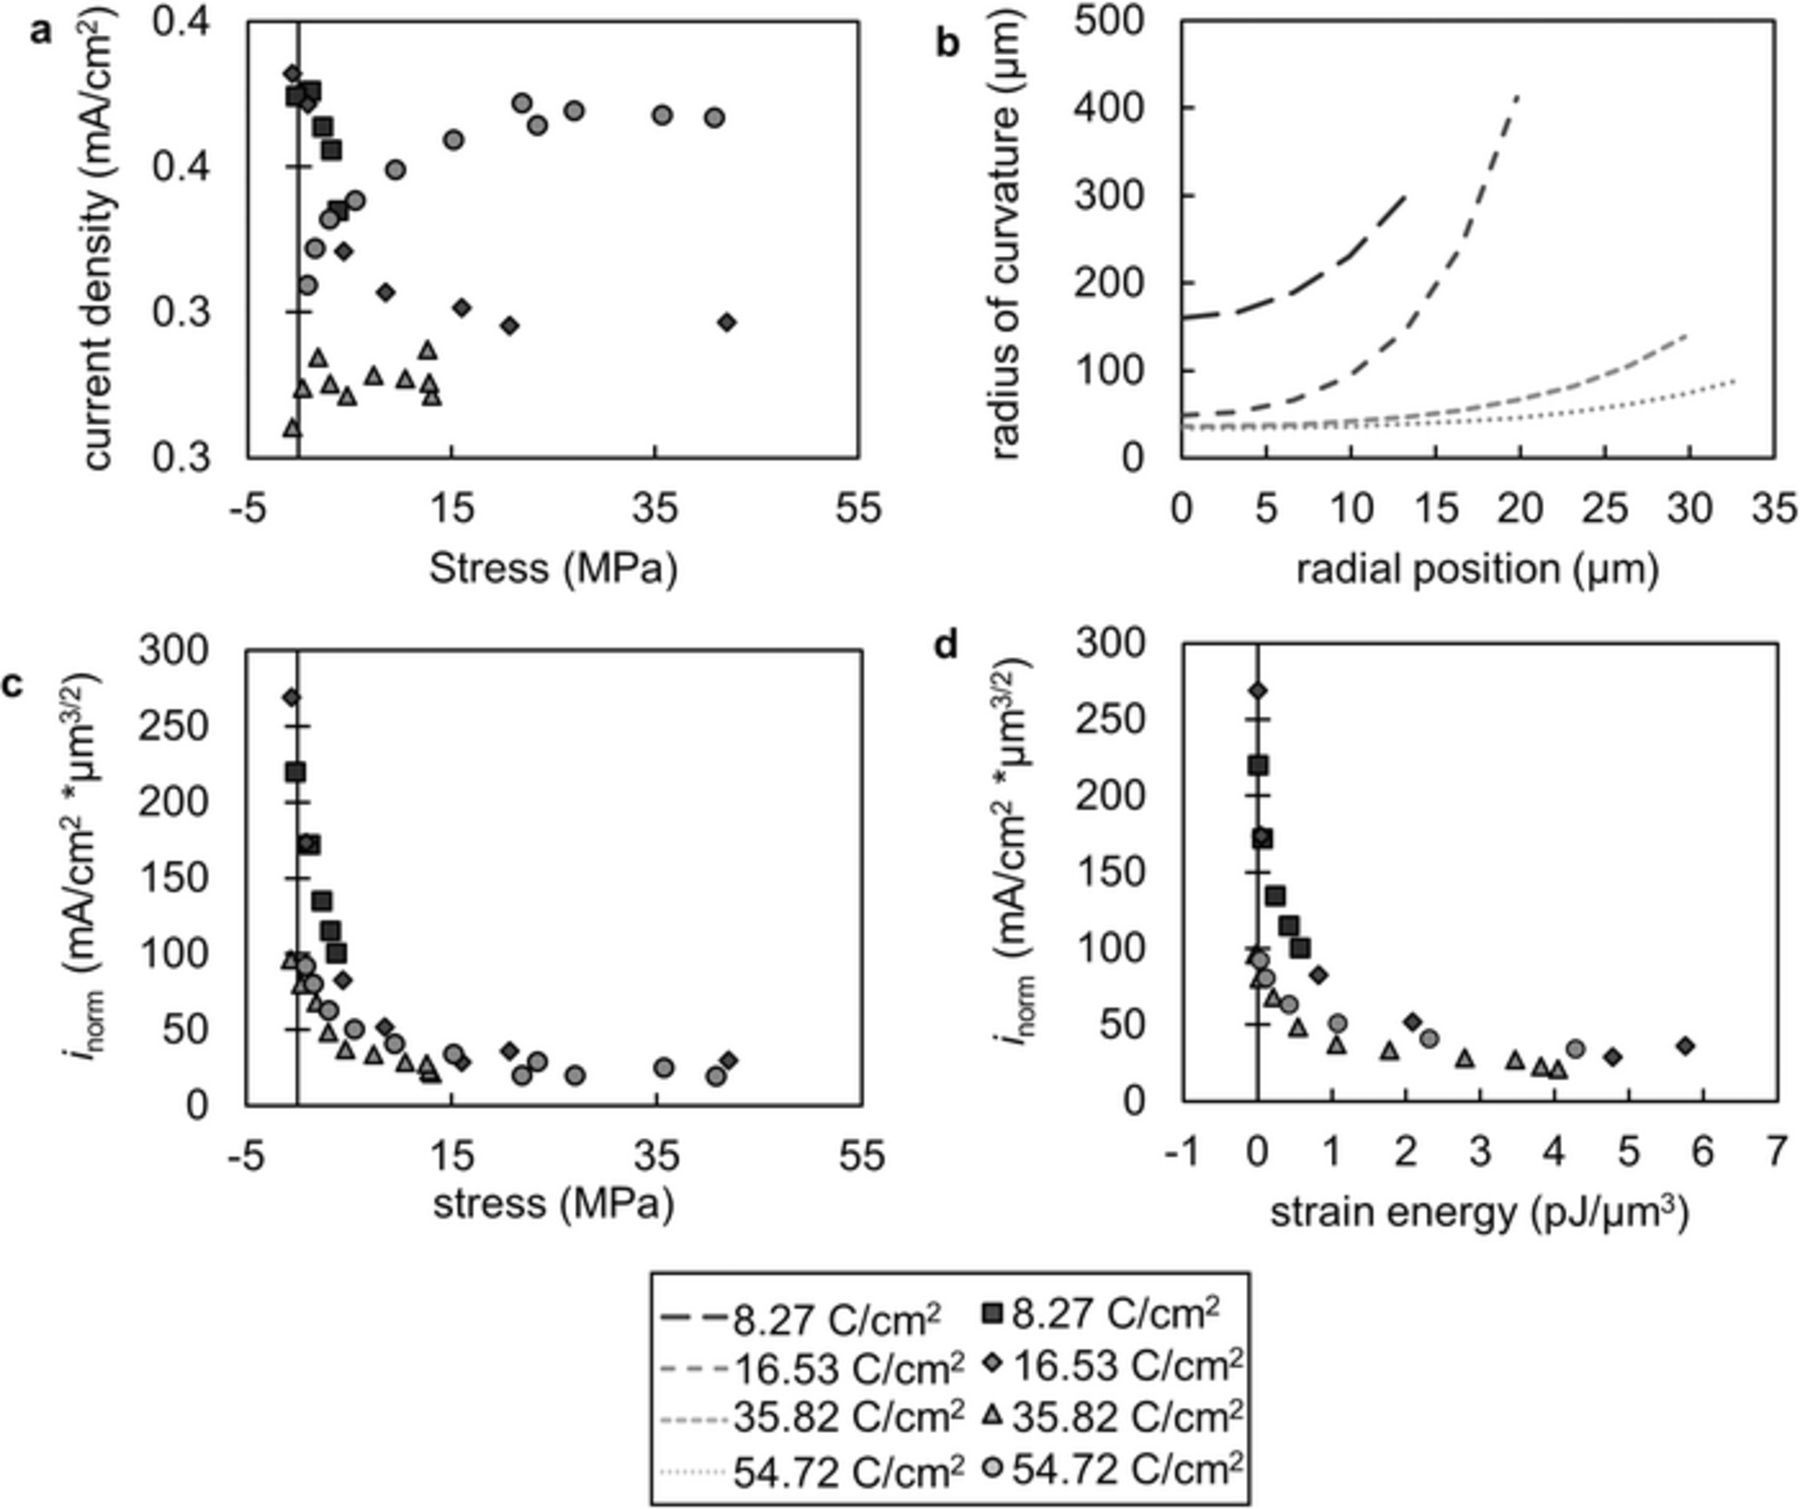
Figure 8. a The current density does not directly correlate to the stress at the lithium-polymer interface. b The radius of curvature of the lithium metal on the globule is shown as a function of the distance from the globule tip. It is minimized at the globule tip and increases with radial position. c The normalized current density at a given radial position is plotted against the corresponding stress at that position. d The normalized current density as a function of the strain energy at a given radial position.
The Gaussian curvature for a sphere is:
![Equation ([9])](https://content.cld.iop.org/journals/1945-7111/163/10/A2216/revision1/d0009.gif)
where R is the radius of the sphere, or the radius of curvature. Therefore, in the simplest model, one would expect the local current density at a given radial position, ir, to be proportional to the charge density, or
![Equation ([10])](https://content.cld.iop.org/journals/1945-7111/163/10/A2216/revision1/d0010.gif)
where Rr is the radius of curvature at radial position r. Additionally, one would expect for the current density to be inversely proportional to the distance between the electrodes, tp, due to ohmic losses. To account for these factors, we normalize the local current density as follows,
![Equation ([11])](https://content.cld.iop.org/journals/1945-7111/163/10/A2216/revision1/d0011.gif)
We have assumed that the charge density on the electrode surface in our dynamic system is similar to that in an electrostatic system. In the case of a symmetric lithium-polymer cell, the electrons move significantly faster through the lithium metal than the rate at which lithium ions are transported to the electrode surface, due to the large disparity in the electronic conductivity of Li (107 S/cm) and the ionic conductivity of the electrolyte (10−4 S/cm). Therefore, it is reasonable to assume that the distribution of electrons in the lithium electrode is governed by electrostatics. In electrostatic systems, electronic charge tends to concentrate at sharp edges, or regions of low radius of curvature on electronically conductive materials in an electric field.39–41 Since the current density used in this study is well below the limiting current (iL = 12 mA/cm2), a higher concentration of electrons should yield an increased rate of lithium ion reduction at the globule tip.
The radius of curvature is calculated from the parabolic fit to the lithium-polymer interface. Figure 8b shows the radius of curvature as a function of radial position. The normalized current density is shown as a function of stress at four different stages of globule growth in Figure 8c. In all cases, the normalized current density decreased as the stress increased, meaning that the measured current density was lower than geometric effects could account for in regions of high local stress. This is consistent with the theory that suggests that compressive stresses at the lithium-polymer interface should slow lithium deposition kinetics. The strain energy density is given by:
![Equation ([12])](https://content.cld.iop.org/journals/1945-7111/163/10/A2216/revision1/d0012.gif)
where σ is stress and  is strain. Figure 8d shows the normalized current density as a function of the strain energy density. The strain energy density in the electrolyte is fundamentally the quantity one would expect to influence the current density. If the strain energy density is high, there is a large energetic penalty for the reduction of a lithium ion at that location. The normalized current density decreased rapidly as the strain energy density increased then plateaued at a strain energy density of about 1 pJ/μm3.
In summary, there are several compounding effects that influence the deposition kinetics of lithium on a growing lithium globule in a solid polymer electrolyte membrane. First, as the electrolyte modulus increases, the energetic penalty for electrodeposition of lithium at a globule tip increases. Additionally, there is an energetic driving force for deposition at the globule perimeter. The combination of these effects leads to a broadening of the lithium globule which consequently reduces the current concentration effect at the globule tip.
Conclusions
The growth of lithium globules through a polystyrene – b – poly(ethylene oxide) block copolymer electrolyte was monitored in a symmetric lithium – polymer – lithium cell using hard X-ray microtomography. The change in globule height, volume, and projected area was measured as a function of the amount of lithium deposited in the region local to the growing globule. The local current density was mapped in the vicinity of a growing globule by measuring the amount of charge deposited at every location as a function of charge time. The current density maps highlight the delocalization of current density from the globule tip at early stages of growth to the globule perimeter. In late stages of growth, the globule broadened significantly resulting in minimal current concentration on the lithium globule.
Stress profiles in the polymer electrolyte membrane were calculated based on the deformation of the polymer due to globule formation and the modulus of the polymer based on previously reported rheological measurements.13 The stress profiles showed a region of compressive stress at the globule tip and tensile stress at the globule perimeter. Given this stress profile, one would expect slowed deposition kinetics at the globule tip and more rapid deposition at the perimeter. This is consistent with the experimental current density maps. Furthermore, as the globule broadened, one would expect the geometric current concentration effect caused by the curvature of the growing globule to decrease. This is also consistent with the minimized current concentration shown in the late-stage current density maps. Therefore, as lithium globules grew into a stiff polymer electrolyte membrane, stresses in the electrolyte not only suppressed vertical growth of the globule by slowing deposition kinetics at the tip, but also resulted in current delocalization to the globule perimeter and subsequent broadening of the globule, further slowing its growth in the vertical direction.
List of Symbols
| a | Pixel area (cm2) |
| A | Volume change of electrolyte in control volume (m3) |
| C | Charge density |
| E | Young's modulus (Pa) |
| F | Faraday's constant (C/mol) |
| F | Deformation gradient |
| I | Identity tensor |
| ijk | Current density at pixel j, k (mA/cm2) |
| iL | Limiting current (mA/cm2) |
| inorm | Normalized current density (mA/cm2 * μm3/2) |
| ir | Current density at radial position r (mA/cm2) |
| K | Gaussian curvature |
| MLi | Molecular weight of lithium metal (g/mol) |
| r | Radial position (μm) |
| R | Initial radial position (μm) |
| R | Radius of curvature |
| Rr | Radius of curvature at radial position r |
| t | Time (s) |
| tLi | Thickness of lithium deposited (μm) |
| tp | Distance between lithium electrodes (μm) |
| U | Strain energy density (pJ/μm3) |
| Vg | Volume of lithium globule (μm3) |
| Vjk | Volume of lithium deposited at pixel j, k (cm3) |
Greek
|
|
Strain |
| ν | Poisson's ratio |
| ρ | Density of lithium metal (g/cm3) |
| σ | Stress (MPa) |
| σ | Cauchy stress tensor |
Acknowledgments
Primary funding for the work was provided by the Electron Microscopy of Soft Matter Program from the Office of Science, Office of Basic Energy Sciences, Materials Sciences and Engineering Division of the U. S. Department of Energy under Contract No. DE-AC02-05CH11231 (KC11BN). Hard X-ray microtomography experiments were performed at the Advanced Light Source which is supported by the Director, Office of Science, Office of Basic Energy Sciences, of the U. S. Department of Energy under Contract No. DE-AC02-05CH11231. Katherine J. Harry was supported by a National Science Foundation Graduate Research Fellowship. Venkat Srinivasan and Kenneth Higa were supported by the Assistant Secretary for Energy Efficiency and Renewable Energy, Vehicle Technologies Office, of the U. S. Department of Energy under Contract No. DE-AC02-05CH11231, under the Advanced Battery Materials Research (BMR) Program. We would also like to acknowledge Professor Bryan McCloskey and Professor John Newman for their helpful technical discussion and advice.