Abstract
For advancing lithium-ion battery (LIB) technologies, a detailed understanding of battery degradation mechanisms is important. In this article, experimental observations are provided to elucidate the relation between side reactions, mechanical degradation, and capacity loss in LIBs. Graphite/Li(Ni1/3Mn1/3Co1/3)O2 cells of two very different initial anode/cathode capacity ratios (R, both R > 1) are assembled to investigate the electrochemical behavior. The initial charge capacity of the cathode is observed to be affected by the anode loading, indicating that the electrolyte reactions on the anode affect the electrolyte reactions on the cathode. Additionally, the rate of "marching" of the cathode is found to be affected by the anode loading. These findings attest to the "cross-talk" between the two electrodes. During cycling, the cell with the higher R value display a lower columbic efficiency, yet a lower capacity fade rate as compared to the cell with the smaller R. This supports the notion that columbic efficiency is not a perfect predictor of capacity fade. Capacity loss is attributed to the irreversible production of new solid electrolyte interphase (SEI) facilitated by the mechanical degradation of the SEI. The higher capacity fade in the cell with the lower R is explained with the theory of diffusion-induced stresses (DISs).
Export citation and abstract BibTeX RIS

This is an open access article distributed under the terms of the Creative Commons Attribution 4.0 License (CC BY, http://creativecommons.org/licenses/by/4.0/), which permits unrestricted reuse of the work in any medium, provided the original work is properly cited.
Lithium-ion batteries (LIBs) are widely used in small, portable, electronic devices due to their high energy density, high voltage, low self-discharge rate, and good cycle performance.1,2 Yet, for automotive propulsion applications, LIBs need improvement in volumetric and gravimetric energy density and with performance over the life of the vehicle. This is one of the major motivations of researchers worldwide focusing on developing cheaper and more durable LIBs for applications such as hybrid vehicles, electric vehicles, and other large-scale energy storage systems.3
Capacity decay during storage and charge-discharge cycling is one of the major challenges that limit the life of LIBs. Instability of the electrolyte at the operating potentials results in side reactions on the electrode surfaces, part of which lead to the formation of solid electrolyte interphases (SEIs).4–7 Side reactions may result in lower coulombic efficiency, loss of usable capacity of the cell, and increase of cell impedance. Cell performance degradation due to side reactions is termed as chemical degradation, which is known to be the main cause of lithium loss in well-made LIBs.5,6,8–10 These side reactions lead to marching of the charge and discharge endpoints.11,12 Such side reactions and their effects on the cell life are relatively less explored.
The solid state diffusion of lithium atoms in and out of host electrode particles results in diffusion induced stresses (DISs) and volume changes in electrode particles during charge and discharge. Depending upon the operating conditions these stresses may have various effects on the electrodes such as mechanical fatigue and fracture of the electrode particles, electrode particle isolation from the composite matrix, or SEI fracture, to name a few.13,14 DISs have been studied in detail by mathematical modeling and experimental observations. Previous reports have discussed mechanical stresses in single electrode particles and thin film electrodes.13,15–17 Apart from the loss of active electrode material, mechanical degradation of electrode particles facilitates additional side reactions by exposing new surface area to the electrolyte. Various mathematical models have been developed to explain the capacity loss in batteries during electrochemical cycling with coupled chemical and mechanical degradation as a prevailing mechanism.4,18 Along with mathematical models there have been several experimental observations of DISs and stress induced cracking of electrode materials. For example, Sethuraman et al.17 experimentally measured the stresses in thin film electrodes using wafer curvature methods. In another publication, Li et al.19 observed the cracking pattern in silicon thin film electrodes and correlated it with the electrode thickness.
In this research, an attempt is made to understand the relationship between coulombic efficiency, capacity retention, and mechanical stresses. Two types of graphite/Li(Ni1/3Mn1/3Co1/3)O2 (NMC) full cells were designed with different anode to cathode capacity ratios (R). The cathode loading was the same in both cells, thus R was adjusted by changing the anode loading. Both cells were charge limited by the amount of lithium that could be removed from the cathode at a given cutoff voltage and discharge limited by amount of lithium could be removed from the anode. We found that, during electrochemical cycling, the cell with the higher anode loading (i.e., high R value) had much lower coulombic efficiency as compared to the cell with the lower anode loading (i.e., small R value). Monitoring of the charge and discharge endpoints vs. time revealed that the marching rate of the charge endpoint was affected by the amount of anode loading for a fixed cathode loading. We propose that the electrolyte reactions on the cathode are affected by the electrolyte reactions on the anode. Thus, there is a "cross-talk" between the two electrodes. Interestingly, the cell with the higher R value suffered a slower rate of capacity fade during cycling, though its total rate of side reactions was greater. Here, the total rate of side reactions is defined as the sum of marching rate of discharge and charge end points. These observations support recent findings presented in Deshpande et al.,12 where it was demonstrated through the use of an electrolyte additive that coulombic efficiency is not a perfect indicator of battery life. Thus, a cell with higher rates of side reactions can have less capacity loss than a cell of the same chemistry with lower rates of total side reactions, which supports the premise that not all side reactions lead to capacity fade in a battery, at least in the early stages of cycle life. We propose that there are two types of side reactions: one which causes lithium loss from the system and one which shuttles between the two electrodes without actually leading to irreversible lithium loss.
Based on the cell test data, we conclude that the reactions causing the irreversible lithium loss in the system are mainly linked to the formation of additional SEI on newly exposed electrode surfaces on the anode. We develop a DIS model correlating electrode volume expansion with the capacity loss of the cell. Lower capacity loss in the cell with higher anode loading is explained with the DIS model which incorporates the increased electrode surface area due to stress cracking. We propose that the lower capacity loss with increasing anode loading can be explained by two possible stress-related mechanisms: (i) Increased anode loading results in decreasing in current density on the anode surface, which may reduce the electrode particle cracking during cycling. (ii) Increased anode loading decreases anode utilization and thus reduces the electrode particle expansion and contraction during the respective lithiation and delithiation, thus reducing the mechanical degradation.
Experimental
Electrodes preparation
All the powders were dried and stored in argon-filled glove box before making electrodes. Anodes were mixtures of 87.8 wt% CGP-8 graphite carbon (Conoco Phillips), 2.9 wt% battery grade acetylene black (Denka Singapore Private Limited), and 9.3 wt% polyvinylidene fluoride (PVDF) (No. 1100, Kureha, Japan). Cathodes were composed of 92.8 wt% NMC (Applied Materials, Inc.), 3.2 wt% acetylene black, and 4 wt% PVDF. Anhydrous N-Methyl-2-pyrrolidone (NMP) (99.5%, Sigma-Aldrich) was used as solvent to dissolve PVDF. A slurry casting method developed at the Lawrence Berkeley National Laboratory was used to prepare all of the electrodes.20 For mixing powders, firstly, graphite/NMC and acetylene black were well mixed in NMP using a homogenizer at 2500 rpm (Polytron PT10-35). Secondly, PVDF was added to the slurry, and the whole slurry was blended with the homogenizer again until it became uniform. Thirdly, the uniform slurry was casted on battery grade Cu foil (thickness, 15 μm) for anodes and Al foil (thickness, 18 μm) for cathodes with a height adjustable doctor-blade (Yoshimitsu, model YOA-B). Different loading densities of anode/cathode can be obtained by changing the height of the doctor-blade. After drying overnight in the glove box, electrode laminates were calendered to approximately 37% porosity using a roll press (Innovative Machine Corp.). Then anode disks with diameter of 1.43 cm and cathode disks with diameter of 1.27 cm were punched from the calendered laminates. All anode and cathode disks were dried in a vacuum oven at 130°C for 15 h and then stored in another argon-filled glove box for coin cells fabrication.
Coin cell assembly
Anodes and cathodes were assembled into CR2325 coin-type cells. The smaller cathode electrode was placed at the bottom of the cell casing first. Then one piece of polypropylene separator (Celgard 2400) was placed on top of the cathode electrode. A fixed amount (90 μL) of electrolyte was added to wet the cathode and separator using a micropipette. The electrolyte consists of 1 M LiPF6 in a mixture of ethylene carbonate and diethyl carbonate (EC:DEC = 1:1, v/v) (Daikin Industries, Japan). The larger anode electrode was placed on top of the separator and covered with a stainless steel spacer and spring. Finally, the cell was sealed by a hydraulic crimping machine (National Research Council of Canada).
Two sets of cells with different initial anode loadings and similar cathode loadings were fabricated. The capacity ratio of anode to cathode was calculated based on the initial weight of anode and cathode material and their cycleable capacities (based on half-cell data). Specific capacities of 320 mAh/g and 165 mAh/g for composite graphite and NMC, respectively, were used to calculate the R values. We note that the cycleable anode capacity available for lithiation may be less than the calculated value since the anode area is much larger than the cathode area. Hence, the R values are representative R values. The anode and cathode loadings in Table I are calculated based on the weights of the pure graphite and pure NMC in the respective composite electrodes and the electrode area of each of the punched electrode. A summary of the loading levels, electrode size, and thicknesses is provided in Table I.
Table I. Anode/Cathode pair fabricated.
| Capacity Ratio | Anode loading, mg/cm2 (Φ = 14.3 mm) | Cathode loading, mg/cm2 (Φ = 12.7 mm) | Anode thickness,* μm | Cathode thickness,* μm | Calculated graphite surface area, cm2 (approximation) |
|---|---|---|---|---|---|
| R = 1.18 | 2.89 | 6.37 | 41 | 42 | 13.26 |
| R = 4.54 | 11.83 | 6.77 | 71 | 42 | 54.20 |
Φ - Diameter of electrode in coin cell. *Thickness is measured after calendering; thickness of Cu/Al foil is included. The thickness shown here is the representative average value of the laminate from which the disk electrodes are punched.
In Table I, the values for surface of the graphite electrode for two cells are calculated based on the graphite loading and with the assumption that the diameter of spherical graphite particle is 10 μm, and density of graphite is known as 2.1 g/cm3.
Electrochemical performance measurement
Electrochemical tests were carried out in galvanostatic mode (constant current) on a Bio-Logic potentiostat (MPG-2) at 25°C controlled by an environmental chamber (Test Equity). All the cells were stabilized with 8 formation cycles between 4.2 V and 2.0 V at a slow rate of C/10. After that, all the cells were cycled between the same voltage limits at a rate of 1C. The capacities used for calculating currents for the 1C cycling were based on the discharge capacity of the eighth formation cycle. An open-circuit rest period of 15 minutes was also included after every charge and discharge period. Values of the current densities for the formation cycling and the long-term cycling for the two cells with different R values are summarized in Table II. The values of current densities mentioned in the Table II are based on the weights of active materials (as against the weights of composite electrodes).
Table II. Discharge/charge current densities.
| Formation cycling, C/10 | Long-term cycling, 1C | |||||
|---|---|---|---|---|---|---|
| Capacity Ratio | Current μA | Anode mA/g | Cathode mA/g | Current mA | Anode mA/g | Cathode mA/g |
| R = 1.18 | 143.4 | 30.9 | 17.7 | 1.2 | 258.1 | 148.5 |
| R = 4.54 | 152.0 | 8.0 | 17.7 | 1.0 | 53.8 | 119.0 |
Results and Discussion
Formation cycles
From Table II we see that, the current densities based on the active NMC weight in cathode (mA/g) are similar for both the cells during formation cycles. On the other hand, for the same electrodes, current densities are noticeably different for the long-term cycling, even though both cells are cycled at the 1C rate. As mentioned, the 1C currents are based on the cell discharge capacity at the end of the last formation cycle. The difference in the 1C current densities of the two cells is due to the reduced discharge capacity in a cell with the larger anode after eight formation cycles. Specifically, at the last formation cycle, the cell discharge capacities are 119 mAh/g and 148 mAh/g (Fig. 1a) for the cells with R equal to 4.54 and 1.18, respectively. This is understandable because cell with higher anode loading forms more SEI, which causes the higher-capacity anode to consume additional lithium from the cathode compared to the lower-capacity anode.

Figure 1. Electrochemical characteristics during formation cycling at C/10 of cells with two different anode loadings, (a) Specific capacities vs. cycle number, open marks indicate charge capacity, filled-in marks indicate discharge capacity. (b) Coulombic efficiency (discharge capacity divided by previous charge capacity) vs. cycle number.
In Fig. 1, the formation cycle charge and discharge capacities of the two cells are plotted as a function of cycle number. In Fig. 1a, the cell with R = 1.18 shows a first cycle charge capacity of 171.8 mAh/g (black open diamond); the cell with R = 4.54 shows a first cycle charge capacity of 184.8 mAh/g (red open triangle). It is worth noting that, although the cathodes in both cells are very similar in electrode weights, thicknesses, composition, and area, the first cycle charge capacities of the two electrodes are significantly different. The only difference in these cells is the difference in anode weights/surface area. Hence, it is apparent that even though these cells are cathode capacity limited, the anode can affect the first cycle charging capacity of the cell. We attribute the higher first cycle capacity of the cell with the larger anode (R = 4.54) to additional electrolyte oxidation in the cell which contributes to the measured charge. We suggest that reaction products from the reduction of the electrolyte on the anode have crossed over to the cathode (cross-talk) where they are oxidized requiring additional charge. This is a further confirmation of a 'shuttle reaction' mechanism proposed earlier by Deshpande et al.12 This is also reflected in the difference in the first cycle coloumbic efficiency, 86% and 66% for R = 1.18 and 4.54 cells, respectively (Fig. 1b). After the first cycle, the negative electrode surface is mostly passivated and the coulombic efficiency quickly climbs to above 95% for both cells.
Cell cycling study.—Capacity retention
The capacity and coulombic efficiency during long-term cycling of the graphite/NMC cells with different R values are plotted in Fig set 2. At the start of long-term cycling, the 1C discharge capacity is 135 mAh/g for the cell with R = 1.18 and 111 mAh/g for the cell with R = 4.54. Though the capacity for the cell with R = 1.18 (diamond mark) starts at a higher initial capacity, it decays at a faster rate as compared to the cell with R = 4.54 (triangle mark). The two curves cross at 480 cycles after which the cell with the higher R delivers more discharge capacity than the cell with lower R. Cycle-by-cycle capacities of both cells, normalized by their respective initial capacities, are plotted in Fig. 2b. It is evident that the cell with the smaller R value had a faster capacity fade rate upon cycling as compared to the cell with the larger R value.
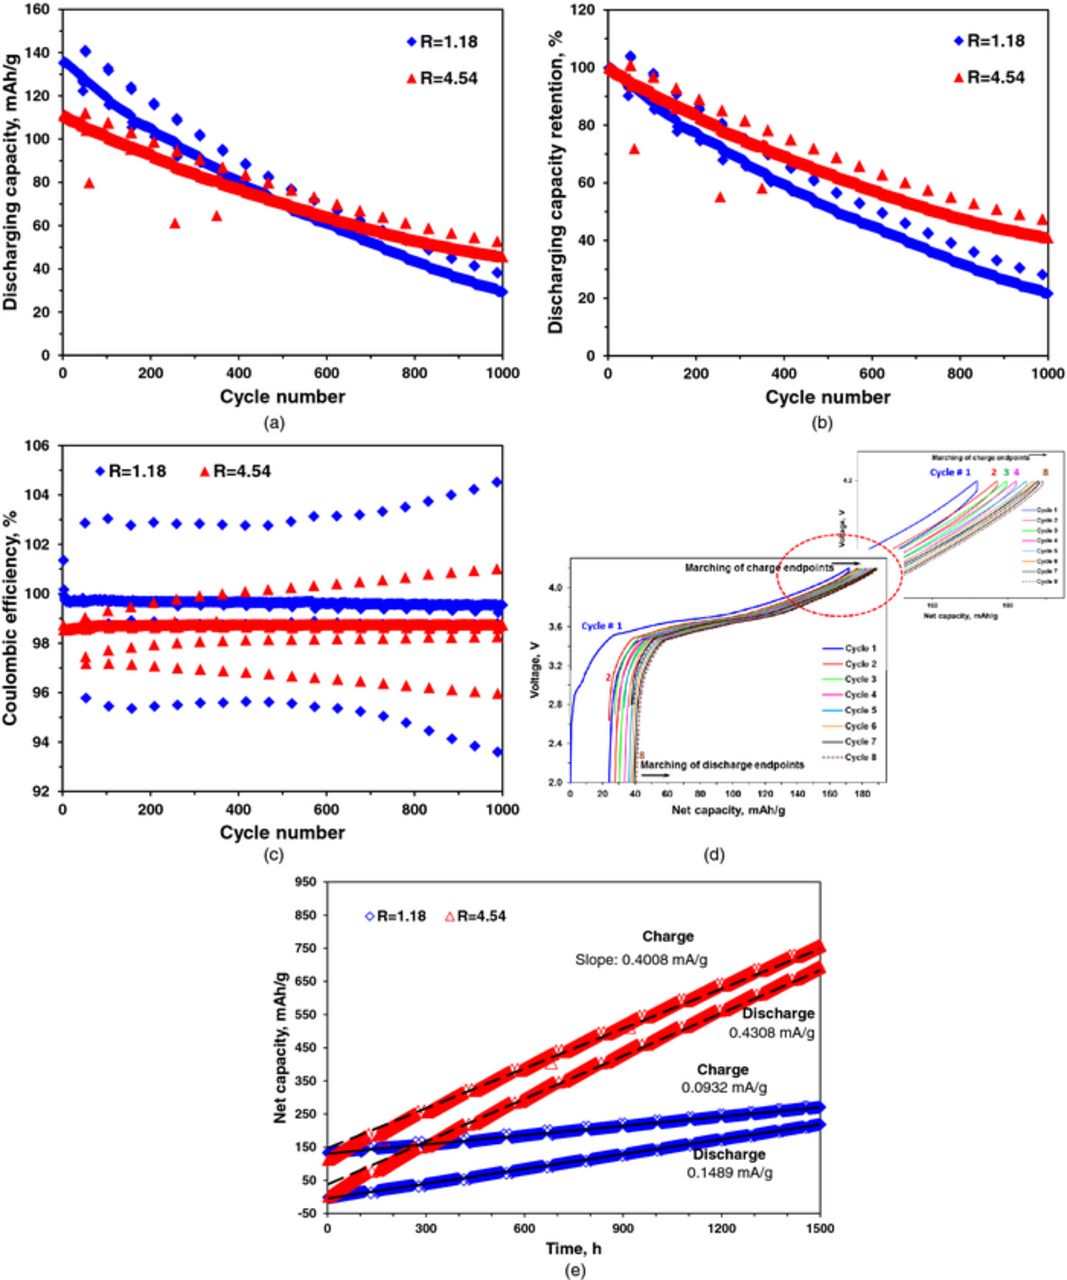
Figure 2. (a) Specific discharge capacity vs. cycle number for cells with two different anode loadings during long-term cycling at 1C. (b) Discharge capacity retention (%) vs. cycle number for cells with two different anode loadings during long-term cycling at 1C. (c) Coulombic efficiency vs. cycle number for cells with two different anode loadings during long-term cycling at 1C. (d) Voltage profiles of a cell during cycling vs. net charge/discharge capacity with zoomed-in view of the charge endpoints of each cycle. (e) Net charge/discharge capacity vs. time for cells with two different anode loadings during long-term cycling at 1C. (Every 50 cycles, cells are cycled at C/10, these data are plotted as systematic interruptions in a, b, c and e).
Coulombic efficiency, cycle efficiency, charge/discharge endpoint marching
In Fig. 2c the coulombic efficiencies of the two cells are plotted as a function of cycle number. The cell with the lower anode loading (R = 1.18) has a higher coulombic efficiency than the cell with the higher anode loading (R = 4.54). Compared with the capacity retention plots (Fig. 2b), we observe that the cell with the lower coulombic efficiency possesses a higher capacity retention rate.
The cycle efficiency is defined as the ratio of the discharge capacities of two successive cycles. For the cell with the lower anode loading (R = 1.18) the average cycle efficiency is calculated to be ca. 99.87% for 600 cycles; for the cell with higher anode loading (R = 4.54) it is ca. 99.95%. These numbers translate to cycling inefficiencies of 0.13% and 0.05%. In other words, for the cell with R = 1.18, discharge capacity in every cycle is, on average 0.13% lower than the previous cycle and for the cell with R = 4.54, it is, on average 0.05% lower than the previous cycle. Thus, the cell with the lower anode loading (R = 1.18) is ca. 2 to 3 times less efficient in cycling than the cell with higher anode loading (R = 4.54). This is contrary to the conventional assumption that a higher coulombic efficiency implies a better cycle efficiency, i.e., longer cycle life. This indicates that the coulombic efficiency is not only a poor predictor of cycle life but, under certain conditions, the coulombic efficiency can be misleading. Many half and full cell studies in the literature focus on improving the coulombic efficiency of cells. It is important to realize that an improved coulombic efficiency may not always translate to an increased cycle life as demonstrated in this experiment.
In Figure 2c, for both the cells, we note that there is a decrease in coulombic efficiency of the cell in cycles immediately after the C/10 cycles. The efficiency increases to a steady value after a few 1C cycles. This behavior of the coulombic efficiency has been observed earlier12 and investigation of this phenomenon is beyond the scope of this paper.
To elucidate marching of charge and discharge endpoints, we plot in Fig. 2d typical voltage profiles of a cell during electrochemical cycling against the net charge/discharge capacity of the cell. As can be observed, during each cycle, both charge and discharge endpoints of the cell move to higher net capacity than the previous cycle. For example, the charge end point of the 2nd cycle shown in red is at higher net capacity than the charge end point of the 1st cycle shown in blue. This shifting of charge/discharge endpoints is referred to as "marching of charge/discharge endpoints". Deshpande et al.12 found that coulombic efficiency and cycle efficiency are related to the marching of the charge and discharge endpoints. To analyze coulombic efficiency and cycle efficiency for the two cells of different R values, the movement of the charge and discharge endpoints (i.e.,  , respectively) are plotted as a function of time (Fig. 2e). The capacities plotted in Fig. 2e are the cumulative specific capacities based on initial cathode loadings for both cells. The upper curves represent the charge endpoints and lower curves represent the discharge endpoints as a function of time. Charge and discharge endpoints for both cells move to higher cumulative capacities during electrochemical cycling of the cells as a result of side reactions.
In an earlier publication, Matthieu et al. observed a large increase in resistance of cells over cycling.21 Resistance rise in the cell can affect accessible capacity of the cell as well as the rate of marching of both, the charge and the discharge endpoints.12 For the cells presented here, we observe that the difference in charge and discharge voltage profiles increases with increasing cycle due to the increase in the effective resistance of the cell (Fig. 3a). As an example, in Fig. 3a we plot the charge-discharge voltage profiles for a cell with R = 4.54 on the 1st and the 1000th cycle against the capacity. A small increase in the difference in charge discharge voltage profiles can be observed over 1000 cycles (ΔV2 > ΔV1). To clarify the contribution of resistance rise in cells presented here, we adopt the same methodology presented in the earlier publication12 and observe the difference between average charge and discharge voltages as a function of cycle number (Fig. 3b). Since, the polarization overvoltage depends on the cell state of charge22 the average change in the difference of charge and discharge voltages over cycling gives an approximate value of capacity loss due to resistance rise. From Fig. 3b, it can be observed that, for the cell with R = 1.18, the difference in the average voltages rises by approximately 80 mV at the end of 1000 cycles as compared to the beginning of cycling. Roughly half of that voltage difference rise occurs during charging. Since the slope of the charging curve at the end of charge is 0.0088 V/(mAh/g), 40 mV of change in average charge voltage contributes to 0.04/0.0088 = 4.5 mAh/g of capacity loss which is about 4.5% of the total capacity loss of 100 mAh/g in 1000 cycles for that cell. A more accurate method to calculate the capacity loss due to resistance rise would be to use the polarization overvoltage at the end of charge. We observe that the relaxation voltage after charging current is stopped before next discharge is started. Figure 3c shows charging and relaxation voltage curves for a cell with R = 4.54 at 10th, 500th and 1000th cycles. Figure 3c also zooms-in on the relaxation parts for these cycles to observe the difference in relaxation voltages as a function of cycle number. We find that most of the polarization overvoltage is relaxed in 15 minutes once the charge current is stopped with dV/dt values less than 1 mV/min at the end of 15 minutes. We find that for the cell with R = 1.18 the polarization overvoltage increases from 55 mV to 83 mV (i.e. increase of 28 mV) in 1000 cycles. We realize that a relaxation time of 15 minutes might not be sufficient for complete relaxation of the overvoltage, yet it's a good approximation since there is very small rate voltage relaxation at the end of 15 minutes. The increase in overvoltage of 28 mV corresponds to 3.2 mAh/gm of loss of capacity due to overvoltage increase. Furthermore, the overvoltage of 28 mV found at the end of charge is consistent with the 40 mV of the average overvoltage calculated based on Fig. 3b. Both methods described above suggest that the resistance contribution to capacity loss is only a small percentage (<5%) of the total capacity loss.

Figure 3. (a) Cell charge-discharge voltage profiles at 1C rate at 1st cycle and at 1000th cycle. The average difference in charge and discharge voltages changes as the cell is cycled. (b) The difference between the average cell voltage during charge and the average cell voltage during discharge for cell with R = 4.54 (red triangles) and cell with R = 1.18 (blue squares) are plotted against the cycle number. (c) Cell voltage profile during 1C charging for 10th, 500th and 1000th cycle plotted again charging time for a cell with R = 4.54 during charging till the voltage limit of 4.2 V is reached. The cell voltage is allowed to relax for 15 minutes once the cell reaches the voltage limit.
Thus, 95% of the capacity fade is not due to resistance rise, but due to the difference between the marching rates at each electrode, which in turn is caused by side reactions. This result is in accordance with previous findings,12 the resistance rise is a small contributor to the capacity loss in these cells and so is the loss of active material from particle isolation.
Hence, the marching of both the charge and discharge endpoints is mainly attributed to side reactions on the cathode and anode, respectively.
Marching of the charge endpoints
As the cell is cathode capacity limited and the voltage of the anode is fairly flat near the top of charge, the charge endpoint is reached as a result of the rise in the cathode voltage during its delithiation causing the cell to reach the cutoff voltage. The sliding to the right of the charge endpoint, also referred to as marching, is the result of electrolyte oxidation reactions on the cathode surface that occur since the last time the cell was fully charged. Intuitively, the amount of electrolyte oxidation reactions on the cathode should only depend on cathode loading/cathode surface area. Interestingly, for the cell with the lower anode loading (R = 1.18), the charging endpoint moves more slowly to the right,  , than the cell with the higher anode loading (R = 4.54),
  . This observation strongly implies that the amount of electrolyte reduction on the anode is affecting the amount of electrolyte oxidation reaction on the cathode and demonstrates that there is cross-talk between the two electrodes, as discussed by Deshpande et al.12
Marching of the discharge endpoints
Near the end of discharge, the voltage curve of the anode rises steeply as its stored lithium is depleted. In this region, the voltage profile of the cathode is relatively flat. Thus the discharge capacity is strongly limited by what is happening at the anode. Any reduction of the electrolyte on the surface of anode further delithiates the anode and accelerates its discharge. This leads to a sliding or marching to the right of the discharge end point. To avoid any confusion, we want to clarify that the movement of the discharge endpoint does not imply that the reactions are taking place during discharge. But any reduction reactions on the anode during the subsequent charge and discharge result in the movement of the discharge endpoint to right. In Marching of the charge endpoint section and here, the charge/discharge voltage versus capacity curves are plotted such that the charge data goes from left to right, the discharge data is plotted from right to left, and each starts where the other ends. From Fig. 2e it is clear that for the cell with the higher anode loading, the discharge endpoint moves faster  to the right than the cell with lower anode loading,
  . This observation can be understood because the larger the loading of the negative electrode, the more area is available for electrolyte reduction, and the greater the marching rate to the right of the discharge endpoint.
Coulombic efficiency
As has been explained in Deshpande et al.,12 the coulombic efficiency CEn of the nth cycle of a cell is a function of only the discharge endpoints marching  . In other words, cells start from a fully discharged point, are charged to a cutoff voltage and then fully discharged back to the next discharge point. The coulombic efficiency is the discharge capacity divided by the charge capacity, or another way to think of it, the coulombic inefficiency is the difference between where the two full discharges end when the voltage versus capacity is plotted in a positive direction on charge and then superimposed on itself in the negative direction on discharge. Since the change in position of the discharge end points is are dictated solely by the side reactions on the anode, when the cell is anode limited on discharge, the coulombic efficiency is dictated solely by the side reactions on the anode.
![Equation ([1])](https://content.cld.iop.org/journals/1945-7111/162/10/A2026/revision1/jes_162_10_A2026eqn1.jpg)
In this equation, Qdn is the discharge capacity of any cycle n and Qcn is the charge capacity before the discharge in the nth cycle. In the given examples, since the cell with the higher anode loading (R = 4.54) marches faster to the right than the cell with lower anode loading (R = 1.18) i.e.  , the cell with R = 4.54 has a lower coulombic efficiency than the cell with the lower anode loading (R = 1.18). Thus, the coulombic efficiency does not include the rate of side reactions on the cathode.
Side reactions: Salt consumption or shuttle reactions?
Another way to view the rate of capacity fade in a cell is to look at the rate at which the charge and discharge endpoints are moving toward each other. If the difference between the anode and cathode marching rates, i.e.  or
or  , is positive, the capacity of the cell is declining at a rate equal to the difference.
  represents the shift in the discharge endpoint capacity per cycle and
  represents the rate of shift in discharge capacity endpoints with respect to time. If there is little to no impedance rise in the cell and no loss of sites for lithiation and delithiation in either electrode, the difference in the marching rate of the anode and cathode is strictly determined by side reactions and can be equated to a rate of loss of lithium inventory (RLLI) between the electrodes. Using the latter figure of merit of loss per time provides a rate of the side reactions in mA per gram. For the cells presented in this paper, the rate of loss of lithium inventory with respect to time is,
and
![Equation ([2])](https://content.cld.iop.org/journals/1945-7111/162/10/A2026/revision1/jes_162_10_A2026eqn3.jpg)
To determine the average amount of capacity fade per cycle, one would multiply these numbers by the total amount of time it takes to charge and discharge the cell per cycle. The data provided in this manuscript shows that although the charge and discharge endpoints march faster when the anode loading is higher (R = 4.54), the rate of capacity fade is actually lower since the difference in marching rates of the anode and the cathode is smaller, i.e. the anode and the cathode are marching more quickly but at nearly the same rates. For the cell with the lower anode loading (R = 1.18), even though the individual rates of marching of the charge and discharge endpoints are slower, the difference between their marching rates is larger, resulting in a greater overall rate of cell capacity fade.
The impact of the difference in the rate of marching of the anode (discharge endpoint) and the marching of the cathode (charge end point) is clear: there is a loss of cycleable capacity. But what additional impact may the absolute rate of the side reactions have on cell life? There are four general ways to look at this which include cross talk, to be described through a general set of reactions.
Anode side reaction:
Solvent (S) is reduced on the anode and in the process consumes two Li ions to form some partially soluble component (SLi2) which is associated with SEI formation:

Considering cross talk, some of the SLi2 dissolves in the electrolyte and diffuses to the cathode. When it reaches the cathode it does one of three things, 1) it reacts reversibly and regenerates the Li+ and S, 2) it reacts irreversibly forming S' but still regenerates the Li+, or 3) it reacts irreversibly and consumes PF6−.
Possible cathode reactions:
- (1)SLi2 → S + 2Li+ + 2e−
- (2)SLi2 → S' + 2Li+ + 2e−
- (3)SLi2 + 2PF6− → S(LiPF6)2 + 2e−
And although a strong argument has been put forth for crosstalk, it is possible that above and beyond the cross talk there is fresh electrolyte oxidation
- (1)S + 2LiPF6 → S(PF6)2 + 2Li+ + 2e−
Although it is possible for reaction (4) to occur in the cell, it cannot occur faster than the reaction on the anode, otherwise, the cathode would be marching faster than the anode and the cell would temporarily show an increase in capacity until the cathode marched off the anode and the anode displayed lithium deposition. It is not known if these reactions are one-or two-electron reactions but chose two-electron for these examples as this is generally assumed for most SEI formation reactions.
As a result of these four scenarios on the cathode, there are four total reactions in the cell.
Total reactions:
- (1)S + 2LiPF6 → S + 2LiPF6 Benign shuttle
- (2)S + 2LiPF6 → S' + 2LiPF6 Shuttle with loss of solvent
- (3)

- (4)


If the first scenario is the most accurate of what is happening in the cell, then there are no long-term effects of the side reactions. If the second scenario is the most accurate, then there is a net loss of solvent as a result of the cross talk. Since there is a lot of solvent compared to salt, this may take a long time to reveal its repercussions (most likely catastrophic cell failure). If the third scenario is correct, then there will be a loss of salt as well. This could lead to an earlier death of the cell as there is typically less Li+ in the electrolyte than there is Li+ in a fresh cathode. If the fourth scenario is the most accurate, then a lot of solvent would be lost in addition to the salt, although there is generally an excess of solvent when compared to salt in the cell.
The total electrolyte consumption is dependent on the scenario considered. For all of the cells, where the anode marches faster than the cathode and leads to a net capacity fade, only solvent is lost from that difference in marching rates, as the Li+ in the anode reaction is supplied by the cathode keeping the LiPF6 concentration constant. If the cathode is also marching, the following can be said about the electrolyte.

For the cell with the benign shuttle (scenario 1), the net solvent lost is equal to the net rate of capacity fade in the cell (RLLI) in mAh divided by the two electrons involved in the reaction. For a cell with R = 4.54, rate of capacity fade 0.03 mA g− 1. For the approximate calculations we assume the density of the solvent to be 1.32 g mL− 1 which is close to the density of EC at room temperature. With the NMC weight of 8.577 mg, the solvent loss is calculated to be approximately 0.48 μL. Since ca. 90 μL of electrolyte is added to the cell during the fabrication step, then the solvent loss with this mechanism is negligible, i.e. 0.53%. Similarly for the cell with R = 1.18, the solvent loss is 0.9 μL, which is again about only 1% of the total initial solvent in the system. In this scenario, there is no net loss of electrolyte salt. Hence, if the first scenario is the most accurate description of what is happening in the cell, then there should be no long-term effects of the side reactions on cell life.

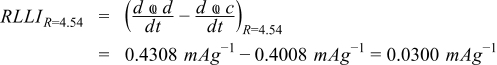
For the cell where there is a shuttle but loss of solvent, scenario 2, the rate of solvent loss is equal to the rate of the total rate of anode marching divided by two electrons per reaction. This is because solvent is lost for both types of reactions, i.e., the capacity loss reaction as well as the shuttle reaction. For a cell with R = 4.54, the rate of marching of the anode is  . Following similar assumptions as above, in 1500h of cycling, the solvent loss is calculated to be approximately 6.9 μL, which is about 7.7% of the total initial solvent in the system. For R = 1.18, with
  , solvent loss in 1500h via this mechanism (scenario 2) is predicted to be 2.4 μL, which is about the 2.7% of the total initial solvent in the system. In this scenario, there is no net loss of electrolyte salt. Hence, if the second scenario is the most accurate, then there is a net loss of solvent as a result of the cross talk. Since there is a lot of solvent compared to salt, this would also take a long time to reveal its repercussions (most likely catastrophic cell failure).

For the cell where there is an irreversible shuttle resulting in loss of electrolyte, scenario 3, the rate of solvent loss is equal to the rate of the anode marching divided by two electrons per reaction similar to that in scenario 2. In 1500h of cycling, the solvent loss is about 7.7% for the cell with R = 4.54 and 2.7% for cell with R = 1.18.
At the same time, in scenario 3, there is a loss of the electrolyte salt due to shuttle reaction as shown above. Since cathode marching is governed by the magnitude of shuttle reaction, the electrolyte salt lost is equivalent to the marching rate of the cathode (For R = 4.54,  ). Interestingly, in this scenario, the solvent loss is related to the anode marching but the electrolyte salt lost is equivalent to the marching rate of the cathode. This is because, solvent is lost in all of the side reactions in the cell which includes capacity loss reactions and the shuttle reaction, while electrolyte salt is lost only due to shuttle reactions. For the cell with R = 4.54, using the cathode marching rate, in 1500h, the electrolyte salt lost can be calculated to be 19.23 × 10− 5 mol. Since 90 μL of 1 M LiPF6 salt solution is used, this equates to an initial lithium salt quantity of only 9 × 10− 5 mol. Thus, this model of salt depletion with an irreversible shuttle reaction leads to an estimation of salt loss than is greater than what is in the electrolyte when first assembled. According to this model, the cell should have died well before the 1500h of cycling. This indicates that the assumption of irreversible salt consumption by the electrolyte reactions does not represent the correct physics inside the cell.

For the cell where there is solvent and electrolyte loss at both electrodes and no shuttle or crosstalk, scenario 4, the net loss of solvent is related to the sum of the marching of the anode and cathode and the salt lost is related to the cathode marching (For R = 4.54,  ). For R = 4.54, in a 1500h of cycling, solvent lost is about 13.3 μL i.e. 14.8% of the initial solvent. And the electrolyte salt lost for the cell R = 4.54 is same as scenario 3, which is 19.23 × 10− 5 mol. This model of salt depletion with no shuttle reaction again leads to estimation of salt loss that is greater than that which is available. Since the cell is still running after 1500h, we conclude that the model of 'salt consumption with no shuttle' does not represent the correct physics inside the cell either.
With the analysis above, it seems shuttle reactions in either scenario 1 or scenario 2 are most likely the dominant reactions in the current cells leading to marching of the endpoints in both electrodes, while irreversible salt consumption by the electrolyte reactions is highly unlikely. The increased 1st cycle charge capacity as a result of a larger anode also supports the hypothesis of cross talk between the two electrodes with the likely hood of migration and reverse reactions of the electrode reaction products SLi2 forming at the cathode. In the case of reversible reactions, electrolyte salt and solvent are not consumed in the overall reaction, hence they do not lead to catastrophic cell failure.
Though we do not have direct observation of SEI dissolving, the numbers above do indicate the possibility of such a phenomenon. Apart from that, the indications of dissolution of side reaction products (or SEI) have been observed/proposed earlier by several research groups.23–25 In fact, a strong possibility of some of the side reactions being reversible has been expressed earlier. For example, CO2 is known to reduce to oxalate, formate and carbonate on negative electrode at normal conditions and oxalate/formate is easily oxidized back to CO2 on the positive electrode.26,27 In fact, it's postulated that CO2 undergoes reduction more easily than the other components of the electrolyte.26 The cell with more anode (R = 4.54) material may have generated more CO2 during formation, which stays in the cell and acts as a shuttle.
Capacity loss and mechanical degradation
The data presented shows that, though the coulombic efficiency of the cell with R = 4.54 is less than the coulombic efficiency that of cell with R = 1.18, the capacity fade rate in the former cell is lower.
Thus we conclude that there are two types of side reaction products:
- (1)Reaction products: Those which dissolve back into the electrolyte solvents at the operating conditions get oxidized on the cathode and contribute to shuttle reaction.
- (2)Reaction products: Those which do not dissolve back into the electrolyte solvents and thus remain attached to the electrode surface forming a stable SEI film.
For example, as mentioned earlier, CO2 in the cell may reduce to oxalate, formate and carbonate on the negative electrode at normal conditions. Among these products, oxalates and formates are easily oxidized back to CO2 on the positive electrode26,27 while carbonates do not easily dissolve in the electrolyte solvents at normal operating conditions.
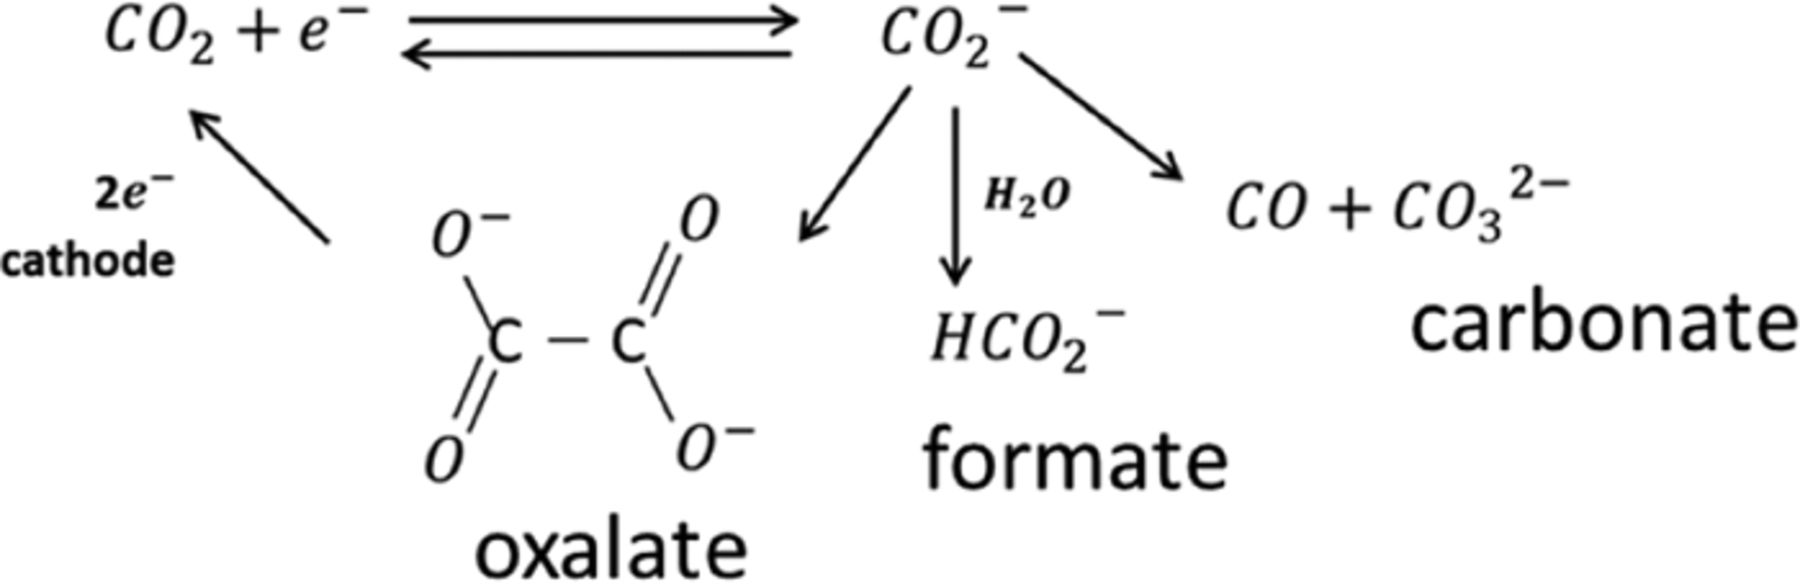
(Reactions above are reproduced from Ref. 27)
If the CO2 reduction on the anode results in the formation of reaction products such as carbonates, it will result in capacity loss. This is because carbonates do not dissolve in the electrolyte solvents at the normal operating conditions and thus do not participate in shuttle mechanism. On the other hand, if CO2 reduction on the anode results in oxalate/formate formation, these reaction products might dissolve back and get oxidized to CO2 on the cathode.
From the data presented it's clear that the distribution of dissolvable and non-dissolvable products in both cells is not the same. The cell with R = 1.18 has more capacity loss, thus relatively more non-dissolvable products and the cell with R = 4.54 has relatively more dissolvable products resulting in lower coulombic efficiency. Mechanical degradation models can give one of the possible explanations of the differences in distribution of the reaction products between dissolvable and non-dissolvable products in the two cells. We hypothesize that the reaction conditions on the bare electrode surface would be more favorable to non-dissolvable product formation (such as carbonates) thus forming a more stable SEI film. This is consistent with the large first cycle capacity loss observed in cells indicating that bare electrode surface favors non-dissolvable product formation (such as lithium carbonate). We also observe that there is a four-fold increase in rate of shuttle reaction (0.0932 mAg− 1 to 0.4008 mAg− 1) as the anode surface area increases by four-fold (13.26 cm2 to 54.20 cm2). It suggests that the side reactions forming dissolvable products are proportional to the total surface area of the negative electrodes. Since after formation cycles, most of the electrode surface would be covered with SEI, reactions through SEI seem to favor dissolvable products more.
As discussed earlier, the difference between anode marching and cathode marching leads to capacity loss in the battery. It's well established that in LIBs side reactions take place during cell storage as well as cycling. During cycling, DISs are postulated to assist side reactions by exposing new bare electrode surface to the electrolyte resulting in additional capacity loss as compared to storage loss.4,28 DIS models provide an explanation for the faster capacity fade observed during cycling as compared to storage. Thus during cycling, the capacity decay of a cell depends on the amount of new surface of the electrode particles exposed to the electrolyte during each cycle. The theory of DIS can therefore provide a possible explanation for the higher rate of degradation in a cell with a lower anode loading (R = 1.18). Solid state diffusion of lithium atoms in and out of the host electrode particles results in DISs in the electrode particles as a result of the volume change that occurs during charge and discharge. Depending upon the operating conditions, these stresses might have different effects on the electrodes such as mechanical fatigue and fracture of the electrode particles, electrode particle isolation from the composite matrix, or SEI fracture, to name some of the more popular explanations.13,14
As would be expected, the cell with the higher anode loading (R = 4.54) that delivers a lower first cycle discharge capacity than the cell with the lower anode loading, would have less overall lithiation/delithiation of the individual anode particles as compared to the particles in the electrode with the lower anode loading (R = 1.18). In Fig. 4, we plot differential voltage curves (dV/dQ) for the two cells again graphite cell capacity per gram of graphite material, i.e., mAh/g of the graphite material. At the end of formation, the charge capacities, based on the initial weight of the anodes are calculated to be 260 mAh/g and 55 mAh/g for R = 1.18 and 4.54, respectively. This is clearly seen in the dV/dQ curves shown in Fig. 4, which indicate that the cell with R = 1.18 shows at least two distinct peaks corresponding to at least two different phase transitions in the graphite electrode, whereas the dV/dQ plot of a cell with R = 4.54 has only one visible peak, which indicates that the cell with R = 4.54 does not undergo the same number of phase transitions as the cell with R = 1.18. This means that although the anodes are both fully delithiated at the end of discharge, the anode particles in a cell with R = 4.54 are much less lithiated on average at the end of charge. This also means that, during each cycle, the electrode particles with the higher R (R = 4.54) undergo less expansion and contraction. Here we describe a possible mechanism of capacity loss due to DISs.

Figure 4. Differential voltage curve, dV/dQ vs. Q, for R = 1.18 and R = 4.54, for the charge process of last formation cycle.
Electrode particle cracking due to mechanical fatigue
Deshpande et al.4 proposed that DISs the particles experience at the surface during each cycle result in crack propagation due to mechanical fatigue. Fig. 5 shows schematically crack propagation as a possible mechanism for capacity loss in electrodes.

Figure 5. Schematic diagram showing capacity loss due to crack propagation on the negative electrode.
The ion flux density (A/m2) on the graphite electrodes can be estimated based on the surface area of the graphite electrodes in both cells and assuming a uniform current distribution in both electrodes. For the cell with the higher R (R = 4.54), the average ion flux density on the negative electrode is much smaller, 0.3 × 10− 2 mA cm− 2, as compared to the cell with the lower R (R = 1.18), 2.28 × 10− 2 mA cm− 2. To understand the effect of current density on the electrode particle, previously developed DISs model is implemented.
It is assumed that the diffusion in the nearly spherical anode particles during a galvanostatic charge condition can be described by Fick's law of diffusion. The DISs in the particle can be calculated using the thermal stress analogy as has been previously published.4,29 Cheng and Verbrugge29 showed the maximum stress in a cell is at the surface of the particles in the tangential direction at the start of discharge. The magnitude of this stress (σθ) is described as
![Equation ([3])](https://content.cld.iop.org/journals/1945-7111/162/10/A2026/revision1/jes_162_10_A2026eqn9.jpg)
where Eα is the Young's modulus and να is the Poisson's ratio of the electrode material, Ωα is the partial molar volume of the solute, Rp is the electrode particle radius, D is the diffusion coefficient of the solute inside electrode particle, F is Faraday's constant, x = r/Rp, τ = tD/Rp2, r is any radial location from the center, t is time during lithiation or delithiation, positive current densities i over the particle surface denote charging, and λn(n = 1, 2, 3, ...) are the positive roots of tan(λn) = λn. For a thin film electrode with a specific surface area as, thickness L, and geometric area A and the cell current Icell, the current density over a particle surface i can be calculated as
![Equation ([4])](https://content.cld.iop.org/journals/1945-7111/162/10/A2026/revision1/jes_162_10_A2026eqn10.jpg)
here Aelectrode is the electrode surface exposed to the electrolyte.
At any given characteristic time τ, the tangential tensile stress σθ on the particle surface is proportional to the current density over the electrode particles i
![Equation ([5])](https://content.cld.iop.org/journals/1945-7111/162/10/A2026/revision1/jes_162_10_A2026eqn11.jpg)
Deshpande et al.4 also suggested that the capacity loss due to crack propagation in the negative electrode particles is actually a function of maximum stress on the electrode particles. The capacity loss increases with increased stress magnitude
![Equation ([6])](https://content.cld.iop.org/journals/1945-7111/162/10/A2026/revision1/jes_162_10_A2026eqn12.jpg)
Since  .
.
Among the two types of cells described in this paper, anode particles of the cell with the lower anode loading have a much higher current density and thus experience much higher maximum tangential stress. With the theory of fatigue fracture in solid mechanics, the crack propagation is a function of the maximum stress that the material experiences. Higher stress magnitude increases the tendency of cracks propagation. Thus in case of battery electrodes, the larger the stress, the more surface of the anode is exposed to the electrolyte solvent and thus more active Li is consumed by the solvent reactions toward re-passivating the surface. This is one possible explanation for the higher capacity fade in the cells with the lower anode loading (R = 1.18).
We recognize that there may be other possible mechanisms causing differences in cell performances as there is no direct evidence for cracking of the particles. A thorough investigation of the electrode surface may give a detailed understanding of this phenomenon. Such an investigation is beyond the scope of this work.
In summary, we believe there are two types of side reactions in Li-ion cells. The first type of reaction results in the coverage of freshly exposed anode surfaces with a SEI and occurs the first time the anode reaches low voltages and also occurs where there are cracks in the SEI that expose fresh surface. Thus, electrodes with more cracks have more of this type of side reaction. The second type occurs as a result of dissolution of the SEI that occurs at low state of charges (SOCs) but is reformed at high SOCs. The dissolved SEI diffuses across the cell where it is oxidized resulting in no loss of capacity. Thus, a cell with a large overall amount of anode material will experience a lower coulombic efficiency because it has much more SEI that can then dissolve and subsequently reformed, where the dissolved components migrate to the cathode where it is reduced but does not result in greater capacity fade. A cell with less anode material will experience higher current density at the particle level that results in diffusion induced cracking of either the SEI or particles which requires solvent consumption and loss of lithium inventory in the cell and relative marching of the anode versus the cathode. This work complements the work of Deshpande et al.12 where it was also hypothesized that VC slows the rate of the second type of reaction but has no effect on the first in a graphite/NMC cell.
Conclusions
Graphite/NMC full cells with two different anode loading levels were tested to establish a better understanding of coulombic efficiency and cell capacity fade rate. The cell with a higher anode loading demonstrated more 1st cycle charging capacity. A cross-talk between the anode and cathode is postulated to be the reason behind this additional capacity. The cell with the higher anode loading also experienced a greater loss of cycleable capacity upon completion of the formation process. The capacity loss during the formation process is directly related to the total surface area of anode exposed to the electrolyte. The cell with the higher anode loading demonstrated poorer coulombic efficiency during long-term cycling. By following the charge and discharge endpoints, it is shown that the coulombic efficiency of a cell is a measure of the marching rate of the discharge endpoint, which for both types of cells was the anode. Any increase in the amount of reduction reactions causes the anode to meet the discharge limits earlier and thus increase its marching rate. The higher marching rate of anode for a cell with higher anode loading (R = 4.54) is assigned to the greater surface area of the anode and the hypothesis that the SEI is constantly dissolving and reforming based on SOC. Consequently, by changing the anode loading, the marching rate of the charge end point, for which the cells were cathode limited, also changed. Increased marching of the cathode due to increased loading of anode strongly suggests that the amount of electrolyte oxidation on the cathode surface is dependent on the amount of anode present in the cell. Through some simple calculations, it was shown that the salt was not consumed at the full rate of the side reactions on both electrodes or the cells would consumed all of the salt in the cells much sooner than when they actually reached the end of test. Thus, we re-affirm the hypotheses that a shuttle reaction between the anode and cathode occurs without the consumption of electrolytic salt. We believe that the electrode reaction products that make up the SEI on the anode, SLi2, dissolve in the electrolyte, migrate to the cathode and undergo a reaction that recovers the salt. Such a shuttle, reversible or not, does not lead to capacity loss in the short term.
Consistent with one of the main conclusions in Reference 12, we establish that the coulombic efficiency is not a good indicator of battery capacity failure. Additionally, we demonstrate that a cell with higher coulombic efficiency can possibly have a higher capacity fade rate.
Acknowledgments
The authors would like to express gratitude to the entire battery research members of Dr. Battaglia and Dr. Gao Liu in the Electrochemical Technologies Group of Lawrence Berkeley National Lab. Special thanks to Dr. Yanbao Fu, Xiangyun Song, and visiting student Min Ling, who were very helpful with the running of the experiments. The authors acknowledge the BATT Program and the U.S. Department of Energy, as well as National Science Foundation Award No. 1355438 (Powering the Kentucky Bioeconomy for a Sustainable Future) for partially funding this project.