Abstract
In this paper, we report the performance of a full electrochemical cell which directly converts carbon dioxide to fuels at room temperature and ambient pressure. The design of this cell features a buffer layer of liquid-phase electrolyte circulating between the ion exchange membrane and the cathode Sn catalyst layer. In the absence of the buffer layer, hydrogen was the predominant product with a faradaic efficiency nearly ∼100%. Incorporating a buffer layer with an electrolyte, e.g. 0.1 M KHCO3, substantially promoted the formation of formate and CO, while suppressing hydrogen production. When the anode was fed with hydrogen, the onset of formate production occurred at −0.8 V, with a faradaic efficiency of 65% and a partial current density of −1 mA cm−2; at which the energy efficiency toward formate production was 50%. The highest faradaic efficiency observed toward formate formation was over 90% at −1.7 V corresponding to a partial current density of −9 mA cm−2. When the anode was fed with aqueous reactant (e.g. 1 M KOH solution), the formate production began at −1.2 V with a partial current density of −1 mA cm−2, corresponding to a faradaic efficiency of 70% and an energy efficiency of 60%. In this case, the highest faradaic efficiency toward formate formation was 85% at −2.0 V with a partial current density of −6 mA cm−2. Our studies show that this full electrochemical cell with a circulating liquid-phase electrolyte buffer layer enables production of formate at an overpotential of ∼−0.2 V regardless of the gaseous or aqueous reactants at the anode side.
Export citation and abstract BibTeX RIS
Electrochemical reduction of CO2 using renewable sources of electricity is an alternative approach to produce fuels, akin to photosynthesis, thus potentially reducing the dependence on foreign fuels as well as mitigating the concentration of CO2 in the atmosphere. The design of the electrode and its reactor is a critical step for the feasible production of fuels from CO2 on a large scale. The electrochemical reduction process, a.k.a. electrolysis, can take place over a wide range of temperatures, from room temperature to over 1000°C. In the case of high temperature electrolysis, solid oxide electrolysis cells (SOECs) are exemplary for the electrochemical conversion of CO2 into CO or co-electrolysis of H2O and CO2 to form syngas (CO and H2). In general, SOECs exhibit a low overpotential and superior selectivity to CO formation as well as high current density.1–3 The overarching challenges facing prolonged SOEC operation include the electrode degradation due largely to the formation of coke and volatile nickel-carbonyls.4–6
Low temperature electrolysis of CO2 has been investigated extensively in electrochemical cells consisting of solid polymer electrolyte.7–15 Earlier work was carried out by using proton exchange membrane fuel cells (PEMFCs) to directly convert CO2 to other species in gas phases.7,8 Various hydrocarbons, including CH4, C2H4 and C2H6, were observed on a copper electrode deposited on Nafion 117 membrane; the overall faradaic efficiency, however was ∼1% due to the acidity of the Nafion membrane which promoted the competitive hydrogen evolution reaction over CO2 reduction reaction.12,16 Modifications in the physical structure of PEMFCs were adopted to improve the activity and selectivity of the electrodes.9–14 For instance, a 3D cathode consisting of a Sn-Cu mesh screen was investigated with Nafion 117 membrane as a separator. This design allowed a co-current flow of CO2 and catholyte through the cathode, thus providing an aqueous environment for CO2 reduction.9 As a consequence, the faradaic efficiency toward formate formation was substantially improved to ∼86% at a cell potential of 3 V. The high operation voltage resulted from great ohmic loss and cathodic overpotential.9 In addition, the lower solubility of CO2 in aqueous electrolytes17 significantly affected cell performance at higher current densities because of mass transfer constraints. In another design, a glass fiber saturated with 0.5 M KHCO3 was inserted between the Nafion membrane and the Ag gas diffusion electrode (GDE) to prevent excessive buildup of protons near the cathode, which resulted in a significant increase of selectivity toward CO2 reduction to CO.12 The glass fibers, however could become dry during electrolysis due to the evaporation of water, resulting in degradation of cell performance. One approach to circumvent this drying issue was to operate the cell with a flowing electrolyte stream in place of saturated glass fiber.13 With a continuous flowing electrolyte, formate production on Sn GDE was achieved at a faradaic efficiency of ∼70% by using 0.5 M KCl as the electrolyte at pH = 7, while the efficiency increased to ∼90% at pH = 4. The cell, however, was operated at high voltages to obtain formate.13 Recently, an ionic liquid was used as the catholyte with Ag GDE to convert CO2 to CO, which showed substantial improvement over both faradaic efficiency (∼100%) and the overpotential (less negative than −0.2 V) toward CO formation due to the decrease of the free energy for formation of the intermediate CO2−.18
In this paper, we report a design of a full electrochemical cell based on the PEMFC configuration by inserting a circulating liquid-phase electrolyte buffer layer between the Nafion membrane and Sn GDE. This design demonstrates the feasibility to use current PEMFC hardware for electrochemical CO2 conversion. This bench-scale full electrochemical cell precedes a future pilot-scale demonstration plant to generate fuels from CO2 reduction. There are three key advantages of this cell design: (1) Insertion of a liquid-phase buffer layer significantly shifts the selectivity toward formate formation (2) In comparison with stationary electrolytes, the continuous circulation of the electrolyte provides moderate convective mixing and maintains adequate pH near cathode surface necessary for CO2 reduction (3) A circulating electrolyte provides a cost-effective method for the accumulation of liquid products.
Experimental
Configuration of a full electrochemical cell
The buffer layer adopted in this research resides between the Nafion membrane and the cathode. A gas diffusion layer (GDL) and a half catalyst-coated membrane (CCM) were hot pressed together to serve as the anode. The Sigracet GDL 10BC was purchased from SGL group. The half CCM was made by spraying Pt/C catalysts (60%, Johnson Matthey) ink onto one side of a Nafion 212 membrane (DuPont). The Pt loading was 0.3 mg cm−2. The Sn based cathode was made by spraying Sn (Alfa Aesar, APS 100 nm) catalyst ink onto the GDL. The Sn catalyst ink was prepared by mixing Sn powders, Nafion ionomer, deionized water, and isopropanol with an optimized volume ratio, followed by ultrasonicating the mixture for one hour. The cathode had a geometric area of 4 cm2 and a loading of Sn ∼2 mg cm−2. The thickness of buffer layer was approximately 2.4 mm. Figure 1 illustrates the schematic of the full electrochemical cell. All the reactant gases were supplied at ambient pressure (p° = 1.013 bar) and room temperature (T = 298 K). The cathode side of the cell (where the electrochemical reduction of CO2 occurs) was supplied with gas-phase CO2 (99.998%) at a flow rate of 45 mL min−1. The anode side of the cell was supplied with either H2 (99.99%) at 150 mL min−1 or 1 M KOH (pH = 13.8, Sigma-Aldrich, reagent grade) solution at 10 mL min−1. All the gases and solutions flowed along serpentine channels in graphite over which gold-plated metal hardware was chosen as the current collector. The aqueous electrolyte of 0.1 M KHCO3 (pH = 7, Sigma-Aldrich, ACS reagent grade) was used as the buffer layer and circulated at a flow rate of 5 mL min−1. The total volume of the electrolyte solution was 10 mL. The liquid products were accumulated in the electrolyte solution during electrolysis. The formate concentration was 2–100 μmol mL−1 at the end of 0.5 h electrolysis in the potential range, −0.8 to −2.8 V.
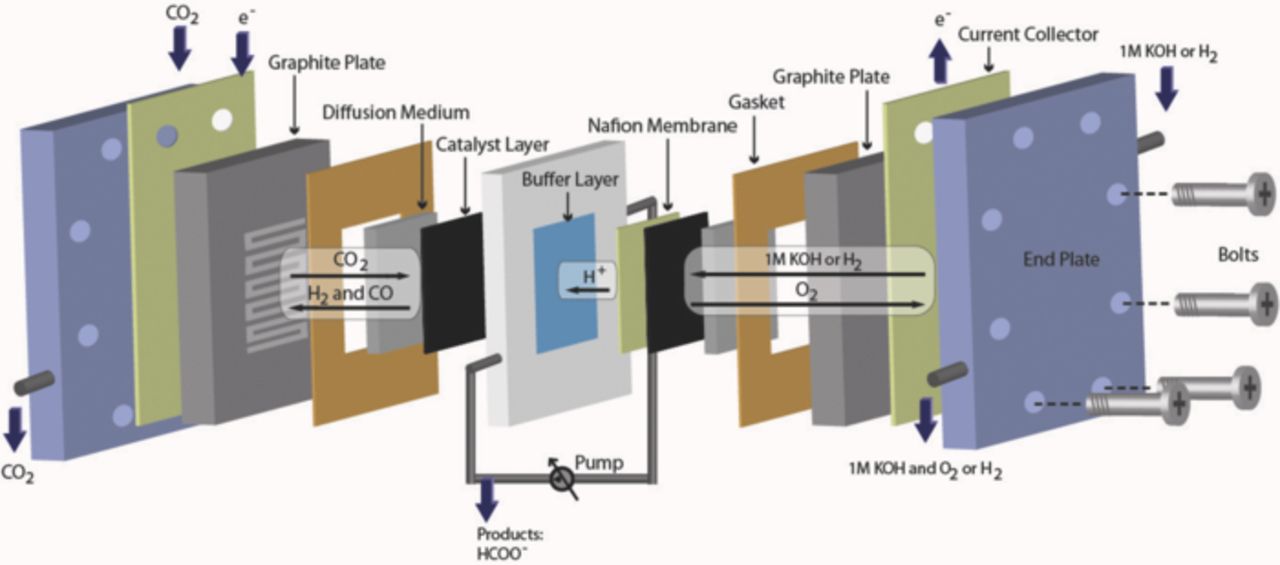
Figure 1. A schematic of the full electrochemical cell featuring a buffer layer of circulating liquid-phase electrolyte.
The anode reaction is either hydrogen oxidation or oxygen evolution depending on the choice of the reactants. The reactions are shown in Eqs 1 and 2, respectively.
![Equation ([1])](https://content.cld.iop.org/journals/1945-7111/160/9/F953/revision1/jes_160_9_F953eqn1.jpg)
![Equation ([2])](https://content.cld.iop.org/journals/1945-7111/160/9/F953/revision1/jes_160_9_F953eqn2.jpg)
The electrochemical reduction of CO2 into formic acid occurs at the cathode side and is shown below. The formic acid dissociates to formate (HCOO−) in a neutral electrolyte.
![Equation ([3])](https://content.cld.iop.org/journals/1945-7111/160/9/F953/revision1/jes_160_9_F953eqn3.jpg)
Electrochemical measurements
Potentiostatic electrolysis was conducted at room temperature (25 ± 1°C) and ambient pressure by means of a potentiostat (Princeton Applied Research PARSTAT 2273 potentiostat/galvanostats with a power booster up to 20 V/20 A and Bio-Logic VMP3 Potentiostats/Galvanostats) recording the current. Current density is expressed as the total current divided by the geometric surface area of the electrodes. The faradaic efficiency is determined by means of the charges consumed to produce a specific product divided by the total charges passed during the electrolysis for 0.5 h. The individual electrode potential during potentiostatic electrolysis was measured as referred to the Ag/AgCl reference electrode which was placed in the middle of the buffer layer. The cell ohmic resistance was measured by electrochemical impedance spectroscopy at open circuit voltage, with amplitude of 5 mV and frequency range of 100 kHz to 0.1 Hz. The total cell ohmic resistance was about 7.3 Ω corresponding to an area specific resistance (ASR) of 29.2 Ω cm2.
Product analysis and quantification
Liquid products were quantified by using 1D 1H nuclear magnetic resonance (NMR) spectroscopy. The NMR data was acquired by using a Varian Mercury/VX 400 MHz spectrometer. More details can be found in our previous work.19 Gas products were quantified by using gas chromatography (GC, Inficon Micro 3000 GC). The residual reactant and product gases from the outlet of the cathodic compartment were vented directly into the gas-sampling loop of GC. The GC has two channels, one equipped with a packed 10 m MolSieve 5A column and the other with a packed 8 m Plot Q column. Each channel was connected with a thermal conductivity detector. Helium (Airgas, 99.999%) was used as the carrier gas to quantify CO concentration while argon (Airgas, 99.999%) was used to quantify hydrogen concentration. A standard gas mixture consisting of 1000 ppm CO and 1000 ppm H2 in CO2 was employed to calibrate the GC and to acquire the gas peak area conversion factor. The moles of CO produced during the electrolysis reaction were calculated from the GC peak area as follows:
![Equation ([4])](https://content.cld.iop.org/journals/1945-7111/160/9/F953/revision1/jes_160_9_F953eqn4.jpg)
where α is the conversion factor based on calibration of the GC with a standard sample, p° is 1.013 bar, T is 273 K, and R is the universal gas constant (8.314 J mol−1 K−1). The flow rate of CO2 was 41.2 sccm.
Results and Discussion
Role of the liquid-phase buffer layer
Figure 2a shows the trend in faradaic efficiency toward hydrogen evolution in a conventional PEMFC without a buffer layer, in which Pt/C is replaced by Sn at the cathode side. The faradaic efficiency toward hydrogen production was ∼100% when helium was supplied to the cathode. When CO2 was used instead of helium, hydrogen was the only product observed until a cell potential of −1.8 V. As cell potentials were increased to more cathodic values, the faradaic efficiency toward hydrogen evolution was found to decrease slightly by a few percentages. We used a chiller to condense volatile products in the cathode outlet tube. NMR analysis indicated the presence of formate in the liquid products; however, CO was not observed in GC trace analysis. In the absence of a buffer layer, hydrogen evolution reaction (HER) clearly dominated over the CO2 reduction reaction. Similar results were also observed on Ag GDE in a PEMFC type electrolysis cell.12 Moreover, the I-E curve indicated high activity toward HER as shown in Figure 2b. A high current density, ∼1 to 2 A cm−2 was observed at moderate cell potentials, −1 to −2 V, which was consistent with the low total ASR of about 1.0 Ω cm2 between this potential range (Figure 2b).
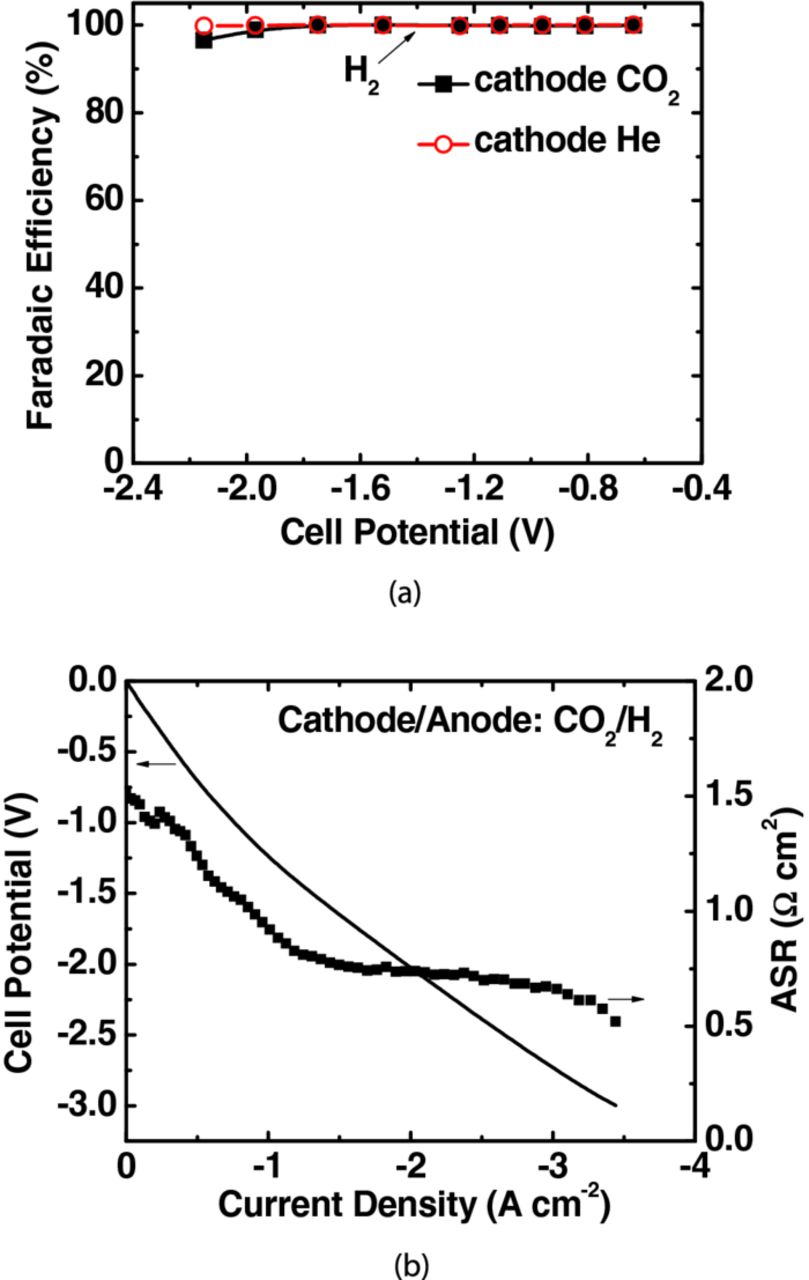
Figure 2. The performance of a full electrochemical cell without a buffer layer for CO2 reduction. (a) faradaic efficiency of H2 and (b) polarization curve and ASR. The anode was supplied with H2 (150 mL min−1) while the cathode with He (45 mL min−1) or CO2 (45 mL min−1) at p° = 1.013 bar and T = 298.15 K. Catalyst loading was 2 mg cm−2 for Sn and 0.3 mg cm−2 for Pt on carbon powder support.
This dominance of HER over CO2 electro-reduction can be understood by its favorable thermodynamics and facile kinetics.20–25 HER in an aqueous medium occurs via two successive steps; the initial discharge of a hydronium ion (H3O+) to give adsorbed hydrogen atom Hads (Volmer step) followed by combination of two adsorbed Hads atoms (Tafel step) or adsorbed Hads with H3O+ in the solution (Heyrovsky step) yielding H2.20,22 This competition between HER and CO2 reduction suggests the importance of controlling the H+ concentration near the cathode surface to suppress HER, and thus facilitate CO2 reduction. We used a buffer layer of circulating aqueous electrolyte to mediate this H+ concentration.
Full cell with a buffer layer and hydrogen supplied to anode
When a buffer layer of 0.1 M KHCO3 was used, the cathode selectivity toward formate formation was significantly improved. Figure 3 shows NMR spectra of 1H in the formate group as a function of the applied cell potentials. Formate was the only liquid product, which was formed at a cell potential of −0.8 V. This corresponded to an overpotential of −0.19 V with respect to the apparent standard cell potential of −0.61 V when taking into consideration the anodic (H2 oxidation, Eq. 1) and the cathodic reactions (CO2 reduction, Eq. 3, apparent standard potential, E°* = −0.61 V vs. SHE for pH = 7). This low overpotential is mainly attributed to the optimized microstructure of Sn GDEs, which possess a large number of triple-phase boundaries where electrons, protons and CO2 gases meet and react. Reduction of CO2 at a lower overpotential is of substantial importance to achieve greater cell performance. Similar overpotential of ∼−0.2 V was recently reported in a cell mediated by ionic liquids, which provided more favorable thermodynamics for CO2− intermediate formation.18,26
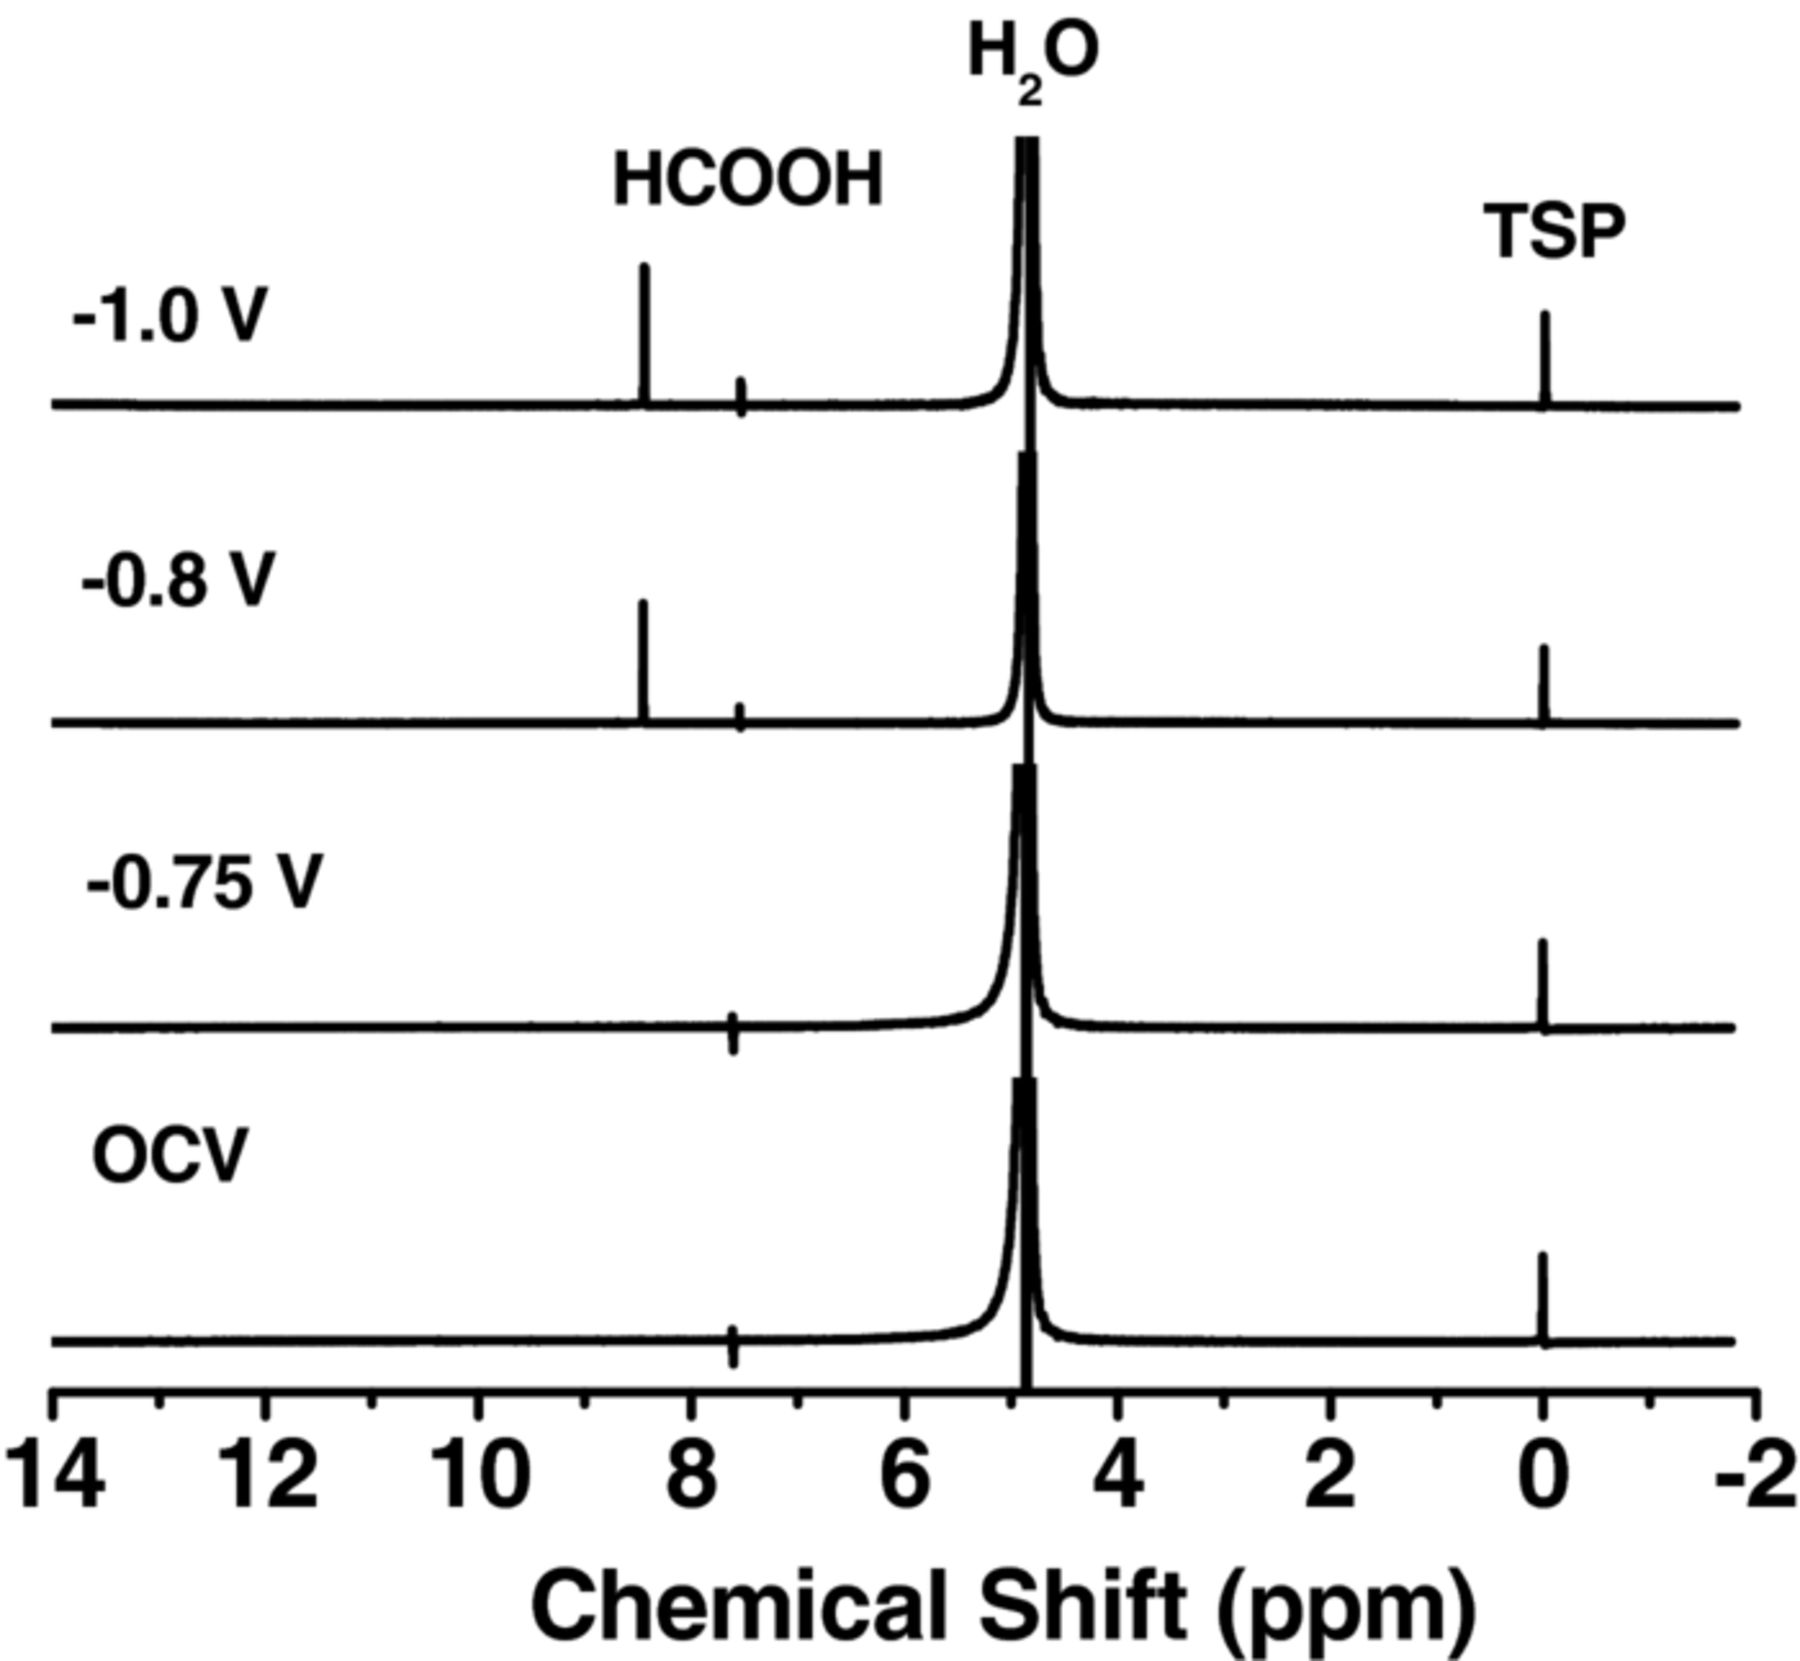
Figure 3. The NMR spectra of 1H in the formate group as a function of the applied cell potentials. CO2 reduction was carried out in the full electrochemical cell with a buffer layer at room temperature and ambient pressure. Electrolyte (0.1 M KHCO3) was circulated at 5 mL min−1. The anode and cathode were supplied with H2 (150 mL min−1) and CO2 (45 mL min−1), respectively, at p° = 1.013 bar and T = 298.15 K.
Figure 4a illustrates the trend in faradaic efficiency for different products as a function of applied cell potential. These results were found reproducible in four independent operations within acceptable range. The faradaic efficiency toward formate formation started with 65% at −0.8 V and increased at more negative cell potentials. The maximum faradaic efficiency was observed ∼90% at −1.7 V. When 0.5 M Na2SO4 was used as buffer layer, formate was also formed at −0.8 V with a faradaic efficiency of ∼47%. The utilization of a circulating buffer layer and optimized microstructure of electrode were attributed to achieving a high faradaic efficiency at a low overpotential toward formate formation on Sn GDE by mediating H+ concentration near the cathode surface. The presence of H+ is essential to form formate, through the protonation of the carbon in the intermediate CO2−, followed by a second electron transfer.27 The excessive H+ concentration, however results in preferable hydrogen evolution over CO2 reduction as observed in the cell without a buffer layer. The faradaic efficiency toward CO formation exhibited a similar trend as formate. The maximum faradaic efficiency of CO was ∼13% at −1.2 V. On the other hand, the faradaic efficiency for hydrogen formation drastically dropped to ∼20% and further decreased below 10% as potentials became more negative.
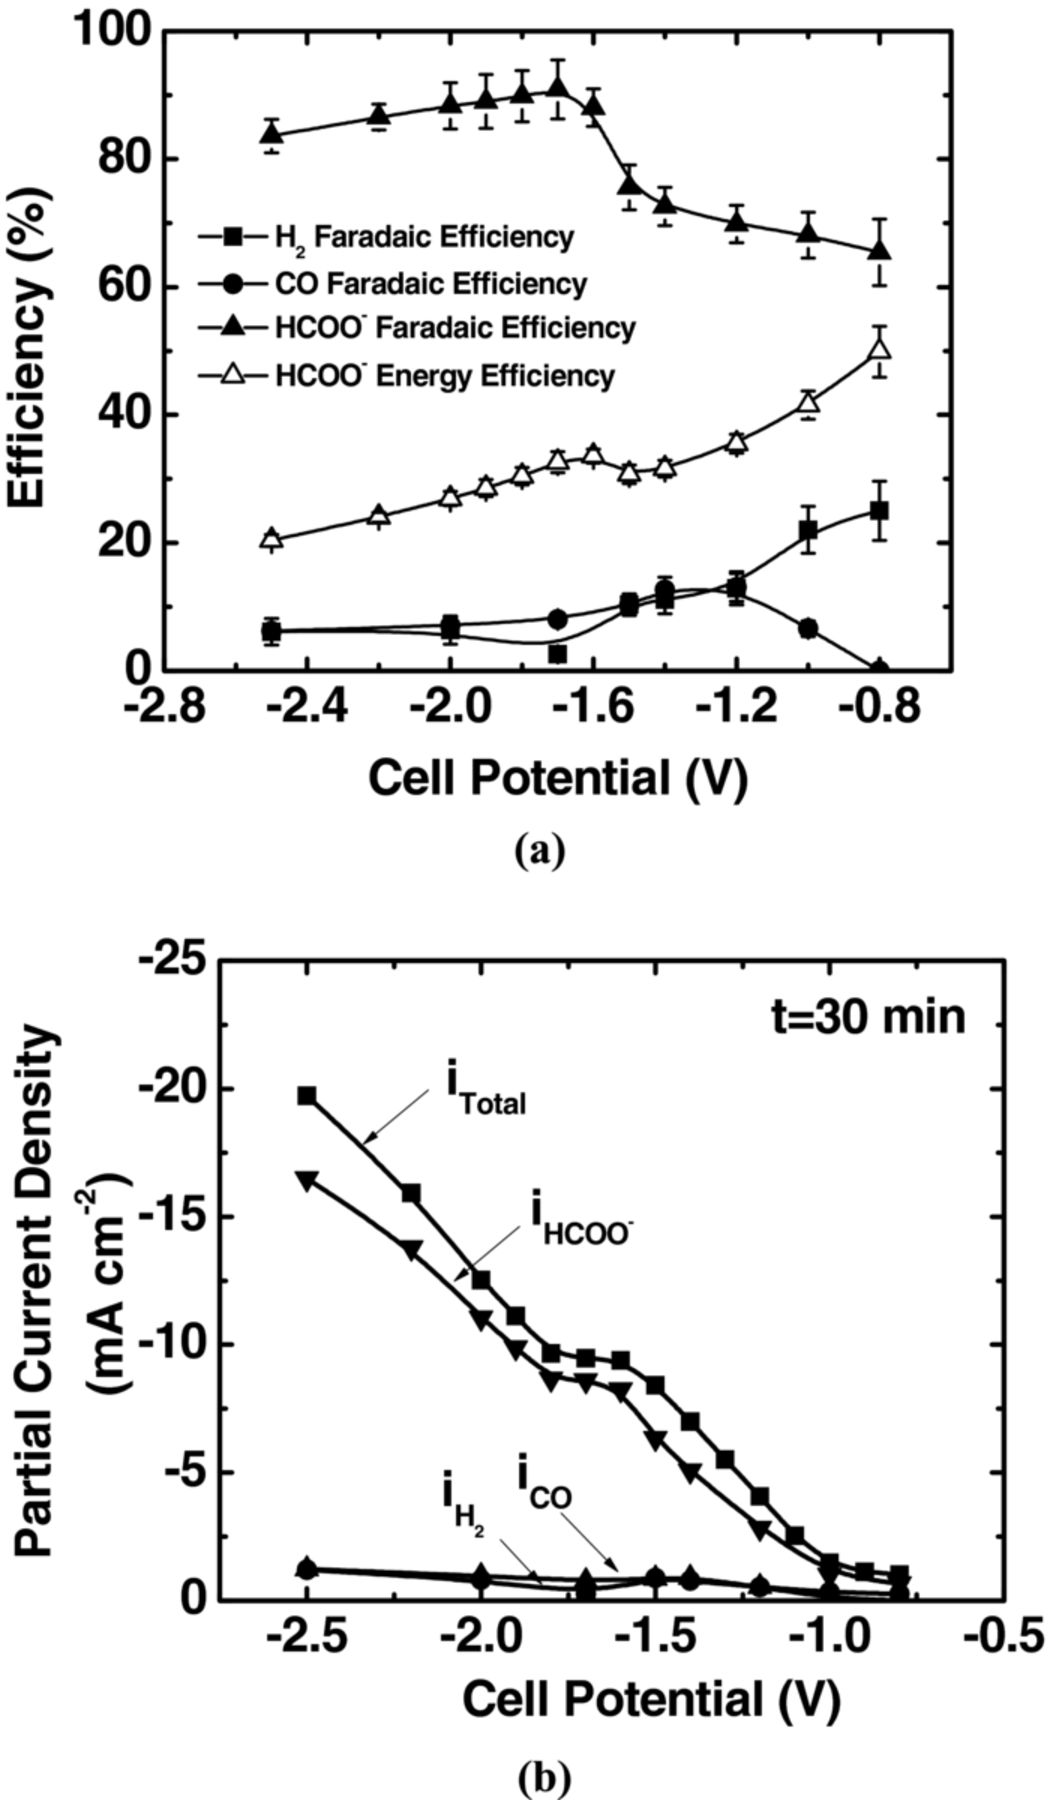
Figure 4. A detailed analysis of the products in a full electrochemical cell with a circulating aqueous-electrolyte buffer layer. (a) faradaic efficiencies toward the production of liquid-phase formate, gas product CO and by-product H2, and energy efficiency of formate, (b) total and partial current densities of products versus applied cell potential. The anode and cathode were supplied with H2 (150 mL min−1), and CO2 (45 mL min−1), respectively, at p° = 1.013 bar and T = 298.15 K. Electrolyte (0.1 M KHCO3) was circulated at 5 mL min−1.
The energy efficiency is a key factor in determining the economic feasibility of converting CO2 to fuels by utilizing electricity. The energy efficiency for formate was calculated using Eq. 5,18,24 as shown in Figure 4a
![Equation ([5])](https://content.cld.iop.org/journals/1945-7111/160/9/F953/revision1/jes_160_9_F953eqn5.jpg)
where the apparent standard cell potential, Est is −0.61 V, as predicted by Nernst equation. We observed a maximum energy efficiency of 50% for formate at −0.8 V with 0.1 M KHCO3 as the buffer layer. The energy efficiency toward formate formation decreased at higher cell potentials due to increasing ohmic loss in the membrane and buffer layer.
The plots shown in Figure 4b are partial current densities of formate, CO and H2 along with the total current density averaged over 30 min of electrolysis as a function of the cell potential. The total current density of the cell with a buffer layer was found to be much lower than that without a buffer layer due to the larger ASR (29.2 Ω cm2) with a buffer layer compared to about 0.8 Ω cm2 without a buffer layer. The large ASR with a buffer layer results from the electrolyte resistance of the aqueous buffer solution. The partial current density of formate was ∼−1 mA cm−2 at −0.8 V which increased at higher cell potentials and reached ∼−9.0 mA cm−2, corresponding to a production rate of 3.0 μmol min−1 cm−2 at −1.7 V. The production rate of formate, corresponding to its partial current density, is limited by two factors: sluggish kinetics of CO2 reduction and a high ohmic loss, which need to be improved in the future design of the cells and electrode materials.
Full cell with a buffer layer and water supplied to anode
Artificial photosynthesis in a photo-electrochemical cell involves the utilization of solar light for water oxidation at the anode side and CO2 reduction at the cathode side. In this work, we demonstrated the feasibility of simultaneous water oxidation and CO2 reduction in our cell with a 0.1 M KHCO3 buffer layer. Specifically, an aqueous 1 M KOH solution and CO2 were supplied to the anode and cathode, respectively, and the cell was operated in an electrolysis mode. Figures 5a and 5b depict the faradaic efficiency and partial current density as a function of cell potential. We observed the onset of formate production at −1.2 V with a faradaic efficiency of 70% and partial current density of ∼−1 mA cm−2. A cell potential higher than when the anode was fed with hydrogen gas was needed to overcome the anodic overpotential required for water oxidation. Nevertheless, with respect to the apparent standard cell potential of −1.02 V for simultaneous water oxidation (Eq. 2) and CO2 reduction (Eq. 3, E°* = −0.61 V vs. SHE for pH = 7), this overpotential of −0.18 V toward formate production was found to be nearly the same with H2 supplied to anode, as discussed previously. We observed the highest faradaic efficiency of 85% toward formate formation at −2.0 V. The measured partial current density and corresponding production rate for formate at this potential were −6 mA cm−2 and 2.0 μmol min−1 cm−2, respectively. The maximum energy efficiency ∼60% for formate production was obtained at −1.2 V as shown in Figure 5a. The faradaic efficiency toward H2 production reached a minimum of 8% at −2.2 V, at which the highest faradaic efficiency of 10% toward CO formation was observed.
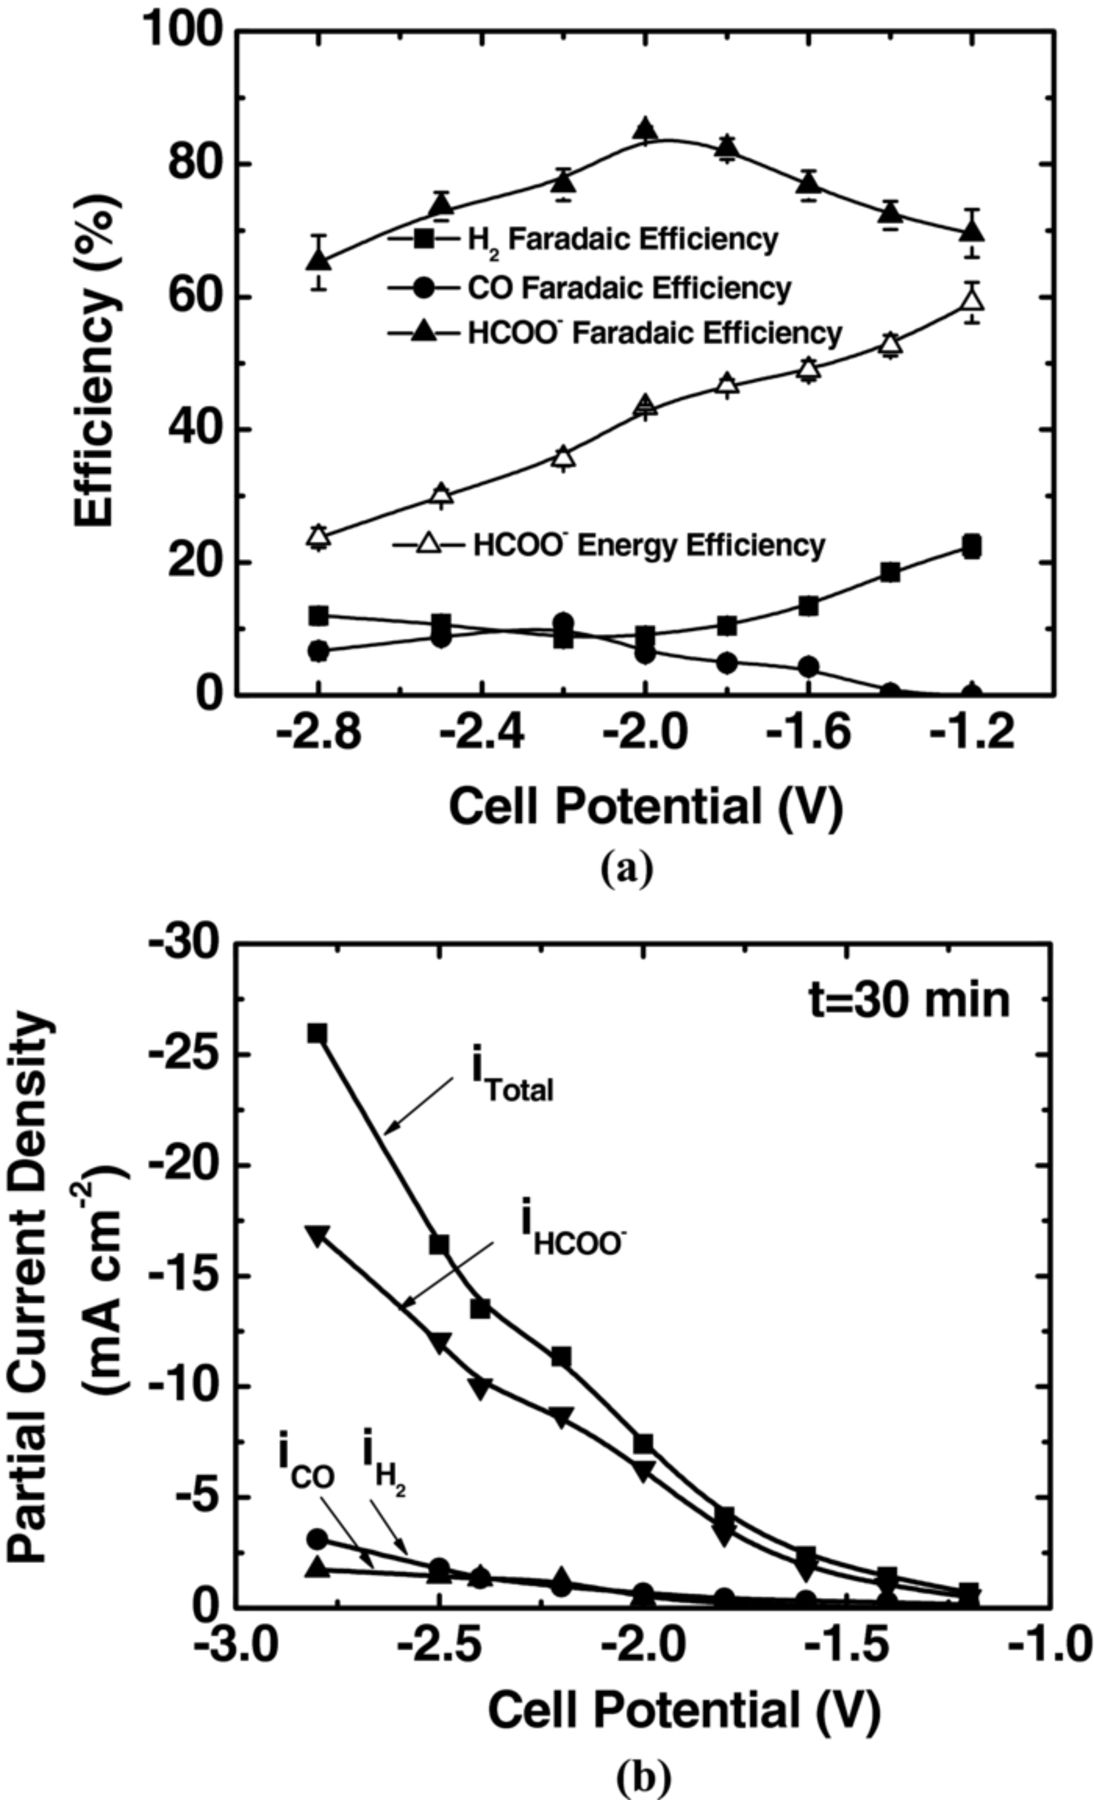
Figure 5. Simultaneous water oxidation and CO2 reduction in the full electrochemical cell with a circulating aqueous-electrolyte buffer layer. (a) faradaic efficiencies toward the production of formate, CO and H2, and energy efficiency of formate, (b) total and partial current densities of products as a function of applied cell potential. The anode and cathode were supplied with 1 M KOH (10 mL min−1) and CO2 (45 mL min−1) at p° = 1.013 bar and T = 298.15 K, respectively. Electrolyte (0.1 M KHCO3) was circulated at 5 mL min−1.
In order to obtain individual electrode polarization curves, the Ag/AgCl reference electrode was placed in the buffer layer. The individual electrode potential was further compensated by IR drop, as shown in Figure 6. The high overpotentials required for both oxygen evolution and CO2 reduction, suggests the choice of electrocatalysts holds the key to achieve higher efficiency and current density. We used IrO2 instead of Pt as catalyst at anode because of its higher activity toward oxygen evolution.28,29 Although the faradaic efficiency for formate only increased slightly from −1 to −3 V, the total current density was found to increase by about 50% (data not shown here). Further work needs to be done to optimize electrodes for both oxygen evolution and CO2 reduction, and consequently scale-up this approach to meet the requirements of commercial processes with a typical production rate on the order of 100 μmoles per minute per cm2.
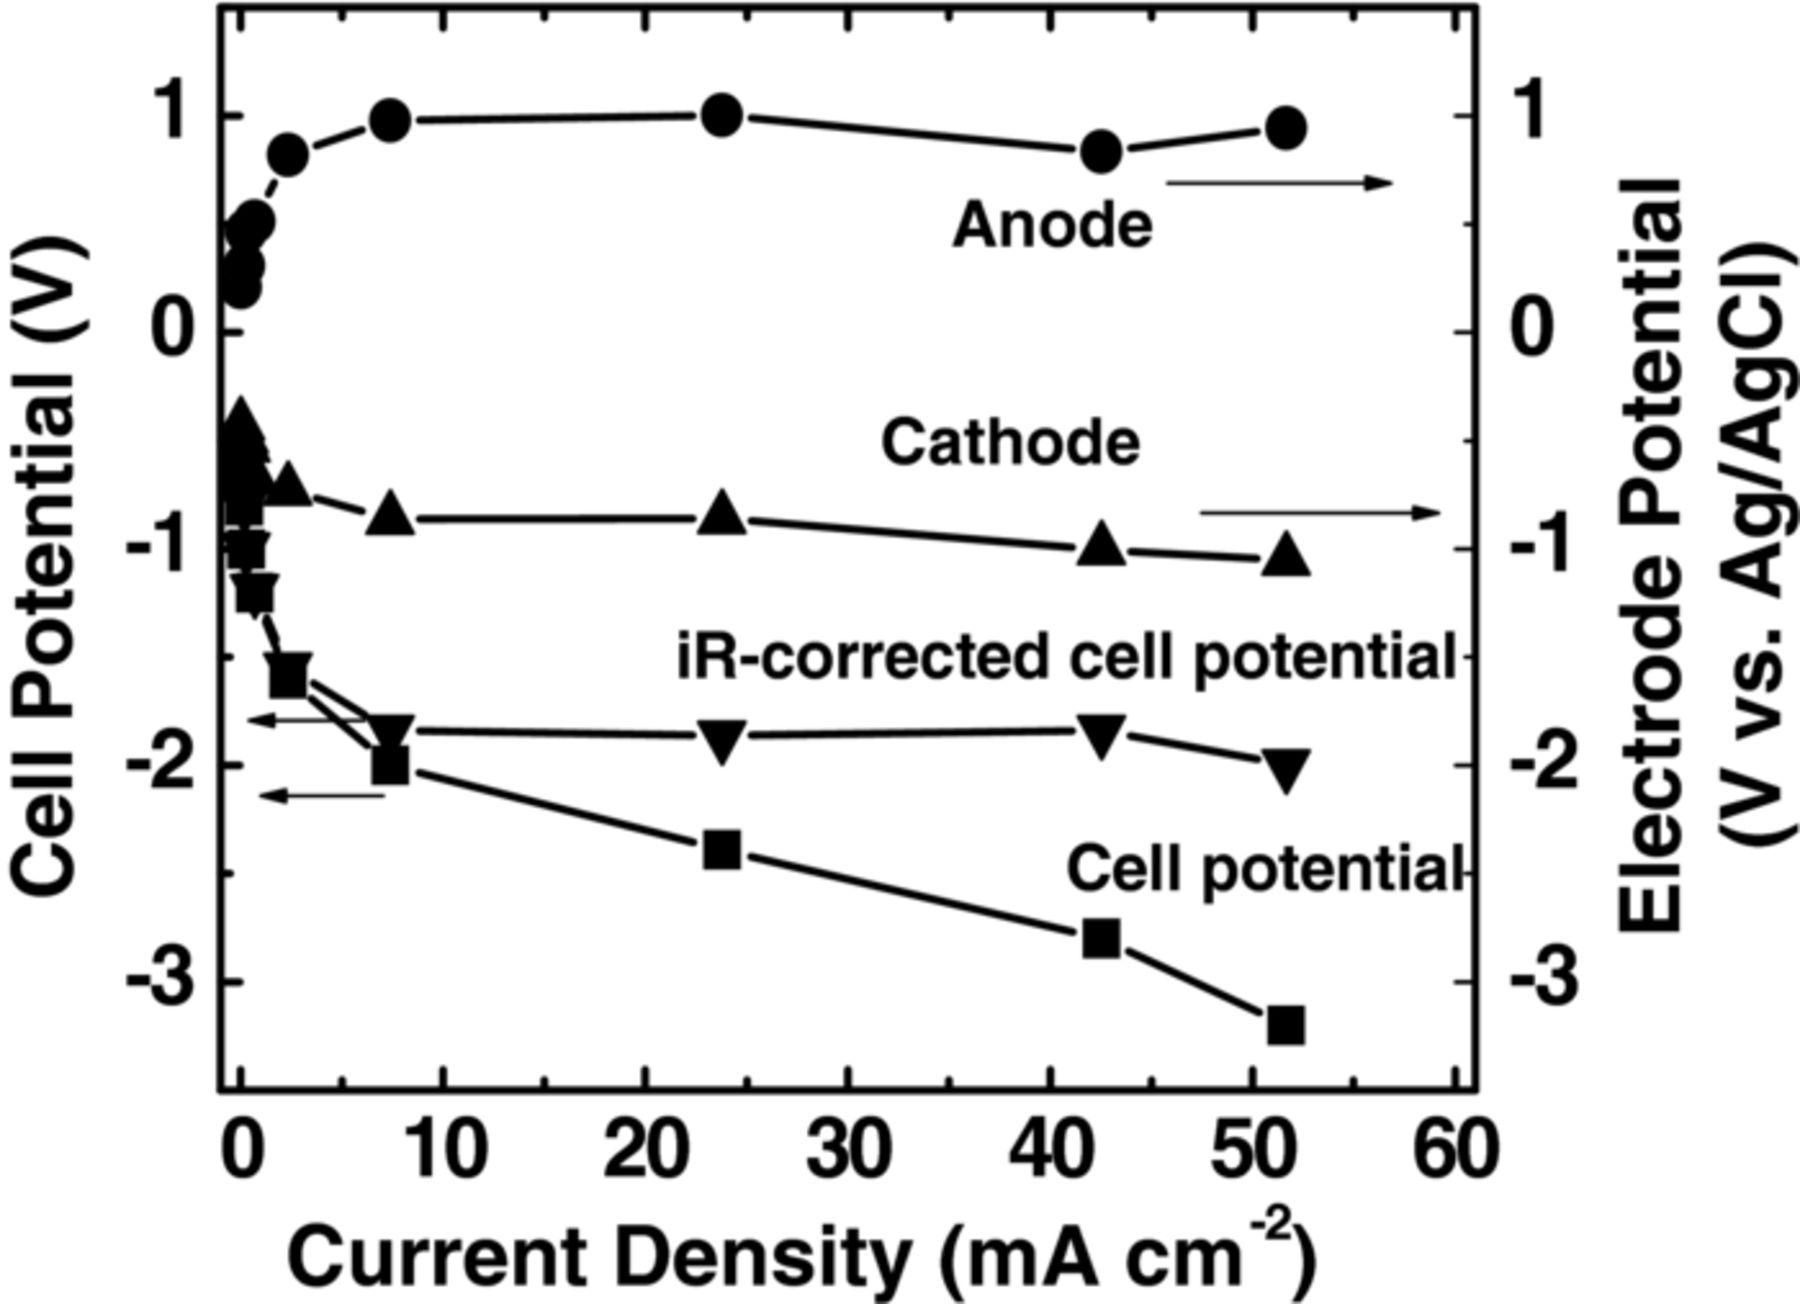
Figure 6. Individual anode and cathode potentials in the full electrochemical cell with a buffer layer of 0.1 M KHCO3 when 1 M KOH (10 mL min−1) was supplied to the anode and CO2 (45 mL min−1) to cathode at p° = 1.013 bar and T = 298.15 K.
Conclusions
A full electrochemical cell with a PEMFC structure modified to include a buffer layer of circulating aqueous electrolyte is designed and assembled for the conversion of CO2 to formate using a Sn GDE. In the presence of a buffer layer, the CO2 reduction reaction dominates over HER at the cathode, while HER prevails in the absence of the buffer layer. Using this cell with a buffer layer of 0.1 M KHCO3, at room temperature and ambient pressure, formate production is accomplished with high faradaic (∼90%) and energy efficiencies (∼60%). Moreover, the formate starts to form at the overpotential of ∼−0.2 V, irrespective of the fuel (H2 or 1.0 M KOH) supplied to anode with the corresponding partial current density of ∼−1 mA cm−2. The highest partial current density for formate observed is ∼−10 mA cm−2, which can be increased by reducing ohmic resistance of the buffer layer and optimizing microstructures of the GDEs. The maximum formate concentration is ∼100 μmol mL−1 at the end of 0.5 h electrolysis. This cell design employs current PEMFC configuration and thus can be easily scaled-up for the potential mass production of formate from CO2, if the partial current density of formate can be increased to ∼100 mA cm−2 at a moderate cell potential of −2.0 V.
Acknowledgments
Part of this work is supported by the Solid State and Materials Chemistry Program of the Division of Materials Research at the National Science Foundation. FGR is supported by the South Carolina Honors College Science Undergraduate Research Funding Program.