Abstract
The active particle morphology and microstructure affect the impedance behavior of intercalation electrodes due to the underlying charge transport, active material/electrolyte interfacial surface area, and solid-phase diffusion in lithium-ion batteries (LIB). In order to capture the impact of the electrode microstructural variability on the impedance response, an integrated electrochemical impedance predictive analysis is presented. In the analysis, stochastically reconstructed 3-D microstructures of representative LIB electrodes are considered with variations in the active material morphology and particle size distribution. With the properties evaluated from the virtual 3-D microstructures, the corresponding impedance response is predicted. The concept of electrochemical Sauter mean diameter (ESMD) has been introduced to investigate the effect of active particle morphology, such as particle agglomeration. This integrated analysis is envisioned to offer a virtual impedance response probing framework to elucidate the influence of electrode microstructural variability and underlying electrochemical and transport interactions.
Export citation and abstract BibTeX RIS

This is an open access article distributed under the terms of the Creative Commons Attribution Non-Commercial No Derivatives 4.0 License (CC BY-NC-ND, http://creativecommons.org/licenses/by-nc-nd/4.0/), which permits non-commercial reuse, distribution, and reproduction in any medium, provided the original work is not changed in any way and is properly cited. For permission for commercial reuse, please email: oa@electrochem.org.
Lithium-ion batteries (LIBs), due to their favorable energy density and power capability, are considered as the candidate of choice for vehicle electrification.1–4 To further improve the cell performance, different efforts have been undertaken to study the microstructural characteristics, including electrode thickness,5 porosity,6 particle size,7 conductive additives8 and composition.9 Particularly, the influence of electrode microstructure on charge (i.e. electron and ion) transport, and solid-phase diffusion is critical, which ultimately affects the cell performance.
One of the powerful methods for analyzing the electrochemical and transport behavior in porous electrodes is the electrochemical impedance spectroscopy (EIS), which measures the response of a small perturbation of potential or current.10–17 By investigating the impedance response, the charge transport resistance, including electron transport in the solid phase, ionic transport in the electrolyte, solid-state diffusion in the active material, and the intercalation process, can be quantified.14,18–26 Meyers et al. proposed a mathematical model to capture the impedance behavior of a spherical active particle dependent on the physical properties related to the faradaic and non-faradaic impedance.14 The model also included the effect of particle size distribution on the impedance response.
The impedance response of intercalation electrodes, which is sensitive to the interfacial processes, the surface morphology, and the charge transport, has been described mathematically by the fundamental physical approach for various electrochemical systems.14,27–39 The effect of various properties, such as electrical and ionic conductivity, and layer thickness, have been investigated by Levi and Aurbach.28 Besides the electrode properties (e.g. electrical conductivity, ionic conductivity, and layer thickness), the electrode microstructure, e.g. the active particle morphology (i.e. particle size and shape), has been shown to exhibit profound influence on the solid-phase diffusion resistance.27,28,30,40 In this regard, Lai et al. and Song et al. have studied the effect of morphology of active materials on impedance response by using the characteristic diffusion length of spherical, cylindrical, and platelet active particles.30,41,42 In the impedance response, the morphology of the active material primarily affects the solid-phase diffusion resistance. The solid-phase diffusion resistance of an electrode which includes small active materials shows a transition from the Warburg behavior to capacitance behavior due to short diffusion lengths in the active material.43–45
To the best of the authors' knowledge, the current LIB impedance analysis lacks a rigorous description of the electrode microstructural effect on the impedance response. Electrode microstructures with varying active material morphology and composition result in the variation of active material/electrolyte interfacial area, electrical conductivity, and ionic conductivity,6 and hence affect the corresponding impedance response. Furthermore, in the current impedance models, the morphological influence on the impedance response is difficult to delineate especially for active materials with complicated morphology, such as agglomerated particles.
To improve the understanding of electrode impedance behavior, an integrated computational modeling strategy has been proposed in this work. In this impedance model, three dimensional (3-D) virtual porous microstructures representative of intercalation electrodes are constructed with varying active particle morphology, size distribution, and electrode composition including active material, binder, and conductive additives. The effective electrochemical and transport properties, namely ionic/electronic conductivity, solid-phase diffusive behavior and electrochemical area are evaluated from the reconstructed electrode microstructures. The effect of electrode microstructural variability on the impedance response is investigated which relies on the effective electrochemical and transport properties. Furthermore, in order to study the impedance response of complicated active particle morphology, the concept of electrochemical Sauter mean diameter (ESMD) has been introduced. In this study, ESMD method has been shown to successfully reproduce the impedance response of electrodes with disparate active particle morphology, spherical, cylindrical and platelet shapes as well as particle agglomerates.
Method
In this study, 3-D virtual porous microstructures, which include active material and binder, was constructed to evaluate the effective electrochemical properties. From the evaluated electrochemical properties, the impedance response, which included the effects of microstructure, can be predicted.
Mathematical model for the impedance response of the porous electrode
The starting point for the theoretical description of the impedance response in porous electrode microstructures is a review of the mathematical model of an active particle that has typically been used in analyzing the electrochemical impedance of porous electrodes for the past several decades.14,27,29 In this study, the evaluation of impedance response is based on the work of Meyers et al.14 The analytical solution of impedance for porous electrode is briefly presented in the following section.
Since the impedance response of a single active particle is affected by the sum of partial current densities, which is equivalent to the total outward current density and potential drop at each position, it is necessary to define these partial current densities. The total current density of an active particle at interfacial is determined as
![Equation ([1])](https://content.cld.iop.org/journals/1945-7111/162/7/A1202/revision1/jes_162_7_A1202eqn1.jpg)
where iinf is interfacial current density, idbl is the double layer current density (non-faradaic current density), and ifar is the faradaic current density. The current density at the interface can be explained as the sum of non-faradaic and faradaic current densities at the interface. Figure 1a shows the schematic diagram of intercalation particle with different morphology. The schematic diagram plots the detailed picture of the particle-solution interface and the presence of a double layer. Non-faradaic current, or double layer current, does not affect any chemical reactions but involves the accumulation of charges in the double layer of a single active material particle. Due to the capacitive characteristic of the double layer, the corresponding charge transfer can be expressed as
![Equation ([2])](https://content.cld.iop.org/journals/1945-7111/162/7/A1202/revision1/jes_162_7_A1202eqn2.jpg)
where ϕ1 and ϕ2 are the potentials at the interfaces and Cdbl is the capacitance of the double layer as shown in Figure 1b. The impedance for a non-faradaic current (i.e. the ratio of the potential across the interface to non-faradaic current density in the frequency domain) is defined as
![Equation ([3])](https://content.cld.iop.org/journals/1945-7111/162/7/A1202/revision1/jes_162_7_A1202eqn3.jpg)
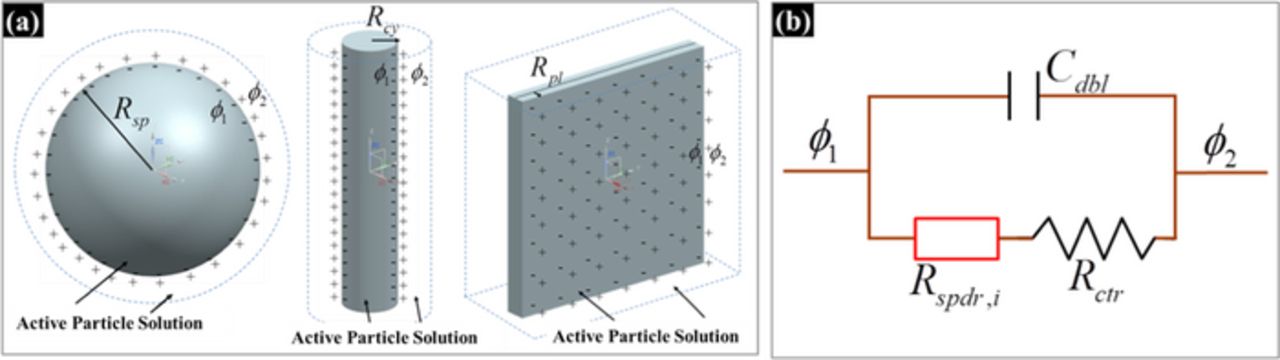
Figure 1. The schematic diagram of the active particles - interfacial impedance with solid-phase diffusion but no insulating film for a single particle; (a) Various morphologies of single active particles, (b) equivalent circuit design.
Electrochemical reactions occurring at the active particle surface give rise to a faradaic current density. The correlation between faradaic current density and potential drop across the interface can be determined by Butler-Volmer equation as
![Equation ([4])](https://content.cld.iop.org/journals/1945-7111/162/7/A1202/revision1/jes_162_7_A1202eqn4.jpg)
where αa + αc = 1, αa is the transfer coefficient of the anodic current, αc is the transfer coefficient of the cathodic current, i0 is the exchange current density, and U is the open circuit potential of the charge transfer reactions. In order to calculate the faradaic impedance response of a single active particle, the linearized current density equation expressed as a function of the potential and the surface concentrations is needed. The linearized Butler-Volmer equation in the frequency domain is defined as14
![Equation ([5])](https://content.cld.iop.org/journals/1945-7111/162/7/A1202/revision1/jes_162_7_A1202eqn5.jpg)
where ci is the concentration of intercalation ions in a single particle, i indicates particle geometries such as sp(sphere), cy(cylinder) and pl(platelet), and  is the surface concentration of a single active particle. To describe the faradaic impedance, we need to focus on the surface concentration of an active material particle.
The mass balance of lithium in a single active particle of active material is governed by ionic diffusion, which can be described by Fick's second law in various coordinate systems. The diffusion equation in the time domain is defined as
![Equation ([6])](https://content.cld.iop.org/journals/1945-7111/162/7/A1202/revision1/jes_162_7_A1202eqn6.jpg)
where r is the distance from the symmetric center of the spherical, cylindrical, and platelet active material particles, t is the time variable, and Da is the diffusion coefficient of the active material. The diffusion equations with various morphologies in the frequency domain can be expressed as
![Equation ([7])](https://content.cld.iop.org/journals/1945-7111/162/7/A1202/revision1/jes_162_7_A1202eqn7.jpg)
The symmetry at the center of an active particle and Faraday's law at the interface are used as boundary conditions, where
![Equation ([8])](https://content.cld.iop.org/journals/1945-7111/162/7/A1202/revision1/jes_162_7_A1202eqn8.jpg)
The analytical solutions of these differential equations with the boundary conditions are given in Eq. 9.
![Equation ([9])](https://content.cld.iop.org/journals/1945-7111/162/7/A1202/revision1/jes_162_7_A1202eqn9.jpg)
Thus, the transfer functions between the surface concentration of an intercalation particle and the faradaic current density can be specified as
![Equation ([10])](https://content.cld.iop.org/journals/1945-7111/162/7/A1202/revision1/jes_162_7_A1202eqn10.jpg)
where Zsp, Zcy, and Zpl indicate the local bounded diffusion impedance of a spherical, cylindrical, and platelet single particle, respectively. The impedance for a faradaic reaction can be expressed by inserting the local bounded diffusion impedance (Eq. 10) into the linearization of the Butler-Volmer equation (Eq. 5).
![Equation ([11])](https://content.cld.iop.org/journals/1945-7111/162/7/A1202/revision1/jes_162_7_A1202eqn11.jpg)
![Equation ([12])](https://content.cld.iop.org/journals/1945-7111/162/7/A1202/revision1/jes_162_7_A1202eqn12.jpg)
![Equation ([13])](https://content.cld.iop.org/journals/1945-7111/162/7/A1202/revision1/jes_162_7_A1202eqn13.jpg)
The faradaic impedance from Eq. 11–13 is composed from two impedance components. The first term manifests the charge transfer impedance which is a non-ohmic resistance related to the kinetics of the charge transfer reaction, and the second reveals the diffusion impedance, which defined by the partial derivative of the open circuit potential with respect to concentration, diffusion coefficient, diffusion length, and diffusion impedance.
In this research, since we assumed that there is no solid-electrolyte interphase formed on an active particle, the impedance response is only affected by the double layer and faradaic current. From Figure 1 with faradaic and non-faradaic impedances, the total impedance of active particle can be expressed as
![Equation ([14])](https://content.cld.iop.org/journals/1945-7111/162/7/A1202/revision1/jes_162_7_A1202eqn14.jpg)
Figure 2 represents the porous electrode of the microstructure consisting of active particles. As the current passes through the interface of the active particle, it can proceed from the solution phase material to the solid phase material as it moves through the porous microstructure in both the solution phase and the solid phase. A balance equation on the fraction of total current flowing in solution can be written as
![Equation ([15])](https://content.cld.iop.org/journals/1945-7111/162/7/A1202/revision1/jes_162_7_A1202eqn15.jpg)
where Ai(ri) is the effective surface area at a specific rj. The total interfacial admittance per unit volume of electrode with various morphological active particles can be defined as
![Equation ([16])](https://content.cld.iop.org/journals/1945-7111/162/7/A1202/revision1/jes_162_7_A1202eqn16.jpg)
where Ai(ri) is the effective surface area at a specific rj, Ntotal is the number of total active particles per unit electrode volume, and Pi(ri) is the probability density function with the distance ri from the symmetric center of the active particles. Meyers et al.14 showed that the entire impedance of the porous electrode microstructure can be described as
![Equation ([17])](https://content.cld.iop.org/journals/1945-7111/162/7/A1202/revision1/jes_162_7_A1202eqn17.jpg)
![Equation ([18])](https://content.cld.iop.org/journals/1945-7111/162/7/A1202/revision1/jes_162_7_A1202eqn18.jpg)
where σ is solid-phase electrical conductivity, and κ is the effective conductivity of electrolyte. The electrical conductivity of solid phase comes from the electrical conductivity evaluation of the stochastically generated microstructure, which is composed of the active material, the additive, and the binder. This incorporates the impact of solid-phase and electrolyte electrical resistances on impedance distribution of 3-D electrode microstructures.
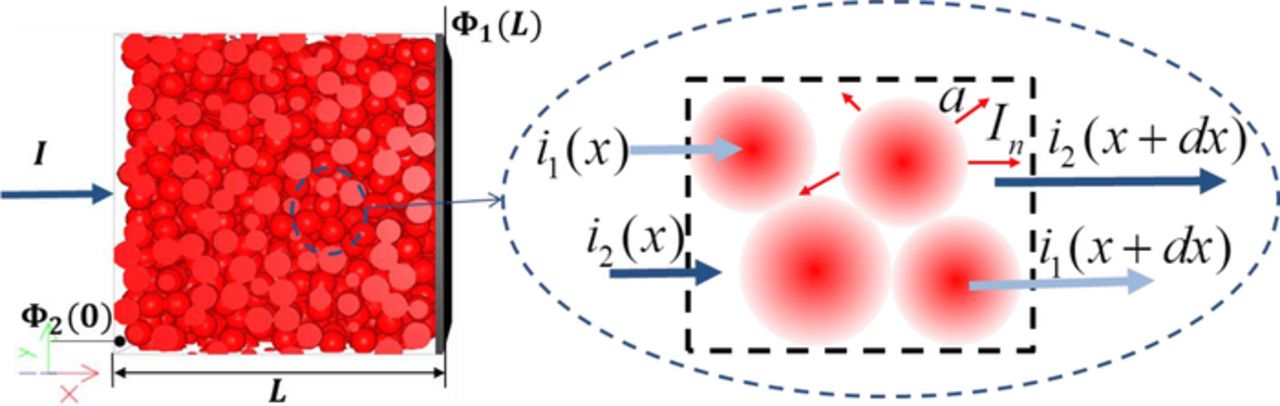
Figure 2. The balance diagram on the fraction of total current flowing.
Particle size distribution and electrochemical sauter mean diameter
The electrochemical impedance behavior of a porous electrode microstructure can be determined by integrating the impedance of active particles according to the particle-size distribution function. Before considering the active particle size distribution, we need to know the morphology of the active particles. The active particles in the actual micro-electrode have various morphologies such as spherical, cylindrical, and platelet. From Eq. 10, we know that the morphology of the active particle affects the response of the diffusion impedance of active particles. Beside the morphology of active particles, the morphology variation of active particles due to the agglomeration also been considered in this study. Due the anisotropic of agglomerated particles, the diffusion of lithium ion and impedance response is hard to evaluate. Therefore, an equivalent characteristic description of an agglomerate active particle is needed for solving the impedance response in the analytical approach. The concept of the Sauter mean diameter or surface mean diameter is been used in this study. The Sauter mean diameter has been widely used in the field where the effective surface area is of most interest, such as in reaction and absorption research.46 Figure 3a shows the relationship between an agglomerate particle and an electrochemical Sauter mean particle. Electrochemical Sauter mean diameter (ESMD) is the diameter of a sphere that has the same ratio of volume to active surface area and can characterize the particles with different shapes, which is given by:
![Equation ([19])](https://content.cld.iop.org/journals/1945-7111/162/7/A1202/revision1/jes_162_7_A1202eqn19.jpg)
where dsmd is the ESMD, VP is the volume of the particle of interest, and AP is the effective surface area of the designated particle of interest. The concept of ESMD also can be used to simplify the particle morphology. For example, the ESMDs of a cylindrical particle and a platelet particle are considered in Figure 3b in order to treat cylindrical and platelet particles as a sphere particle in the future impedance simulation. When α, β, and γ are much greater than one, the effective surface areas of a spherical active particle, a cylindrical active particle, and a platelet active particle can be defined as πd2sp, πlcy · γlcy, and 2 · (αlpl · βlpl), respectively, where α and β are the aspect ratios of the side lengths of the platelets, and γ is the aspect ratio of the height of the cylinders. The ESMDs of the cylinder and platelet are expressed as
![Equation ([20])](https://content.cld.iop.org/journals/1945-7111/162/7/A1202/revision1/jes_162_7_A1202eqn20.jpg)
![Equation ([21])](https://content.cld.iop.org/journals/1945-7111/162/7/A1202/revision1/jes_162_7_A1202eqn21.jpg)
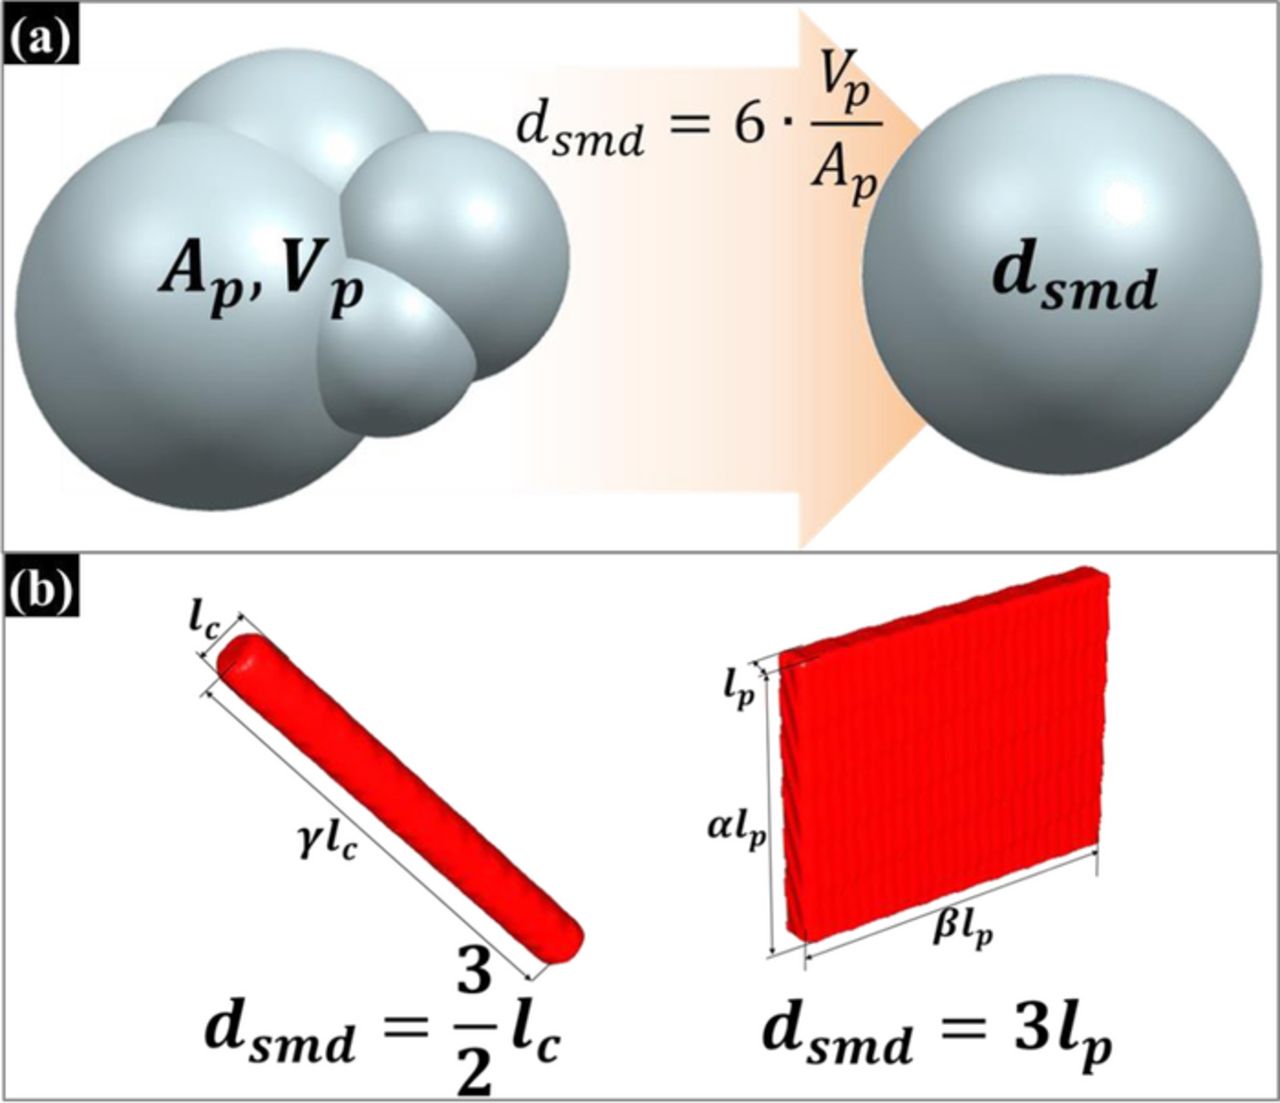
Figure 3. The diameter design of a sphere that has the same ratio of particle volume to effective surface area as a particle of interest; (a) The relation between an amorphous particle and a Sauter mean particle. Ap and Vp are the effective surface area and the particle volume, respectively. (b) The Sauter mean diameters of a cylindrical particle and a planar particle. α, β, and γ are aspect constants.
Based on the ESMD, the Gaussian distribution in the logarithm of the particles is employed in order to define the distribution of particles with various morphologies, which is given by
![Equation ([22])](https://content.cld.iop.org/journals/1945-7111/162/7/A1202/revision1/jes_162_7_A1202eqn22.jpg)
where Ni(ri) is the number of active material particles per unit electrode volume, ri is the particle radius from the symmetric center of the active particles, and rsmd, i is the electrochemical Sauter mean radius. Ψ is a parameter which determines the sharpness of the distribution. asmd and ɛamd are the specific surface area (m−1) and porosity of the microstructure with ESMD particles respectively.NRi is the ratio of the volume of the original active particle to the electrochemical Sauter mean particle. For example, NRsp is 1, and NRcy at 1:8 aspect ratio is around 3.56, and NRpl at 1:8:8 aspect ratio is approximately 4.53.
Stochastic microstructure generation and effective conductivity estimation
The 3-D porous microstructure can be generated by using the technique of digitally stochastic models.47 This randomly structured micro-model is based on specified statistical information such as particle size distribution and porosity.47 These design parameters of the model from the statistical information determine the characteristics of the microstructure including effective electrical conductivity. The stochastic modeling technique is based on the idea that a representative 3-D structure can be designed by the intrinsic arbitrary phase function. The generated models, which are due to the randomness of the real structures, are not exactly the same geometric structure but are fitted by choosing parameters so that the characteristic properties of the material are realistically represented.48 Stochastic modeling allows for a random distribution of objects within the generated structures and includes the macroscopic homogeneity present in the actual structures.49 The details of the composition of the simulated electrode microstructures used in this study is provided in Table I, which includes the specific surface area, volume fraction of active material, volume fraction of electrolyte, and the mean particle radius.
Table I. Composition of the simulated electrode microstructures.
| Microstructure | Specific Surface area (m−1) | ɛAM (%) | ɛElectrolyte (%) | Rmean (μm) |
|---|---|---|---|---|
| Figure 7i-7vi | 2343 | 50 | 35 | 5 |
| Figure 8i | 2940 | 40 | 35 | 3 |
| Figure 8ii | 3125 | 40 | 35 | 3 |
| Figure 8iii | 2155 | 40 | 35 | 3 |
| Figure 8iv | 1504 | 40 | 35 | 3 |
| Figure 9i | 1500 | 35 | 35 | 6.5 |
| Figure 9ii | 1500 | 35 | 35 | 4 |
| Figure 9iii | 1500 | 35 | 35 | 2 |
| Figure 12i | 8010 | 35 | 35 | 1.05 |
| Figure 12ii | 5332 | 35 | 35 | 1.05 |
| Figure 12iii | 2708 | 35 | 35 | 1.05 |
Effective electrical conductivity
The electrode reconstruction process is illustrated in Figure 4. The reconstructed microstructures include active material, additive/binder composite, and electrolyte. The properties of electrode materials is as shown in Table II. Spherical, cylindrical, and platelet active particles are studied in this paper. LiNi0.8Co0.15Al0.05O2 were considered to create the active particles. In order to generate active particles with various morphologies, the logarithm Gaussian distribution of the particle is employed for particle size distribution with various morphologies.
Table II. Material electrical properties for 3-D electrode microstructure.
| Materials | Electrical Conductivity(S/m) |
|---|---|
| LiNi0.8Co0.15Al0.05O2 | 0.04 |
| Conductive Additive | 16700 |
| Binder | 1.0E-13 |
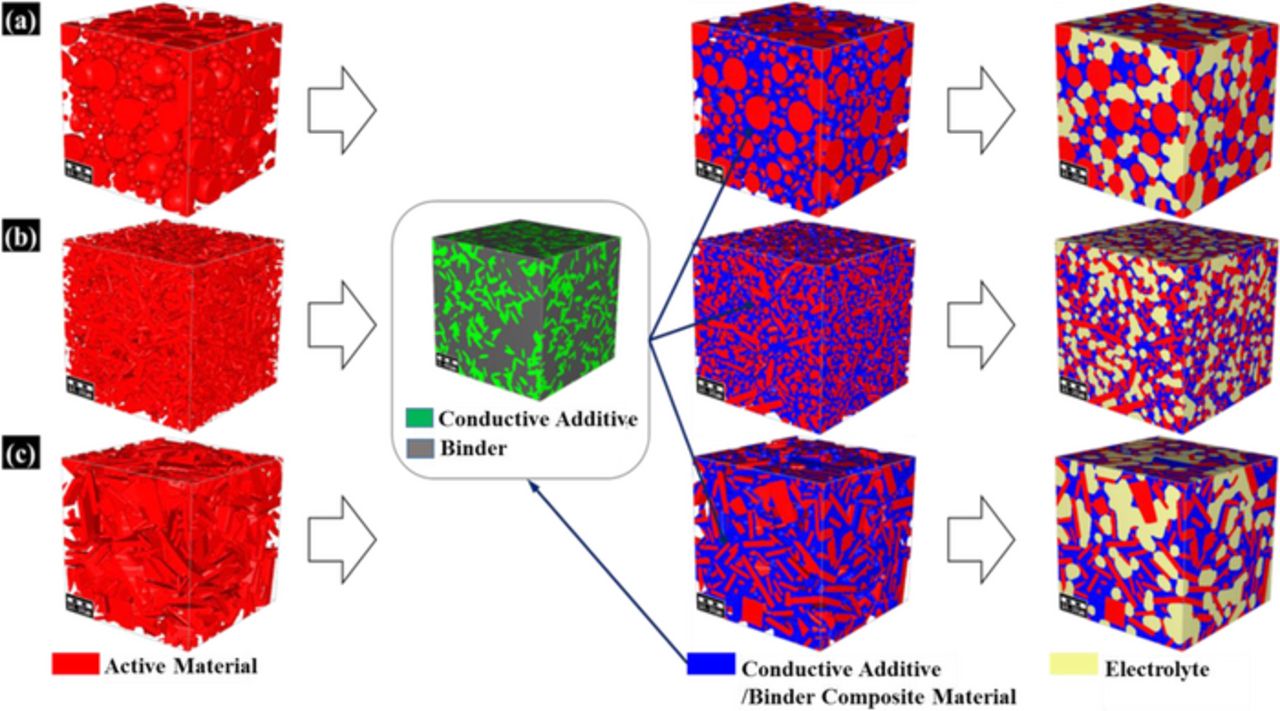
Figure 4. Construction process for full 3-D microstructure electrode model with (a) Spherical active particles (b) Cylindrical active particles (c) Planar active particles.
During the reconstruction process, the active material was first inserted randomly in the simulation domain according to the particle-size distribution described in Eq. 22. The particles were not allowed to overlap, which implies that the particles are perfectly spherical in shape and there are no agglomerated particles. The conductive additive/binder composite material is inserted into the void spaces where two or more particles were close together.50 Figure 5 illustrates the electrical conductivity of conductive additive/binder composite materials. Our simulation result shows good agreement with the experimental data from Liu et al.,9 where the electrical conductivity of the electrode is presented as a function of the conductive additive/binder ratio. According to their work, the conductive additive/binder ratio affects the effective electrochemical area between the active material and conductive additive, and there exits an optimized ratio. The voxel size for the microstructure shown in Figure 5 is 4 nm. The remaining void space is filled with electrolyte. The representative volume for computational domain was considered as 50 μm × 50 μm × 50 μm, with a voxel size of 0.25 μm. The electrode microstructures were generated using voxel-based modeling. The three dimensional stationary conduction equation is solved for determining the effective conductivity of multi-component porous electrode. This generic expression for the stationary conduction equation can be defined as
![Equation ([23])](https://content.cld.iop.org/journals/1945-7111/162/7/A1202/revision1/jes_162_7_A1202eqn23.jpg)
where ΦD is the domain under consideration,  is a source term, Vis a potential, and σL is a local electrical conductivity. In this study,
  is considered for evaluating the effective conductivity. The equation is solved using a combination of fast Fourier transform (FFT) and BiConjugate Gradient Stabilized (BiCGStab) methods, and is carried out in GeoDict, which was used to generate the 3-D microstructure and evaluate the electrical effective conductivities.51,52
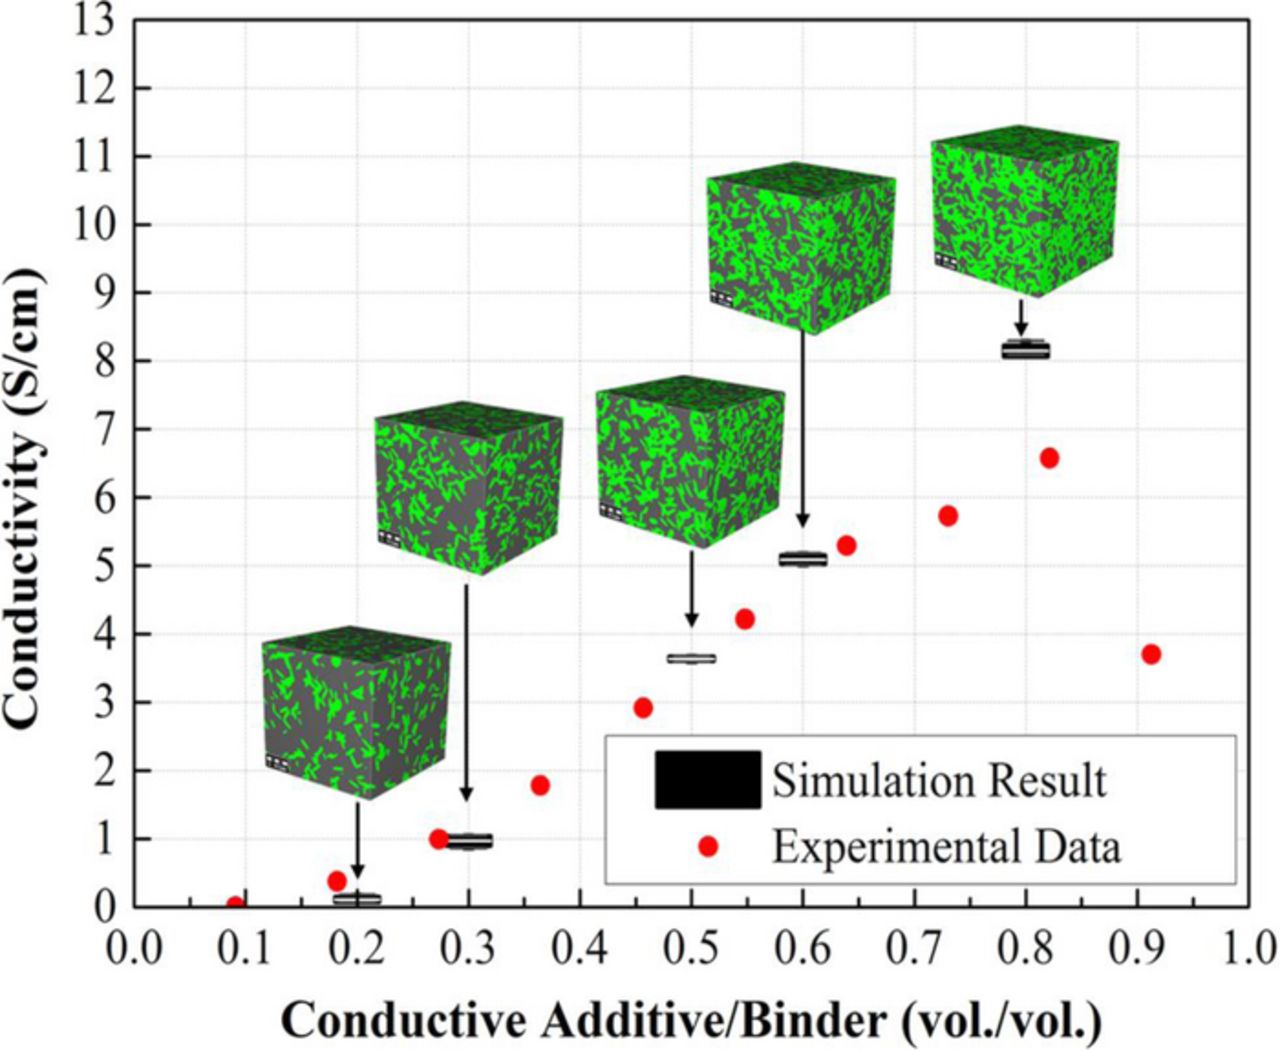
Figure 5. The electrical conductivity of conductive additive/binder composite materials as a function of the volume ratio of conductive additive to binder.9
The coefficient of variation (CV) can be estimated of the deviation of an effective electrical conductivity on an entire electrode system with heterogeneous particles. CV can be defined as the following
![Equation ([24])](https://content.cld.iop.org/journals/1945-7111/162/7/A1202/revision1/jes_162_7_A1202eqn24.jpg)
where μCV is the arithmetic mean of effective conductivity and σCV is the standard deviation of effective conductivity of microstructure. A CV below 0.5 expresses homogeneity, and a value greater than 1 expresses extremely heterogeneity.49 To evaluate that deviation of random structure generation does not have a large influence on the generated microstructures, the CV was calculated with 5 samples for each of the evaluated microstructures. As shown in Figure 6, the CV remained under 0.5 for each electrode that was evaluated.
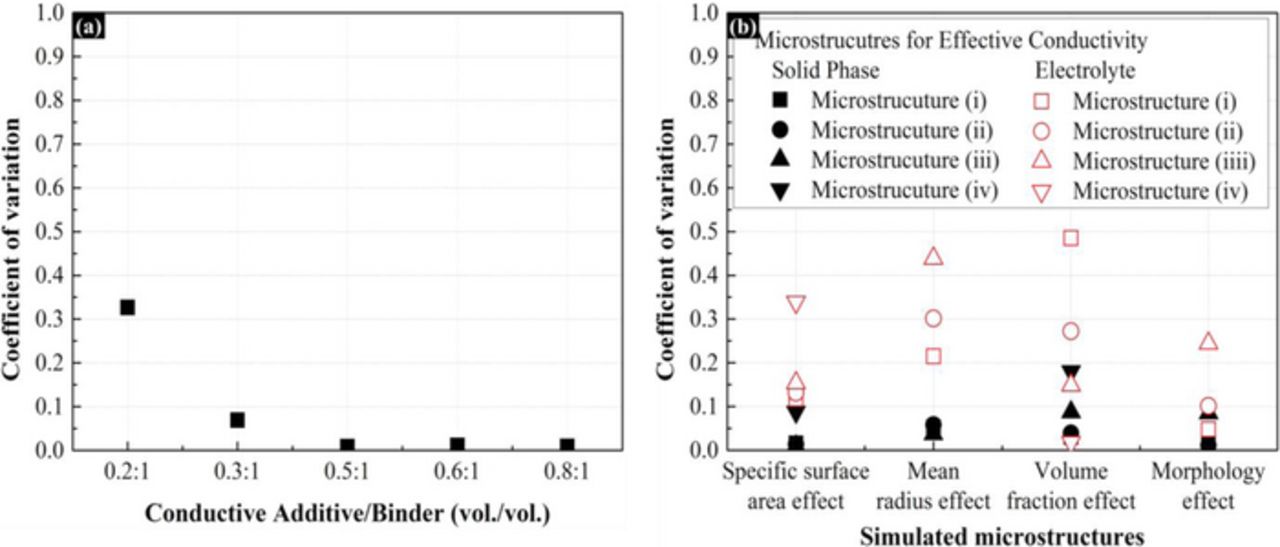
Figure 6. The coefficient of variation of evaluated electrode microstructures in order to evaluate the deviation of random structure generation. (a) Microstructures for conductive additive/binder composite materials. (b) The properties of simulated microstructures for electrochemical impedance response.
Results and Discussion
Influence of porous electrode microstructures on the impedance response
Influence of electrochemical properties
The influence of electrode microstructure on the impedance response is illustrated in Figure 7. Since the electrical and ionic conductivity varied with the microstructure, and hence influence the impedance response. Electrode parameters for use in porous electrode simulation are shown in Table III. The particle-size distribution of active material is as shown in in Figure 7a, which with 5 μm mean particle radius. Figure 7b shows the microstructures with different binder/additive composites and ionic conductivity of electrolyte. The microstructures (i) - (iii) were used to study the effect of the electrical conductivity of different binder/additive composite. The electrical conductivity varies with the composition ratio between carbon additives and binder.9 The microstructures (iv) - (vi) were used to study the effect of the ionic conductivity of electrolyte. The ionic conductivity of electrolyte was directly assigned in the simulation. The effect of electrochemical properties on impedance response is as shown in Figure 7c–7d. For microstructures (i) - (iii), since the ratio between binder and additive in the composite changes the electrical conductivity, the impedance varied in the high frequency region. From the result, the electrical conductivity has negligible effect on the impedance until the electrical conductivity smaller than 1×10⁻³ S/cm. When the electrical conductivity is low, the impedance shift to the right along the real axis due to the increase of ohmic resistance in the electrode. The impedance response of microstructures (iii) - (vi) in Figure 7d shows additional length before starting to have capacitor characteristic.53 For microstructures (iv) - (vi), which have different ionic conductivity in the electrolyte, we can observe from the impedance response that the charge transfer resistance (i.e. the radius of semi-circle) increases with the decrease of ionic conductivity. The semi-circle represents the cumulative effect of the resistance to charge transport. One should note that the effect of electrical resistance has less influence to the charge transfer resistance as compared to the effect of ionic resistance.
Table III. Physical properties for use in the porous electrode simulation.
| Property | Value |
|---|---|
| i0 | 0.69×10⁻³ A/cm2 |
| T | 353.15 K |
| αa + αc | 1 |

| 20.27 V cm3/mol |
| Cdbl | 1×10⁻⁵ F/cm2 |
| Da | 1.0×10⁻⁹ cm2/s |
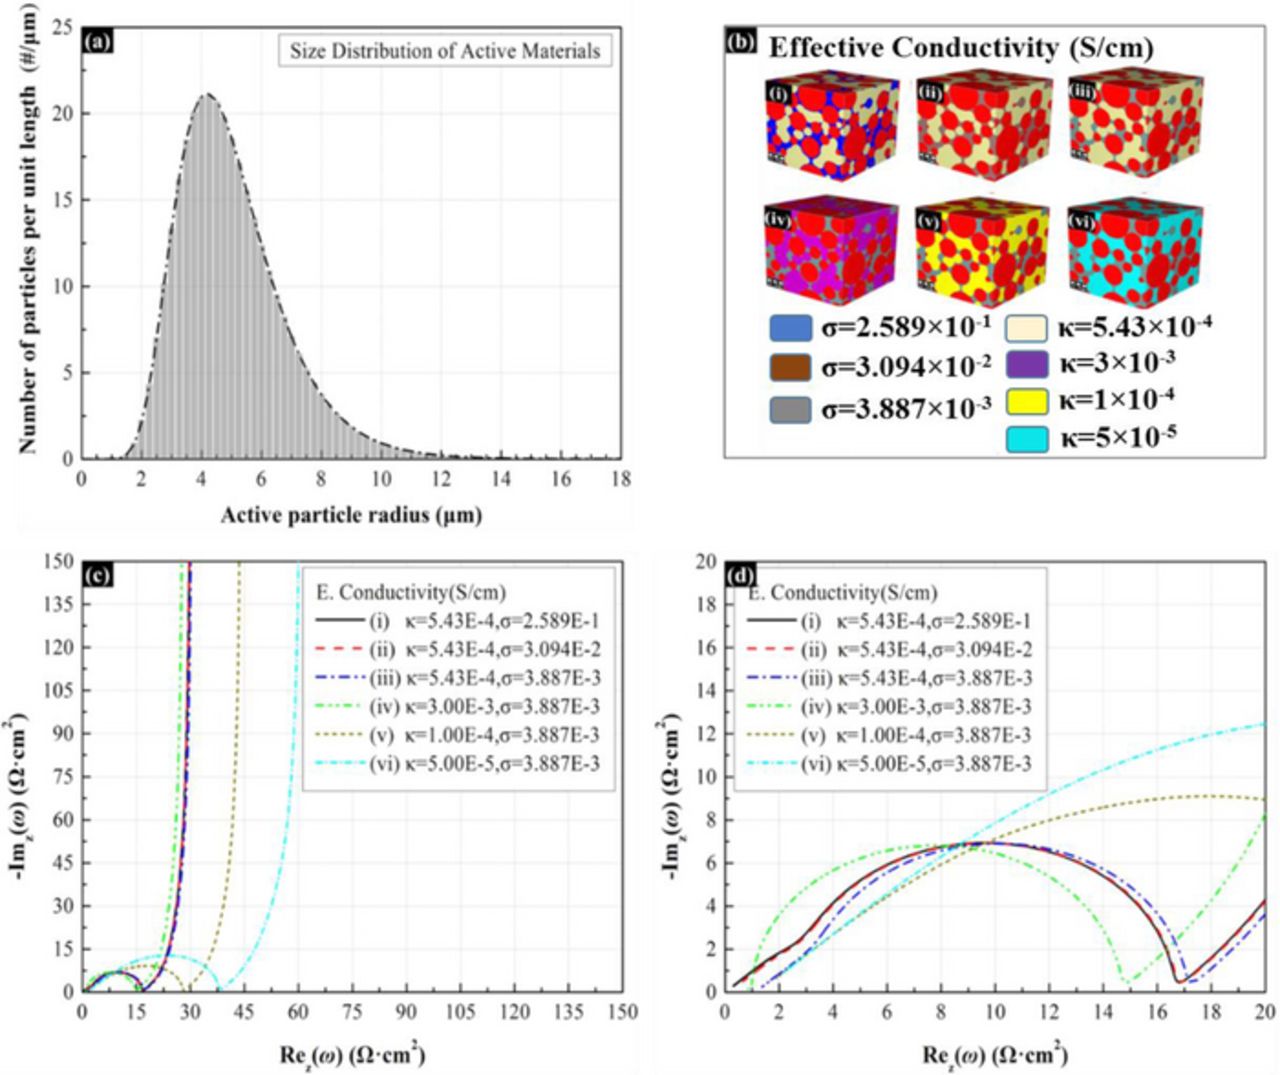
Figure 7. Effect of electrical and ionic conductivity on the impedance response. The mean radius of spherical active particles is 5μm and the volume fraction of spherical active particles is 50%. The specific surface area is 2343 cm−1. The ratio of effective electroactive surface area between active materials and electrolyte to geometric surface area of active materials is 0.277. The volume fraction of electrolyte is 35%. (a) Active particle size distribution. (b) Microstructures with various insertion materials. (d)Magnified view of Nyquist plot (c).
Influence of specific surface area of active material
To analyze the effect of electro-active surface area on the impedance response of the porous electrode, the microstructures with different specific surface area (cm−1) of active material has been investigated. In this subsection, the volume fraction of binder and active material is maintained constant. The particle size distribution and the corresponding microstructure are as shown in Figure 8a. In order to maintain the volume fraction of active material, the standard deviation of distribution decrease when we increased the specific surface area. The effective conductivities for solid phase and electrolyte are demonstrated in Figure 8b and 8c for the electrodes with different specific surface areas of active materials. These results illustrate that the increase of specific surface area of active materials results in a decrease of effective electrical conductivity of solid-phase. This is possible because the increasing surface area decreases the effective path for electron transport and hence decreases the electrical conductivity. For the ionic conductivity, since the change of porosity (i.e. the volume fraction of void) is negligible, the variation of effective ionic conductivity of electrolyte is also negligible. One should notice that the surface area shows in Eq. 15 is the interfacial area between active material and electrolyte, which is different from the total surface area of active material. The presence of binder decrease the interfacial surface since the binder covers the surface of active material, and hence affects the impedance response. Figure 8d shows the ratio between the effective (interfacial) surface area and geometric surface area (i.e. the total surface of active material). From Figure 8d, large geometric surface area decreases the effective area of the active material available to be covered by the binder. This depends on the relative volume fraction of the constituent components in the electrode, which allows the resulting surface coverage of the active particles by the binder. Figure 8e shows the effect of active material surface area to the impedance response. From the impedance response, the charge transfer resistance and solid-phase diffusion resistance decrease with the increase of surface area of active material. This is because the resistance is inversely proportional to the effective surface area as shown in Eqs. 16 and 17. It is worth noticing that since the effective electrical conductivity is larger than 1×10⁻³ S/cm, the influence of conductivity is negligible.
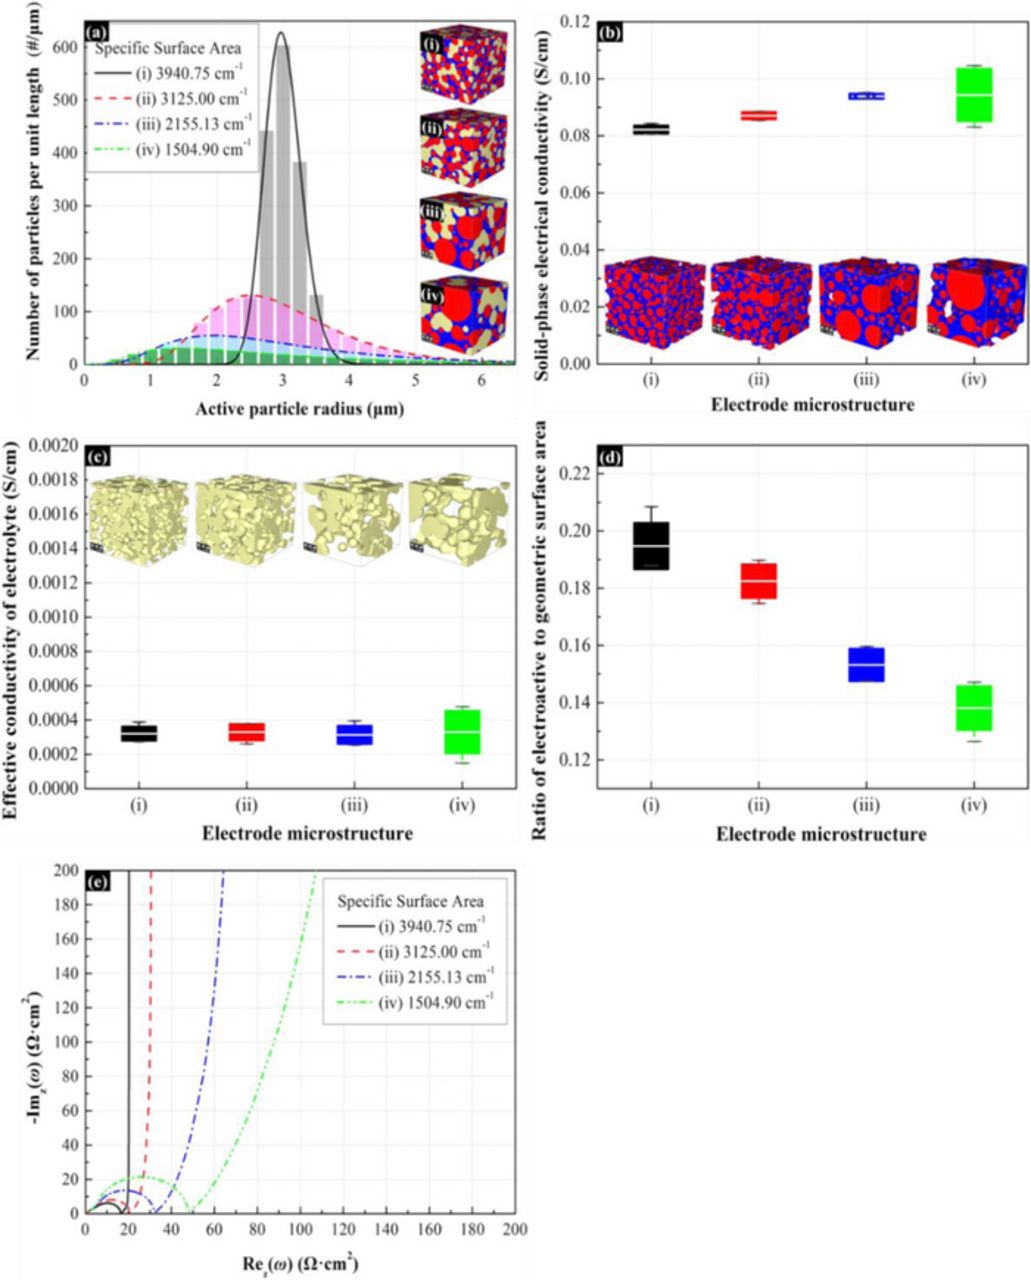
Figure 8. Effect of the specific surface area of active materials on the impedance response of the 3-D microstructure electrode. The mean radius of spherical active particles is approximately 3 μm and the volume fraction of spherical active particles is about 40%. The volume ratio of additive to binder is 0.3:1. The volume fraction of electrolyte is 35%. (a) Active particle size distribution in 3-D electrode microstructures. (b) Solid-phase effective electrical conductivity. (c) Effective ionic conductivity of electrolyte. (d) Ratio of effective electroactive surface area between active materials and electrolyte to geometric surface area of active materials. (e) Nyquist plot for impedance response of porous electrodes.
Influence of mean particle radius of active material
According to Eq. 13, the solid-phase diffusion is depended on the particle radius. Therefore, the mean particle radius of active material inside the electrode microstructure should also affect the impedance response. Figure 9a shows the particle-size distribution and the corresponding microstructure with different mean particle radius when the specific surface area and volume fraction of active material are maintained at constant. From the particle-size distribution, the number of active materials increases with the decrease of mean particle radius. According to Figure 9b-9d, the variation of mean particle radius has negligible influence on the electrical conductivity, ionic conductivity and effective surface area. Therefore, the mean particle radius only effects the solid-phase diffusion resistance as shown in Figure 9e. Due to the variation of diffusion length in the active material, the solid-phase diffusion resistance increases with the mean particle radius. This plot draws a vertical line at low frequencies because the reflective diffusion boundary in each active particle creates a blocking condition. Diard et al. have derived theoretical expressions that show that the diffusion impedance always displays capacitive behavior as the frequency moves toward zero.54
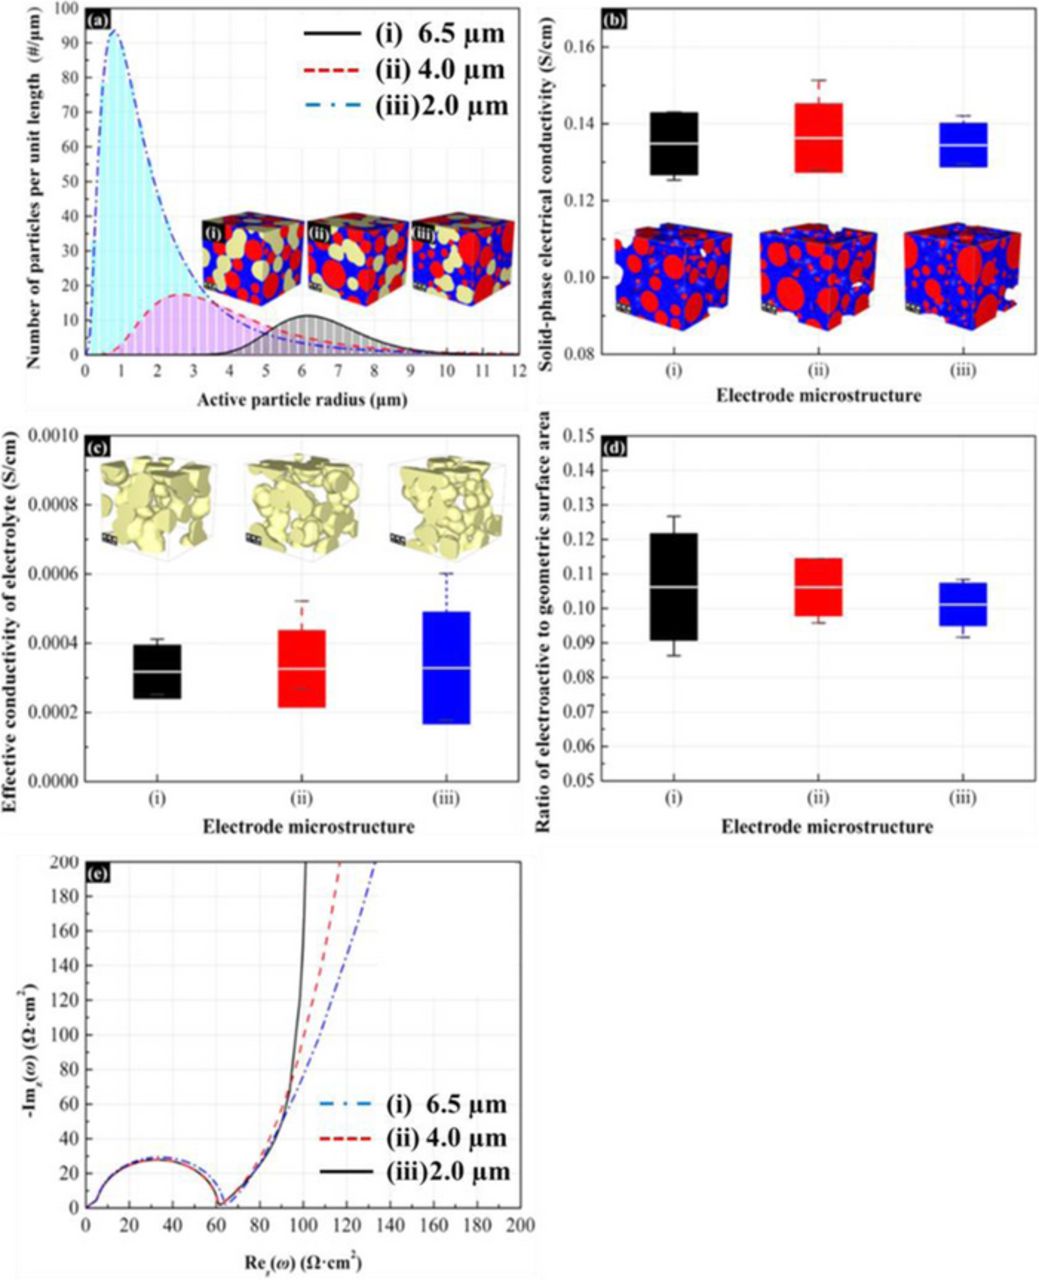
Figure 9. Effect of the mean particle radius of active materials on the impedance response of the 3-D microstructure electrode. The mean radii of active particles of (i), (ii), and (iii) porous electrodes are 6.504 μm, 4.019 μm, and 2.003 μm, respectively. The specific surface area of active particles is 1500 cm−1. The volume fraction of the active materials is 35% and the volume ratio of conductive additive to binder in the 3-D microstructures is 0.3:1. (a) Active particle size distribution. (b) Solid-phase effective electrical conductivity. (c) Effective ionic conductivity of electrolyte. (d) Ratio of effective electroactive surface area between active materials and electrolyte to geometric surface area of active materials. (e) Nyquist plot for impedance response of porous electrodes.
Influence of active material morphology on the impedance response
Electrochemical sauter mean diameter
If an active particle shape is complex or there exists an agglomerate particle in the microstructure electrode, it is difficult to define the transfer functions for diffusion impedance response due to its mathematical complexity. In this paper, we propose the concept of electrochemical Sauter mean particle diameter, which focuses on estimating the diffusion impedance response of anisotropic particles. The hypothetical particle has the same mean specific surface area (m−1) as that of the given particle. The ESMD of a cylindrical particle and a platelet particle is defined for analyzing the difference in diffusion impedance response between the characteristic diffusion length of the given particle and the ESMD as shown in Figure 3b.
The investigation of morphology effects of active materials on impedance response through the utilization of characteristic diffusion length and ESMD has been demonstrated in Figure 10 and 11. One should notice that the results shown in Figure 10 and 11 do not include the effect of ionic conductivity and electrical conductivity in order to observe the effect on impedance response purely because of the diffusion characteristic of active material. Figure 10a1 shows the particle size distribution of spherical, cylindrical, and platelet particles according to the characteristic diffusion length. In order to maintain the mean particle radius and specific surface area, the volume fraction of the active material was varied for different active particle morphology according to the aspect ratio. Figure 10a2 presents the impedance response of the electrode with different morphology of active material. From the impedance response, the platelet particle shows the largest solid-phase diffusion resistance, which is due to the geometric anisotropy of the active particles with different morphology. The geometric anisotropy of the active particle tends to affect the diffusion resistance, which has been emphasized here. In addition, since the specific surface of active material is maintained at constant, the morphology has no influence on the charge transfer resistance. Figure 10b1 and 10b2 show the influence of ESMD particle to the impedance response. Figure 10b1 shows the particle size distribution of spherical, cylindrical, platelet particles, according to the characteristic diffusion length. The particle size distribution shown in Figure 10b1 has the same ESMD distribution (i.e. the particle distribution of sphere particle). According to the particle size distribution according to characteristic diffusion length (Figure 10b1), the impedance response of spherical, cylindrical, and platelet particle almost overlap as shown in Figure 10b2 besides the low frequency region. The difference in the impedance response in the low frequency region is attributed to the fact that the ESMD approach cannot reflect the exact particle curvature. From Figure 10b2, the ESMD impedance response for a platelet particle deviates, although the relative slope of the low frequency tail is well captured. This is because of the curvature difference between the ESMD particle and a platelet particle is larger than that for the cylindrical and spherical particles. Although the ESMD approach shows deviations in the low frequency region, it is important to emphasize that the electrodes with the same ESMD distribution can accurately predict the impedance response in the intermediate and high frequency region as well a good description of the slope of the high frequency tail.
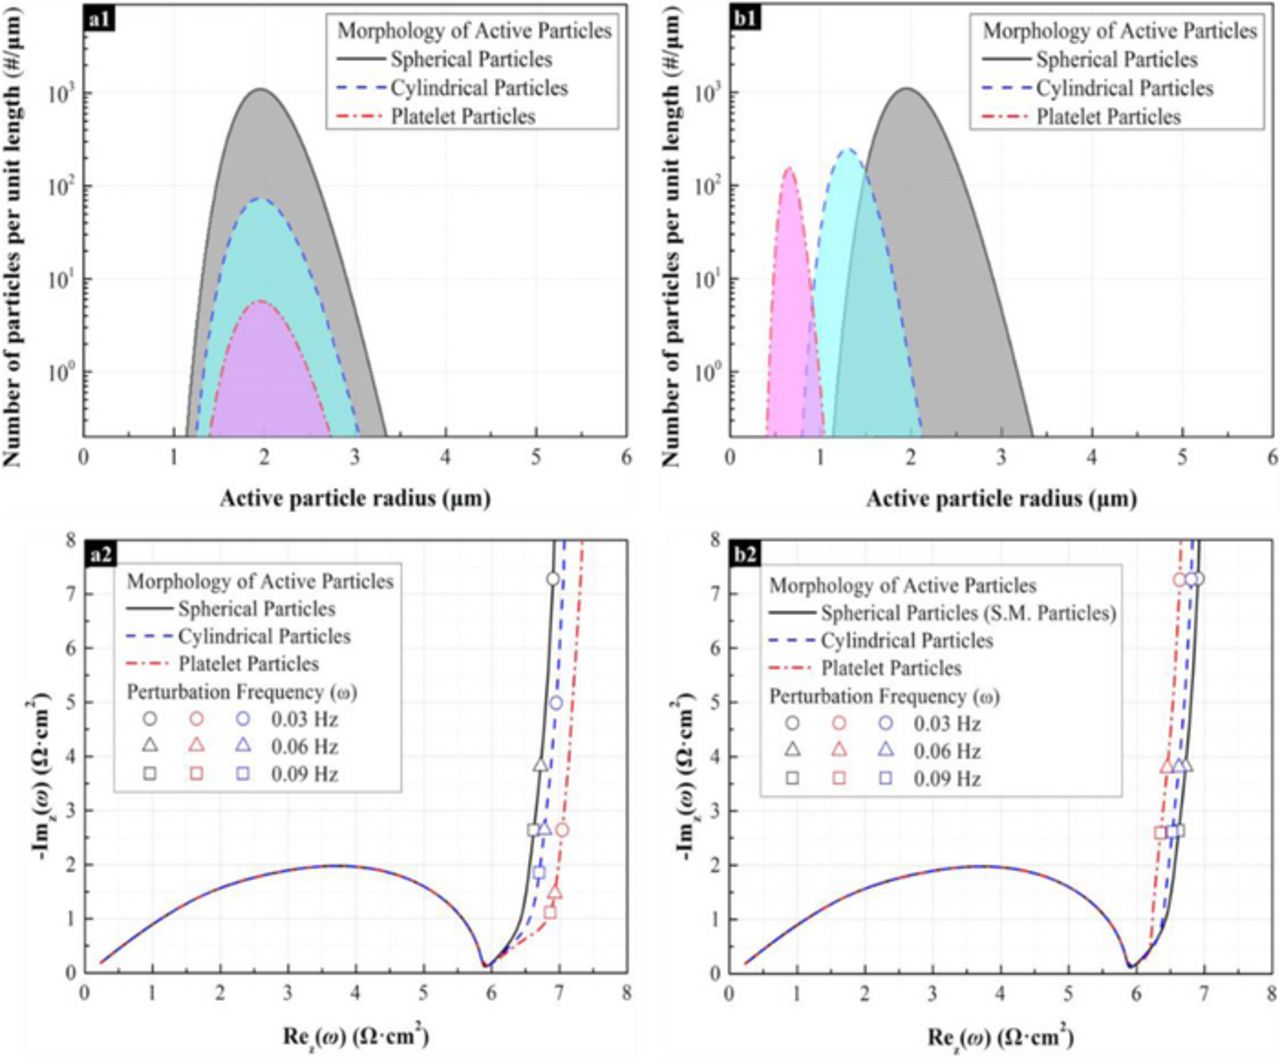
Figure 10. The morphology effect of the active material on the impedance response of the imaginary electrodes. The aspect ratios of cylindrical particles (1:γ) and planar particles (1:α:β) are 1:10 and 1:10:10, respectively. The specific surface area of active particles is 2900 cm−1 and the effective conductivity of solid-phase materials is 0.1 S/cm. The ratio of effective electroactive surface area between active materials and electrolyte to geometric surface area of active materials is 1. The electrolyte conductivity is 5.0×10⁻⁴ S/cm. (a) The characteristic mean length is 2 μm. The volume fractions of spherical, cylindrical, and planar active particles are 60%, 30%, and 20%, respectively. (a1) Active particle size distribution function. (a2) Nyquist image of impedance response. (b) The electrochemical Sauter mean radius is 2 μm, and the volume fraction of active particles is 20%. (b1) Active particle size distribution function. (b2) Nyquist image of impedance response.
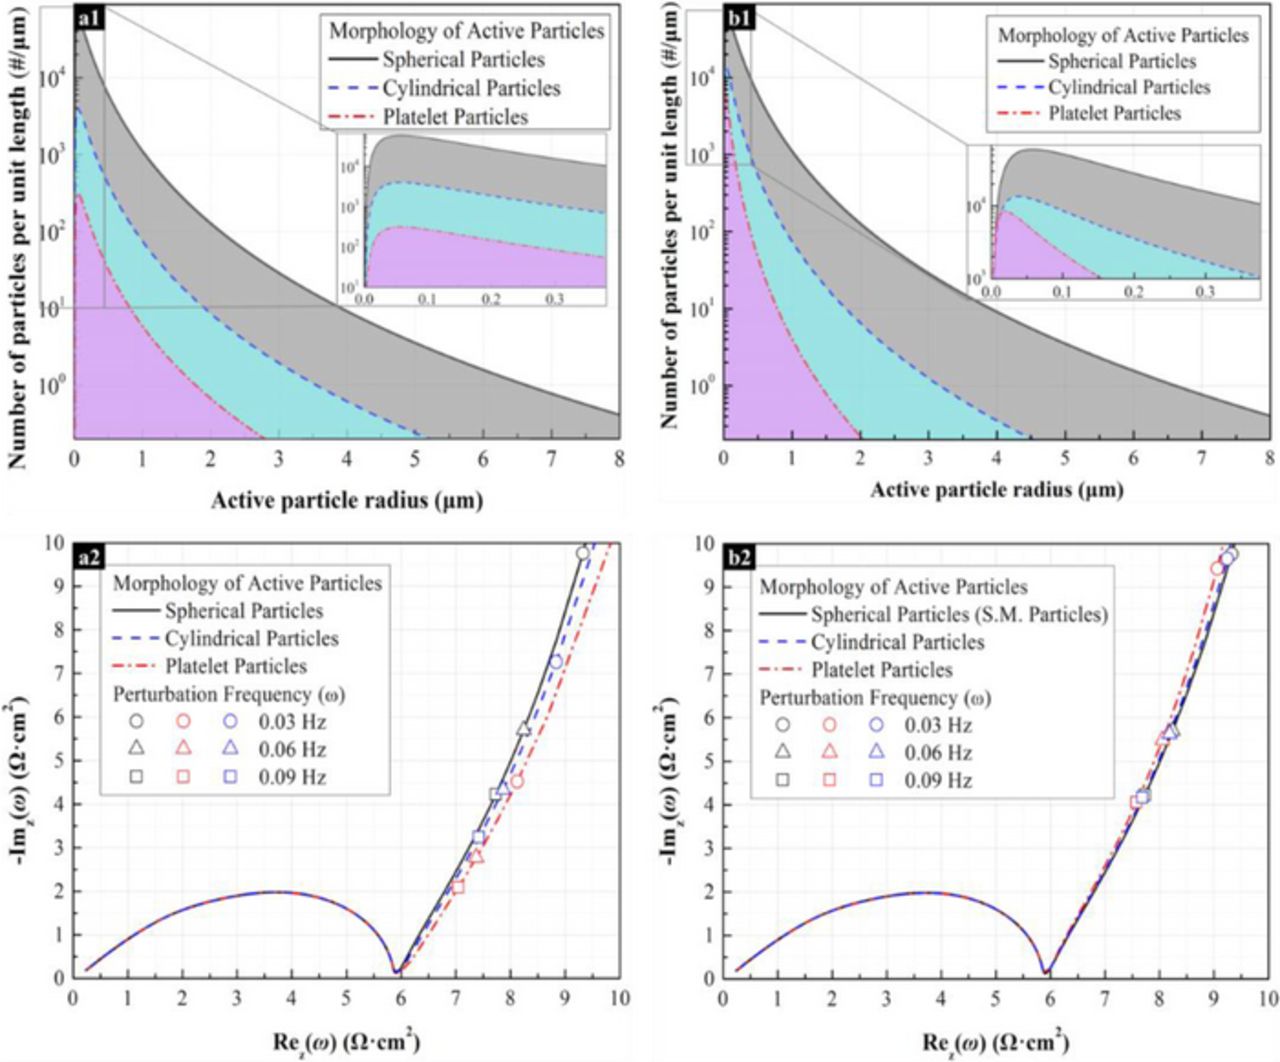
Figure 11. The morphology effect of the active material on the impedance response of the imaginary electrodes. The aspect ratios of cylindrical particles (1:γ) and planar particles(1:α:β) are 1:10 and 1:10:10,respectively. The specific surface area of active particles is 2900 cm−1 and the effective conductivity of solid-phase materials is 0.1 S/cm. The ratio of effective electroactive surface area between active materials and electrolyte to geometric surface area of active materials is 1. The electrolyte conductivity is 5.0×10⁻⁴ S/cm. (a) The characteristic mean length is 0.27 μm. The volume fractions of spherical, cylindrical, and planar active particles are 20%, 30%, and 60%, respectively. (a1) Active particle size distribution function. (a2) Nyquist image of impedance response. (b) The electrochemical Sauter mean radius is 0.27 μm, and the volume fraction of active particles is 20%. (b1) Active particle size distribution function. (b2) Nyquist image of impedance response.
In order to demonstrate the range of validity of the ESMD method, microstructures with significantly small particle size have also been studied. Figure 11 displays the results of an analogous simulation, run with dramatically smaller particle size than the simulation in Figure 10. One should notice that in order to keep volume fraction and specific surface area constant between the two simulations, size distributions were altered dramatically. Morphology effects on impedance response is similar to those in Figure 10a2 (Figure 11a2), but show a lower impedance slope in the Warburg regime due to the relatively increased size distribution. In this case, the impedance response showed in Figure 11b2 and 11b3 also suggests that, even the morphology of active material is different, the electrode can have similar impedance response if the electrodes show the same Sauter mean diameter distribution. Moreover, since the decrease of particle size also decreases the curvature effect, the deviation of the impedance response in the low frequency region becomes smaller compared to the result shown in Figure 10b2.
Effect of active material morphology on impedance response
The impedance response presented in Figure 10 and 11 only considered the effect of morphology to the solid-phase diffusion resistance. To further clarify the morphology effect, the influence of active material on the electrical and ionic conductivity should be included. Figure 12a shows the particle size distribution of spherical, cylindrical, and platelet particles according the characteristic diffusion length. The specific surface area and volume fraction of active material are maintained constant. From Figure 12b, the electrode with platelet active particles has the largest electrical conductivity because platelet and cylindrical active particles at the same volume fraction enable better alignment for electrical paths than spherical active particles. On the opposite, the electrode with platelet particles has the lowest ionic conductivity due to the tortuosity increase from the anisotropic of particle.55 Figure 12d shows that the morphology of active material also affects the effective surface area. This result suggests that the binder tends to cover more surface area for platelet particles than for the cylindrical and spherical active particles. The morphological effect on the impedance is as shown in Figure 12e. From the result, the impedance response of the electrode with platelet particle has the largest charge transfer resistance and solid-phase diffusion resistance than the electrodes with cylindrical and spherical particles. The difference in charge transfer resistance is because: (a) the surface area of spherical particle is much larger than the platelet particles for the same volume fraction and mean particle radius, (b) the binder covers less surface area for spherical active particles, and (c) the electrode with spherical active particles has the largest ionic conductivity. The different of solid-phase diffusion resistance is also because of the anisotropic of particles. It is worth noticing that the electrical conductivity has negligible influence since the value of electrical conductivity is smaller than 1×10⁻³ S/cm.
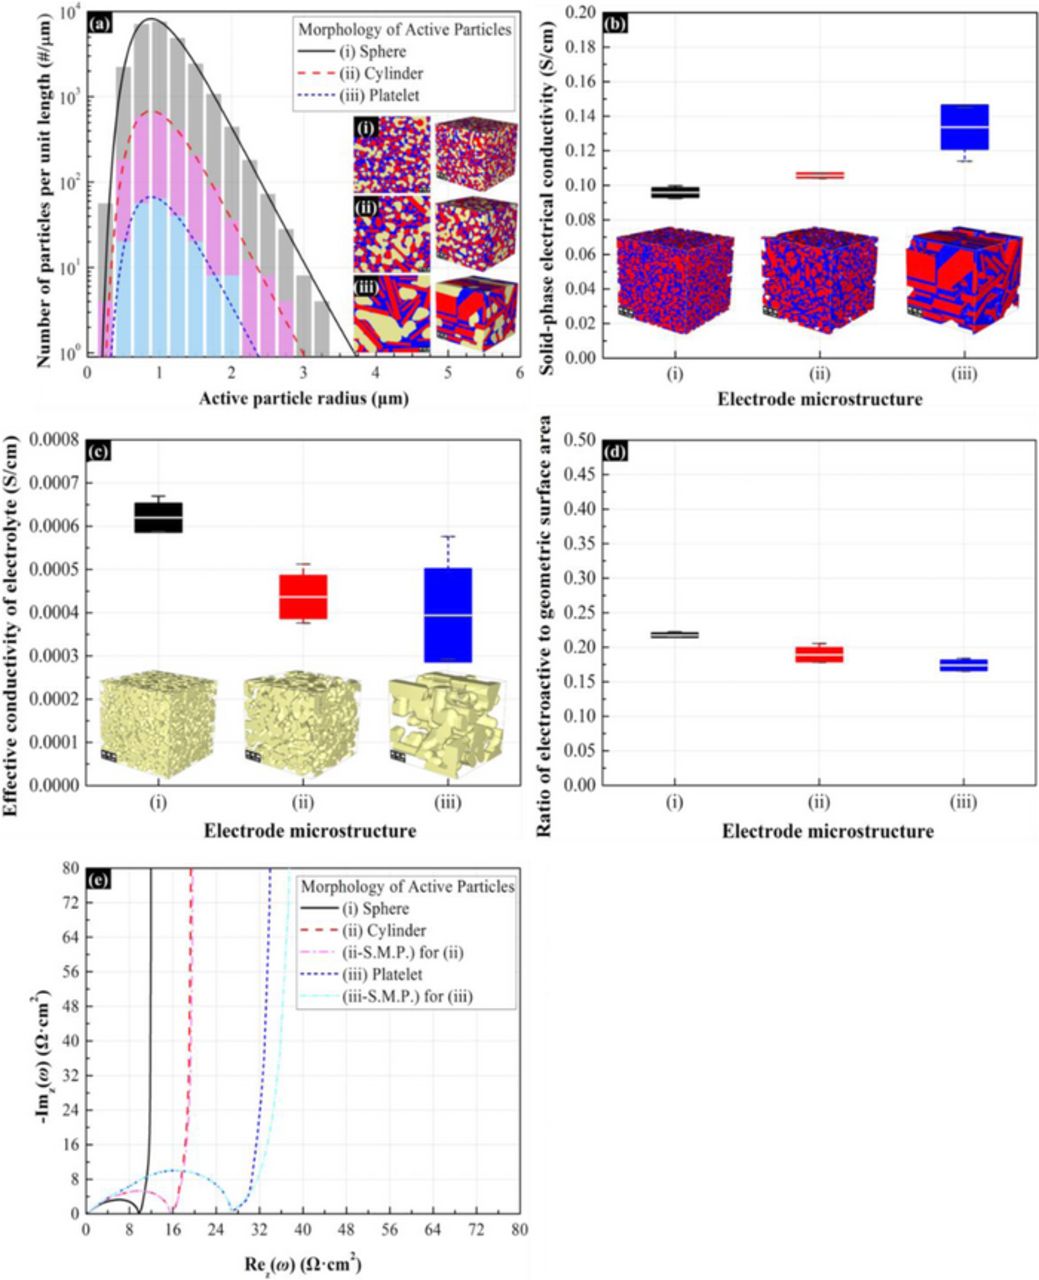
Figure 12. Morphology effect of the active material on the impedance response of the 3-D microstructure electrode. The aspect ratio of cylindrical particles(1:γ) and platelet particles(1:α:β) are 1:8 and 1:8:8,respectively. The characteristic diffusion radius is approximately 1.05 μm, and the volume fraction of active particles is 35%. The volume ratio of additive to binder is 0.3:1. The volume fraction of electrolyte is 35%. The specific surface areas of active particles in the electrodes are (i) 8010.871 cm−1, (ii) 5332.161 cm−1, and (iii) 2708.48 cm−1. (a) Active particle size distribution. (b) The effective electrical conductivities of solid-phase materials. (c) The effective electrical conductivity of electrolyte. (d) Ratio of effective electroactive surface area between active materials and electrolyte to geometric surface area of active materials. (e) Nyquist plot for impedance response of porous electrodes.
Figure 12e also compare the impedance response evaluated from ESMD and the one evaluated from the original method. The particle size distribution of microstructure (ii) and (iii) were transfer into ESMD distribution. During the transformation, the surface area of active material is maintained at constant. For microstructure (ii), the impedance response is successfully reproduced by using ESMD method. However, microstructure (iii) shows more differences between original and ESMD method with the platelet active particle in the diffusion frequency regime.
Conclusions
In this study, an integrated modeling of the electrochemical impedance response is presented in order to investigate the effect of electrode microstructures. Different 3-D electrode microstructures have been stochastically reconstructed, which include variations in active material morphology, particle-size distribution and composition (e.g. binder/conductive additive ratio). The electrode microstructural variations affect the electrochemical properties, such as effective electrical and ionic conductivity, solid phase diffusion, and effective surface area, and hence influence the impedance response. The electrical conductivity adds an additional ohmic resistance at the high frequency region, but has negligible influence on the overall resistance to charge transport and on solid-phase diffusion resistance. The active material/electrolyte interfacial area and ionic conductivity significantly affect the electrode impedance. It is important to note that the phase-change phenomenon in active materials is not considered in the present study. The crystallographic origins of impedance throughout the two-phase boundaries of typical phase-change active materials, such as LiFePO4, will be considered in the future.
In addition to the impact on the electrochemical properties, the active particle morphology also shows significant influence on the solid-phase diffusion resistance and hence on the impedance response. To study the effect of complicated active particle configuration, such as agglomerated particles, the concept of electrochemical Sauter mean diameter (ESMD) has been introduced. In this study, the ESMD method has been tested with spherical, cylindrical and platelet particles. From the impedance response, ESMD method has successfully reproduced the impedance response of electrodes with varying active particle morphology such as spherical, cylindrical and platelet particles. The ESMD method therefore can be an effective methodology, which can predict the electrode impedance response of complicated configurations, such as agglomerated particles. Finally, it is envisioned that this predictive framework will enable virtual probing of the effect of electrode microstructures on the electrochemical impedance response.
Acknowledgments
Financial support from Texas A&M University faculty research initiation grant is gratefully acknowledged. The authors gratefully acknowledge the support of Dr. Andreas Wiegmann from GeoDict, Math2Market GmbH for stochastic microstructure generation.