Abstract
Anode-supported solid oxide fuel cells (SOFCs) consisting of NiO-Y0.16Zr0.92O2-δ (YSZ) anode support layer, NiO-YSZ anode functional layer, YSZ electrolyte and (La0.8Sr0.2)0.98MnO3-δ (LSM)-YSZ cathode were successfully fabricated by single-step co-firing at 1250°C. Cells were prepared by tape casting, with Fe2O3 sintering aid used to obtain a nearly dense YSZ electrolyte. Scanning electron microscope (SEM)-energy dispersive X-ray spectroscopy (EDS) showed no evidence of reactions or interdiffusion between layers during co-firing. The cells yielded area specific resistance of 0.44 Ωcm2 and a maximum power density of 0.91 W/cm2 at 800°C. Impedance spectroscopy measurements showed that the LSM-YSZ cathode polarization resistance was higher for the co-fired cathodes than for a cathode that was fired separately at an optimized temperature of 1175°C. However, reducing the cell co-firing time decreased cathode polarization resistance and increased cell power output. Analysis of SEM images showed that co-firing caused more sintering and coarsening than in the optimally-fired LSM-YSZ, reducing three-phase boundary density and explaining the increased cathode resistance.
Export citation and abstract BibTeX RIS

This is an open access article distributed under the terms of the Creative Commons Attribution Non-Commercial No Derivatives 4.0 License (CC BY-NC-ND, http://creativecommons.org/licenses/by-nc-nd/4.0/), which permits non-commercial reuse, distribution, and reproduction in any medium, provided the original work is not changed in any way and is properly cited. For permission for commercial reuse, please email: oa@electrochem.org.
Anode-supported solid oxide fuel cells (SOFCs) with yttria-stabilized zirconia (YSZ) electrolytes are usually fabricated using at least two high-temperature firing steps: co-firing of the anode and electrolyte followed by application and firing of the cathode.1,2 This is based primarily on differences in desired firing temperatures – the YSZ electrolyte is densified at ∼ 1400°C – whereas cathode materials, typically based on (La0.8Sr0.2)0.98MnO3-δ (LSM), are usually fired at ≲ 1200°C. Also, the two-step process reduces possible reactions between cathode and electrolyte during firing. On the other hand, there are a number of reasons why single-step fired SOFCs are desirable. First, it simplifies the process, reducing the processing time and input energy, important given the general need to reduce SOFC cost in order to improve commercial viability.3–7 Second, single-step co-firing is a requirement for fabrication strategies where the entire stack, including cells, gas channels and interconnectors, are fired together.8 Third, it allows the fabrication of cells with a cathode-side mechanical support instead of an anode support.
In order to achieve single-step firing, the temperature should be reduced to allow a good cathode microstructure, while still densifying the YSZ electrolyte. YSZ electrolyte densification as low as 1200°C has been demonstrated when utilizing an appropriate sintering aid, e.g. Fe2O3.9,10 Recently, anode-supported SOFCs with YSZ/GDC bi-layer electrolytes have been produced by co-firing with Fe2O3 sintering aid at 1250°C, but with the cathode added in a second lower-temperature firing step.11 These temperatures are still above the ideal firing temperature for LSM-YSZ cathodes of ∼ 1175°C.12 Also, the shrinkage that occurs during single-step co-firing will exacerbate cathode densification, further reducing ideal cathode firing temperature. In the prior reports on single step co-firing,13,14 anode-supported SOFCs were fired at 1300–1330°C, and a (La0.85Ca0.15)0.97MnO3 (LCM) cathode that is more refractory than LSM was used to avoid over-sintering and coarsening. Even so, reducing the co-firing temperature from 1330 to 1300°C resulted in a decrease in cathode particle size from ∼ 3.13 to ∼ 2.32 μm, improving cell performance. Lower co-firing temperatures are desirable to reduce cathode sintering and coarsening, and to allow different cathode compositions.
In this work, we successfully demonstrate NiO-YSZ support|NiO-YSZ anode functional layer (AFL)|YSZ|LSM-YSZ|LSM SOFC fabrication by single step co-firing at 1250°C with a Fe2O3 sintering aid. The cells are characterized using scanning electron microscope (SEM)-energy dispersive X-ray spectroscopy (EDS) and focused ion beam (FIB)-SEM, current-voltage measurements, and impedance spectroscopy. Porous electrodes and dense electrolyte are obtained without significant element interdiffusion, and good cell performance is demonstrated.
Experimental
Cell fabrication
In this study, the cells consist of NiO-YSZ anode support, NiO-YSZ AFL, YSZ electrolyte, LSM-YSZ cathode functional layer and LSM current collector. Fig. 1a illustrates the schematic flow diagram for fabrication of the cells by tape casting and single-step co-firing. The anode supports were prepared by mixing NiO (J. T. Baker, d50 ≤ 3 μm) and YSZ (Tosoh, surface area = 6.2 m2/g) with 1:1 weight ratio, along with Tapioca starch (10 wt%) as pore former, xylene (Sigma-Aldrich, ≥ 98.5%) and ethanol (Decon Laboratories, INC., 200 Proof) as solvent, and blown menhaden fish oil (Tape Casting Warehouse, INC.) as dispersant. 2 mol.% Fe2O3 (Alfa Aesar, 99.8%, −325 mesh) was used as sintering aid to ensure shrinkage matching with other layers during sintering. The above materials were ball milled for 24h using 10 mm and 5 mm (1:3 weight ratio) diameter spherical YSZ milling media at a rotation rate of 240 rpm, followed by addition of polyvinyl butyral (PVB, Tape Casting Warehouse, INC.) as binder, butyl benzyl phthalate (BBP, Tape Casting Warehouse, INC.) and polyalkylene glycol (PAG, Tape Casting Warehouse, INC.) as plasticizers. The amounts of binder and plasticizers added in each slurry are summarized in Table I. A second ball milling was conducted for another 24h. The AFL slurry consisting of NiO and YSZ with 1:1 weight ratio and YSZ slurry with 3 mol.% Fe2O3 as sintering aid were prepared using the same dispersant, solvent, binder and plasticizers. The LSM (Praxair, d50 = 1.1 μm, surface area = 4.72 m2/g)-YSZ with 1:1 weight ratio cathode functional layer slurry and the LSM cathode current collector slurry were prepared in the same way, using graphite (Timcal, Switzerland, 30 wt%) with an average particle size of 2.2 μm as pore former. The resulting anode, electrolyte and cathode slurries were cast on the polyethylene (PET) carrier film by tape casting at room temperature. The final structure was fabricated by laminating NiO-YSZ anode support, NiO-YSZ AFL, YSZ, LSM-YSZ, and LSM tapes at 80°C for 30 min under a pressure of 5000 psi, with a thick graphite layer on top of the cathode to protect the cell from being damaged during lamination.15 The laminated cells were then punched into pellets with 19 mm diameter and sintered at 1250°C for either 4h (denoted single-step 4h) or 2h (denoted single-step 2h). During the sintering process, the ramping rate was set to 3°C/min to 600°C, and dwelled at this temperature for 1h, followed by ramping up to 1250°C at a rate of 5°C/min. The ramping down rate was kept at 5°C/min until room temperature was reached.
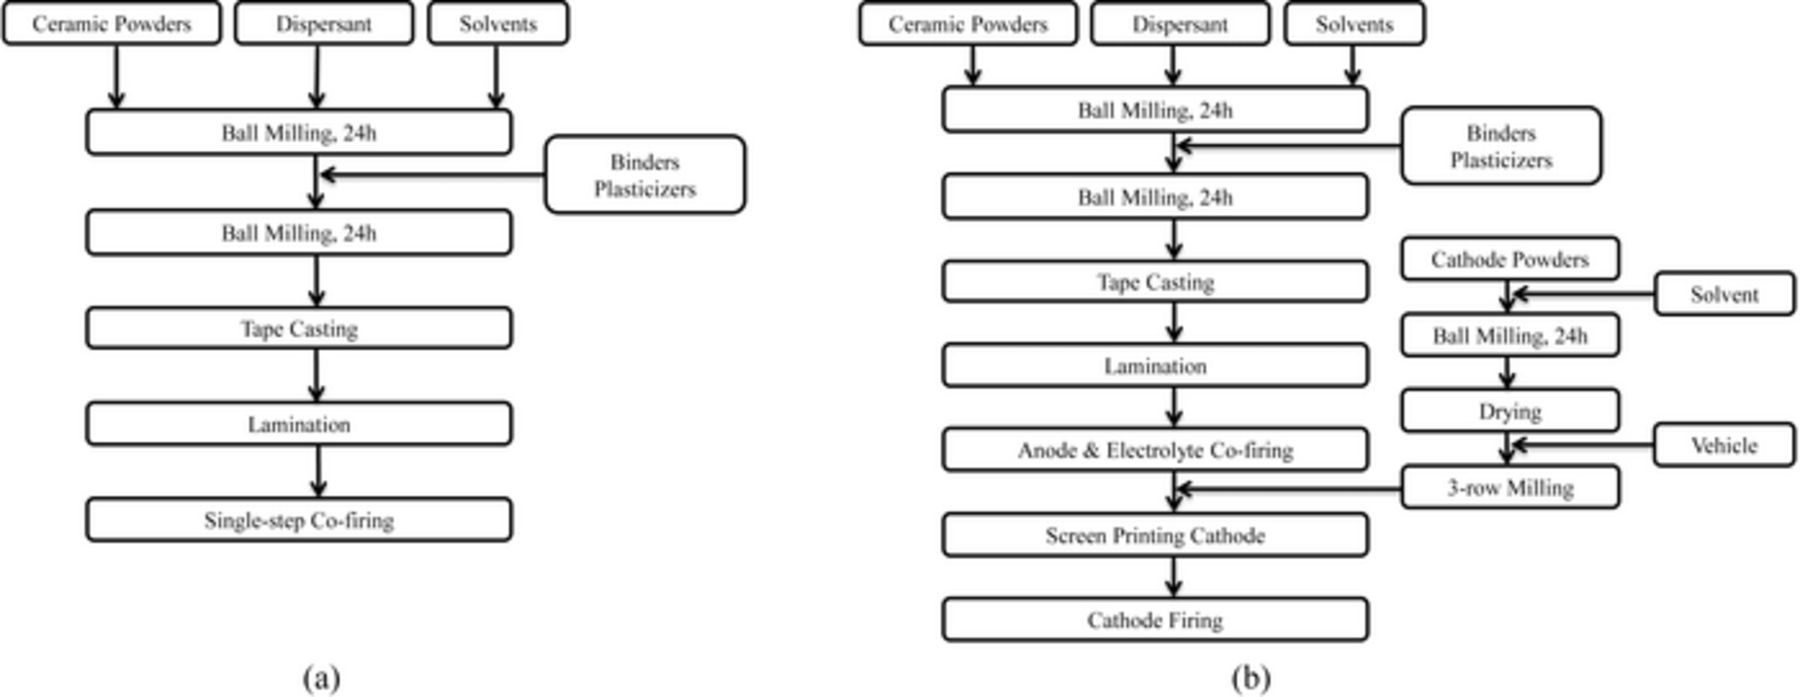
Figure 1. Schematic flow diagram for fabrication of anode-supported SOFCs by single-step co-firing (a) and with separate cathode firing (b). In (a), all the steps through Tape Casting were repeated for each of the five different cell component materials, which were then laminated and fired together. In (b), the anode and electrolyte materials were processed separately through the Tape Casting Step, while the cathode functional layer and current collector inks were prepared, printed, and fired separately.
Table I. Amounts of additives used in the tape casting slurries.
| Tape | PVB (wt%) | BBP (wt%) | PAG (wt%) |
|---|---|---|---|
| NiO-YSZ anode support | 3.64 | 2.73 | 2.73 |
| NiO-YSZ AFL | 7.94 | 6.35 | 6.35 |
| YSZ | 4.35 | 4.35 | 4.35 |
| LSM-YSZ | 7.94 | 6.35 | 6.34 |
| LSM | 4.42 | 3.54 | 3.54 |
To investigate the effect of cathode co-sintering on microstructure and electrochemical performance, a cell with a separately fired cathode was also prepared. As shown in Fig. 1b, the NiO-YSZ anode support, NiO-YSZ AFL and YSZ electrolyte with 3 mol.% Fe2O3 were fabricated using the same method as the single-step co-fired cells, except that the support/AFL/YSZ structure was fired without the cathode for 4h at 1250°C. LSM-YSZ (1:1 weight ratio) cathode functional layer ink was then screen printed on the electrolyte surface and fired at 1175°C for 1h. Finally, a pure LSM current collector ink was screen printed and fired at 1150°C for 1h. Note that no pore former was used in the cathode layers, unlike the single-step fired cathodes.
Electrochemical characterization
Cell current-voltage testing was carried from 700–800°C out in humidified hydrogen (3 vol.% H2O) fuel with flow rate of 100 sccm, and air oxidant at a flow rate of 200 sccm. Electrochemical impedance spectroscopy (EIS) measurements were performed using an IM6 Electrochemical Workstation (ZAHNER, Germany) with the cells at open circuit voltage (OCV) in the frequency range from 100 mHz – 100 kHz. H2-H2O-Ar mixtures with various H2 partial pressures (pH2) and O2-Ar with various O2 partial pressures (pO2) were used in the EIS measurements.
Microstructural characterization
After testing, the cell microstructure and elemental diffusion were examined with SEM (Hitachi S-8030) and EDS (Oxford X-max 80 SDD). The cell cathodes were also prepared for 2D cross-sectional imaging by epoxy infiltration and mechanical polishing.16,17 The imaging was done in a FIB-SEM (FEI Helios Nanolab 600 dual-beam) after a final FIB polishing of the cross section. The secondary electron (SE) detector with accelerating voltage of 2 kV was used for imaging because it provided the best contrast between LSM and YSZ.
Results and Discussion
Microstructural and chemical characterization
Fig. 2 shows fracture cross-sectional SEM images providing an overview of (a) the separately fired and (b) the single-step 2h cells. Only 2h-firing cell is shown here since the 4h-firing cell has similar structure. The thicknesses of the LSM current collector, LSM-YSZ cathode, YSZ electrolyte and NiO-YSZ anode functional layer are ∼20 μm, ∼20 μm, ∼10 μm and ∼20 μm, respectively, for both cells. The SEM images show that both the cathode and anode functional layer are porous, as needed to facilitate the electrode reactions. Large pores are evident in the anode support resulting from the starch pore former. A porosity of ∼20% develops in the anode functional layer, even without the use of pore formers, via the reduction of NiO to Ni upon exposure to fuel.18 The YSZ electrolyte shows slightly larger porosity than in the traditional 1400°C-fired cell,11 but with a low enough volume fraction that they are presumably isolated pores. The single-step-fired cathode showed a coarser microstructure, presumably due to the higher firing temperature.16 The porosity evident the separately fired cathodes resulted from incomplete sintering, whereas the porosity in the single-step co-fired cathodes resulted mainly from the addition of 30 wt% graphite pore former. Note that attempts to make single-step-fired cathodes without pore formers resulted in a nearly dense cathode; this was due to combined effects of the high co-firing temperature and the ∼20% shrinkage of the entire cell structure. For LSM-YSZ cathodes made with the same starting powders, but applied to a previously-fired (non-shrinking) YSZ electrolyte, a porous cathode structure was maintained at a firing temperature as high as 1325°C.12 Comparison of these results illustrates that the shrinking versus non-shrinking support is an important factor determining the LSM-YSZ cathode structure.
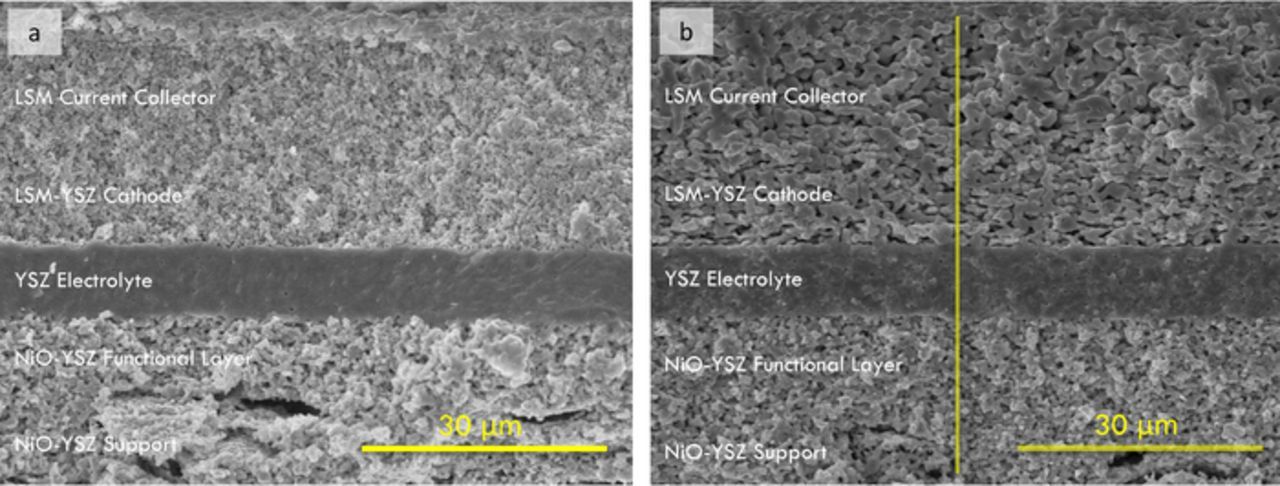
Figure 2. Fracture cross-sectional SEM images of the separately fired (a) and single-step 2h (b) cells, taken after electrochemical testing.
Fig. 3a shows an example EDS line scan, taken along the yellow line in Fig. 2b. In general, the LSM, LSM-YSZ, YSZ, and NiO-YSZ layers retain clear sharp interfaces on the scale resolvable by SEM-EDS (∼1 μm); thus, there is no detectable elemental interdiffusion during the co-firing process. Although there appeared to be a small amount of Y in the LSM current collector, this was an artifact due to an overlap between the Y Lα1 (1.923 keV) and Sr Kα1 (1.807 keV) peaks, as shown in the EDS spectrum in Fig. 3b. Unfortunately, this peak overlap makes it difficult to determine if there is any formation of strontium zirconate at the LSM-YSZ interface. There is no increase of the La signal at the cathode/electrolyte interface that might indicate lanthanum zirconate formation.
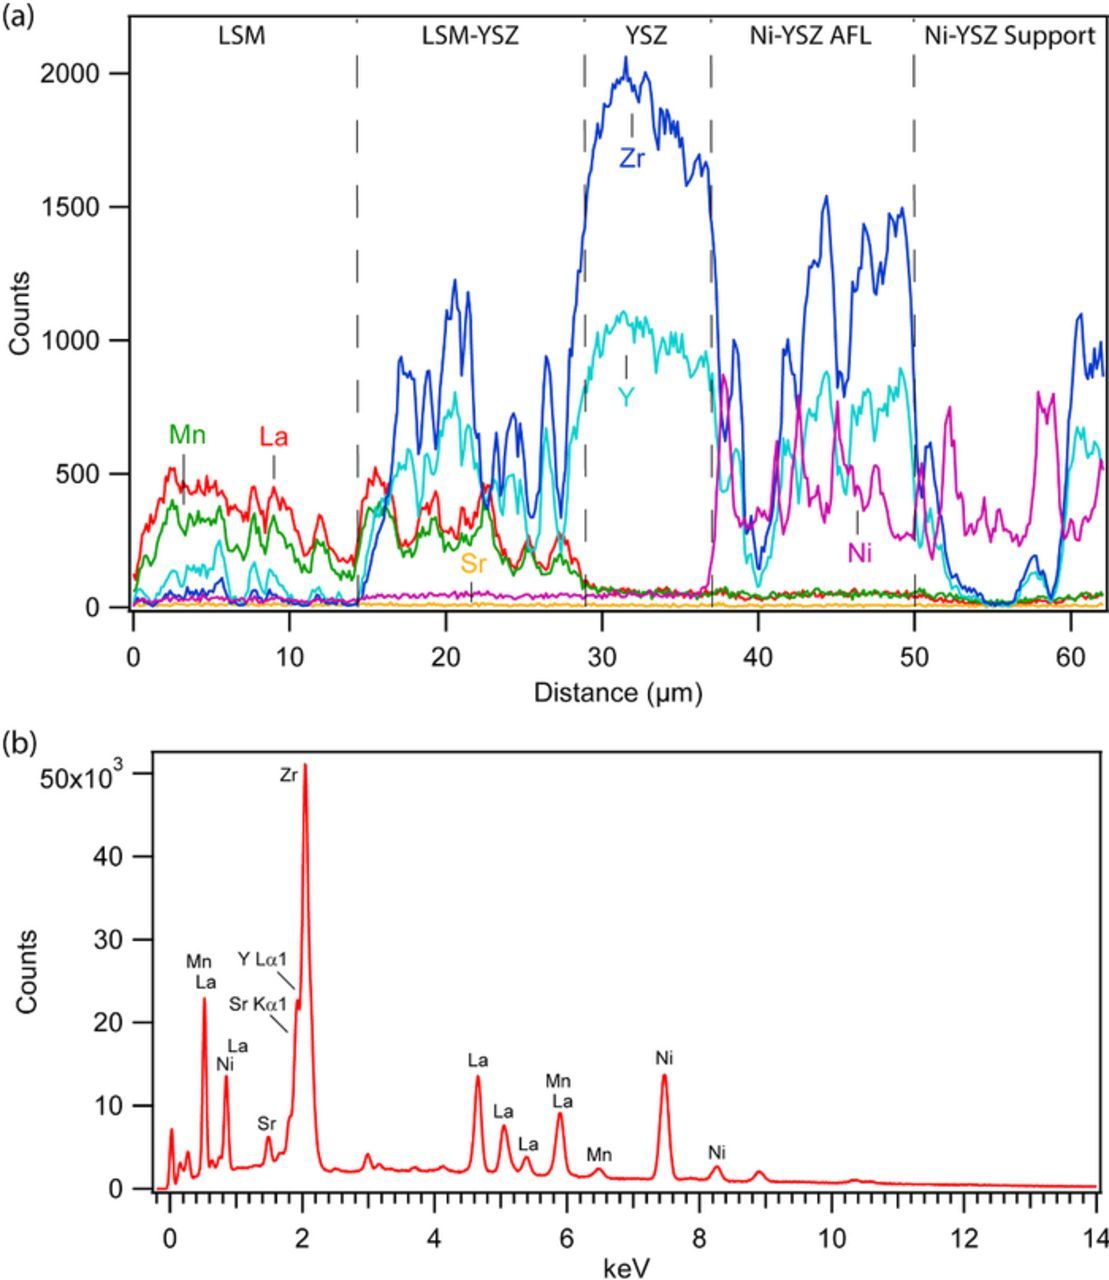
Figure 3. (a) EDS intensity line scans, taken along the line shown in Fig. 2b, showing the spatial variation of the Y, Zr, Ni, La, Sr and Mn peak signals in the single-step 2h cell. (b) An EDS sum spectrum, indicating the peak energies used for each element in the line scan.
In order to clarify how the single-step firing process affected the cathodes in these cells, microstructural analysis was done using SEM imaging of FIB-polished cross sections. In addition, the cathode pore space was filled with epoxy, providing clear contrast between pores and solid phase. Furthermore, imaging conditions were used that provided reasonable contrast between the LSM and YSZ phases. Fig. 4 shows the FIB-SEM images for single-step-fired (2h and 4h firing time) and separately fired cathodes. While the single-step-fired cathode structures appear similar, the separately fired cathode shows a much smaller feature size. Stereological analyses of the 2D images, shown in Table II, were used to quantify these microstructural differences. The ratio of the LSM and YSZ volume fractions are within measurement error of the expected volume ratio of 0.91:1 LSM:YSZ. The pore volume fraction decreased from 36.5% to 27.6% upon increasing the firing time from 2 to 4 h, indicating increased cathode sintering. The measured specific surface areas of the three phases, along with measured three-phase boundary (TPB) densities, are also displayed in Table II. Increasing the firing time slightly decreased the specific surface areas and the total TPB density, indicating an increase in the average particle sizes via increased particle coarsening. The separately fired cathode had a substantially higher surface area and total TPB density than the co-fired cathodes; although the porosity was similar to the single-step-fired cathodes, this indicates reduced sintering because no pore former was used in this case. These differences can presumably be explained by the lower firing temperature and time, as well as the constraint of a non-shrinking electrolyte/anode support in the separately fired cathode case.
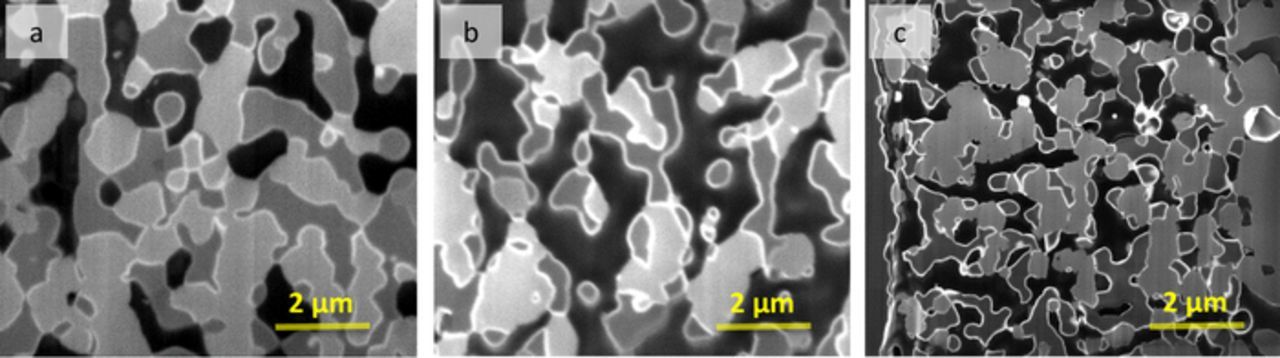
Figure 4. 2D cross-sectional SEM images for single-step 4h (a), single-step 2h (b) and separately fired (c) cells. The samples were epoxy infiltrated, polished and ion-milled to achieve good contrast between LSM (light gray), YSZ (dark gray) and pore (black).
Table II. Values calculated from the 2D cross-sectional images of different cells.
| Single-step | Single-step | Separately | |
|---|---|---|---|
| Microstructural Parameter | 4h | 2h | fired |
| LSM Vol.% | 36.4 | 31.1 | 33.5 |
| YSZ Vol.% | 36.0 | 32.4 | 35.6 |
| Pore Vol.% | 27.6 | 36.5 | 30.8 |
| LSM Specific Surface Area (μm−1) | 1.70 | 1.88 | 3.02 |
| YSZ Specific Surface Area (μm−1) | 2.17 | 2.37 | 3.46 |
| Pore Specific Surface Area (μm−1) | 1.90 | 1.70 | 3.16 |
| Total TPB Density (μm−2) | 1.33 | 1.64 | 4.05 |
Electrochemical characterization
Fig. 5 compares the voltage-current characteristics for the different cells, measured at 800°C. A number of cells were tested for each fabrication method. Data shown are from the best-performing cell of each method. The separately fired cell yields a maximum power density of 1.08 W/cm2 at 800°C, higher than those of the single-step co-fired cells – 0.85 and 0.91 W/cm2 for 4h- and 2h-firing cells, respectively. Similar trends were observed in measurements at lower cell operating temperatures (summarized in Table III). The OCV values of the single-step-fired cells are ∼1.055 V at 800°C in 97% H2 – 3% H2O and air. For comparison, anode-supported cells with pure dense YSZ electrolytes (sintered at 1400°C) and tested in this same setup yielded about the same OCV.20 This suggests that there was little effect of any additional porosity in the present cells, and that any electronic conductivity caused by Fe2O3 is negligible. Note that these OCV values are slightly lower than the calculated Nernst potential of 1.10 V for the present fuel and oxidant compositions; this has been explained by the Ag seals used in the test setup, which appears to slight leakage.20 The separately fired cell has slightly lower OCV in Fig. 5, probably due to worse leakage at the Ag seal.
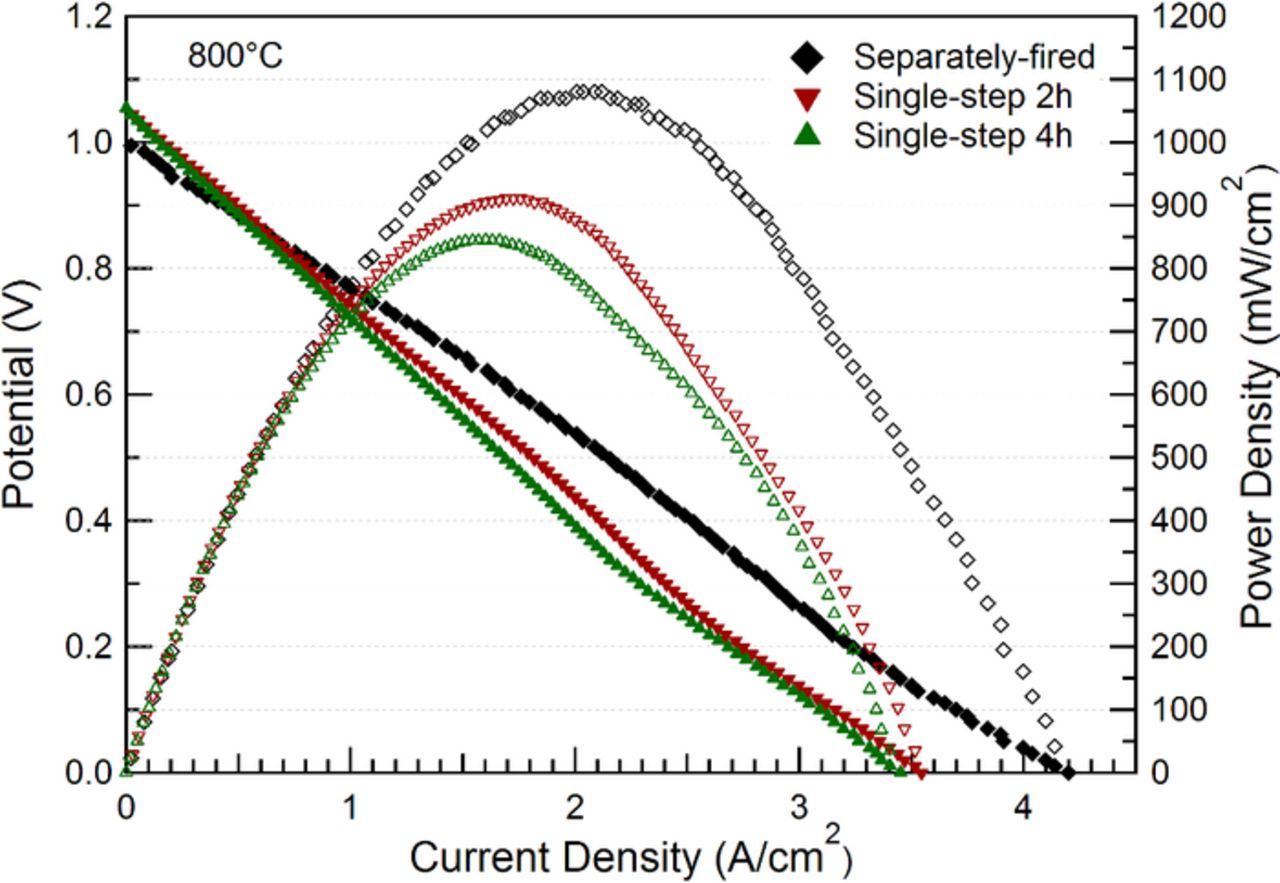
Figure 5. Voltage and power density versus current density for different cells operating at 800°C.
Table III. OCV and Pmax of different cells operating at different temperatures.
| Single-step 4h | Single-step 2h | Separately fired | ||||
|---|---|---|---|---|---|---|
| OCV (V) | Pmax (W/cm2) | OCV (V) | Pmax (W/cm2) | OCV (V) | Pmax (W/cm2) | |
| 800°C | 1.054 | 0.85 | 1.055 | 0.91 | 0.995 | 1.08 |
| 750°C | 1.062 | 0.44 | 1.068 | 0.49 | 1.020 | 0.82 |
| 700°C | 1.071 | 0.26 | 1.077 | 0.29 | 1.030 | 0.56 |
Fig. 6 presents Bode and Nyquist plots of the EIS data from the cells shown in Fig. 5. The ohmic resistances are 0.06–0.07 Ωcm2 for all cells, as expected for a ∼10 μm thick YSZ electrolyte at this temperature, indicating no measurable decrease in the ionic conductivity of YSZ due to Fe-doping. The slightly lower ohmic resistance of the separately fired cell is presumably a result of cell-to-cell variations, e.g. a slightly thinner electrolyte. The total area specific resistance values for single-step 4h, single-step 2h and separately fired cells are 0.51 Ωcm2, 0.44 Ωcm2 and 0.20 Ωcm2, respectively, in good agreement with the trend in power density shown in Fig. 5.
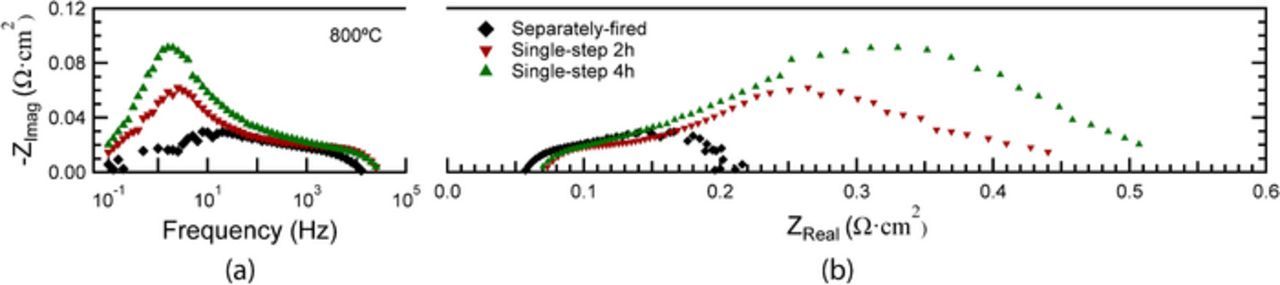
Figure 6. Bode (a) and Nyquist (b) plots of EIS data from different cells measured at 800°C at OCV.
The EIS data showed three main electrode responses: a low-frequency (LF) response centered at ∼3 Hz, a middle-frequency (MF) response centered at ∼60 Hz, and a high-frequency (HF) response centered at ∼15,000 Hz. The Bode plots of EIS data for the single-step fired cells in Fig. 6a show that the MF and HF responses do not vary significantly with cathode processing conditions. The LF response clearly increases with the increase in firing time from 2 to 4h. For the separately fired cell, the LF response is mostly eliminated, which can be explained based on prior results on similar LSM-YSZ cathodes showing that the dominant response shifts from 100–1000 Hz for low firing temperatures (1075–1175°C) to 1–10 Hz for high firing temperatures (1225–1325°C).16 In general, it can be concluded that the LF response decreases with decreasing cathode firing temperature and time; this is readily explained by the associated increase in cathode TPB density shown in Table II.
In order to more clearly associate the EIS responses with specific electrochemical mechanisms, EIS measurements were taken at varying O2 and H2 partial pressures and different temperatures, using single-step 4h fired cells as an example. Fig. 7 shows the Bode and Nyquist plots of EIS data measured at 800°C under different cathode pO2 with 97% H2 – 3% H2O at the anode. The response at LF increases and shifts to slightly lower frequency as pO2 decreases, providing additional evidence that this is a cathode response. The other responses at higher frequency do not increase significantly.
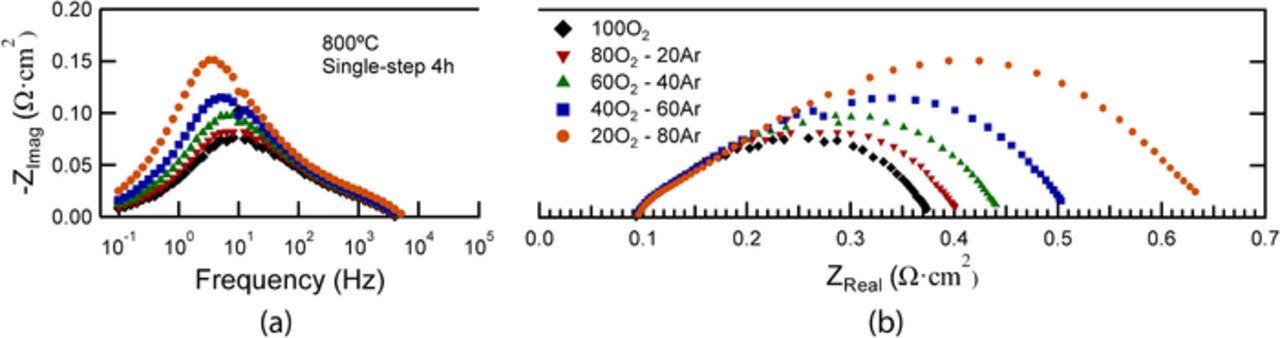
Figure 7. Bode (a) and Nyquist (b) plots of EIS data from single-step 4h cell measured at 800°C under different O2 partial pressures. Humidified hydrogen is used on the anode side. Note that these measurements were done in a different test setup than the others in this paper, with synthetic air (20% O2 – 80% Ar) instead of lab air, and with a different cell; thus, the magnitudes of the EIS responses do not agree exactly with other EIS data.
Fig. 8 shows Bode and Nyquist plots of EIS data from the single-step 4h fired cell measured at 800°C under different pH2 with air on the cathode side. The LF and MF responses grow larger and shift to lower frequency with decreasing pH2, but the HF response increases only very slightly. These frequencies agree well with those normally observed for Ni-YSZ anodes,21,22 and are correlated to anode gas conversion (∼1 Hz), anode gas diffusion (∼10 Hz) and charge transfer (∼1000 Hz). Regarding Fig. 6, it is not surprising that the MF and HF responses are very similar in the different cells, given that the anodes are identical. The anode response at LF overlaps with the main cathode response, which is responsible for the LF response changes with cathode processing.
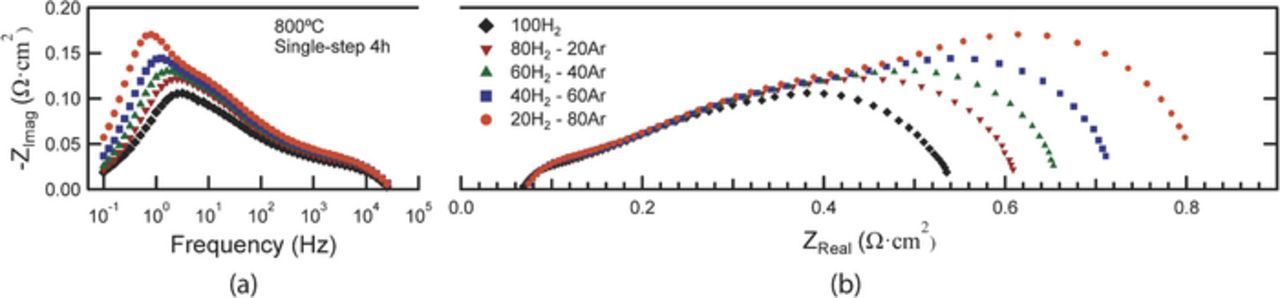
Figure 8. Bode (a) and Nyquist (b) plots of EIS data from single-step 4h cell measured at 800°C under different H2 partial pressures. The water steam partial pressure is constant at 0.03 atm. Flow air is used on the cathode side.
Bode and Nyquist plots of EIS data from the single-step 4h fired cell taken at varying temperatures are shown in Fig. 9. There is a general increase in the response magnitudes across a broad range of frequencies. Although the gas conversion and gas diffusion components of the LF response should not be strongly temperature dependent, the cathode response should be strongly temperature dependent. Similarly, the charge-transfer anode response at ∼1000 Hz should also be temperature dependent. Finally, the response at ∼10,000 Hz is probably associated with YSZ grain boundaries in the LSM-YSZ cathode,16 which should have a strong temperature dependence with no pH2 dependence. These three responses explain the temperature dependence shown in Fig. 9.
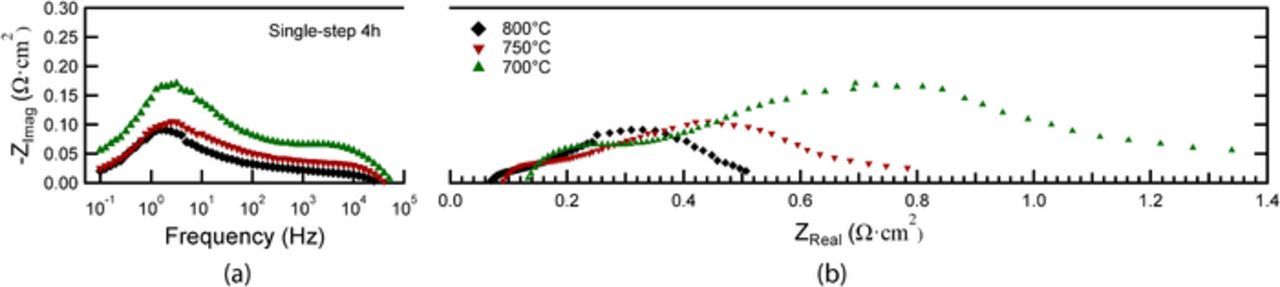
Figure 9. Bode (a) and Nyquist (b) plots of EIS data from single-step 4h cell measured at different temperatures.
Based on the EIS data taken at different pO2, pH2 and temperatures, it is clear that the increase in LF response with increasing cathode firing temperature and time is attributed to a cathode electrochemical process. There is a clear correlation between the magnitude of this LF response and the measured TPB densities (Table II).
Conclusions
Ni-YSZ anode-supported SOFCs with YSZ electrolytes and LSM-YSZ cathodes have been successfully fabricated by single-step co-firing at 1250°C, using Fe2O3 as a YSZ sintering aid. Area-specific resistance was 0.44 Ωcm2 and maximum power density was 0.91 W/cm2 for a 2h firing time. Increasing the firing time to 4h increased the cell resistance to 0.51 Ωcm2 and decreased power density. For comparison, a conventional cell where the cathode was fired separately at a lower temperature showed much better cell performance. The changes in performance were a direct result of changes in the cathode impedance response at 1–10 Hz, and correlated well with increases in TPB density with increasing cathode firing temperature or time. That is, the requirement of co-firing the LSM-YSZ cathodes at the relatively high temperature of 1250°C in the single-step fired cells leads to a relatively large polarization loss at 1–10 Hz. In order to achieve higher-performance single-step co-fired cells, it will be necessary to achieve a finer-scale cathode microstructure with higher TPB density. This can be achieved either by suppressing cathode coarsening/sintering via further reductions in the co-firing temperature, or by replacing LSM with a more refractory cathode material such as (La,Ca)MnO3.
Acknowledgments
The authors gratefully acknowledge financial support by the National Science Foundation Ceramics Division under grant number DMR-1506925, and the Institute for Sustainability and Energy at Northwestern (ISEN). The authors also acknowledge the assistance of the Electron Probe Instrumentation Center (EPIC) at the NUANCE Center-Northwestern University, which has received support from the MRSEC program (NSF DMR-1121262) at the Materials Research Center; the International Institute for Nanotechnology (IIN); and the State of Illinois, through the IIN.