
Abstract
Electrochemical characteristics, composition and surface morphology of vinyltriethoxysilane (VTES) coatings on aluminum were investigated. The silane coatings were deposited chemically, by immersion in 2 and 5% VTES, and then cured at 100°C during 10 or 30 min. Surface morphology of VTES films was analyzed by scanning electron microscopy, while the composition was investigated by X-ray photoelectron spectroscopy. The corrosion stability of silane coatings was determined by electrochemical impedance spectroscopy in 0.03% NaCl. The results obtained were compared with the standardized analysis in the salt spray chamber. The percentage of the corroded area was determined by optical microscopy coupled with image analysis. The influence of VTES concentration and curing time on the corrosion stability of silane films on aluminum was shown. The highest corrosion stability was obtained for silane films deposited from 5% VTES solution with 30 min curing, while the lowest stability was determined for silane films deposited from 2% VTES solution with 10 min curing. Surface analysis suggests that the coatings with the highest corrosion stability are related to the intensive siloxane bonding (Si–O–Si), which is favored by deposition from more concentrated VTES solution.
Export citation and abstract BibTeX RIS
Before the implementation of metals in different applications, corrosion becomes an important issue. The long term behavior, particularly of painted metals, significantly depends on the pretreatment procedure, and until recently the best performances were obtained by chromate-based pretreatments. Due to ecological requirements, the processes involving the use of hexavalent chromates are being replaced by novel environmentally friendly pretreatments, since the Cr(VI) represents high risk for both human health and the environment. Adhesion promotion of primers, mostly polymer coatings, to metallic substrates and corrosion protection, were both found in new hybrid organic-inorganic compounds – silanes.
Silanes, with general formula X3Si(CH2)nY, have a two specific groups in their structure: a hydrolysable alkoxy group X (ethoxy, methoxy), which bonds to the metal surface, via silanol groups (SiOH) formed during hydrolysis of the silane solution, and an organofunctional group Y (vinyl, mercapto, amino), which bonds to the organic film,1–3 promoting the adhesion between the substrate and coating.4–6 The properties of silane films highly depend on the deposition parameters, silane solution concentration and pH, curing temperature, application and drying methods.7–10 For example, the thickness of the silane layer is significantly affected by the silane bath concentration.9 However, it is shown that the higher thickness does not necessarily provide better corrosion stability, since there are different factors, such as porosity of the silane film, that exhibit greater influence on the silane film performances than thickness itself.8 So, the optimum properties of the silane layer remain to be examined for the particular purpose, since the future use of silanes is being confirmed by the continual synthesis of new silane-based compounds,11,12 thin films13,14 and findings of the new silane-based metallic pretreatments.15
In this work, we have investigated the influence of the silane solution concentration and curing time on the morphology and electrochemical properties of the vinyltriethoxysilane (VTES) films on aluminum. Vinyl-containing silane is a coupling agent which improves the performances of polymer materials, including the weather resistance, mar resistance, and stain resistance,16–18 or enhances the miscibility of non-mixable phases.12 VTES is the one of the so called "non-functionalized" silanes, which are shown to be good crosslinkers, improving polymerization and stability of the silane film,19 probably due to the vinyl-group. Namely, besides the formation of the polysiloxanes, one of the possible VTES transformations is the polymerization of the vinyl-group, contributing to the to the improved protectiveness probably by enhancing the barrier properties.20 We have also shown that VTES films on aluminum exhibited significant corrosion protection as a sole protective layer in the aggressive 3% NaCl solution,8 which is in accordance with previously reported results for different ethoxysilanes.21 It was also reported that negatively charged alkoxysilanes inhibited pitting corrosion by electrostatic repulsion of chloride anions, while a positive charge of aminosilanes accelerated pitting either by the attraction of chloride anions,22 or by formation of water-soluble protonated amine salts, which reduce the ionic resistance of the coating system.23 Continuing our previous study, here we have studied the surface morphology and corrosion stability of VTES in mild 0.03% NaCl solution, as well as in salt spray chamber, in order to more accurately define the influence of the VTES film type on aluminum on the corrosion behavior of the system.
Experimental
Preparation of the metallic substrate
The aluminum panels (Al 99.7% purity, dimensions: 50 mm × 40 mm × 1 mm for surface analysis, 20 mm × 50 mm × 1 mm for impedance measurements and 40 mm × 60 mm × 1 mm for salt spray chamber investigations) were used as substrates. Panels were pretreated by alkaline solution, since this process leads to the increase in the number of hydroxyl groups on the surface, consequently increasing the number of deposition sites for silanes.24 Alkaline solution (pH 13) consisted of 7.5 g dm−3 NaOH, 45 g dm−3 Na3PO4·12H2O, 4 g dm−3 Na2SiO3 and 3 g dm−3 nonylphenol ethoxylate (NPE9, , n = 9), in which aluminum panels were immersed during 1 min at 70°C, then rinsed with distilled water, and air-dried.
Substrate pretreatment by VTES films
Vinyltriethoxysilane (VTES) was supplied by Gelest, Inc. The molecular structure of VTES is shown in Fig. 1.
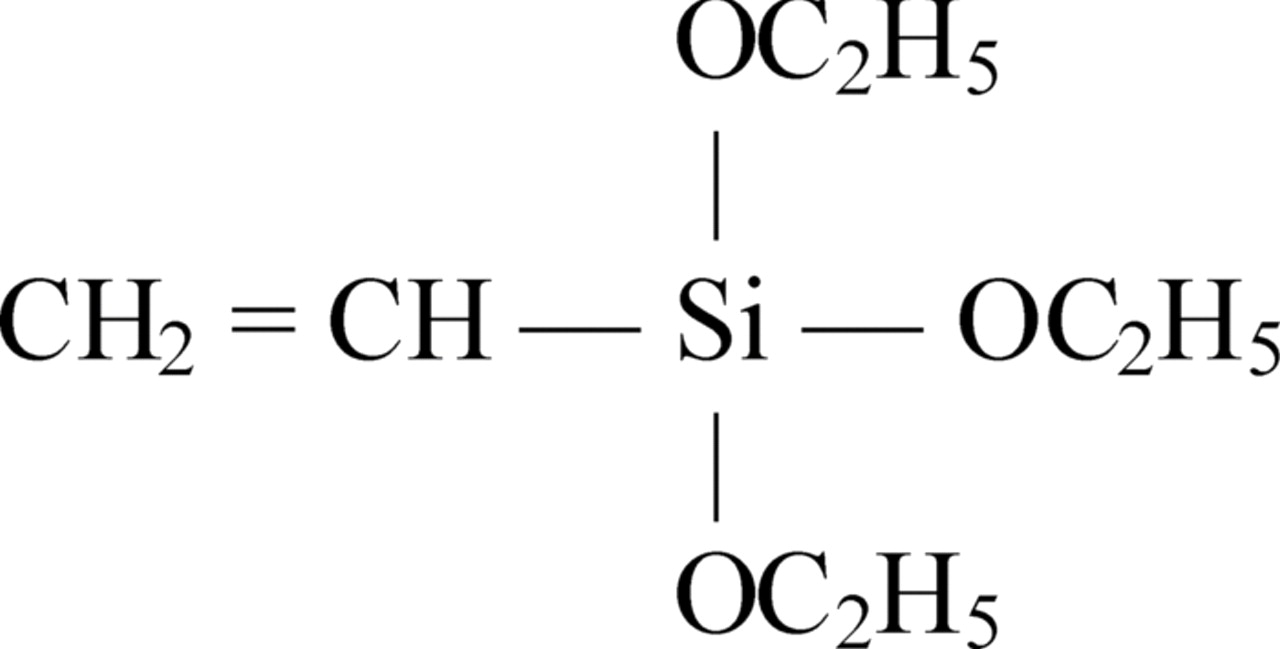
Figure 1. Molecular structure of the vinyltriethoxysilane (VTES).
The 2 and 5 vol.% vinyltriethoxysilane solutions were prepared at room temperature by dissolving the silane in a mixture of ethanol and distilled water in ratios: 91.5/6.5/2 v/v and 90/5/5 v/v ethanol/water/silane, respectively, stirring for 1 h and aging for at least 48 h.
VTES films were deposited on a freshly prepared aluminum panels, by immersion in a silane solution during 10 min at room temperature. Panels were then air-dried and cured at 100°C for 10 min or 30 min. For the sake of simplicity the following denotation will be used: coating A (2% VTES solution, cured for 10 min), coating B (2% VTES solution, cured for 30 min), coating C (5% VTES solution, cured for 10 min), and coating D (5% VTES solution, cured for 30 min).
Surface analysis
X-ray photoelectron spectroscopy (XPS) was performed with a TFA Physical Electronics Inc. spectrometer using non- and monochromatized Al Kα radiation (1486.6 eV) and a hemispherical analyzer. Details are published in our previous publication.25 The XPS spectra were background subtracted, using the non-linear, iterative Shirley method.26,27 The fitting procedure allowed signals to be evaluated by determining the peak position, height, width and Gaussian/Lorentzian ratio.28 For fixed border conditions, during deconvolution procedure all peak parameters except height were kept constant, i.e. within defined limits. Limits of binding energy, width and shape of individual component peaks are given previously.25 During the analysis a small shift was observed which was compensated by neutralizer. The values of binding energies were then aligned to carbon peak C 1s at 285.0 eV. The XPS measurements were repeated at several spots at the surface of the samples and the results were similar. Representative measurements are reported in the manuscript.
Surface morphology
A scanning electron microscope (SEM) Joel JSM-5800 and an energy dispersive spectrometer (EDS) Oxford Link ISIS 300 were used to analyze the morphology and chemical composition of the as-deposited coatings. A field emission scanning electron microscope (FE-SEM) Ultra+ (Carl Zeiss) equipped with energy dispersive spectrometer X-Max 50 (Oxford Instruments) were used to analyze the morphology and chemical composition of the coatings tested in salt spray chamber.
Electrochemical impedance spectroscopy (EIS)
Electrochemical impedance spectroscopy measurements of the VTES films on aluminum and of bare aluminum were recorded in the three-electrode cell arrangement, during the exposure to 0.03% NaCl solution. A coated sample or pure substrate, with a tested area of 1 cm2, was used as a working electrode, the counter electrode was a platinum mesh and the reference electrode a SCE. EIS data were obtained at the open-circuit potential using a Reference 600 potentiostat/galvanostat/ZRA (Gamry Instriments), over a frequency range of 300 kHz to 10 mHz using 5 mV amplitude of sinusoidal voltage. For EIS experiments, the measurements were repeated at least twice and then the representative measurement was chosen as an "average measurement". The curve and quantitative data of this measurement are then reported in the manuscript.
Testing in salt spray chamber
Testing of the corrosion resistance was performed in a salt spray chamber of the capacity 0.17 m3 (ASCOTT, Staffs, Great Britain). Testing was carried out according to International Standard Organization (ISO) standard 9227-2006 »Corrosion tests in artificial atmosphere«. The concentration of sodium chloride solution was 50 g/L (5 ± 1%). pH of the NaCl solution was set between 6.0 and 6.5 in order to obtain the pH between 6.5 and 7.2 after heating the solution to 35°C. The pH value was adjusted with 0.1 M NaOH or HCl solutions. A Thermo Scientific Orion 2 STAR pH meter and an Orion 9157 BNMD electrode were used for the measurements of pH. All the chemicals were of p.a. quality and supplied by AppliChem (Darmstadt, Germany).
The device for spraying the salt solution comprised a supply of clean air, of controlled pressure and humidity, a reservoir to contain the solution to be sprayed and one atomizer. The compressed air supplied to the atomizer passed through a filter to remove all traces of oil or solid matter. The temperature of the hot water in the saturation tower was 46°C and the overpressure was 85 kPa. The temperature in the salt spray chamber was set to 35°C ± 2°C. Test lasted for 144 hours (6 days).
The samples were taken from the chamber every 24 hours and photographed in order to follow the progress of corrosion with time. Micrographs were taken by a BX 51 Olympus optical microscope. Micrographs were then analyzed using Image Pro Plus program (version 4), which enabled the determination of the percentage of the corroded area of VTES coated aluminum after 6 days in salt chamber.
Results and Discussion
Surface analysis
XPS survey spectra were recorded at the surface of the coatings deposited on aluminum from 2% and 5% VTES solution and cured for 10 and 30 minutes (coatings A, B, C and D). From these spectra the chemical composition is deduced (Table I). After deposition the coatings contained mainly carbon and oxygen, as well as silicon and small content of aluminum. The latter is detected only for coatings A and B. For the VTES concentration of 2%, carbon content slightly decreased, while the contents of oxygen and silicon remained practically unchanged with increasing curing time from 10 to 30 minutes. For the 5% concentration, both carbon and silicon substantially increased with increasing curing time, whilst oxygen content decreased.
Table I. Composition of the VTES films deposited from 2 and 5 vol.% solutions as a function of time of curing at 100°C.
| Composition / at.% | ||||||
|---|---|---|---|---|---|---|
| Notation | cVTES/vol.% | tcuring/min | carbon | oxygen | silicon | aluminum |
| A | 2 | 10 | 50.3 | 32.5 | 16.2 | 1.0 |
| B | 2 | 30 | 48.6 | 32.9 | 16.3 | 2.2 |
| C | 5 | 10 | 45.1 | 34.0 | 20.9 | – |
| D | 5 | 30 | 57.3 | 26.7 | 25.9 | – |
High-resolution spectra of individual elements recorded using monochromatized light are the basis for the study of chemical environment of a particular element. Deconvolution of experimental XPS spectra was performed using components peaks chosen to reflect chemical composition of the silane layer and possible mechanism of bonding with aluminum substrate. The proposed mechanism of adsorption of partly hydrolyzed silane on a clean metal29–32 is taken as a basis on which the description of the XPS component peaks is carried out. In Fig. 2 this model is schematically depicted, together with denotation of particular XPS component peaks which are added to easily follow their description in the text. Proposed component peaks are listed in Table II. When the metal is dipped into dilute silane solution, silanol groups are adsorbed instantaneously on the metal surface through hydrogen bond.29 Upon drying or curing, the SiOH group and MeOH groups further condense to form metallo-siloxane (Me−O−Si). Excess of silanol groups adsorbed on the metal surface condense among themselves to form siloxane (Si−O−Si) bonding and contribute to the formation of an −Si−O−Si− network.29–32 During coating preparation, ethoxy group from the VTES molecule is hydrolyzed, and oxygen thus formed is included in the bonding between aluminum surface and silanol group (Si−OH) to form (Si−O−Al) bonding.30 Vinyl group of the VTES, on the other hand, is polymerized to form (−CH2CH2−)n,20,33 which is bonded to silicon to form a condensed network. Reaction of polymerization of vinyl-silanes occurs at elevated temperatures (above 100°C), at lower temperatures with the photo-activation, or due to photo-induced free radicals.20
Table II. Component peaks and their parameters (binding energy, Eb, and full width at half maximum, FWHM) used for deconvolution of experimental XPS spectra. Bonds are denoted in model depicted in Fig. 2.
| Element | Denotedionon | Eb/eV | FWHM/eV V | |
|---|---|---|---|---|
| Carbon, C 1s | ||||
| –C–C–, –C–H– | C1 | 284.8–285.0 | 1.1–1.2 | |
| –C–C–, –C–H– | C2 | 285.5–285.8 | 0.9–1.1 | |
| –C–Si–, –C–O– | C3 | 286.5–286.6 | 1.2–1.3 | |
| –C–Si– | C4 | 287.6–288.0 | 1.6–1.7 | |
| Oxygen, O 1s | ||||
| O2−/OH− | O1 | 531.8–532.0 | 1.5–1.6 | |
| Si−OH, Al−OH, Si−O−Si, (Al−O−Si) | O2 | 532.6–533.0 | 1.5–1.7 | |
| Si−O−Si | O3 | 533.8–534.1 | 1.5–1.6 | |
| Silicon, Si 2p | ||||
| Si−C, Si−OH, SiO2-like | S1 | 102.6–102.7 | 1.4–1.6 | |
| Si−O−Si, Al−O−Si | S2 | 103.8–103.9 | 1.4–1.7 | |
| Si−O−Si | S3 | 104.8–105.0 | 1.5–1.6 |
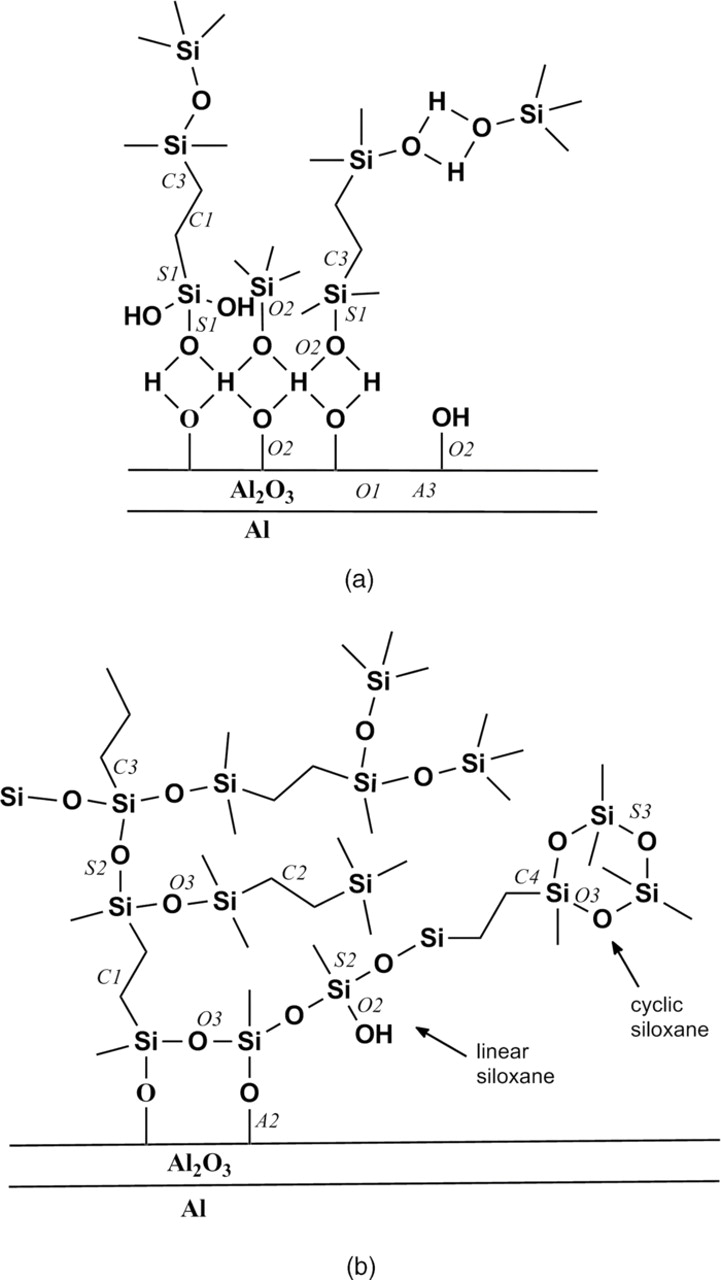
Figure 2. Model of silane film on aluminum (a) immediately after adsorption, and (b) after curing at room temperature or higher. Onto this model the denotation of particular carbon (C1, C2, C3 and C4), oxygen (O1, O2 and O3), silicon (S1, S2 and S3) and aluminum (A1, A2 and A3) peaks are superimposed to facilitate their description given in Table II. The description is chosen to reflect possible bonds in the silane layer on aluminum covered with an oxide layer.
Measured carbon spectra were deconvoluted using four component peaks: two peaks are ascribed to aliphatic carbon (–C–C–, –C–H–): peak C1 at 284.8–285.0 eV and peak C2 at 285.5–285.8 eV (C2). It was not possible to describe the carbon signal using only two or three component peaks. Physical explanation of using two peaks for aliphatic carbon is based on the fact that immediately after adsorption, or in the lower VTES concentration, cross-linking is not fully established yet (Fig. 2a). The aliphatic carbon molecules formed by polymerization of vinyl groups of the VTES are positioned perpendicularly to the metal surface, whereas the interface between metal and silane layer is comprised of silanols (Si−OH). After condensation, siloxane (Si−O−Si) and (Si−O−Al) bonds are formed leading to the covalent-bonded interface (Fig. 2b). The interior of the layer is made of linear and cyclic siloxane cross-linked by aliphatic chains formed by polymerization of vinyl molecules. In this condensed layer, aliphatic carbon chains are positioned not only perpendicularly to the metal surface but also transversely across the silane layer, i.e. they are tilted relative to the metal surface. Third and fourth carbon peaks are related to carbon bonded to silicon (–C–Si–) at 286.5 eV (C3), and at 287.6–288.0 eV (C4). Again, these peaks may be related to carbon-silicon bond positioned under different angles within the layer, i.e. linear (C3) or cyclic (C4) siloxane. We may also hypothesize that peaks C3 and C4 contain carbon bonded to oxygen due to surface contamination. Deconvoluted carbon spectra are depicted in Fig. 3. Spectra recorded for coatings A and B behave in a similar manner, and differ from those recorded for the coatings C and D. The center of carbon C 1s spectrum was located at 284.9 eV for the coatings A and B, and at somewhat higher binding energies for the coatings C and D, i.e., 285.9 eV and 285.5 eV, respectively. For the coatings A and B the main component peak was the aliphatic carbon C1 at 285.0 eV, while peaks C2 and C3 are of lower intensity. For coatings C and D the component peak C2 related to cross-linked aliphatic carbon now predominates, indicating that in more concentrated VTES solution an increased number of polymerized and cross-linked aliphatic carbon bonds are formed. Furthermore, the intensity of peaks C3 and C4 related to carbon bonded to silicon strongly increased, again related to the formation of condensed, cross-linked siloxane layer.
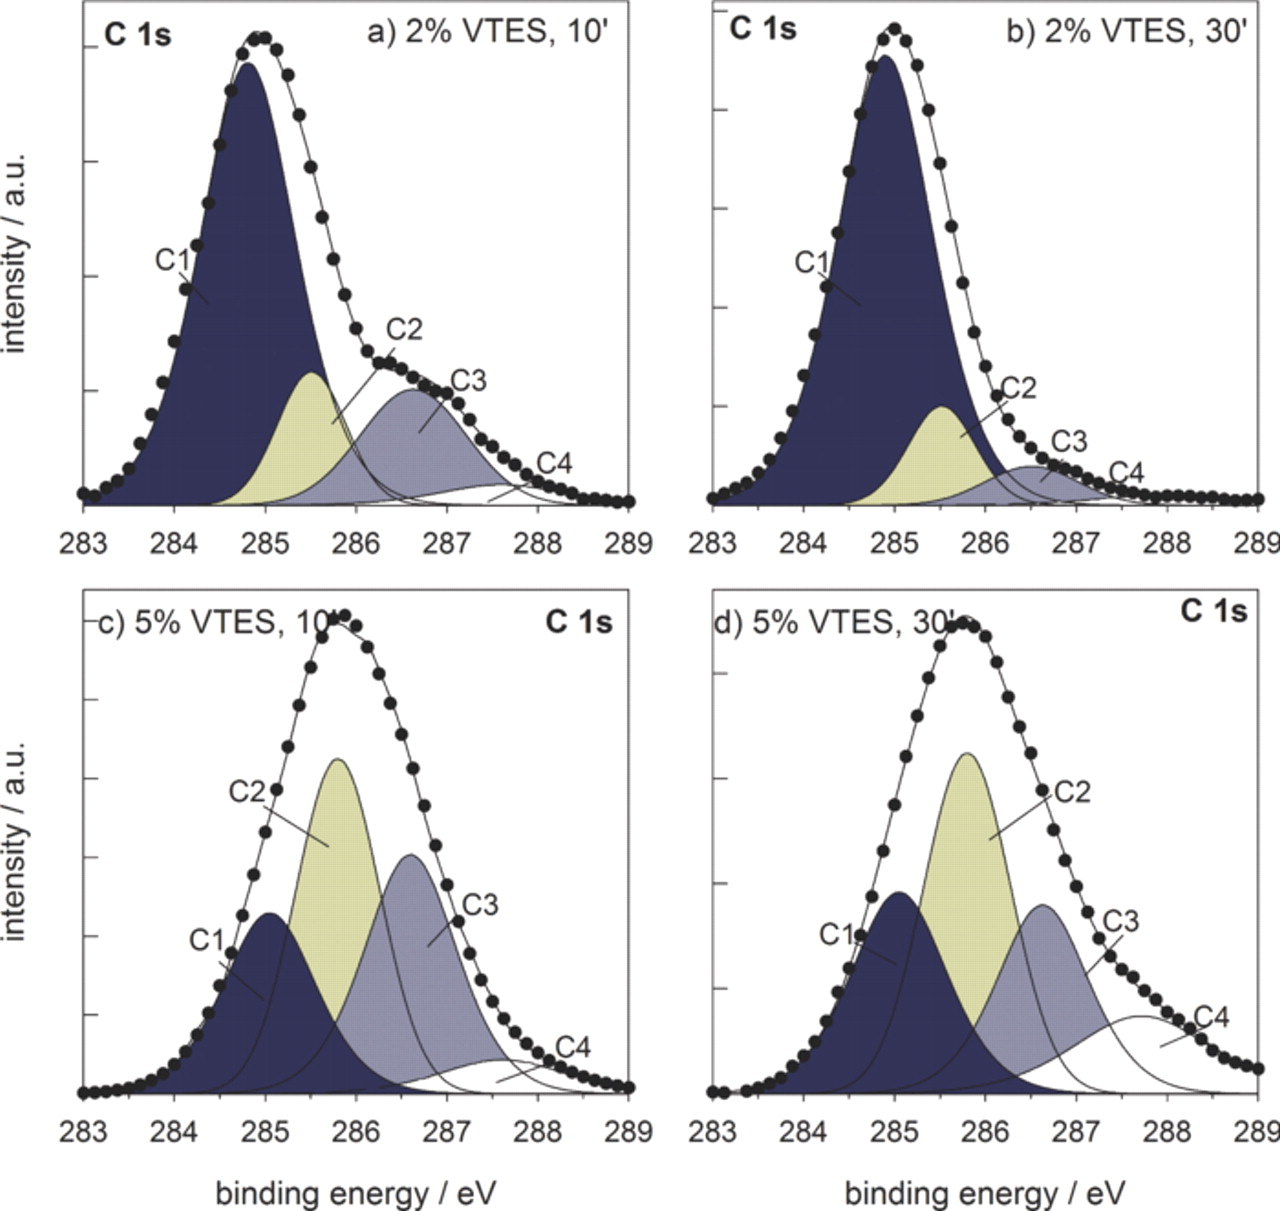
Figure 3. Deconvoluted C 1s XPS spectra recorded at the surface of VTES coatings deposited from (a,b) 2 vol.% solution and cured for (a) 10 min and (b) 30 min, and (c,d) 5 vol.% solution and cured for (c) 10 min and (d) 30 min. Measured curve (•) and fitted curve (—); the areas of the component peaks C1, C2, C3 and C4 are colored to more easily follow the changes in intensity.
The experimental XPS spectra for oxygen O 1s ionization were deconvoluted using three component peaks: oxygen bonded to oxide (O2−, mainly in Al2O3) at 531.8–532.0 eV (O1), oxygen O2 in hydroxide group (Si−OH, Al−OH−), and also to oxygen bonded to silicon (–Si–O–Si−) or SiO2-like at 532.6–533.0 eV (Table II). In contrast to the peak O2, which comprises several components, the peak O3 is related predominately to oxygen bonded to silicon (–Si–O–Si–) at 533.8–534.1 eV. The center of oxygen O 1s spectrum was located at 532.5 eV for the coatings deposited from 2 vol.% VTES solution (coatings A and B), and at somewhat higher binding energies, between 533.5 eV and 534.1 eV, for the coatings deposited from more concentrated solution (coatings C and D) (Fig. 4). Deconvolution of the spectra shows that the coatings A and B contain mainly oxygen bonded to hydroxide or silicon (O2). In coatings C and D, however, peak O1 cannot be identified since no aluminum oxide could be detected, while the intensities of peaks O2 and O3 become similar due to the increased portion of the (−Si−O−Si−) bonds comprised in peak O3. Similar to the bonding between carbon and silicon, intensive bonding between oxygen and silicon obviously requires higher VTES concentration.
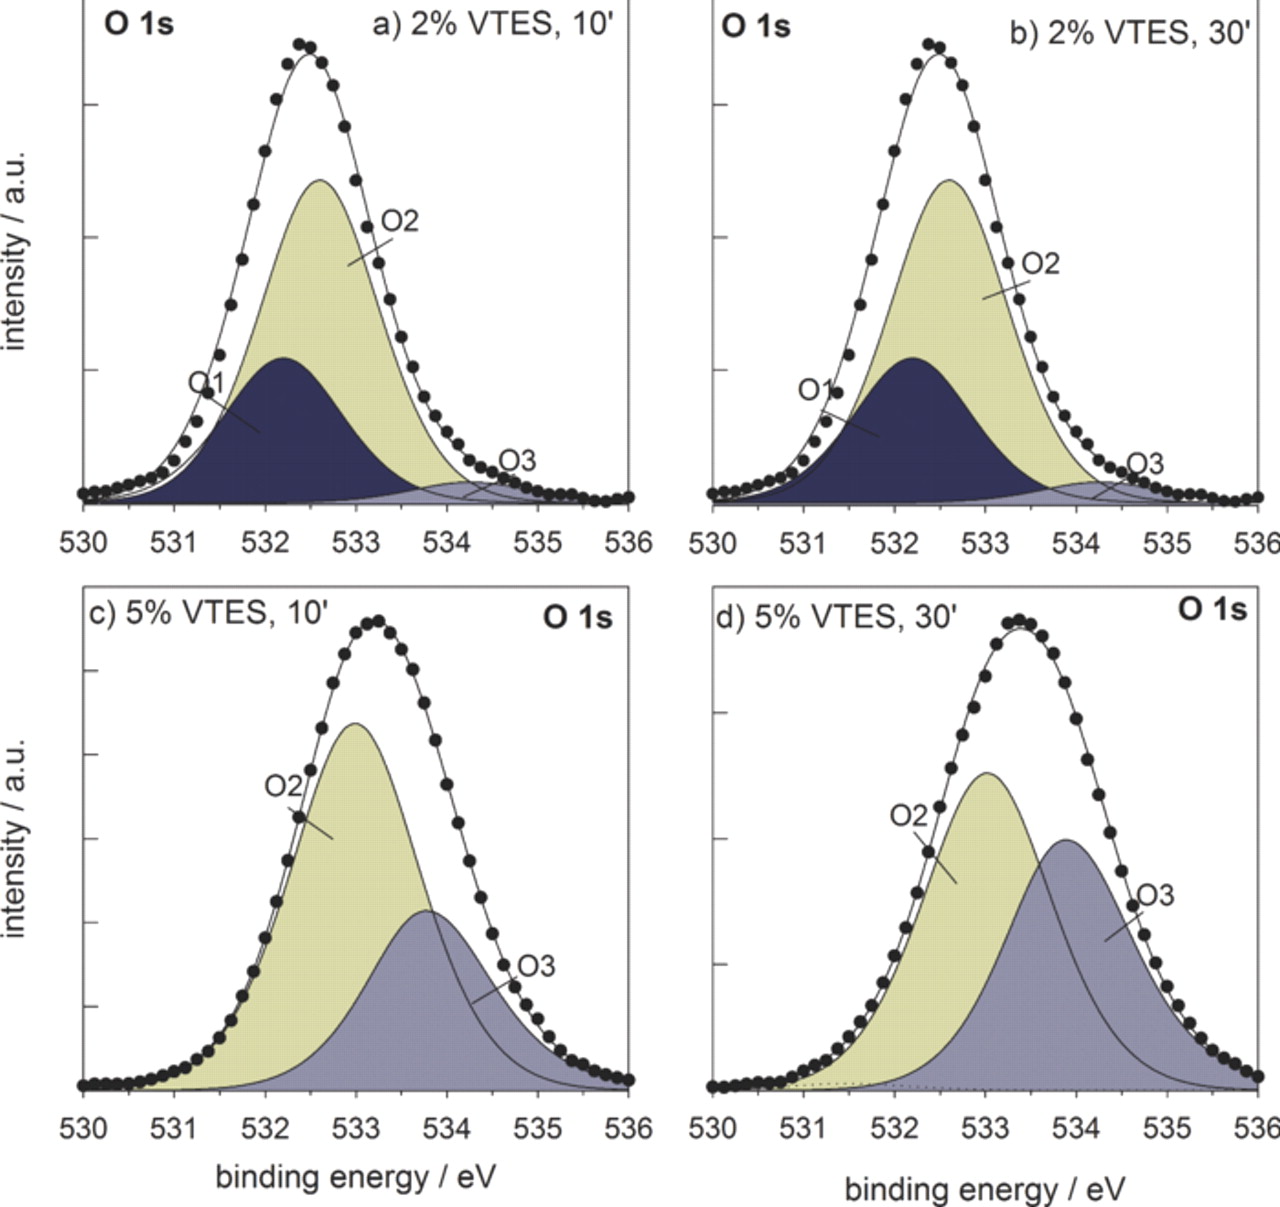
Figure 4. Deconvoluted O 1s XPS spectra recorded at the surface at the surface of VTES coatings deposited from (a,b) 2 vol.% solution and cured for (a) 10 min and (b) 30 min, and (c,d) 5 vol.% solution and cured for (c) 10 min and (d) 30 min. Measured curve (•) and fitted curve (—); the areas of the component peaks O1, O2 and O3 are colored to more easily follow the changes in intensity.
The center of silicon 2p spectra was located at 102.0 eV for the coatings A and B, and at somewhat higher binding energies, i.e., at about 104.5 eV, at higher VTES concentration (Fig. 5). Three component peaks were used to deconvolute experimental XPS spectra for Si 2p ionization: peak S1 at 102.6 eV and peak S2 at 103.8 eV are both ascribed to bonds between silicon and carbon (−Si−C−), and between silicon and oxygen, SiO2-like, or (−Si−OH−). According to literature data,25,34 the center of Si 2p3/2 peak in silane compounds ranged between 100.5 and 103.8 eV. Based on these data it is therefore not possible to differentiate between silicon bonded to silicon, and that bonded to oxygen or carbon. Peak at higher binding energy, 104.8 eV (S3) may be related to the cyclic siloxanes, as it is observed only for higher VTES concentration, similar to carbon peak C4 and oxygen peak O3. The peak S2 may include also the contribution of (Si–O–Al) bonding.25 The counterpart of this peak in the aluminum signal cannot be identified due to its low intensity (Table I). For coatings A and B the silicon signal was dominated by the component peak S1 related mainly to bonds with carbon and silicon, and a smaller peak S2 related mainly to the formation of SiO2-like and/or (Si–O–Si) bonds (Fig. 5). For coatings C and D, the intensity of the peak S2 related to the (Si–O–Si) bonds strongly increases, and peak S3 ascribed to cyclic siloxane bonding appears.
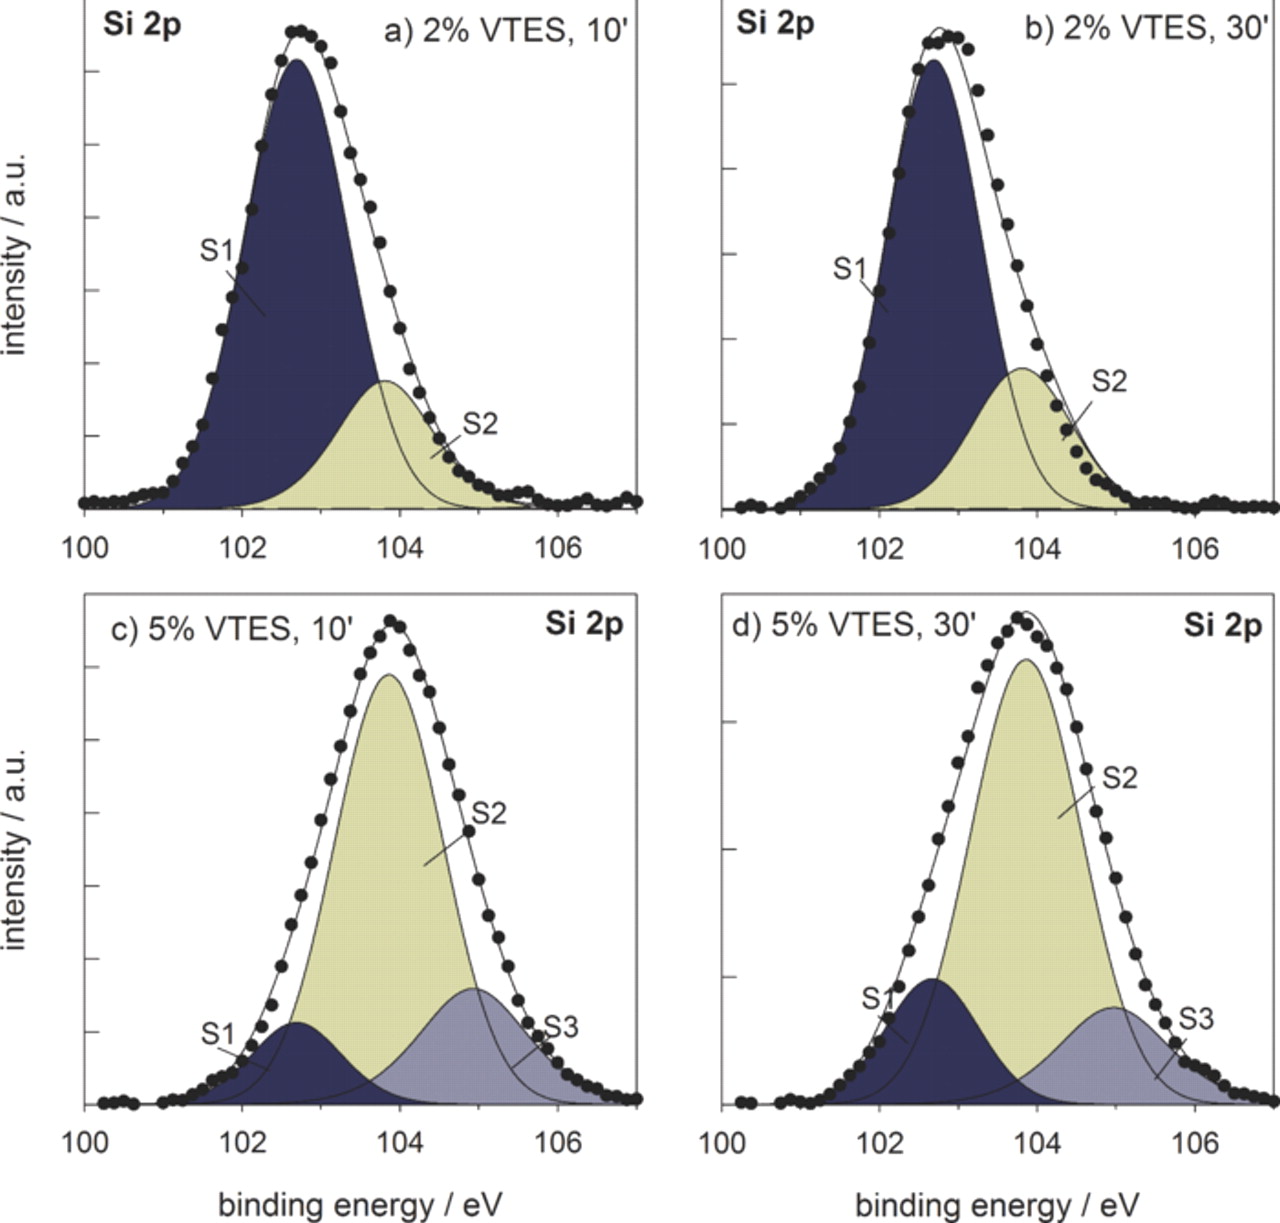
Figure 5. Deconvoluted Si 2p3/2 XPS spectra recorded at the surface at the surface of VTES coatings deposited from (a,b) 2 vol.% solution and cured for (a) 10 min and (b) 30 min, and (c,d) 5 vol.% solution and cured for (c) 10 min and (d) 30 min. Measured curve (•) and fitted curve (—); the areas of the component peaks S1, S2 and S3 are colored to more easily follow the changes in intensity.
As shown in Fig. 2 and Table I, low concentration of aluminum was detected only at the surface of the coatings deposited from 2 vol.% VTES solution (coatings A and B), where silane layer was thin and allowed the identification of underlying metal substrate. Coatings deposited from more concentrated solution were much thicker8 and aluminum signal from underlying substrate could not be detected. The intensity of aluminum signal in coatings A and B was too low to allow a reliable deconvolution using four component peaks.25 In our previous study the peaks related to (Al–O–Si) bonding were identified.25 Using XPS and TOFSIMS analyzes Gandhi et al. offered strong evidence for covalent bonding silane-metal of the type O2−Al−(O−Si−) and O−Al−(O−Si−).35 It is reasonable to assume that covalent (Al–O–Si) bonds are formed also in more concentrated solution; they cannot be identified due to larger coating thickness.
The following conclusions can be summarized regarding the composition of the coatings. At the concentration of VTES solution of 2 vol.%, the coatings contain mainly carbon peaks related to aliphatic carbon (peaks C1, C2) and carbon bonded to silicon and oxygen (peak C3), oxygen peaks related to oxide, hydrogen and silicon (peaks O1, O2), and silicon peaks related to carbon, SiO2-like and (Si−O−Si) bonds (peaks S1, S2). An increase in the VTES concentration to 5 vol.% leads to significant changes in the coating composition. Peaks related to the presence of siloxane bonds appear and/or become more pronounced: in carbon spectra the peak related to aliphatic carbon, and carbon bonded to silicon (peaks C2, C3, C4), in oxygen spectra the oxygen bonded to silicon (peak O3), and in silicon spectra a strong increase in peaks related to (Si−O−Si) bonding (peaks S2, S3). These results confirm that the intensive formation of siloxane (Si–O–Si) bonds requires the deposition from more concentrated VTES solution. This probably includes also increased cross-linking and formation of cyclic siloxanes. Coatings deposited from less concentrated VTES solution comprise a significantly smaller amount of related siloxane phase. The obtained results show that the concentration of VTES solution is more crucial for the composition of the coating than the time of curing. Increase in curing time has little effect on the surface composition, although it leads to a significant decrease in film thickness.8
Surface morphology
Morphology of the aluminum metal and as-deposited coatings A and C are presented in SEM images in Fig. 6. Following the alkaline treatment, the surface of aluminum shows scratches and individual defects probably related to the alkaline cleaning of the surface (Fig. 6a). After immersion in 2 vol.% VTES solution the change in the surface morphology is evident. It is dominated by black spots on grayish substrate (Fig. 6b). EDS analysis (spectrum not shown) confirms that the surface, as well as black spots contain Si, O and C. We assume that these spots at the surface are related to the preferential deposition of silicon-based coating at some defects at the native aluminum surface, i.e., that the coating is first formed at these spots. As the concentration of the VTES solution increases to 5 vol.%, these black spots are not visible any more (Fig. 6c), which is primarily related to the increase in the coating thickness at this concentration.8 We may therefore conclude that the deposition of silicon-based coating starts preferentially at some defects at the surface. These defects are filled with silicon-based coating and are visible as black spots since the coating is not thick enough to cover them (its thickness is about 30 nm as determined by Auger electron spectroscopy depth profiles).8 As the coating thickness increases to 280 nm, when deposited from 5 vol.% VTES,8 these black spots become covered by a thick coating.
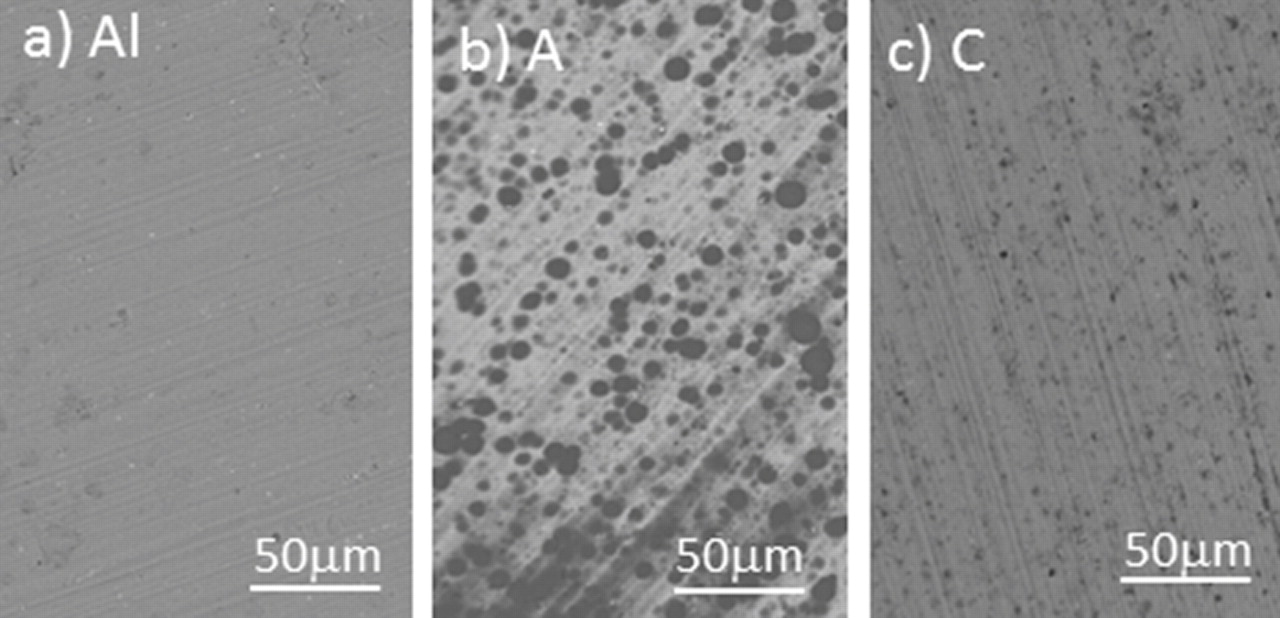
Figure 6. SEM images recorded at the surface of (a) alkaline-treated aluminum substrate, (b) coating A (2% VTES solution, 10 min curing at 100°C), and (c) coating C (5% VTES solution, 10 min curing at 100°C). Images were recorded in COMPO mode at magnification 200×.
Electrochemical impedance spectroscopy (EIS)
The electrochemical properties of vinyltriethoxysilane coated aluminum were obtained using the electrochemical impedance spectroscopy. The Bode plots for the impedance of bare aluminum and different VTES films on aluminum after 6 h and 6 days of exposure to 0.03% NaCl solution are depicted in Figs. 7 and 8, respectively. This mild corrosion agent was chosen in order to establish the influence of the type of VTES film on aluminum on the corrosion behavior of the system more accurately.
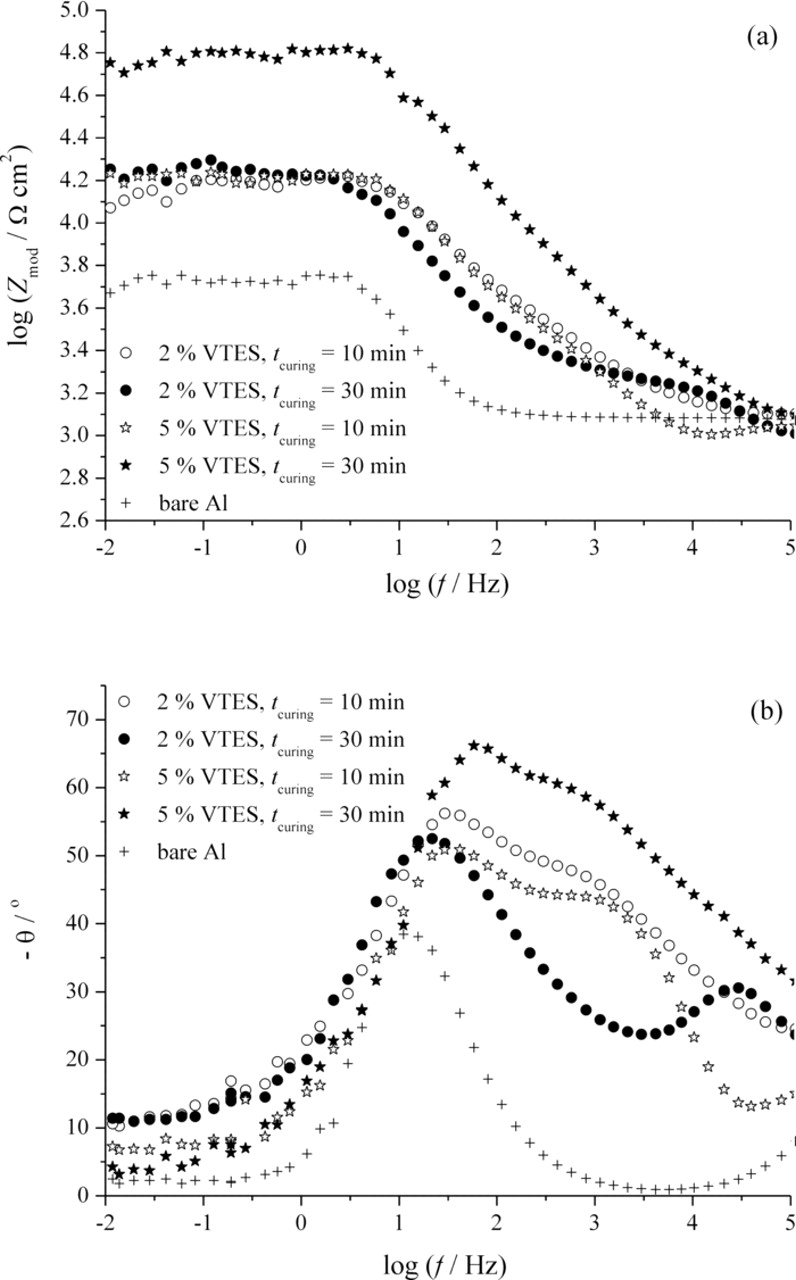
Figure 7. Bode plots for VTES films on aluminum deposited from 2 and 5 vol.% solutions and cured for 10 and 30 min after 6 h of exposure to 0.03% NaCl.
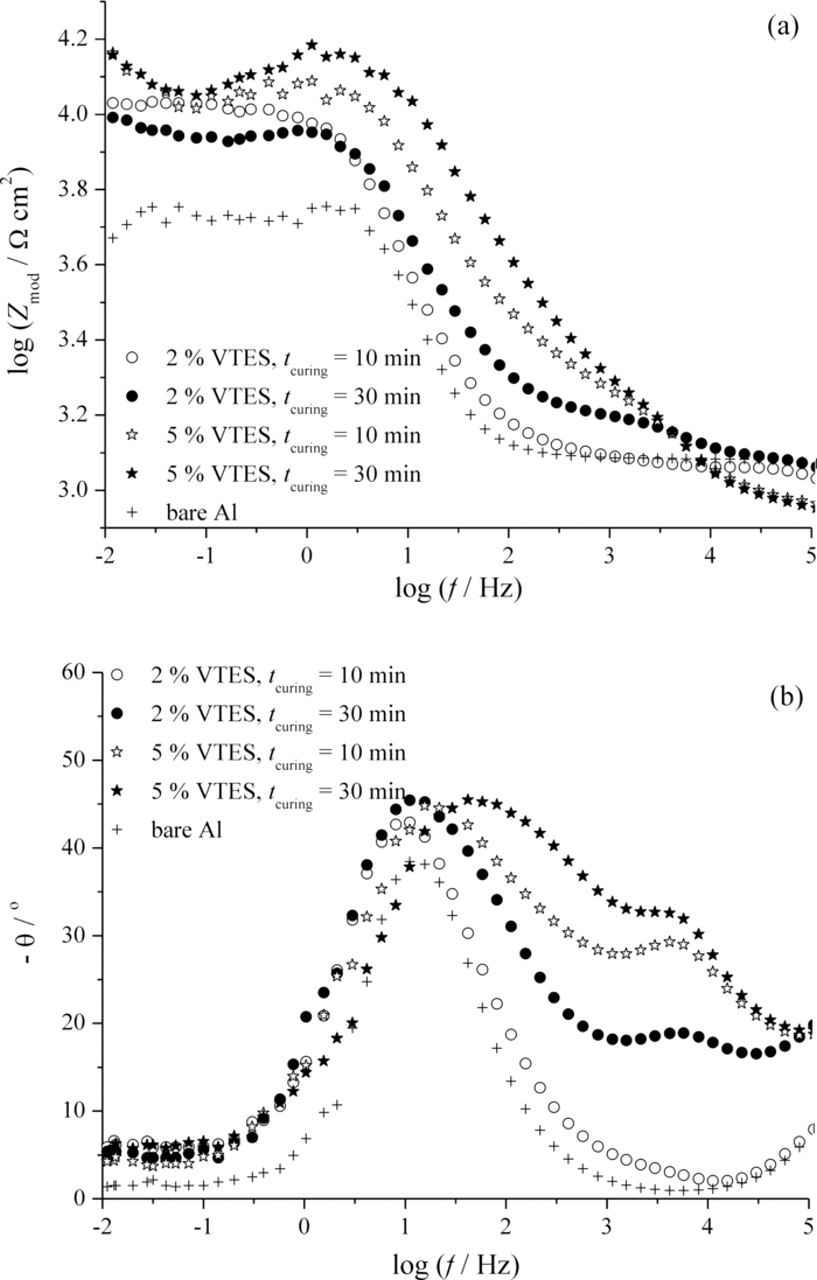
Figure 8. Bode plots for VTES films on aluminum deposited from 2 and 5 vol.% solutions and cured for 10 and 30 min after 6 days of exposure to 0.03% NaCl.
Regardless the deposition parameters, all VTES films exhibited higher values of the resistance as compared to the pure aluminum (Fig. 7). The highest resistance is observed for VTES film deposited from 5 vol.% VTES solution and cured for 30 min. For the short times of exposure to the NaCl, all samples show two time constants, the one at higher frequencies referring to the silane film itself, while the one at intermediate frequencies corresponds to the oxide layer at the aluminum surface (Fig. 7b). Small differences between the resistance values for all samples except the one deposited from 5 vol.% solution and cured for 30 min are noticeable in Fig. 8.
The influence of the VTES solution concentration and of the curing time is more pronounced after longer exposure to the corrosion agent (Fig. 8).
After 6 days of the exposure to 0.03% NaCl solution, the differences in the resistance values between VTES film deposited from 2 and 5 vol.% solutions are greater than before, indicating the higher corrosion stability of VTES films deposited from more concentrated solution. These samples still show two time constants, as well as the sample deposited from 2% VTES solution and cured for 30 min, in contrast to the one deposited from 2 vol.% VTES solution and cured for 10 min, where one time constant at intermediate frequencies and only small shoulder at high frequencies can be observed (best seen at the change of the phase angle, Fig. 8b).36 However, after 7 days, both samples deposited from 2 vol.% VTES solution exhibited only one time constant at intermediate frequencies (data not shown). This suggests that silane films of VTES samples from 5 vol.% solution existed at longer time of exposure to NaCl, confirming the better corrosion protection of these VTES films. Small, but important differences between samples deposited from the same VTES solution, but cured for different times, indicated that longer curing time resulted in more stable films, with respect to corrosion, probably due to better crosslinking and lower porosity of the films obtained by longer curing time.8
The fitting of experimental data was accomplished using the appropriate equivalent electrical circuits (Fig. 9) and Gamry Instruments Echem Analyst fitting program, version 5.50. The two-time-constants equivalent circuit shown in Fig. 9a, where RΩ is the electrolyte resistance, Rsil the silane pore resistance and Rox the oxide layer resistance, while CPEsil and CPEox are constant phase elements related to the silane film capacitance and oxide layer capacitance, respectively, was used for fitting the impedance plots of all VTES films for shorter time of exposure to NaCl. After longer exposure to NaCl (6 or 7 days, depending on the curing time), VTES films deposited from 2 vol.% solution were fitted with the equivalent circuit that consisted of the electrolyte resistance, RΩ, the oxide layer resistance, Rox, and the constant phase element, CPEox, which is related to the oxide layer capacitance, Cox (Fig. 9b), while VTES films deposited from 5 vol.% solution were still fitted with the two-time-constants equivalent circuit, indicating the presence of the silane film.
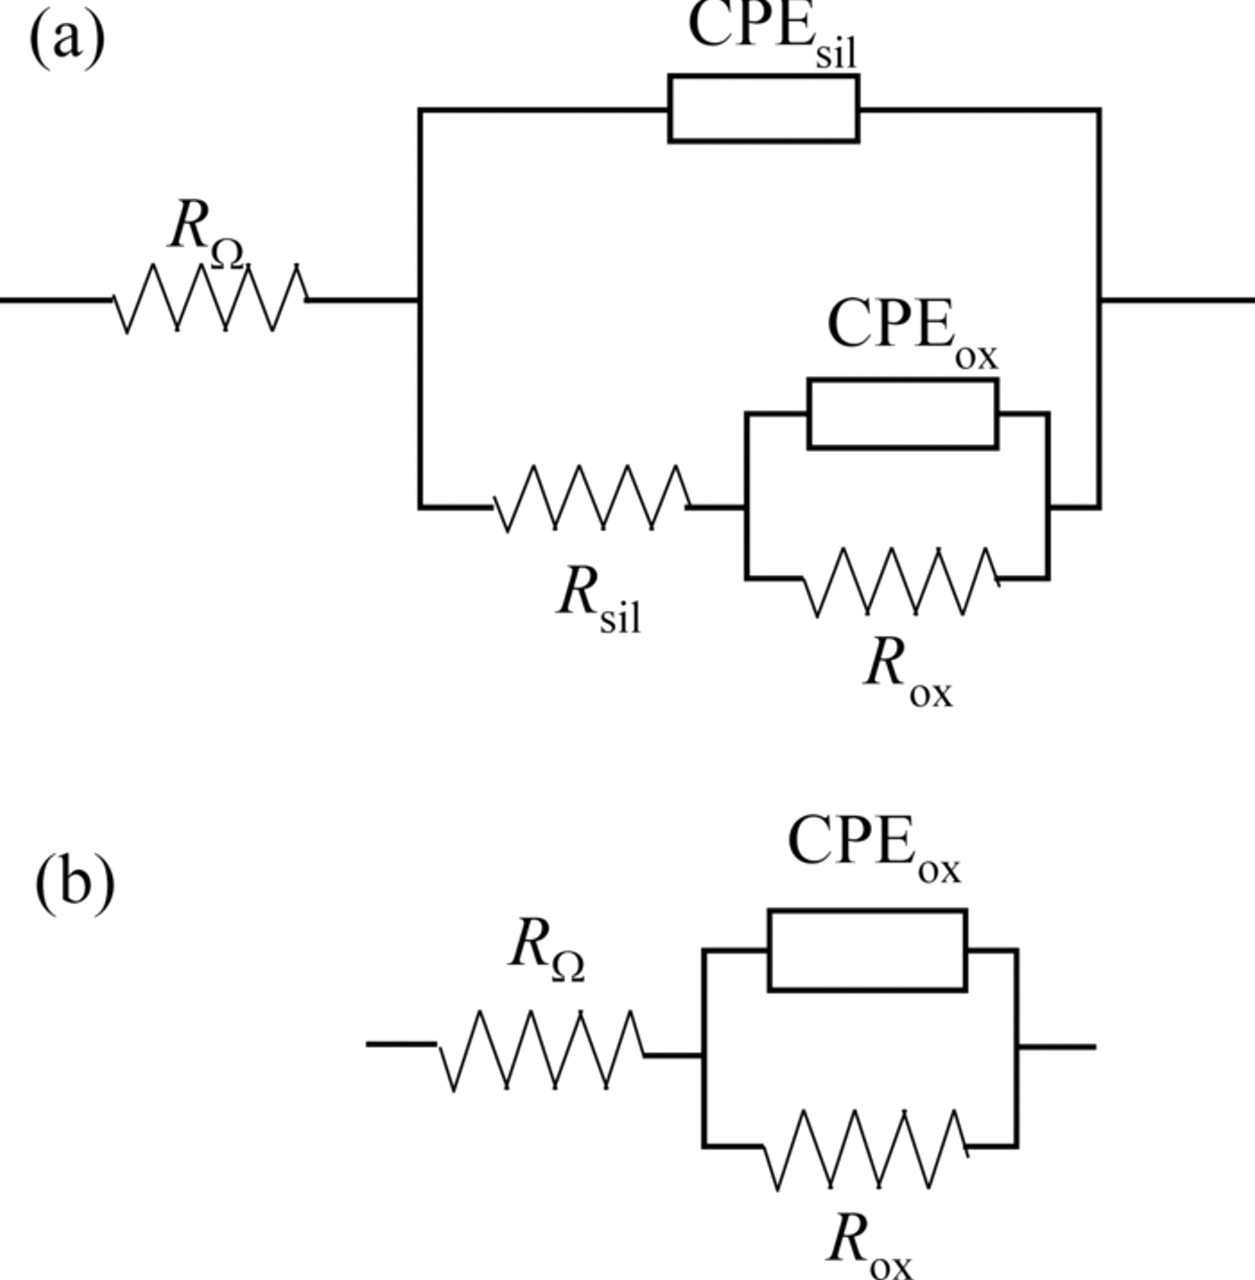
Figure 9. Equivalent electrical circuits used for the impedance plots fitting of the VTES films on aluminum for different immersion times in 0.03% NaCl.
By fitting of experimental data in complex plane, the values of silane film resistance, Rsil, silane film capacitance, Csil, and oxide layer resistance, Rox, were determined, and plotted as a function of time (Fig. 10). Silane film capacitance, Csil, was calculated using the proposed method from the literature.37 Fig. 10a represents the decrease in silane film resistance, influenced by the exposure of VTES films to 0.03% NaCl, denoting the penetration of water molecules, oxygen and ions through the porous silane film. Continuously higher values of Rsil were observed for VTES film deposited from 5 vol.% solution and cured for 30 min, while the lowest values of Rsil exhibited VTES film deposited from 2 vol.% solution and cured for 10 min, suggesting better corrosion stability, due to better crosslinking, and consequently lower porosity. This phenomenon is supported by the increase in silane film capacitance, more pronounced for VTES films deposited from less concentrated solution (Fig. 10b).
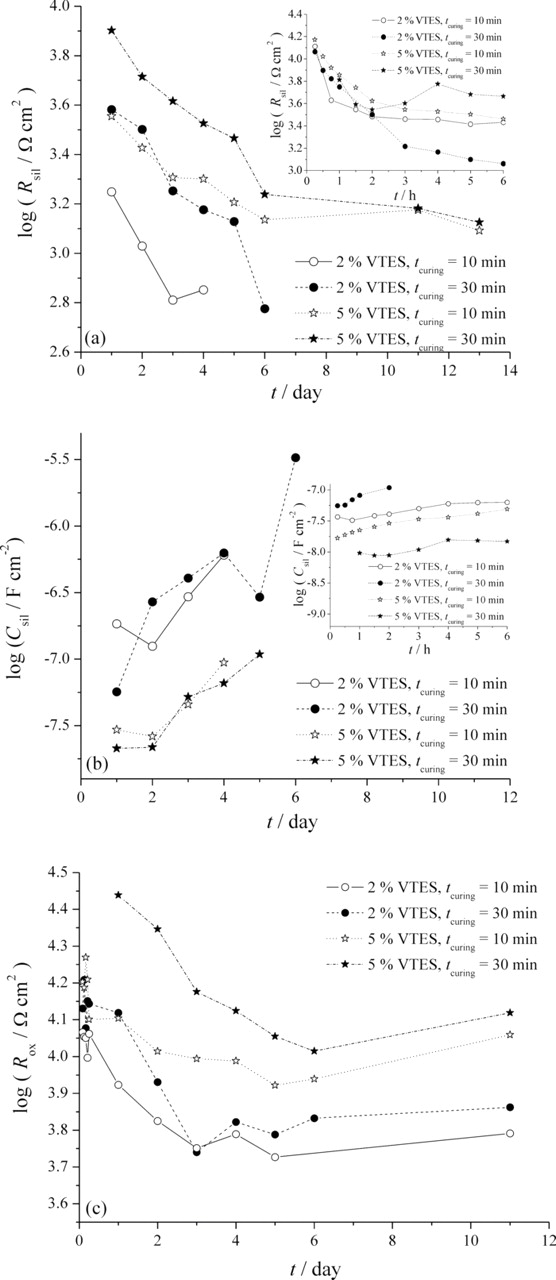
Figure 10. Time dependences of (a) silane film resistance, Rsil, (b) silane film capacitance, Csil, and (c) oxide layer resistance, Rox, for VTES films deposited from 2 and 5 vol.% solutions and cured for 10 and 30 min, during exposure to 0.03% NaCl.
Fig. 10c shows the decrease in oxide layer resistance, Rox, denoting the increase in the metal area in contact with the electrolyte.38 As it can be seen from Figs. 7a and 8a, the value of oxide layer resistance, Rox, for bare aluminum is relatively constant for both 6 h and 6 days of exposure to 0.03% NaCl, and it is between 4500 and 4600 Ω, corresponding to the logarithmic value of ∼3.7, which is lower than Rox for other samples examined (Fig. 10c). This points that all VTES films exhibited adequate corrosion stability and protection of bare aluminum in mild 0.03% NaCl solution. The higher values of oxide layer resistance were obtained for VTES films deposited from 5 vol.% solution than for films deposited from less concentrated solution. The greater Rsil and Rox values for VTES films deposited from 5 vol.% solution can be explained by the greater number of (Si–O–Si), as well as (Si–O–Al) bonds that resulted in better crosslinking of VTES film, thus slowing down the ingress of electrolyte. This, in turn, results with a smaller disbonding of silane film from aluminum, especially pronounced for coating D, i.e. VTES film deposited from 5 vol.% solution and cured for 30 min. This can also be related to the increased thickness of VTES films when deposited from more concentration solution.8 The influence of curing time is more pronounced for films deposited from 5 vol.% solution, where longer curing time resulted in better corrosion stability during exposure to 0.03% NaCl.
Salt spray chamber
All samples were analyzed by the standard salt spray chamber procedure. The samples were periodically taken from the salt spray chamber, rinsed and monitored by the optical microscope (data not shown). The different coloration in the images suggested the appearance of the corrosion products, which were then colored using the Image Pro Plus computer program. The surface covered by the corrosion products was determined for each sample. Image analysis was performed using the bitmap analysis to distinct between corroded areas and non-damaged surface of the coating. The darkest parts were considered the corrosion products and the lighter parts were considered to be non-damaged parts of the surface. Fig. 11 represents the result of bitmap analysis, giving visualization of pixels intensity in the image and the possibility to distinguish damaged from non-damaged parts of the surface.
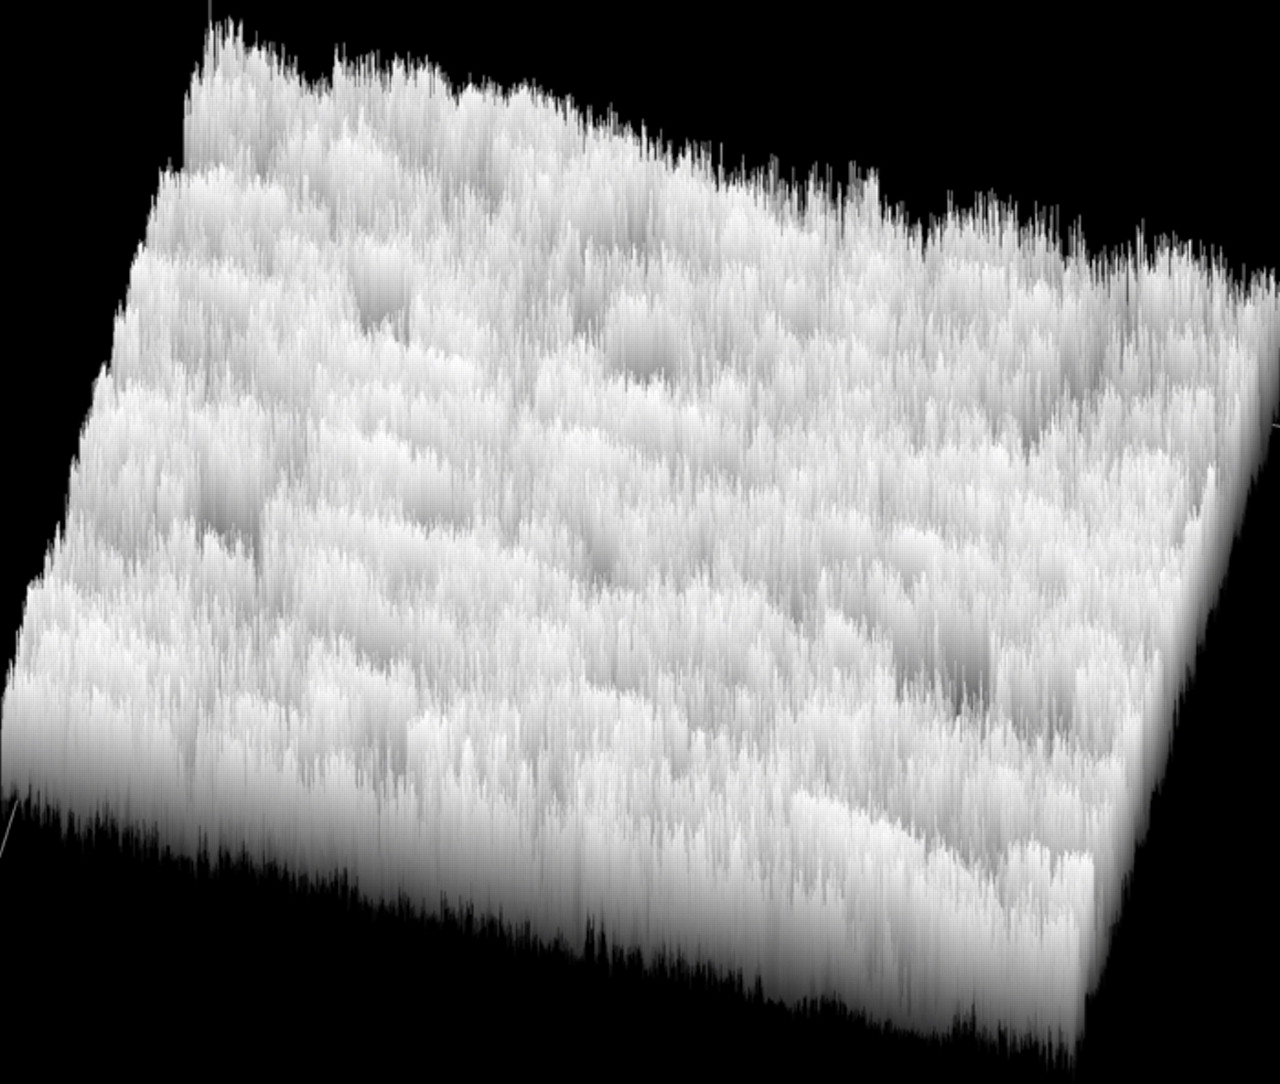
Figure 11. Image analysis of the surface: the result of bitmap analysis that gives visualization of pixels intensity in the image and the possibility to distinguish damaged from non-damaged parts of the surface; scale bar 500 μm (VTES film on aluminum deposited from 2 vol.% solution and cured for 30 min).
The percentage of the corroded area is deduced for all samples from red colored objects obtained by the image analysis (data not shown). The percentage of the corroded area for VTES films deposited from 2 and 5 vol.% and cured for 10 and 30 min after 6 days in salt spray chamber are presented in Table III.
Table III. The percentage of corroded area after 6 days in the salt spray chamber for the VTES films obtained by various experimental conditions.
| cVTES/vol.% | 2 | 5 | ||
|---|---|---|---|---|
| tcuring/min | 10 | 30 | 10 | 30 |
| Corroded area/% | 22.9 | 21.9 | 19.2 | 12.0 |
The most abundant red coloring, suggesting the highest surface percentage covered with the corrosion products, can be observed at the VTES film obtained from 2% VTES solution with the curing time of 10 min (coating A), and the least at the VTES film obtained from 5% VTES solution with the curing time of 30 min (coating D). It can be concluded that after 6 days in the salt spray chamber the VTES film obtained from 5% VTES solution with the curing time of 30 min exhibited the highest corrosion stability. Also, the influence of the VTES solution concentration and curing time was confirmed: the VTES films obtained from more concentrated VTES solution (5 vol.%) and cured for longer curing time (30 min) have shown better protective properties. These results are in the agreement with the electrochemical measurements.
To inspect the changes induced by the testing in salt spray chamber, the surface of the coatings was analyzed by SEM/EDS analysis. An example is given for coating D (Fig. 12). SEM image shows that the surface is inhomogeneous, containing bright and dark areas, as visible in the back-scattered mode. At several spots at the surface, nano-meter sized debris is observed. EDS spectra were recorded at different spots at the surface in order to reveal the differences in composition (Table IV). At dark spots the concentration of Al and Si is similar (spectrum 1), while at the bright spots the concentration of Al is much higher than that of Si (spectrum 2). The differences in composition are obviously related to the corrosion process in salt spray chamber, where the coating partially corroded and exposed underlying Al substrate.
Table IV. Composition deduced from the EDS spectra taken at three different spots at the surface of the VTES film deposited from 5 vol.% solution and cured 30 min at 100°C.
| Composition/at.% | |||||
|---|---|---|---|---|---|
| Notation | carbon | oxygen | silicon | aluminum | chlorine |
| Spectrum 1 | 37.7 | 29.5 | 13.3 | 19.5 | – |
| Spectrum 2 | 28.8 | 13.1 | 4.6 | 53.5 | – |
| Spectrum 3 | 19.5 | 46.1 | 4.2 | 28.9 | 1.3 |
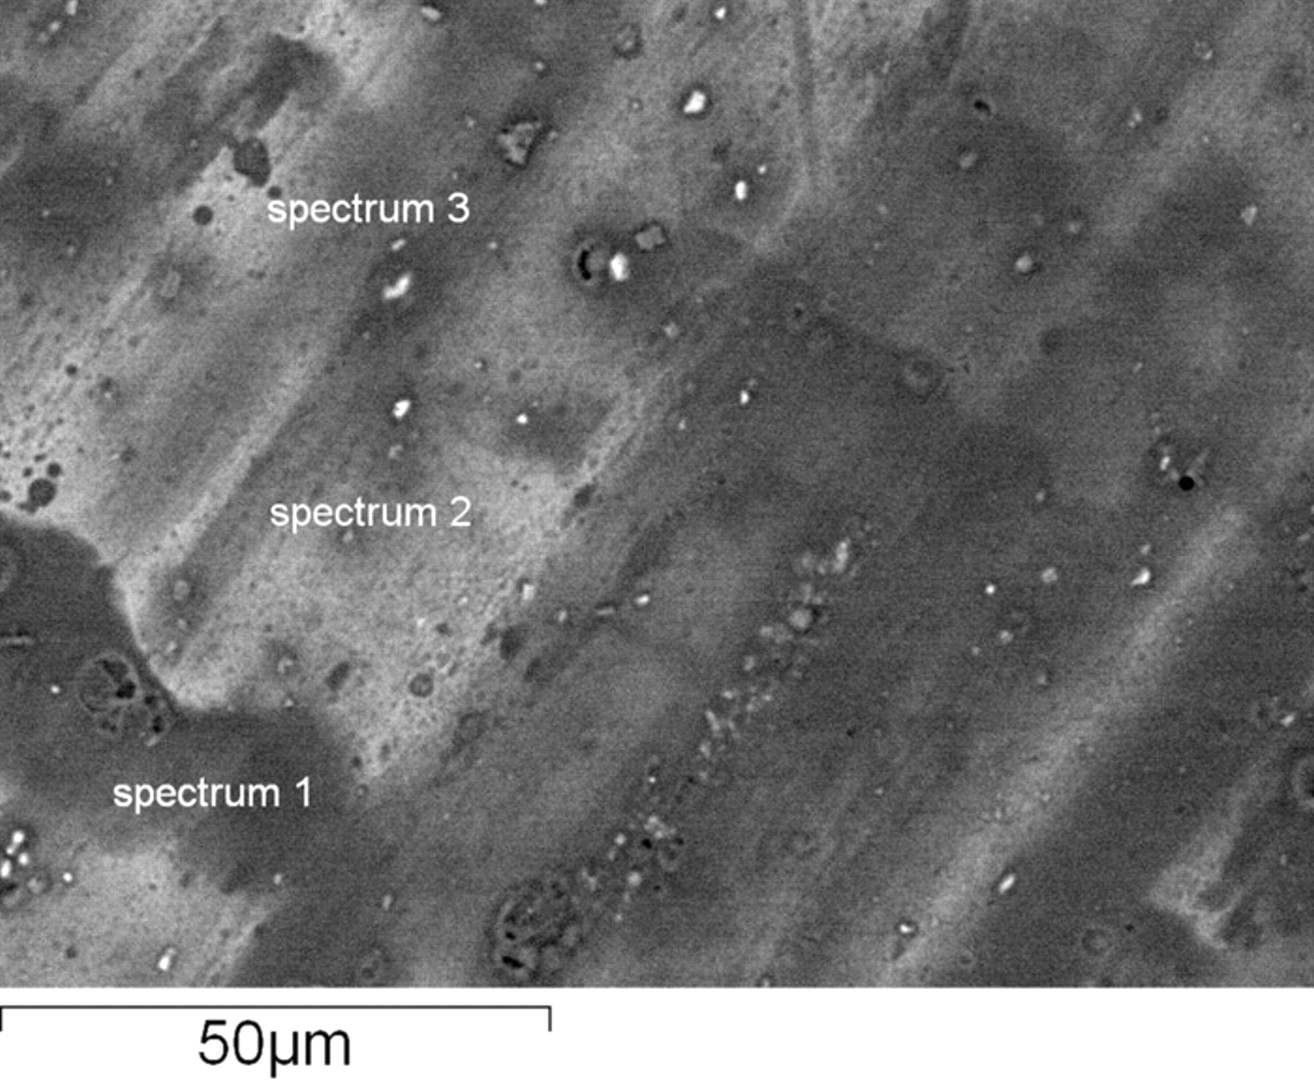
Figure 12. FE-SEM image recorded at the surface of coating D (5% VTES solution, 30 min curing at 100°C) deposited on aluminum. FE-SEM image was recorded using back-scattered mode and magnification 400×.
Conclusions
- Electrochemical properties and surface analysis of VTES films on aluminum were monitored during exposure to 0.03% NaCl and in salt spray chamber using XPS, SEM, EDS, EIS, and optical microscopy coupled with image analysis.
- XPS spectra of the deposited coatings were analyzed using components peaks chosen to reflect chemical composition of the silane layer and possible mechanism of bonding with aluminum substrate. VTES films deposited from 2 vol.% solution contain mainly silanol bonds (−Si−OH) mixed with perpendicular aliphatic carbon chains. When deposited from more concentrated VTES solution, intensive formation of siloxane bonding is observed, ascribed to both linear and cyclic siloxanes. This network cross-linked with aliphatic carbon chains formed by polymerization of vinyl group is responsible for excellent corrosion resistance of deposited coating.
- The results of the corrosion stability investigations showed the influence of the VTES solution concentration and the curing time on the corrosion stability of the VTES films: the best corrosion stability exhibited VTES film deposited from 5 vol.% solution and cured for 30 min.
- The concentration of VTES solution seems to be more crucial for the effectiveness of the coating than the time of curing, affecting the composition, morphology and corrosion stability.
Acknowledgments
The authors acknowledge the valuable technical help by Barbara Kapun, B.Sc., in salt spray testing. The authors thank Dr Jernej Iskra for drawing the model of silane film on aluminum, Dr. Janez Kovač for valuable comments in XPS measurements, and Goran Milošev for his help in graphical presentation. This work was performed within the bilateral collaboration between Slovenia and Serbia (project No. 10-11/008). The financial support by the Slovene Research Agency contract No. P2-1048, and the Ministry of Education and Science, Republic of Serbia, contract No. III 45019, is greatly appreciated.