Abstract
Liquid solar fuels can be produced using a modular approach. A simplified economic analysis is used to evaluate the cost for making diesel and other fuels. In each reaction scheme, water is converted to hydrogen electrochemically, which is later converted to a liquid fuel by the Fischer-Tropsch method. Renewable energy sources, such as wind and solar, provide power to each process in its entirety. Furthermore, costs for photoelectrochemical cells, a developing hydrogen-production technology, are estimated and compared with electrolyzer costs at optimized current densities. This approach for evaluating renewable liquid fuels can be customized as new technologies develop and cost estimates evolve. One way to address the large capital costs associated with a large-scale conversion to renewable fuels is for the government to establish a guaranteed market to buy such fuels in an amount comparable to the needs of the military. This would also help the United States meet its own mandate for a 50% conversion of the fleet to nonfossil fuels by 2021.
Export citation and abstract BibTeX RIS
One problem with renewable energy is cost. It is difficult to compete economically with presently available fossil fuels. However, the cost of renewable energy is gradually coming down, and the price of fossil fuels is rising as demand increases (Figure 1). There are also intangibles like pollution, national security, and balance of payments that can favor a shift to renewable energy.
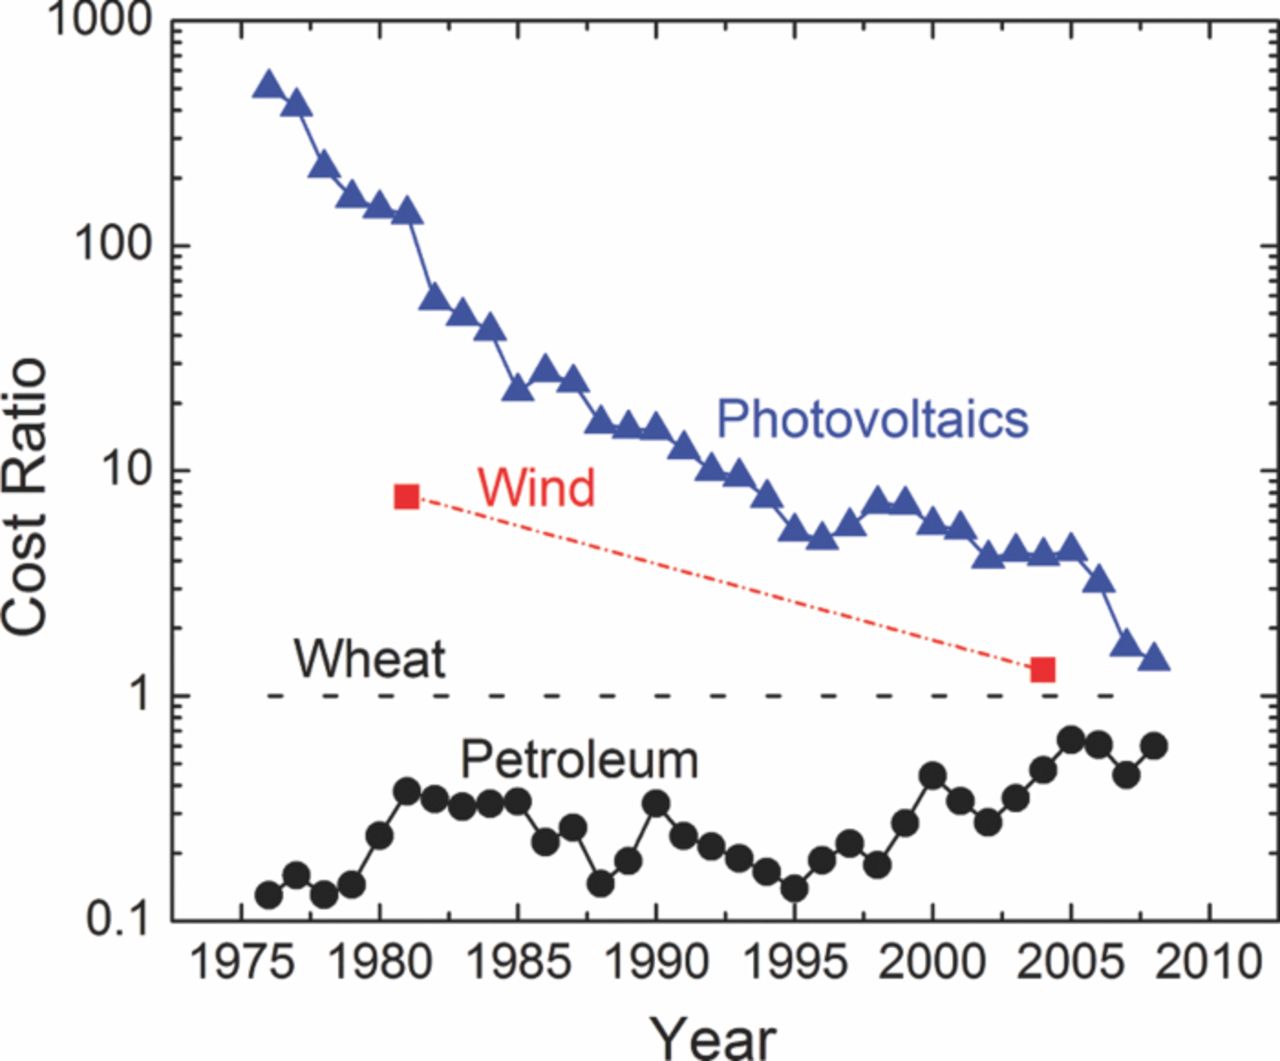
Figure 1. Decline of renewable-energy costs and rise of petroleum costs, both relative to wheat. Photovoltaic values are from Reference 1, wind values are from Reference 10, and petroleum and wheat values are from the Statistical Abstract of the United States. The photovoltaic values are for modules and do not include the installation cost. The latter decreases more slowly than the module cost.
Another problem with renewable energy is the difficulty of storing electricity or hydrogen or energy in general. Hydrogen is difficult and expensive to store, and electricity is even more so. (This will be covered more thoroughly in Table I.)
Table I. Figure of merit (ratio of storage cost to value of item stored) for storage of energy by a battery or as hydrogen or diesel fuel. Here the internal rate of return r = 0.1 y−1. The result depends principally on the cost, life, and efficiency of the process. The efficiency can be expressed alternatively in terms of the operating cost. The result also depends on the storage time, the internal rate of return, and the value of the item stored, but these are regarded as being imposed externally and separately from the choice of the method of storage.
| Energy | Capital Cost | Operating Cost | Life | Storage Time | Value | Storage | |
|---|---|---|---|---|---|---|---|
| Storage | ($/kWh) | Efficiency | ($/MWh) | (years) | (days) | ($/MWh) | Cost/Value |
| Battery | 50 | 0.85 | 0 | 5 | 1 | 53 | 0.949 |
| H2 storage | 16.54 | 1 | 3.5 | 22 | 1 | 109 | 0.079 |
| Jet fuel | 0.029 | 1 | 0 | 22 | 1 | 140 | 6.38×10⁻⁵ |
| Battery | 50 | 0.85 | 0 | 5 | 365 | 53 | 282 |
| H2 storage | 16.54 | 1 | 3.5 | 22 | 365 | 109 | 17.1 |
| Jet fuel | 0.029 | 1 | 0 | 22 | 365 | 140 | 0.023 |
The benefits of putting renewable energy in the form of liquid fuels (such as methanol, gasoline, and diesel) are that such fuels can be stored easily and that they fit smoothly into the existing infrastructure for powering airplanes, ships, and ground transportation.
Figure 2 shows one scheme for producing renewable diesel fuel based on combining separate process modules. It also provides a broad, flexible framework for producing renewable fuels because different process modules or energy sources can be substituted with substantially the same outcome. For example, the wind energy source can be replaced by solar photovoltaics (PVs), solar thermal, geothermal, hydroelectric, nuclear, and even immature technologies like photoelectrochemical cells (PECs), which also replace the electrolyzer.
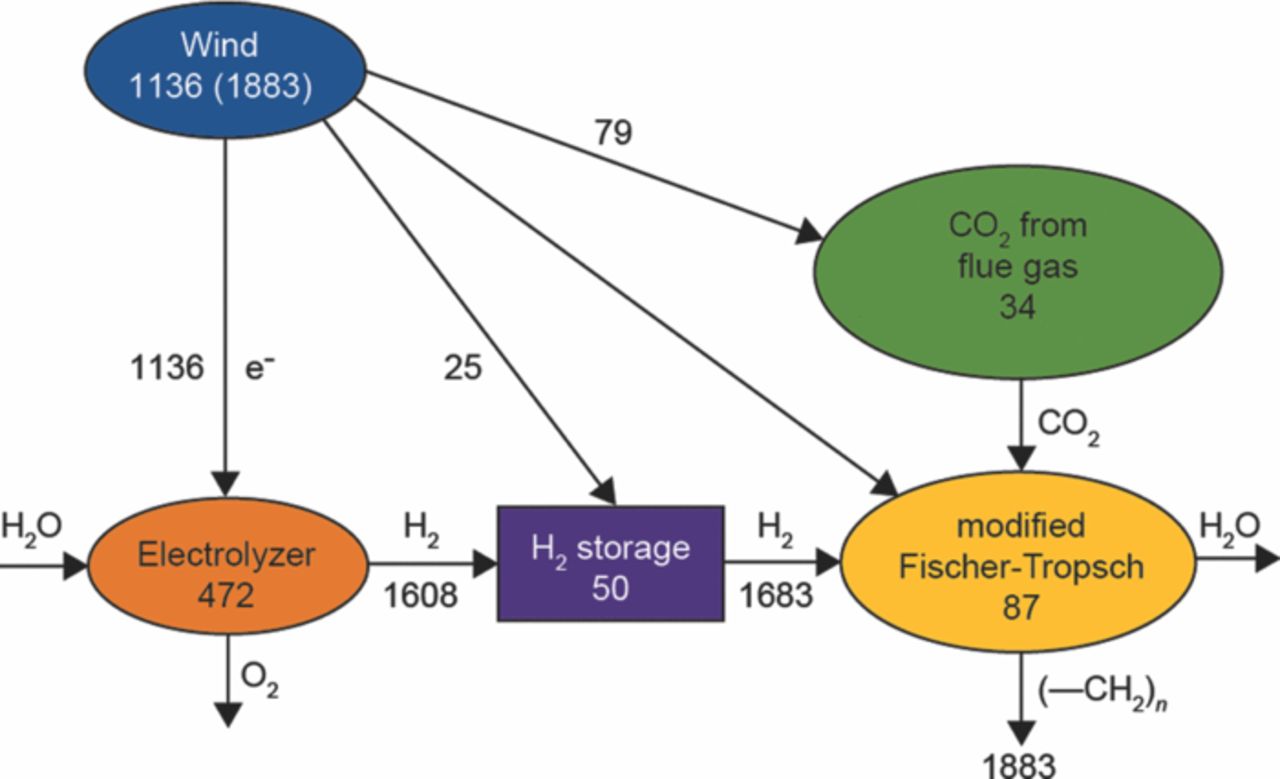
Figure 2. Value flows through the system (in $(2009)/t of diesel product). The depreciated capital cost of the individual units is shown within the symbol for that unit. Costs of streams of electrons and hydrogen are shown next to their arrows. Operating costs for the CO2 separator and the H2 storage are shown next to additional arrows. The operating cost of the modified Fischer-Tropsch plant has not yet been estimated. The wind is the source of all the value in the diagram; it needs to pay for the capital cost as well as the operating cost of the units. Thus, the size of the wind farm needs to be 1883 $/t (product), not just 1136. 1883 $/t corresponds to 5.25 $/gge (dollars per gallon of gasoline equivalent).
In Figure 2, the energy source is intermittent, because the wind does not always blow and the sun does not always shine. Consequently, a hydrogen storage unit has been added after the electrolyzer. (The hydrogen produced when the energy source is active does not need to be compressed beyond the operating pressure of the Fischer-Tropsch reactor.) Here hydrogen is compressed to a high pressure (200 bar) and stored in a tank. The capital cost of the compressor and tank and the operating cost of compression raise the cost of the hydrogen to an average value of 1683 $/t(product), a 4.7% rise over the 1608 as shown in Figure 2.
Figure 2 shows the energy source (wind) producing electricity, followed by electrolysis of water to produce hydrogen. A PEC can combine these functions into a single unit. It is necessary to make an economic comparison among alternatives to decide which is the best overall. This is true for all the many alternatives which can be visualized. Photoelectrochemical cells are immature even though they have been researched for more than 30 years. Photovoltaics have decreased in real cost by a factor of 59 between 1976 and 20081 and are continuing to improve. The life of the devices also increased from 2 to 25 y, making the reduction in the cost of energy even more dramatic on Figure 1. The preferred energy source can change over the years, as it did for wood, coal, and oil in the past.
For the next 20 to 40 years, the needed carbon dioxide can be recovered from the flue gas of power plants and cement plants, but eventually we need to recover CO2 from the air, to create a carbon-neutral energy system. The cost of separation is treated in a later section.
The final product fuel can be selected among methanol, dimethyl ether, gasoline, and diesel fuel. Flexfuel vehicles have been developed which can accommodate gasoline, methanol, or ethanol.2,3 We focus on these fuels, which fit well into the existing infrastructure, rather than exotic fuels like hydrogen, ammonia, and hydrazine, which may be in development and may become important well into the future. For large-scale use, making these into liquid fuels is preferred. The additional cost is comparable to that of making hydrogen into diesel fuel in Figure 2.
A good plan is to locate the synthetic-fuel plant near a large power plant along with the wind farm or PVs and the electrolyzer. The hydrogen would then be made locally and would not need to be transported. One synfuel plant might require the CO2 output from five power plants. Then, the CO2 would need to be piped to the central liquid-fuels plant, but piping CO2 is approximately five times cheaper than piping hydrogen. Some oil fields already have many CO2 pipelines, used for enhanced oil recovery. Thus, the need for new pipelines may be minimal.
The cost of making diesel fuel from energy, water, and CO2 is close enough to the cost of making it from natural petroleum that it is essential to begin serious production now, so that detailed process knowledge and economics will be available. Having a clear alternative will put a ceiling on the price of petroleum and may even cause the price of petroleum to fall as understanding of renewable energy processes matures. Even if the price of petroleum does drop in the future, fossil fuels will likely become a smaller fraction of the energy mix, not only for reasons of scarcity but also because pollution from fossil fuels causes damage to the economy and the ecology (e.g., by way of higher health-care costs).4–7
One implementation strategy may be for the government to guarantee a market for synthetic diesel fuel in an amount comparable to the consumption rate for the military. Such a guarantee provides a path for the U. S. military to meet its mandate to reduce its use of fossil fuels by 50% by 2021.8 The U. S. Air Force and Navy together account for more than 80% of the total consumption for jet fuel and to fuel ships. The Army uses less than 10% of the total military requirement.
For the United States, this is about 395 kBOE/day (a 1000 barrels of oil equivalent per day), which can be restated as 26.8 GW (at the lower heating value [LHV] of 46.2 MJ/kg) or as 18.3 Mt/y. Making sure that the military has a reliable source of fuel is an important step toward energy independence. The military application can support a guaranteed market even if the price exceeds at times the market price of natural petroleum. Such a guarantee is necessary in order to assure the orderly entry of large commercial suppliers (e.g., oil companies that are looking for an alternative as the supply of natural petroleum becomes compromised by scarcity and high demand). The amount (395 kBOE/day) is large enough to be significant so that the economics of production can be established, but is much smaller than the total U. S. consumption of natural petroleum (ca. 20.6 MBOE/day). The military market addresses the need for the private sector to make the large capital investments without putting the government directly into the energy business. Later, established producers will expand into the nonmilitary sector in a natural way as the economics becomes favorable, but the large activation barrier will already have been overcome.
The overall process presented in Figure 2 will work well because it is assembled from established process modules. We know how to electrolyze water and separate CO2 from air9 or flue gas10 and make methanol from synthesis gas. The Fischer-Tropsch process for making multi-carbon molecules dates back to 1924 and has been intensively developed commercially since 1955. Wind turbines have been around for centuries, and PV processes and solar thermal have been commercialized. Hence, the economics of the individual processes is reasonably well known. Of course, the economics has not been competitive to date with inexpensive oil.
There is a strong tendency for scientists to work only on processes that do not work, especially with government funding. This is because processes that do work are supposed to be developed by the commercial sector, and also because it is always desirable to have new inventions that improve the economics of other processes. These two aspects (working on improvements of old processes and on truly novel processes), conducted side by side, constitute a balanced program of research and development. This approach can also put different governments into competition to see which can provide the environment most conducive to invention and also, perhaps separately, to commercial development. (Jared Diamond11 presents a contrast in this regard between the small principalities of Europe and the much larger and conservative government of China.) A nonprotective tariff, providing a uniform levy on all imported goods, may serve to promote domestic production and a balance of trade while avoiding the distortions and government expenditures of subsidies.
The next sections analyze the cost of the process modules shown in Figure 2 from the renewable power source to the chemical reactor, compare alternative schemes, and discuss research needs for solar-fuel technologies. Quantitative economics permits alternatives to be evaluated and the operation of individual process modules to be optimized.
Economics
How much does it cost to store electricity in a battery on a one-day cycle? The cheapest option may be a car battery (50 $/kWh), even though its warranty is not meant for daily deep discharge over a five-year lifetime. The stored electricity needs to be sold at a higher price to reflect the battery cost and lifetime. For example, if electricity is purchased from the grid for 53 $/MWh, the resale price needs to approximate 103 $/MWh, just to pay for the cost of a new battery and the internal loss of energy due to ohmic drop. This is shown below as the economic analysis is developed (Table I).
With conventional economics we can borrow from the bank to buy a device. The loan principal P varies according to
![Equation ([1])](https://content.cld.iop.org/journals/1945-7111/159/10/A1722/revision1/jes_159_10_A1722eqn1.jpg)
where P is the outstanding debt, N is the net revenue stream, and r is an inflation-adjusted interest rate (which can also be called the internal rate of return). N includes any operating costs, such as labor. Profit can be built into r, or it can be incorporated into N. It is best to think in terms of inflation-proof dollars.
With N and r taken to be constant, the solution to this differential equation is
![Equation ([2])](https://content.cld.iop.org/journals/1945-7111/159/10/A1722/revision1/jes_159_10_A1722eqn2.jpg)
P0 is the original cost of the device. At t = tL, the life of the device, P must go to zero, and the loan is paid off. Hence,
![Equation ([3])](https://content.cld.iop.org/journals/1945-7111/159/10/A1722/revision1/jes_159_10_A1722eqn3.jpg)
Battery or energy-storage device
For a battery, or a generalized energy-storage application,
![Equation ([4])](https://content.cld.iop.org/journals/1945-7111/159/10/A1722/revision1/jes_159_10_A1722eqn4.jpg)
where Q is the capacity (J) and C is the unit cost ($/J). The net revenue stream is
![Equation ([5])](https://content.cld.iop.org/journals/1945-7111/159/10/A1722/revision1/jes_159_10_A1722eqn5.jpg)
where B is the price ($/J) paid for the stored energy, S is the price at which the stored energy must be sold to a customer, η is the energy efficiency (J out divided by J in), and ω is the number of (deep) cycles of the storage device per unit time. Substitution gives
![Equation ([6])](https://content.cld.iop.org/journals/1945-7111/159/10/A1722/revision1/jes_159_10_A1722eqn6.jpg)
This result tells us that, if η = 0.25, we must charge at least four times the purchase price B, even before considering how to pay off the loan. The dimensionless number ωtL times Q is the total amount of energy bought over the life of the device. Dimensionless groups are used to cancel the monetary unit ($), which is different in different countries and varies over time. The inflation-adjusted interest rate (r) appears in the last group, rtL/(1 − exp ( − rtL)). Figure 3 shows a parameterized plot of Equation 6.
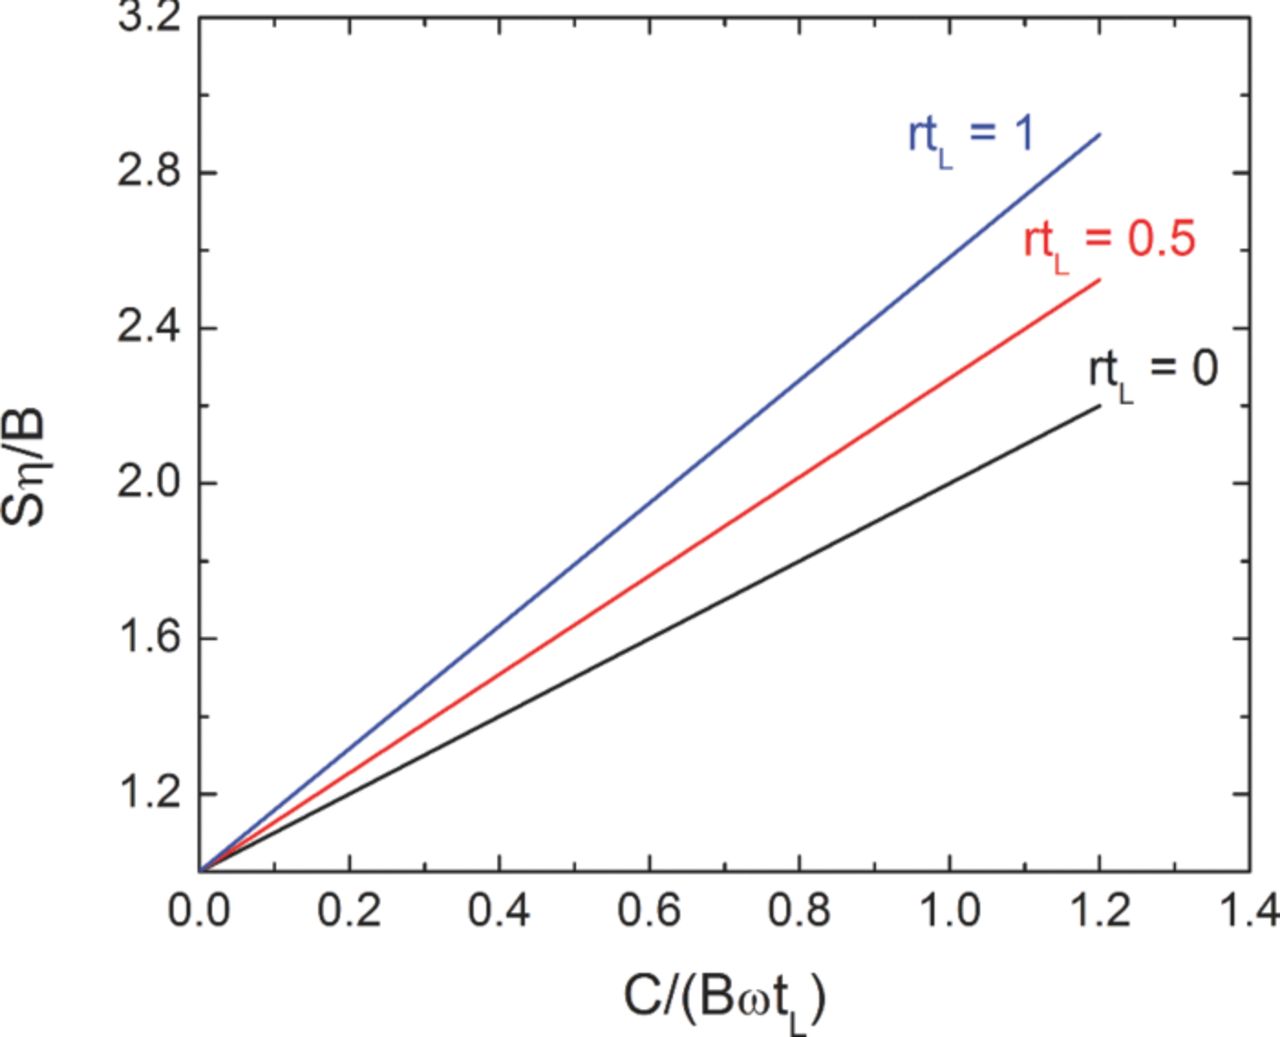
Figure 3. Economics of a battery or energy-storage device. B is the price of energy stored, S is the sale price of the energy, and η is the energy efficiency. C is the cost of the energy-storage device, tL is its life, and ωtL is the number of cycles during this life. r is the internal rate of return, or effective interest rate.
Photovoltaic array or energy-producing device
For a PV array, take the price of sunshine to be zero (such as B = 0), so that the economics revolves around the capital cost and the life of the device. The cost can be expressed as
![Equation ([7])](https://content.cld.iop.org/journals/1945-7111/159/10/A1722/revision1/jes_159_10_A1722eqn7.jpg)
where C is now the cost per average nominal watt, A is the area exposed to sunlight, and I0 is the nominal insolation (W/m2). The revenue stream is
![Equation ([8])](https://content.cld.iop.org/journals/1945-7111/159/10/A1722/revision1/jes_159_10_A1722eqn8.jpg)
where S is the sale price for electricity ($/J) and η is the energy efficiency (W of electrical energy per W of insolation) of the device. The result can be written
![Equation ([9])](https://content.cld.iop.org/journals/1945-7111/159/10/A1722/revision1/jes_159_10_A1722eqn9.jpg)
expressing the required sale price of electricity in terms of the capital cost of the device, its lifetime and efficiency, and the time value of money. The insolation ratio shows how the sale price depends on the location of the installation through the latitude and cloud cover, but the cost of the device depends on the area and construction and is independent of location. The device cost is frequently expressed in terms of the price per peak watt (nominal) Cp. Then one needs to include also the continuity or intermittency factor, f = Cp/C, where f is the effective fraction of time that solar radiation is received or as the ratio of average W to peak W. The RTI International report1 on PVs suggests a value of 0.18 for f.
Similar economic analysis applies to the other units in Figure 2. An operating cost is included in the revenue stream. For the hydrogen-storage unit, this includes an upstream cost for the intermittent hydrogen stream and the cost of compression of the hydrogen. These are added to the depreciated capital cost for the tank and the compressor to get the cost of the output, steady hydrogen stream. The cumulative costs add as shown in Figure 2.
Comparative storage costs
To be cost effective, the storage cost for an item ought to be a small fraction of its value. On the basis of this criterion, we develop a figure of merit of storage cost divided by the value of the stored item, for which the battery example gives a value of 0.949. This is a large ratio. Even so, it is probably understated because it would be difficult to find a battery of any kind for 50 $/kWh that will stand up to a daily deep discharge for 5 years. If we decide to store the energy for a one-year cycle instead of a daily cycle, this figure of merit rises to 240. (We are willing to store electric energy in a watch battery for 2 or more years because we value the energy highly for its convenience and small size. Energy for the utility grid is inherently valued at its sale price, a much smaller number.)
In this discourse, we have developed formulas for expressing the economics of storing energy or of almost any economic activity by trading capital costs versus operating costs. For this analysis, we generally need the life, cost, and efficiency that are involved. The simple economic analysis is easy to do; getting good numbers for life, cost, and efficiency requires the hard and costly work of research and development.
Table I shows the comparison among different storage options. The cost effectiveness of these storage options varies by orders of magnitude. One would not consider using a battery or hydrogen storage to store energy for a year if the energy is valued for its gross energy content alone. Contrast this with the case of the watch. You can also propose to run the utility grid without intermittent energy from wind and solar energy; then the power from these sources would go directly into a synthetic liquid-fuels plant, like that depicted in Figure 2.
Optimum current density for the electrolyzer
Newman12 and Divisek et al.13 carry out optimization of the cell potential or current density for fuel cells and electrolyzers. The total capital cost is C; the capital cost per unit area of separator or diaphragm is C/A. The contribution to the cost per unit time and per unit area is (in units of $/m2-y):
![Equation ([10])](https://content.cld.iop.org/journals/1945-7111/159/10/A1722/revision1/jes_159_10_A1722eqn10.jpg)
The operating cost is power for electricity ViA. As a cost, this is CeViA, where Ce is the unit cost of electrical energy, i is the current density, V is the cell potential, and A is the separator area. To add this to the capital cost, we need both on a per-unit-area basis. This is CeVi. Thus,
But we really want this per unit of H2 product. Therefore, divide by i before minimizing.
![Equation ([11])](https://content.cld.iop.org/journals/1945-7111/159/10/A1722/revision1/jes_159_10_A1722eqn12.jpg)
Now approximate the cell potential with Tafel kinetics and an ohmic potential drop as
![Equation ([12])](https://content.cld.iop.org/journals/1945-7111/159/10/A1722/revision1/jes_159_10_A1722eqn13.jpg)
where i0 is the exchange current density, αa is the transfer coefficient, U is a constant, and Leff and κeff are the thickness and conductivity of the diaphragm. Then
![Equation ([13])](https://content.cld.iop.org/journals/1945-7111/159/10/A1722/revision1/jes_159_10_A1722eqn14.jpg)
The optimum current density is given by solving for i:
![Equation ([14])](https://content.cld.iop.org/journals/1945-7111/159/10/A1722/revision1/jes_159_10_A1722eqn15.jpg)
The optimum current density is independent of i0, but the cost will depend on i0. Large capital cost (C/Ce) leads to large currents (to pay off the capital cost), and
![Equation ([15])](https://content.cld.iop.org/journals/1945-7111/159/10/A1722/revision1/jes_159_10_A1722eqn16.jpg)
Small capital cost leads to small currents
![Equation ([16])](https://content.cld.iop.org/journals/1945-7111/159/10/A1722/revision1/jes_159_10_A1722eqn17.jpg)
Define a dimensionless current density as
![Equation ([17])](https://content.cld.iop.org/journals/1945-7111/159/10/A1722/revision1/jes_159_10_A1722eqn18.jpg)
(this can be compared to the parameters δ and J presented in reference 14) and a dimensionless capital-cost ratio
![Equation ([18])](https://content.cld.iop.org/journals/1945-7111/159/10/A1722/revision1/jes_159_10_A1722eqn19.jpg)
Then the above approximate equation (for Tafel kinetics) becomes c = I2 + I, which gives the solution  (If iopt gets too small, we need to go away from Tafel kinetics.)
Because Miles et al.15 provide kinetic data on hydrogen and oxygen evolution on nickel electrodes at 80, 150, 208, and 264°C, we can redo the economics for two electrodes, both in the Tafel regime. The cell potential can be expressed now as
![Equation ([19])](https://content.cld.iop.org/journals/1945-7111/159/10/A1722/revision1/jes_159_10_A1722eqn20.jpg)
and the total cost (in $ per unit area and per unit time) becomes
![Equation ([20])](https://content.cld.iop.org/journals/1945-7111/159/10/A1722/revision1/jes_159_10_A1722eqn21.jpg)
Subscripts H and O refer to hydrogen and oxygen. Let us change the definitions of I and c:
![Equation ([21])](https://content.cld.iop.org/journals/1945-7111/159/10/A1722/revision1/jes_159_10_A1722eqn22.jpg)
and
![Equation ([22])](https://content.cld.iop.org/journals/1945-7111/159/10/A1722/revision1/jes_159_10_A1722eqn23.jpg)
Then the dimensionless cost of hydrogen is
![Equation ([23])](https://content.cld.iop.org/journals/1945-7111/159/10/A1722/revision1/jes_159_10_A1722eqn24.jpg)
where D is a complicated constant
![Equation ([24])](https://content.cld.iop.org/journals/1945-7111/159/10/A1722/revision1/jes_159_10_A1722eqn25.jpg)
The dimensional cost per mass of hydrogen is 2ΞF/iMH2, where MH2 is the molar mass of hydrogen.
The determination of the optimum current density works exactly as it did before, with the same expression. Table II gives a set of results using the data of Miles et al.,15 but supplemented with values of the resistance and cost numbers. For some temperatures, Miles et al. give two sets of Tafel parameters, one for high overpotentials and one for low overpotentials. The optimum current density and hydrogen cost need to be selected corresponding to the correct curve where the value lies.
Table II. Optimum current densities and other operating parameters for an alkaline electrolyzer, based on the kinetic data on Ni of Miles et al.15 The resistance is taken to be 1 ohm-cm2. (Divisek et al.13 attained a substantially smaller resistance of 0.05 to 0.09 ohm-cm2). Here Ce = 53 $/MWh, C/A = 2000 $/m2, f = 0.5, tL = 7 y, and r = 0.1 y−1. By taking the life and cost of the electrolyzer to be independent of temperature, one sees the maximum benefit of the improved electrode kinetics on the cost of hydrogen produced. This cost drops from 4.20 $/kg at 80°C to 3.10 $/kg at 264°C. How much of this gain will be lost by corrosion and added capital cost and cost to raise the temperature of the fluids from 80 to 264°C remains to be estimated. Integration with the downstream chemical reactor might modify the answer. About 25% of the projected cost reduction is due to the reduction of U. This neglects the cost of the thermal energy used directly in the process.
| Temperature, °C | 80 | 150 | 208 | 264 |
| αH | 0.5 | 0.3 | 0.3 | 0.53 |
| αO | 0.74 | 0.67 | 0.71 | 3.3 |
| I0H, A/cm2 | 1.1×10⁻⁴ | 9.5×10⁻³ | 0.03 | 0.02 |
| I0O, A/cm2 | 4.2×10⁻⁶ | 1.8×10⁻⁴ | 3.5×10⁻³ | 1.00×10⁻³ |
| U, V | 1.183 | 1.123 | 1.074 | 1.027 |
| iopt, A/cm2 | 0.366 | 0.335 | 0.327 | 0.366 |
| cost, $/kg H2 | 4.196 | 3.962 | 3.550 | 3.096 |
| V, V | 2.510 | 2.301 | 1.996 | 1.730 |
| elec, $/kg H2 | 3.537 | 3.242 | 2.812 | 2.437 |
Electrolyzers based on a polymer membrane separator are also commercial and are said to give comparable cost numbers for the produced hydrogen.16 These units have also precious metal catalysts and operate at substantially higher current densities. The electrolyzer with the higher current density may not point to the more effective efficiency but rather to the one with the higher capital cost.
Wind
Electricity from wind is assumed to be produced at 53 $/MWh.16 We assume an intermittency factor of f = 0.5, although this factor is already included in the value 53 $/MWh. The total cost is largely capital cost.
Estimates show that U. S. wind resources could provide more than 1.1 TW (average).17 This is much more than that needed for the military, but it cannot cover all the energy needs of the country. This source assumes that electric power from wind "is available 30% of the time at an average cost of 60 $/MWh." "Worldwide, the cost of generating electricity from wind has fallen by more than 80%, from approximately 380 $/MWh in the early 1980s to a current [2004] range for good wind sites located across the United States of 40 to 70 $/MWh" with average capacity factors of close to 30%.
Electrolyzers
There are three electrolyzer types, alkaline, polymer-electrolyte-membrane (PEM), and solid-oxide. The first two operate at about 80°C and are credited with having comparable overall costs, despite their differences in process chemistry.16 The last, which operates at 700 to 1000°C, is too immature to be compared with the first two. PEM electrolyzers use precious-metal catalysts (perhaps in oxide form) and have expensive membranes and bipolar separator plates, while alkaline cells use mainly nickel. The PEM electrolyzers operate around 1.5 A/cm2, while alkaline cells typically operate in the range of 300 to 500 mA/cm2. This may merely point to the higher capital cost of the former, based on the analysis of the optimum current density. For greater efficiency, it is desirable to operate at lower current density, with a consequently larger electrode area. Electrodes tend to be expensive; we use a value of 2000 $/m2 for electrodes, compared to 800 $/m2 for PVs.
Photoelectrochemical cells are supposed to fulfill the purpose of both the energy source and the electrolyzer in Figure 2 because they produce hydrogen directly from water and sunlight. They currently suffer from severe corrosion problems and do not have a very long life.18
CO2 Separation
Carbon dioxide can be absorbed from a gas stream by absorption in a basic solution such as caustic (NaOH or KOH) or ethanolamine. Flue gas from coal- or methane-burning power plants contains 13 or 3% CO2, respectively. The cost of producing a pure CO2 stream is 29.5 $(1997)/t(CO2) for the 13% stream and 43.5 $(1997)/t(CO2) for the 3% stream.10 The operating cost is taken to be 18.7 and 25.14 $(1997)/t(CO2) for the two concentrations, and the depreciated capital cost is 10.83 and 17.85 $(1997)/t(CO2), respectively.10 (These numbers do not add exactly to the total of 43.5 $/t(CO2) given for the 3% stream.) The total rises to at least 85 $/t(CO2) for recovery from air. (Reference 19 gives a much higher number, 550 $/t(CO2), for recovery from air.) However, the cost of the produced diesel fuel may rise only from 1883 to 1933 to 2084 $/t(diesel), or by 2.7 and 10.7%, respectively, because the cost of CO2 is a small part of the overall cost.
The size of the diesel production plant will be comparable to that of a present-day oil refinery. Its size might be governed in part by the location of the source of CO2 (power plant) and the cost of piping CO2 from more than one power plant.
Hydrogen Storage
As discussed in the Economics section, we were surprised at how much cheaper it is to store energy as hydrogen rather than as electricity; it is still cheaper to store energy as diesel fuel. For this reason, a hydrogen-storage unit was added in Figure 2 after the electrolyzer instead of a battery between the wind-energy source and the electrolyzer. This means that the electrolyzer runs intermittently, although the chemical reactor runs continuously with the steady hydrogen supply from the hydrogen-storage unit. With the intermittency factor of 0.5 used in the calculations, the cost of hydrogen rises about 4.7% between intermittent and steady supply.
Modified Fischer-Tropsch Synthesis
The Fischer-Tropsch process was invented in 1924 and was used to make synthetic diesel during the Second World War. Subsequently it has been used extensively in South Africa. The process uses a mixture of CO and H2. This could be done here by running a reverse water-gas-shift reaction to create CO from CO2. A possible modification of the original process is to combine the Fischer-Tropsch reaction with the water-gas shift. There are two preferred catalysts for the process, cobalt and iron. Since cobalt is a poor water-gas-shift catalyst, it may be the preferred catalyst when CO is the reactant. Since iron is a better water-gas-shift catalyst, it is the preferred catalyst when CO2 is the reactant.20 Although the whole process can be run with two reactors if necessary, there is a possible simplification if the CO2 can be fed into a single reactor. Further research and development can determine the best catalyst, operating temperature and pressure, and ratio of reactants.
Costs are hard to determine from the literature because they are proprietary and because the whole Fischer-Tropsch process involves other processes, like coal gasification and preparation of the synthesis gas, which are not part of the modified process. To arrive at a capital cost, we took designs and costs for a conventional process21 and eliminated the parts and cost that are not involved in the modified process. In this way, we obtained 504 $(2006)/kW. This can be compared with 110 $(2006)/kW estimated for a simpler methanol plant. The difference in the resulting cost of diesel may not be so great (perhaps 4%), and one may choose the more expensive diesel ($/MWh) over methanol because of other desirable characteristics such as higher energy density, less corrosion, and an existing infrastructure.
Cost Breakdown
The cost numbers on Figure 2 permit one to allocate the various costs to three main categories, value retained in the final diesel product, costs related to irreversibilities in the system, and the capital cost of units beyond the energy source. Figure 4 shows the breakdown graphically.
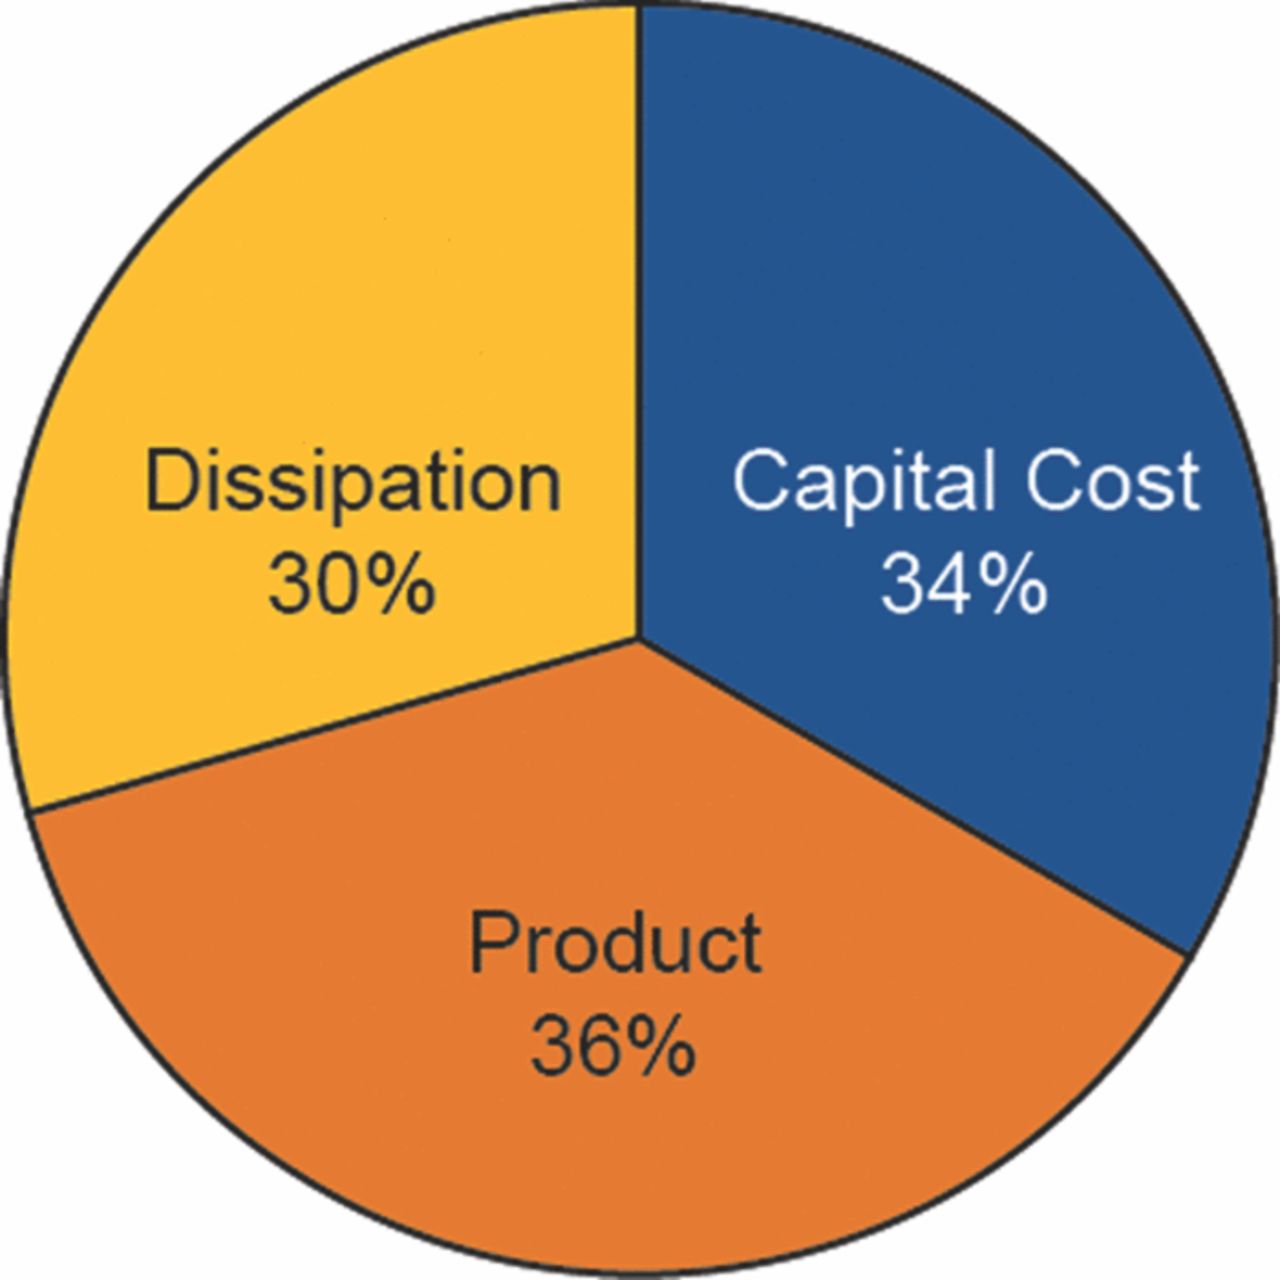
Figure 4. Distribution of the energy expended among dissipation and capital cost, with the balance going into the useful energy of the product. The capital cost of the wind farm is regarded as a source of energy, and is not included in the capital-cost category (which then covers the electrolyzer, the hydrogen storage, the CO2 separator, and the modified Fischer-Tropsch reactor). The energy in the final product was valued at 53 $/MWh.
The losses and the depreciated capital cost can be further allocated among the process units, so that one can surmise where to devote attention to achieve cost reductions in the final product. It is clear from Figures 5 and 6 that the electrolyzer deserves the bulk of the attention.
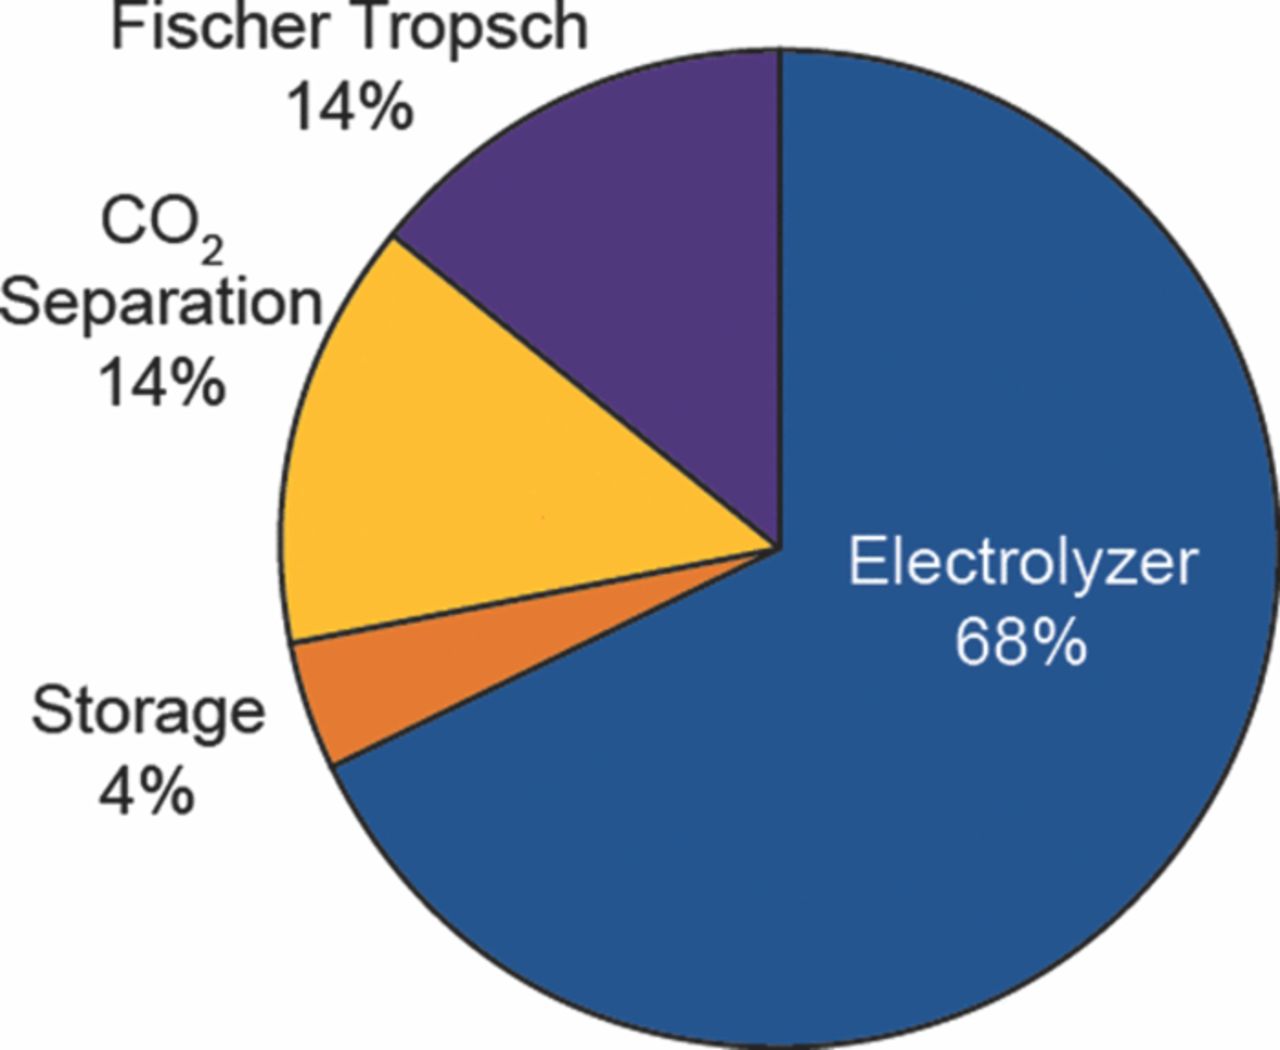
Figure 5. Allocation of the losses in the overall process among the process units.
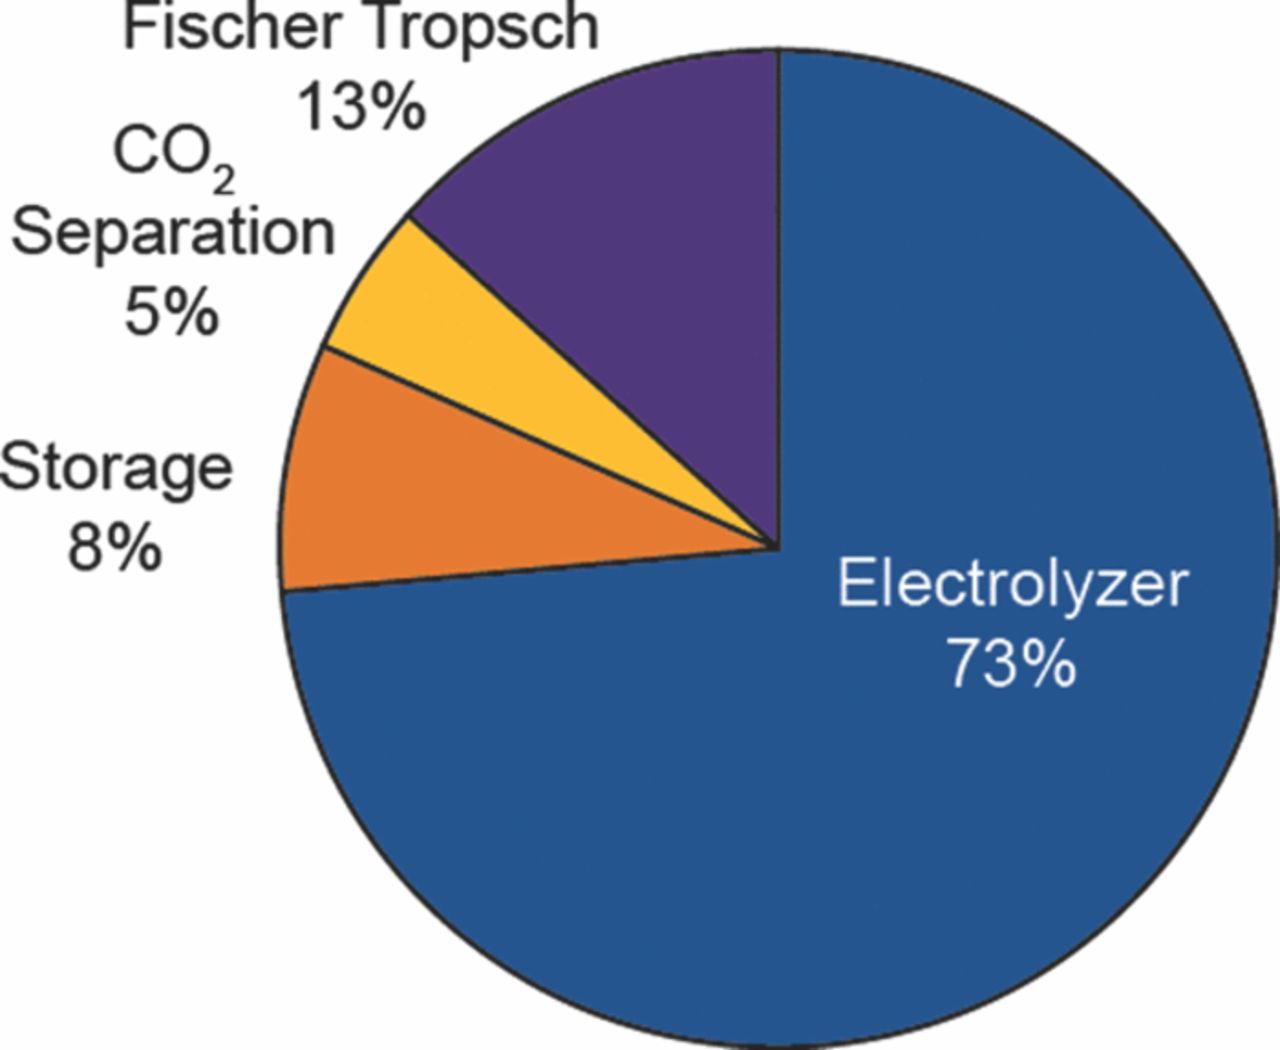
Figure 6. Allocation of the depreciated capital costs among the process units.
Photoelectrochemical Cells
Since 1972,22 PECs have emerged as a promising means for splitting water into hydrogen and oxygen inexpensively. At the present time, the combination of wind and an electrolyzer is cheaper. This combination, coupled with the downstream processes for making a liquid fuel, could soon compete with fossil fuels, especially if other issues like energy security and economic consequences of fossil-fuel use are taken into account.5–7 The cost of PV cells has been coming down substantially, and PVs may be needed to supplement wind in the process if one wants more than 1.1 TW of renewable energy within the United States. Even at their immature stage, it is useful to examine the economics of PECs. Table III shows a comparison among wind, PVs, and PECs. The numbers for the last two columns are more speculative, but point to the need to increase the life of the devices. The last row of the table compares the price of hydrogen product by three different methods. The next to the last row should not be used for a direct comparison because it compares the price of electrical energy for PVs and wind with the hydrogen energy of the PECs.
Table III. Comparison of wind, historical information1 for photovoltaics, and projections for photoelectrochemical cells. Average insolation is 400 W/m2, and r = 0.1 y−1. The cost for PVs represents the module cost; the installed cost is higher. Barbose et al.26 report an installed cost as low as 2.4 $/W(peak). The installation cost cannot be expected to decrease at the same rate as the module cost.
| PV | PV | PEC | PEC | ||
|---|---|---|---|---|---|
| Wind | 2008 | 1976 | projected | goal | |
| Cost, $/W(peak) | 1.92 | 114 | — | — | |
| Cost, $/W(average) | 10.7 | 633.3 | 9.5 | 9.5 | |
| Cost, $/m2 | 725 | 43067 | 800 | 800 | |
| Efficiency | 0.17a | 0.17a | 0.05b | 0.15b | |
| Life, years | 25 | 2.5 | 1 | 25 | |
| Depreciated cost, $/MWh | 53a | 133a | 32662a | 4795b | 166b |
| H2 cost, $/kg | 3.64 | 7.62 | 159.70 | 5.52 |
Note: a is based on electrical energy; b is based on hydrogen energy.
It is impressive how the cost of PVs has been reduced by a concerted effort over more than 30 years by the U. S. Department of Energy and the solar industry.1 Perhaps a similar cost reduction can be achieved for PECs, although the latter have also been under intensive development over the same 30 years. Table IV provides a comprehensive overview of the state-of-the-art in PEC technology based on an extensive literature survey. Although very impressive water splitting efficiencies have been achieved with PECs, reliable extended lifetime testing of PECs beyond 48 hours is nonexistent in the literature. More often than not, authors report efficiencies without mention of stability. In a few cases, stable photocurrents over 30 hours have been achieved. Further research needs to focus on improving both lifetime and efficiency of PECs.
Table IV. World record efficiencies for photoelectrochemical water-splitting devices and associated device-stability measurement.
| Device | Surface | Materials | Efficiencya | Lifetime | |
|---|---|---|---|---|---|
| Reference | Architecture | Catalysts | Systems | (%) | Testing |
| 27 | Photocathode | Ru, Re, or Rh @ Cathode | p-InP | 11.4–13.3 | Requires periodic cycling to Voc to maintain high efficiency |
| 28 | Tandem p/n-PEC cell | Pt @ Cathode MnO2/Pt @ Anode | p-InP/n-GaAs | 8.2 | 10% efficiency decrease during first hour, then remains constant for 10 h |
| 29 | Tandem photocathode/PV | Pt @ Cathode Pt @ Anode | p-GaInP2/p-n GaAs | 12.4 | Photocurrent decrease from 120 to 105 mA/cm2 over 20 h |
| 30 | Tandem PV | Pt @ Cathode RuO2 @ Anode | AlGaAs/Si | 18.3 | Stable photocurrent over 14 h |
| 23 | Tandem PV | Pt @ Cathode Pt @ Anode | p-n GaInP2/p-n GaAs | 16.5 | Not reported |
| 23 | Tandem PV | Pt @ Cathode Pt @ Anode | Triple junction amorphous Si | 7.8 (wired) | Not reported |
| 31 | Tandem photoanode/PV | Pt @ Cathode | WO3/DSSC PV | 4.5 | Not reported |
| 32, 33 | Tandem photoanode/PV | Pt @ Cathode | Fe2O3/DSSC PV | 2.2 | Not reported |
| 24 | Tandem PV | NiMoZn @ cathode; ITO/Amorphous Co-OEC@ anode | Triple junction amorphous Si | 4.7 (wired) 2.5 (wireless) | 1 M KBi: Stable for 10 h, then 20% decrease over next 14 h; stable for 30 h using FTO instead of ITO |
The majority of the content in this table was taken from Reference 33.Note: a water splitting efficiency.PV is the symbol for photovoltaics; DSSC is dye-sensitized solar cells; ITO is indium tin oxide; OEC is oxygen-evolving complex; KBi is potassium borate; FTO is fluorine-doped tin oxide.
As shown in Table III, H2 from PVs coupled to electrolyzers is double the cost of that for wind energy. Column 4 of Table III generously projects a PEC life of 1 year and uses energy efficiency from sunlight to hydrogen of 5%. If the life of PECs could be extended to 25 years and the energy efficiency tripled, the cost of hydrogen would be lower than that from PVs. (This is intended as a worthwhile goal rather than as a prediction of the future.) However, this cost estimate does not take into account key device features like piping and device housing. Because light capture and water splitting occur within the same vessel in PECs, piping that extends over the entire solar array is required to feed water to and remove fuels from the system. In contrast, light capture and water splitting occur separately in PV/water electrolyzers. Similar land areas will be needed for light harvesting for PECs and PVs; however, a significant reduction in piping is expected in the PV/water electrolyzer case due to higher current densities and the ability to stack cells.
In all cases, it becomes desirable to convert the hydrogen into a liquid fuel like diesel, gasoline, or methanol. Figure 2 indicates that the additional cost is small compared to the cost of harnessing energy and generating hydrogen. Nevertheless, PECs cannot presently compete with electrolyzers with either wind or PVs as the energy source due to long-term stability issues.
One way to extend the life of PECs is to separate the electrolyzer part from the PV part, so that corrosion of semiconductors is no longer involved.23 The overall efficiency may be higher than in the scheme in Figure 2 because of the lower current density in the electrolyzer, but the capital cost may be higher unless the incremental cost of putting the electrolyzer on the back of the PV is suitably small (<24 $/m2). Another way to extend the life of PECs is to change the chemistry (e.g., use less corrosive, near-neutral electrolytes, adopt self-healing strategies,24 and/or utilize semiconductor surface modifications,25 which impede surface corrosion while maintaining interfacial charge-transfer rates).
Research Needs
The process outlined in Figure 2 is technically feasible and produces liquid fuel from renewable sources at a cost presently higher than that of petroleum, without accounting for factors like pollution costs. Investing in such production facilities will generate jobs, spur the economy, promote energy independence, and provide the opportunity for costs to be driven down as innovations are introduced through competition.
It is useful to call attention to specific, but straightforward, tasks that can be pursued in parallel. One innovation involves feeding CO2 and hydrogen directly into a modified Fischer-Tropsch process without the intermediate step of producing carbon monoxide by the reverse water-gas-shift reaction. This would entail a coherent program of catalyst development, starting with well known Fe catalysts20 of Fischer-Tropsch synthesis, and a definition of the best operating temperature and pressure and ratio of hydrogen to CO2 in the reactor feed. There are related tasks of best integrating that reactor and its operating conditions with the upstream hydrogen production and the necessary recycle of unreacted reactants and internal energy usage.
Similarly, the production cost of methanol can be reduced if catalysts for methanol synthesis can be developed that reduce the pressure of the reactor toward 15 bar.
As shown in Figures 5 and 6, approximately 70 percent of the overall capital costs and energy inefficiencies are incurred in the electrolyzer. Chlorine production via electrolysis, a major industry, can be used as a guide to improve the operation and economics of the electrolyzer utilized herein. Hydrogen production electrolytically has not been a mainstream process because hydrogen is available more cheaply as a by-product of petroleum and natural-gas processing. A major loss, encountered in many routes for renewable energy, is oxygen evolution. (Chlorine evolution is less demanding.) Data are available in the literature15 showing how the overpotential for both hydrogen and oxygen evolution decrease in alkaline electrolyzers as the temperature is raised. It will take substantial effort to determine the optimum temperature for the electrolyzer as well as the improvements in materials needed to mitigate corrosion of both the electrodes and the diaphragms. Further attention can be devoted to the best way to get the gases out of the cell and whether operating at a higher pressure is feasible to reduce bubble size and ohmic potential drop and to integrate with the operating pressure of the downstream hydrogen storage and modified Fischer-Tropsch reactor.
Conclusions
World consumption of petroleum and the ecological problems associated with coal demand that large-scale production of renewable synthetic liquid fuels commence. A guaranteed market of a size comparable to the U. S. military needs could launch this new industry.
Renewable synthetic fuels could cap the price to which natural petroleum and other fossil fuels can rise. A plan is also needed to persevere even if the cost of natural fuels dips. If the above guaranteed market is in place, the price of synthetic fuel can be reduced by competition. The value of 5.25 $/gge given in Figure 2 is already close to that of fossil fuels, and it sets a benchmark with which other routes to renewable energy must compete.
The simplified economic analysis presented here guides the choices among alternatives and establishes a methodology for examining the viability of renewable energy. An approximate assessment of the economics can be quantified; with information on life, efficiency, and cost available, one can compare tradeoffs between operating costs and depreciated capital costs and among alternative process modules.
Storage is important in energy and essential in renewable energy. Storage costs are much less for hydrogen than for electricity, and storing a liquid fuel is substantially cheaper.
Any hydrogen made by any means and intended for long-term storage or for transportation use can be converted into liquid fuel by the means outlined here. The comprehensive view of the overall process emphasizes its modular nature, so that improvements can be made in the individual modules, and alternative energy sources can be used if wind proves to be too small a scale or other technologies prove to be cheaper, even in local markets.
The main cost in producing renewable synthetic energy is getting the energy collected from a diffuse source such as the sun. Second in difficulty is getting the energy into molecules, for example in an electrolyzer or a photoelectrochemical process. Getting CO2 from the atmosphere economically will be a long-term need.
Until PECs can be improved and become cost-effective, presently available methods (Figure 2) could be implemented during the next 10 to 20 years (and perhaps beyond if other alternatives do not pan out).
Acknowledgment
Dr. Gregory Schoofs made many specific suggestions for improving the manuscript.