
Abstract
A full electrochemical investigation of the lithium intercalation processes in a commercially available PAN-based carbon fiber, Toho Tenax IMS65 (unsized and sized) primarily intended to be used in structural lithium-ion batteries, has been performed. In order to extract the electrochemical properties, a specially designed microelectrode system consisting of a single fiber working electrode, lithium-foil counter electrode and well-characterized battery materials were utilized. The properties, for 5 to 100% state-of-charge (SOC), were mainly determined from electrochemical impedance spectroscopy (EIS) measurements by fitting of a physics-based model, and electronic conductivity examination. The study shows excellent mass transport and kinetic properties, especially at high SOCs for this specific carbon fiber compared to other negative electrode materials. Some electrochemical parameters vary depending on sizing, but are too small to affect the actual electrochemical performance. A strong SOC dependence is shown for most electrochemical properties, including the electronic conductivity.
Export citation and abstract BibTeX RIS
Today, lithium-ion batteries power many of our most common portable electronic devices such as cell phones, laptops but also hybrid electric vehicles (HEV) and battery electric vehicles (BEV). A disadvantage of conventional rechargeable lithium-ion cells is that they will always require dedicated space and add weight. Since both volume and weight are considered as key aspects in many components, the battery, should it not add to the mechanical stability in any way, is considered structurally parasitic. One approach to target this problem would be to integrate the battery as a load-carrying part of the structure i.e. a structural battery.1,2 In addition, an increase in power and energy density on a system level could be achieved. To realize a structural battery, the ordinary battery materials need to possess additional functionality. For the negative electrode, excellent mechanical and electrochemical properties can be accomplished using carbon fibers instead of the ordinary powdered carbon-based electrode.3–6 The mechanical properties of commercially carbon fibers are continuously improving, which has also resulted in a revival in the carbon fiber research.
In order to fully determine the utility of an electrode material in a structural battery, it is essential to identify the electrochemical and mechanical limitations of the material. With the improved mechanical properties follows a probable change in the electrochemical properties such as kinetics and mass transport. These features are crucial for understanding the management and performance of the carbon fiber.
Earlier studies of carbon fibers have mostly investigated selected electrochemical properties, e.g. mass transport over parts of the state-of-charge (SOC) window,7–9 using pitch-based fiber tows in the experimental setup. Recently, Kim and Sastry6 studied commercially available pitch-based fiber tows, with focus on mass transport performance within the fiber, using cyclic voltammetry. The impact of carbon fiber deformation on mass transport was also examined. In 1996, Verbrugge and Koch10 examined single polyacrylonitrile (PAN)-based carbon fibers (Fortafil). They tested mass transport limitations and suggested that the tow and not only fiber properties govern limitations. The same authors proceeded to investigate the PAN-based carbon fiber with a model and determined the diffusion coefficient in the fiber as a function of intercalated lithium (from 0 to 80% SOC) and exchange current density.11 The most common method to extract parameters describing the electrochemical properties of carbon materials have been electrochemical impedance spectroscopy (EIS) combined with a model of some kind.8,9,12–15 The validity of the EIS investigations has been shown to vary significantly depending on the level of details of the model and most of the studies have been performed on fibers that do not meet the mechanical requirements of today. So far, no full electrochemical characterization of any type of single carbon fiber exists over the whole SOC window. Additionally, the effect of sizing has to the authors' knowledge never been investigated.
In this paper, the electrochemical properties of a promising commercially-available PAN-based carbon fiber (Toho Tenax IMS65), are studied thoroughly. Our experimental investigation has been performed on a single fiber electrode using a specially designed cell, which allowed for both cycling and EIS measurements of microelectrode. The cell design also enabled simplified model geometry for the extraction of kinetic and mass transport properties. Extraction of electrochemical properties was performed for most of the available SOC window (5–100%). In addition, the impact of SOC on the electrical conductivity of a single fiber was also studied in a second experimental setup. Impedance spectroscopy was used as the main experimental method and the resulting spectra were analyzed by fitting a physics-based EIS model15–18 to the measurements. Since common well-characterized materials were utilized in other parts of the cell (1 M LiPF6 in 1:1 ethylene carbonate (EC): diethyl carbonate (DEC) (Merck LP40) electrolyte19 and separator Whatman GF/A micro fiber filter),20 this approach allowed for an efficient extraction of the critical electrochemical properties of the fiber. The impact of sizing; an epoxy-based resin added to the fibers (∼1%) to facilitate handling and to improve fiber-matrix properties in composite manufacturing, was also examined.
Experimental
The carbon fiber studied in this paper was Toho Tenax IMS65, a polyacrylonitrile (PAN)-based fiber with intermediate modulus and high strength. Carbon fiber properties, as specified by the manufacturer, can be seen in Table I. This fiber grade was selected based on the results from previous research on carbon fibers for structural-battery applications.4
Table I. Carbon-fiber properties as specified by the manufacturer.
| Grade | Diameter / m | Density / kg m−3 | Strength / Pa | Modulus / Pa | Electrical resistivity / Ω m | Electronic conductivity / S m−1 |
|---|---|---|---|---|---|---|
| IMS65 24K 830 tex | 5·10−6 | 1.78·103 | 6.00·109 | 2.90·1011 | 1.45·10−5 | 6.90·104 |
Prior to cell assembly, single fibers were separated from a full tow of 24000 filaments under an optical microscope. For cycling and EIS measurements, a two-electrode pouch cell was used due to the possibility to embed the copper current collector in the heat seal, thus having only the fiber in contact with electrolyte and avoiding current collector interference during the measurements (Figure 1a). The end of the 2 cm long fiber was attached to the copper current collector with a quick-drying electronically conducting silver paint. An oversized lithium metal foil was used as counter electrode so that its impedance could be neglected. Two layers of glass-microfiber filters (Whatman) served as separator between the fiber and lithium foil, and 1.0 M LiPF6 in EC:DEC (1:1 w/w, LP40 Merck) as electrolyte. The cell setup used for the electrical conductivity measurements was made up of a microscope slide with two copper current collectors in between which a single carbon fiber (2 cm) was attached using the silver paint (Figure 1b). Cell assembly was performed in a glove box with dry argon atmosphere (<1 ppm H2O) at ambient temperature.
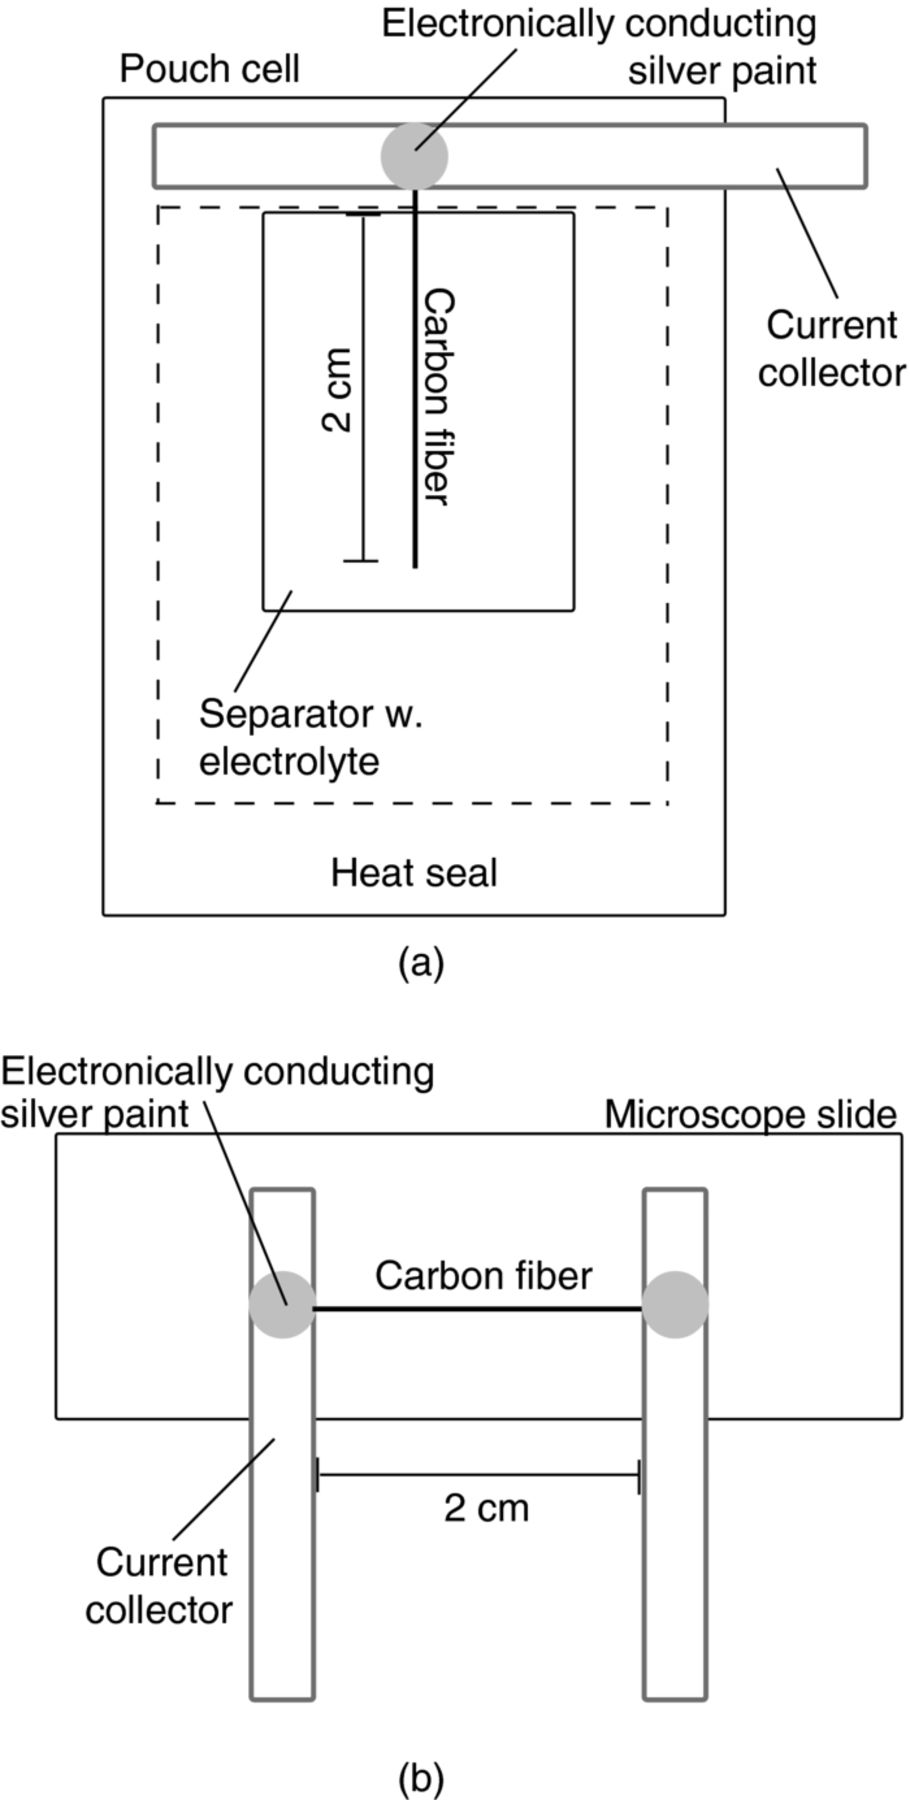
Figure 1. Schematics of cells used for a) electrochemical measurements b) conductivity measurements of a single fiber.
After assembly, the pouch cells were subjected to a slow formation cycling (0.05C; 5 nA cm−1) between 0.002–1.5 V vs. Li/Li+ three times. Prior to the EIS measurements the cells were kept potentiostatically at the target SOC for five hours followed by a 10 s open-circuit potential (OCP). The impedance was measured with a 10 mV amplitude between 5 kHz to 1 mHz and 10 points per decade at six different SOCs; 5, 20, 40, 60, 80, and 100%, corresponding to 0.84, 0.49, 0.27, 0.15, 0.062, 0.025 V vs. Li/Li+, respectively, determined with the galvanostatic intermittent titration technique (GITT). The GITT was performed with a 0.05C (5 nA cm−1) lithiation for 30 min, followed by a two hour OCP, and repeated until a lower cutoff voltage of 0.002 V vs. Li/Li+ was reached. The electrical conductivity was measured for an uncycled fiber and at 5 and 100% SOC, using a constant current. All measurements were performed using a Gamry Series G 750 potentiostat controlled with the Gamry Framework software.
Electrochemical Impedance Spectroscopy Model
Carbon-fiber EIS model
A mathematical model was set up as a tool to analyze the experimental EIS spectra.
Model geometry
A schematic of the model cell geometry is presented in Figure 2. The cell consists of the carbon fiber, separator, and lithium-foil electrode. The model was solved along the dashed lined in Figure 2. Cylindrical coordinates were selected with axisymmetry set around the center of the fiber, since the cylindrical coordinates capture the cylindrical shape of the fiber and the behavior of having an oversized lithium-foil; For an axisymmetric coordinate system the surface of the lithium foil is approximately 180 times larger than that of the fiber ((rfiber + rsep)/rfiber) and has therefore a negligible impact on the impedance. The entire perimeter of the fiber is in contact with the separator in the model. This was considered to be an adequate assumption due to the very small radius of the fiber.
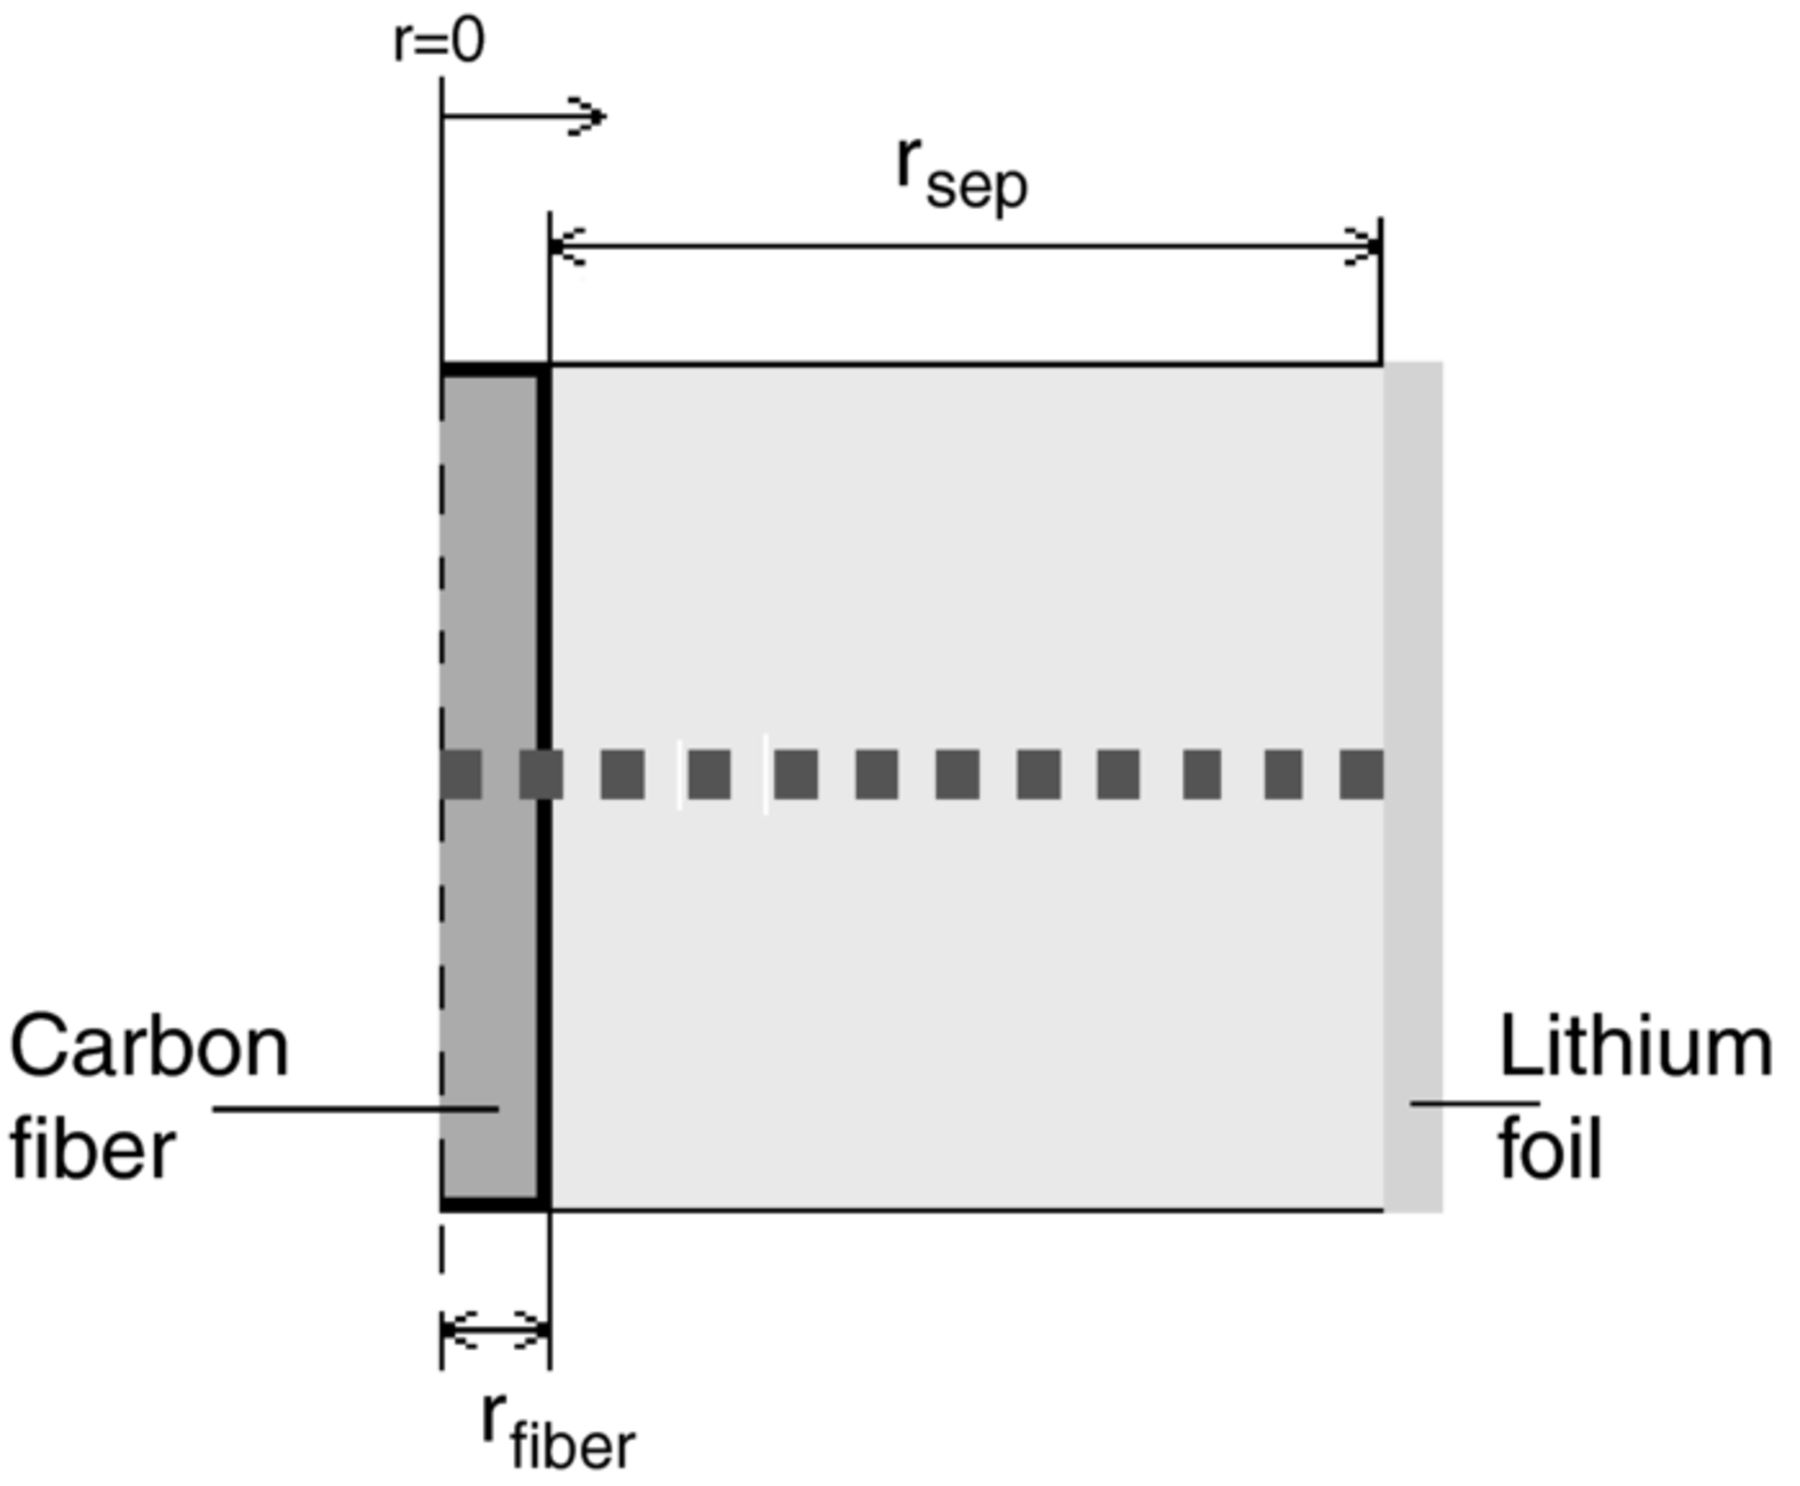
Figure 2. Schematic model cell geometry. Horizontal dashed line indicates the axisymmetric system solved for. Notations: rsep is the radius of the separator and rfiber the radius of the carbon fiber.
Model equations
The model equations were built on the physical electrochemical behavior of lithium-ion battery cells during transient conditions.21–23 This formulation involves calculation of lithium-ion concentration, cL, and potential, φL, in the electrolyte using concentrated solution theory,20,24 and lithium concentration, cS, and potential, φS, in the fiber (solid phase) using Fick's second law of diffusion and Ohm's law, respectively. The impedance was modeled by transforming these equations from transient to frequency dependent. Consequently, each dependent variable was set to perturb around an equilibrium value, as described by.15,25–29
![Equation ([1])](https://content.cld.iop.org/journals/1945-7111/160/9/A1473/revision1/jes_160_9_A1473eqn1.jpg)
where n is any frequency dependent variable and the superpositioned line denotes the equilibrium value and the superpositioned tilde the complex perturbation from the equilibrium value. Re is the real operator, j is the imaginary unit, ω perturbation frequency and t time. The perturbations were considered to be small, meaning that the equations could be linearized and several parameters were set constant.
The model equations are listed together with detailed descriptions in Appendix
Determining the impedance
The impedance was calculated with the equations in Appendix  , was determined as the difference between the solid-phase potential in the current collector and the potential in the electrolyte at the lithium-foil counter electrode, divided by the total current density perturbation in the three-electrode cell,
![Equation ([2])](https://content.cld.iop.org/journals/1945-7111/160/9/A1473/revision1/jes_160_9_A1473eqn2.jpg)
The model was solved in COMSOL Multiphysics using the Direct (UMFPACK) solver with complex numbers allowed together with MATLAB.
Optimization procedure
The simulated impedance data was fitted to the measured data for frequencies (ω/2π) between 1 kHz and 2 mHz using the lsqnonlin function in the MATLAB optimization toolbox together with COMSOL. The function used the least squares formulation to minimize the square sum of the difference between simulated and measured values divided by the measured values, χ2. The function is expressed as
![Equation ([3])](https://content.cld.iop.org/journals/1945-7111/160/9/A1473/revision1/jes_160_9_A1473eqn3.jpg)
where α is the fitting parameters, k the number of frequencies, and  and
and  the experimental and simulated impedance values, respectively. Both the number of parameters, starting values, and the interval over which the parameters could vary, were user-defined. In order for the optimization function to find a minimum and a meaningful solution, it was important to determine rational starting values and intervals before the optimization was run.
The optimization was initially performed in three steps at each SOC. First, the low-frequency tail of the impedance spectrum was fitted with the parameters affecting large time-constant mass transport: The diffusion coefficient in the fiber and the slope of the OCP curve. Second, the rest of the spectrum was fitted with parameters affecting small time-constant processes, i.e. electrode kinetics, capacitances, and ohmic resistances (exchange current density, double-layer capacitances, and contact resistance). Last, using the fitted parameters from the two previous optimizations, the entire spectrum was fitted varying all parameters allowing only a narrow variable parameter interval. The three steps were repeated if the fit needed to be further improved.
In order to optimize parameters considered as independent of SOC, the model was fitted for measurements at two SOCs simultaneously, first for 20% and 80% SOC and then for 40% and 60% SOC. An average was calculated for the SOC-independent parameters retrieved from the two optimizations and was tested for all SOC simulations. The initial three-step fitting was repeated, with the averaged SOC-independent parameters held constant, for SOCs where the fit was inadequate.
Results and Discussion
The full electrochemical characterization of unsized and sized IMS65 carbon fibers was performed through experimental investigation of the cycling performance, EIS and electronic conductivity measurements. The EIS data were analyzed using the numerically solved impedance model.
Lithiation and delithiation
In Figure 3, lithiation and delithiation curves of unsized and sized carbon fibers are shown. Despite the very low current load (0.05C; 5 nA cm−1), an uneven hysteresis can be observed between the lithiation and delithiation. Sizing, on the other hand, seems to have only a small impact on the lithiation and delithiation curves, as only a slight difference is noticeable between the unsized and sized fiber.
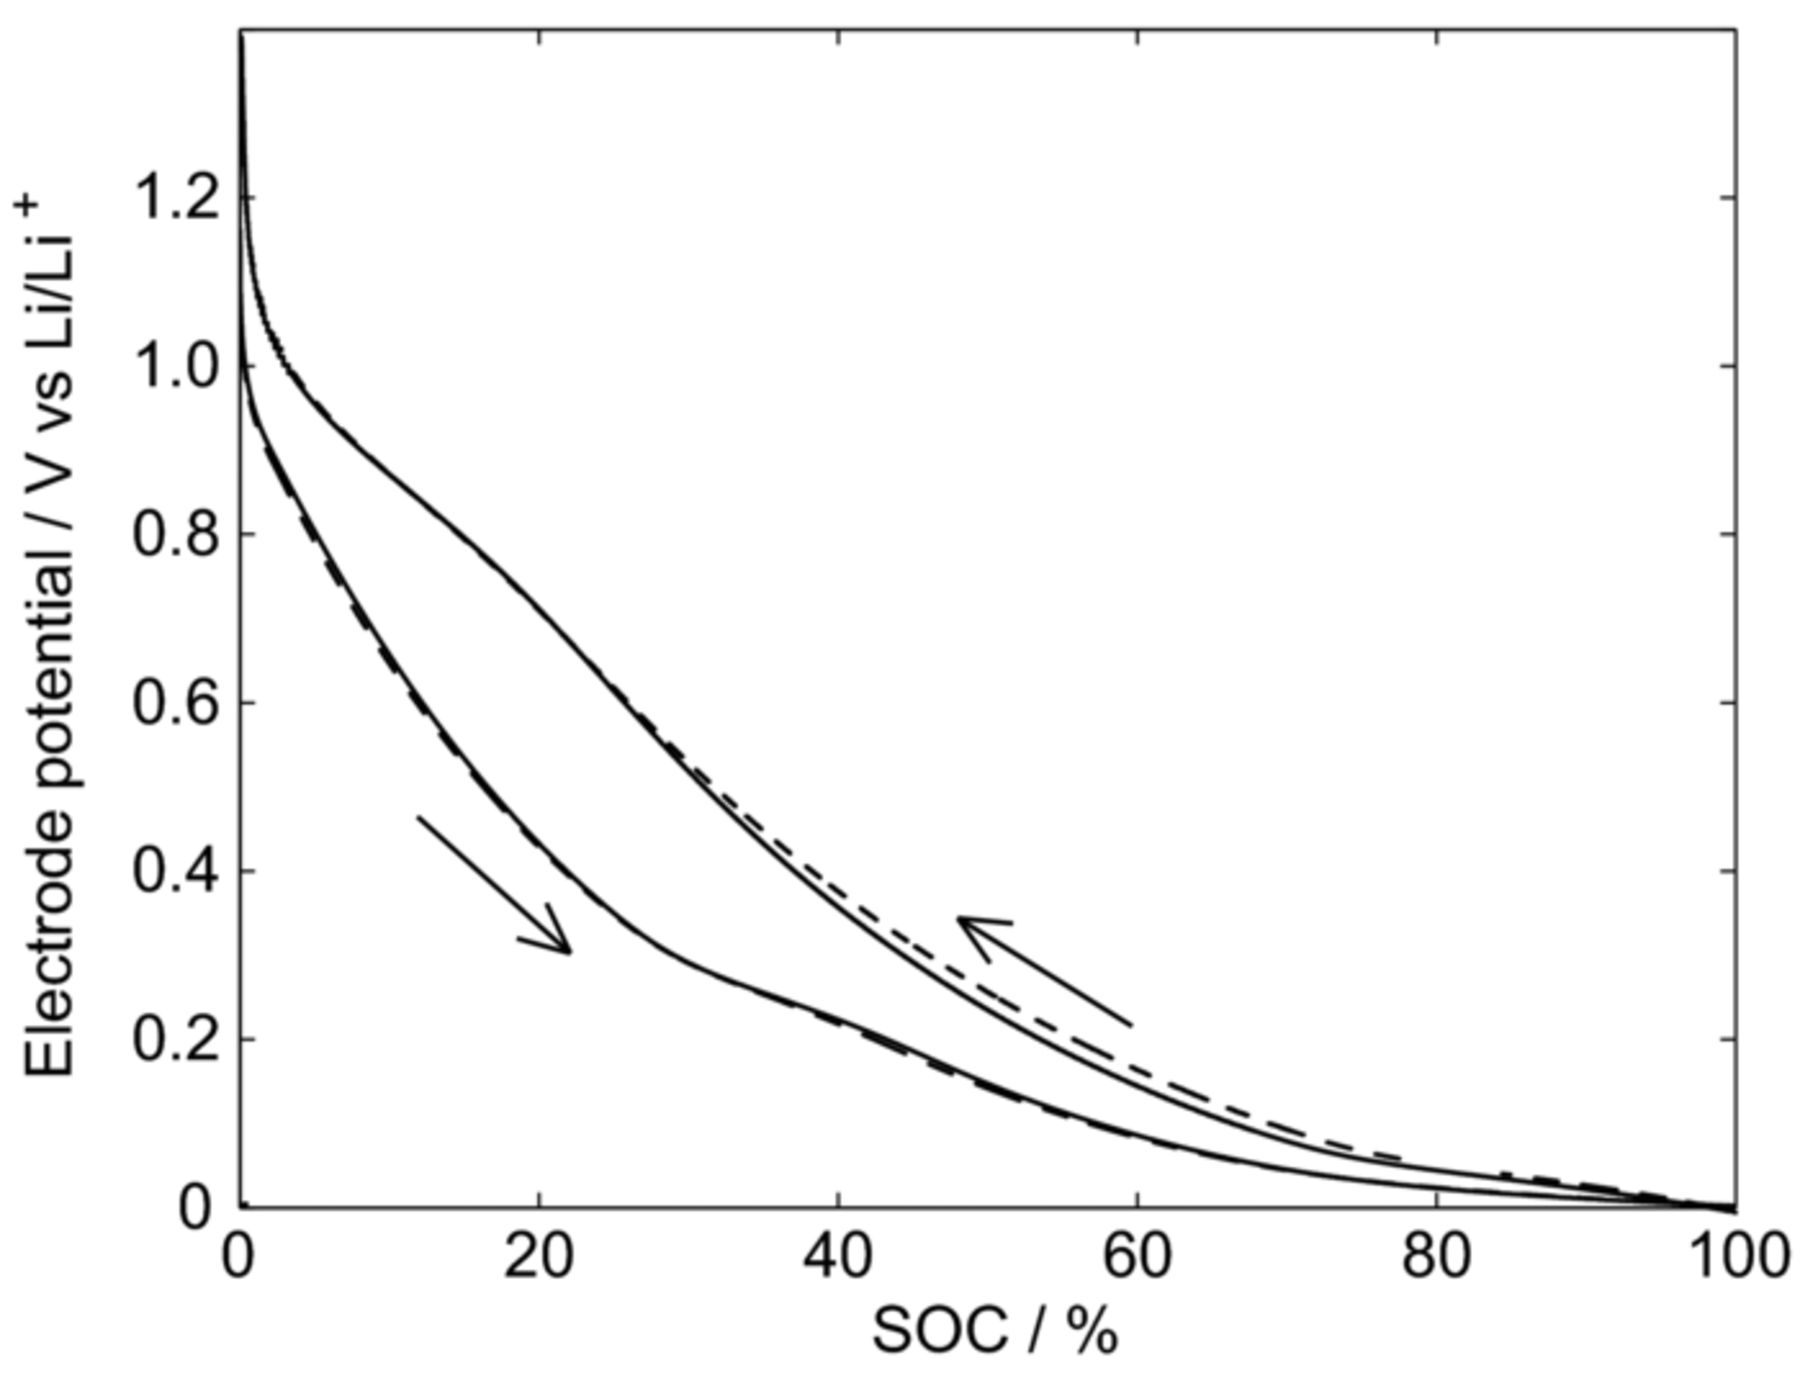
Figure 3. Lithiation and delithiation at 0.05C of unsized (solid line) and sized (dashed line) single carbon-fiber pouch cells.
EIS measurements
A selection of experimental and simulated impedance spectra at 5, 40, and 100% SOC are presented for the unsized and sized fibers in Figure 4. From these data, a couple of observations regarding the electrochemical properties of the fibers can be made. The charge-transfer resistance, described by the inverse of the exchange current density, is SOC dependent and increases substantially for lower SOCs, as the size of semi-circles in the spectra become larger (second semi-circle in 5% SOC). The mass transport within the fiber improves as SOC increases, which can be seen as the low-frequency tail either has a slope that is ∼45° at 5% or 90° otherwise. Consequently, two typical mass transport conditions are observed within the fiber. For a 45° slope, the mass transport can be characterized as semi-infinite, indicating the existence of mass transport limitations. For the 90° case, the limitation from the mass transport on the impedance is negligible and instead the fiber obtains a capacitive behavior.30 Therefore, as is seen in Figure 4, the mass transport improves quickly with higher SOCs. The influence of sizing is harder to evaluate.
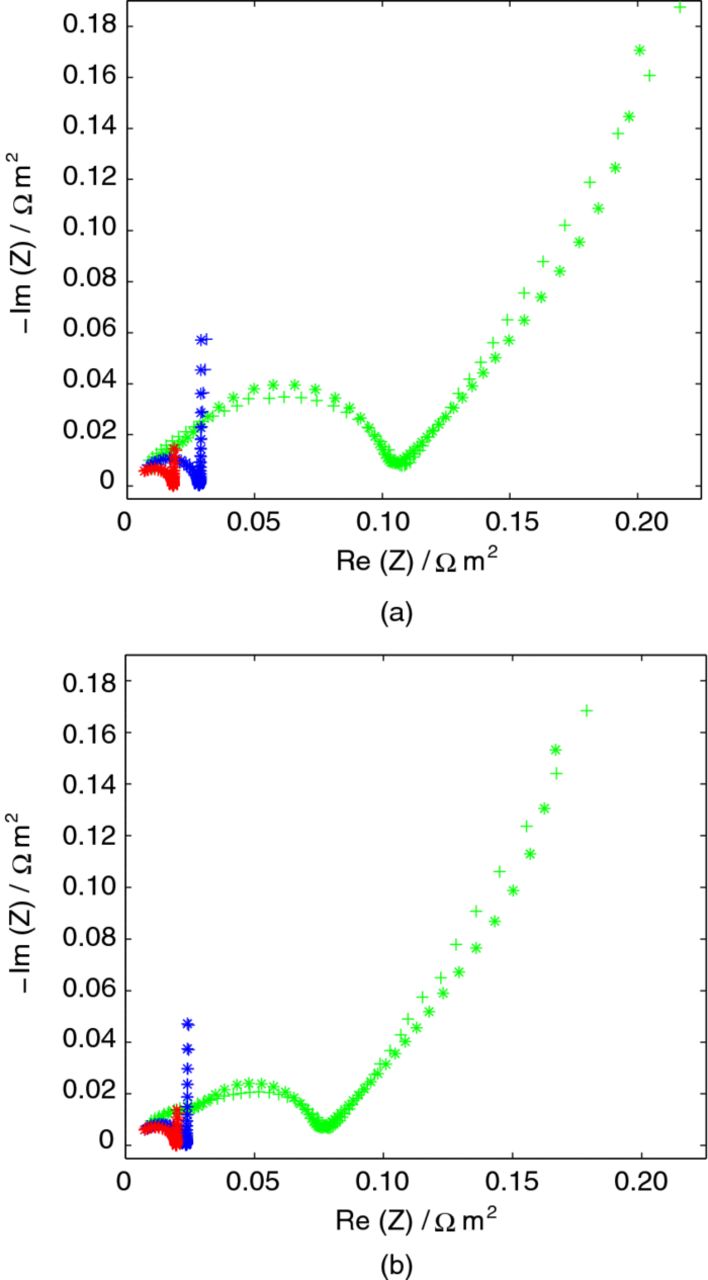
Figure 4. Impedance spectra for frequencies between 1 kHz and 2 mHz for 5, 40, and 100% SOC for the (a) unsized and (b) sized carbon fiber. Notations: (+) experimental and (*) fitted simulated. Colors: green-5% SOC, blue-40% SOC, and red-100% SOC.
EIS model analysis
In order to make the full quantification and identification of the electrochemical properties, and to be able to evaluate the impact of sizing in detail, the model was fitted to measured EIS data at 5, 20, 40, 60, 80, and 100% SOC. The analysis was performed for typical EIS spectra to capture the average behavior of unsized and sized IMS65 fibers. The available parameters describing the electrolyte properties and experimental cell setup are tabulated in Table II. Thus, the optimized parameters were solely related to the fiber and the current collector electrochemical properties, and were the following:
- exchange current density of the fiber, i0
- double-layer capacitance of the fiber, cdl
- diffusion coefficient of the fiber, DS
- slope of the OCP curve, dEOCP/dcS
- contact resistance between the fiber and the current collector, Rcontact,
- capacitance, c'dl, and resistance of the double layer, R'dl, possibly located at the silver paint that connects the fiber with the current collector.
The diffusion coefficient of the fiber, the exchange current density, and the slope of the OCP curve were established as being SOC dependent prior to the optimization from the observed shape of the experimental EIS spectra and the 0.05C polarization curves. However, the contact resistance between the fiber and current collector, the double-layer capacitance of the fiber, and the properties of the double layer at the silver paint needed to be thoroughly tested to establish their SOC dependency. The influence of an 8% radial increase (from 0 to 100% SOC), present in IMS65 PAN-based carbon fibers as recently reported,31 on the superficial fiber parameters (i0 and cdl) could be excluded in this study. The fitting was successful for all studied SOCs and examples of this are shown in Figure 4. Tables III and IV list the optimized parameters for the unsized and sized fiber, respectively.
Table II. Model parameters.
| Parameters | Value | Source |
|---|---|---|
| R / J·mol−1·K−1 | 8.314 | Physical parameter |
| T/ K | 2.95·102 | Physical parameter |
| F / A·s·mol−1 | 9.6487·104 | Physical parameter |
| runsizedfiber / m | 2.575·10−6 | Measured with SEM |
| rsizedfiber / m | 2.600·10−6 | Measured with SEM |
| rsep / m | 4.40·10−4 | Measured |
| L / m | 2.00·10−2 | Measured |
| .CL|0/ mol m−3 | 1.00·103 | Manufacturer data |
 / m2 s−1 / m2 s−1 | 2.70·10−10 | 19 |
 / - / - | 2.01 | 19 |
| .tLi+solv|0 / - | 1.97·10−1 | 19 |
| .κ|0 / S m−1 | 8.10·10−1 | 19 |
 / m3·mol−1 / m3·mol−1 | 6.34·10−5 | 19 |
| εSL/ - | 9.00·10−1 | 20 |
| βSL/ - | 3.44 | 20 |
| σfiber/ S·m−1 | 7.70·104 | Measured, uncycled unsized fiber |
Table III. Optimized unsized carbon-fiber parameters.
| SOC /% → Parameter ↓ | 5 | 20 | 40 | 60 | 80 | 100 |
|---|---|---|---|---|---|---|
| DS / m2 s−1 | 1.29·10−14 | 2.83·10−13 | 9.10·10−13 | 9.40·10−13 | 1.75·10−12 | 3.60·10−12 |
| dEOCP/dcS / V m−3 mol−1 | −5.85·10−5 | −3.60·10−5 | −2.13·10−5 | −1.42·10−5 | −9.04·10−6 | −6.24·10−6 |
| i0/ A m−2 | 1.38 | 3.58 | 4.64 | 4.88 | 5.27 | 5.41 |
| Rcontact/ Ω m2 | 7.80·10−3 | 4.74·10−3 | 4.10·10−3 | 3.68·10−3 | 3.46·10−3 | 3.14·10−3 |
| cdl/ F m−2 | 5.60·10−2 | |||||
| R'dl/ Ω m2 | 4.4·10−2 | |||||
| c'dl/ F m−2 | 4.5·10−2 | 1.1·10−2 | 7.0·10−3 | 6.5·10−3 | 5.5·10−3 | 5.5·10−3 |
Table IV. Optimized sized carbon-fiber parameters.
| SOC /% → Parameter ↓ | 5 | 20 | 40 | 60 | 80 | 100 |
|---|---|---|---|---|---|---|
| DS / m2 s−1 | 1.41·10−14 | 3.00·10−13 | 6.87·10−13 | 6.69·10−13 | 1.89·10−12 | 3.60·10−12 |
| dEOCP/dcS* / V m−3 mol−1 | −6.76·10−5 | −4.22·10−5 | −2.63·10−5 | −1.75·10−5 | −1.05·10−5 | −6.71·10−6 |
| i0/ A m−2 | 0.96 | 2.76 | 3.87 | 5.03 | 5.31 | 5.90 |
| Rcontact/ Ω m2 | 4.20·10−3 | 3.02·10−3 | 2.56·10−3 | 1.86·10−3 | 1.74·10−3 | 1.56·10−3 |
| cdl/ F m−2 | 5.80·10−2 | |||||
| R'dl/ Ω m2 | 4.6·10−2 | |||||
| c'dl/ F m−2 | 3.2·10−2 | 8.5·10−3 | 4.5·10−3 | 4.0·10−3 | 4.0·10−3 | 4.0·10−3 |
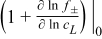
The results show that both the mass transport and exchange current density drops at low SOCs and indicate that the fiber suffers from both poor intercalation kinetics and mass transport when less lithium is present in the fiber structure. This is consistent with the size of the semi-circles (second semi-circle at 5% SOC) and slope of the low-frequency tail, as observed above. The improved electrochemical properties at high SOCs are probably a result of the formation of a more favorable microstructure with lithiation. The proportional change of the diffusion coefficient with SOC corresponds to that of a disordered carbon as suggested by Dokko et. al. for other carbon electrodes.12 In general, PAN-based fibers are considered to have a turbostratic material structure32 that in theory could improve the electrochemical properties as a result of the lithiation-induced volume expansion seen at high SOCs.31 Since the most efficient mass transport and kinetics occur between the interlayer planes (edge plane direction) than perpendicular to the plane (basal plane direction),33,34 it is therefore likely that the edge plane direction will be more accessible for mass transport and intercalation upon volume expansion in the turbostratic structure. The limitation in mass transport with lowered SOC is also consistent with several previous studies were other carbon materials have been studied using EIS.12,14 Earlier single-fiber studies performed on another type of PAN-based material showed variation with SOC as well, and the diffusion coefficient was in the same order of magnitude. However, the method of analysis and variation with SOC differed.10,11 The exchange current density is more sparsely investigated for carbon materials, but has been found to vary with SOC in a study using a similar method.14,17 The values describing the mass transport and intercalation kinetics display that the single fiber seems to have beneficial electrochemical properties compared to other carbon materials investigated with the same method. For instance, compared to MCMB graphite15 and MAG-10 graphite14 the diffusion coefficient is several orders of magnitude higher for the fiber.
The double-layer capacitance of the fiber agrees with what has been observed for other carbon materials12,14,15,35 and was found to change very little with SOC12 and was therefore set as SOC independent in the optimization. The change in contact resistance between the fiber and current collector with SOC could be a result of the volume change of the fiber, as the volume increases and contact resistance decreases with lithiation. This could also be caused by a SOC-dependent electronic conductivity, which is investigated later in this paper. The double layer of the silver paint, which was the most probable process to capture the shape of the semi-circle at high frequencies and the first semi-circle in the spectrum at 5% SOC (see Electronic conductivity investigation), was intentionally set to differ as little as possible with SOC, as it realistically should be present to the same extent in all measurements. The SEI layer, which is most likely present on the fiber surface, was concluded to not affect the EIS spectra to a noticeable extent or generating any additional semi-circles. Studies have shown the SEI layer to mainly be of significance in relation to aging of carbon materials14,15,36 and that it primarily affects the semi-circle connected to the impedance of the charge-transfer resistance in many types of materials.15,17,26,37
From the optimized parameters, the most distinguishable difference between the sized and unsized fibers is observed in the exchange current density below 60% SOC as displayed in Figure 5. The maximum difference is 30% lower exchange current density for the sized fiber compared to the unsized one at 5% SOC, indicating slightly better kinetics in the latter one. The diffusion coefficients are strikingly similar, indicative of the sizing process not affecting the microstructure and thus not the mass transport within the fiber. The slight variation in contact resistance, Rcontact, is likely connected to the manufacturing of the cell and the same applies for the presumable impact of the silver paint (c'dl and R'dl). The sizing does not seem to influence the double-layer capacitance of the fiber surface. From Figure 3, the sizing seem to have little influence on the electrochemical performance, implying that, at least for low current-loads, the observed variations in exchange current density are insignificant. However, previous research3,4 has shown sizing to have a negative effect on the electrochemical performance of fiber tows. Thus, sizing seems to have a larger impact on tow level and should maybe therefore be considered as a tow property. A likely explanation is that sizing affects the porous structure of the tow in manner that disfavors the electrolyte mass transport to the surfaces of the fibers.
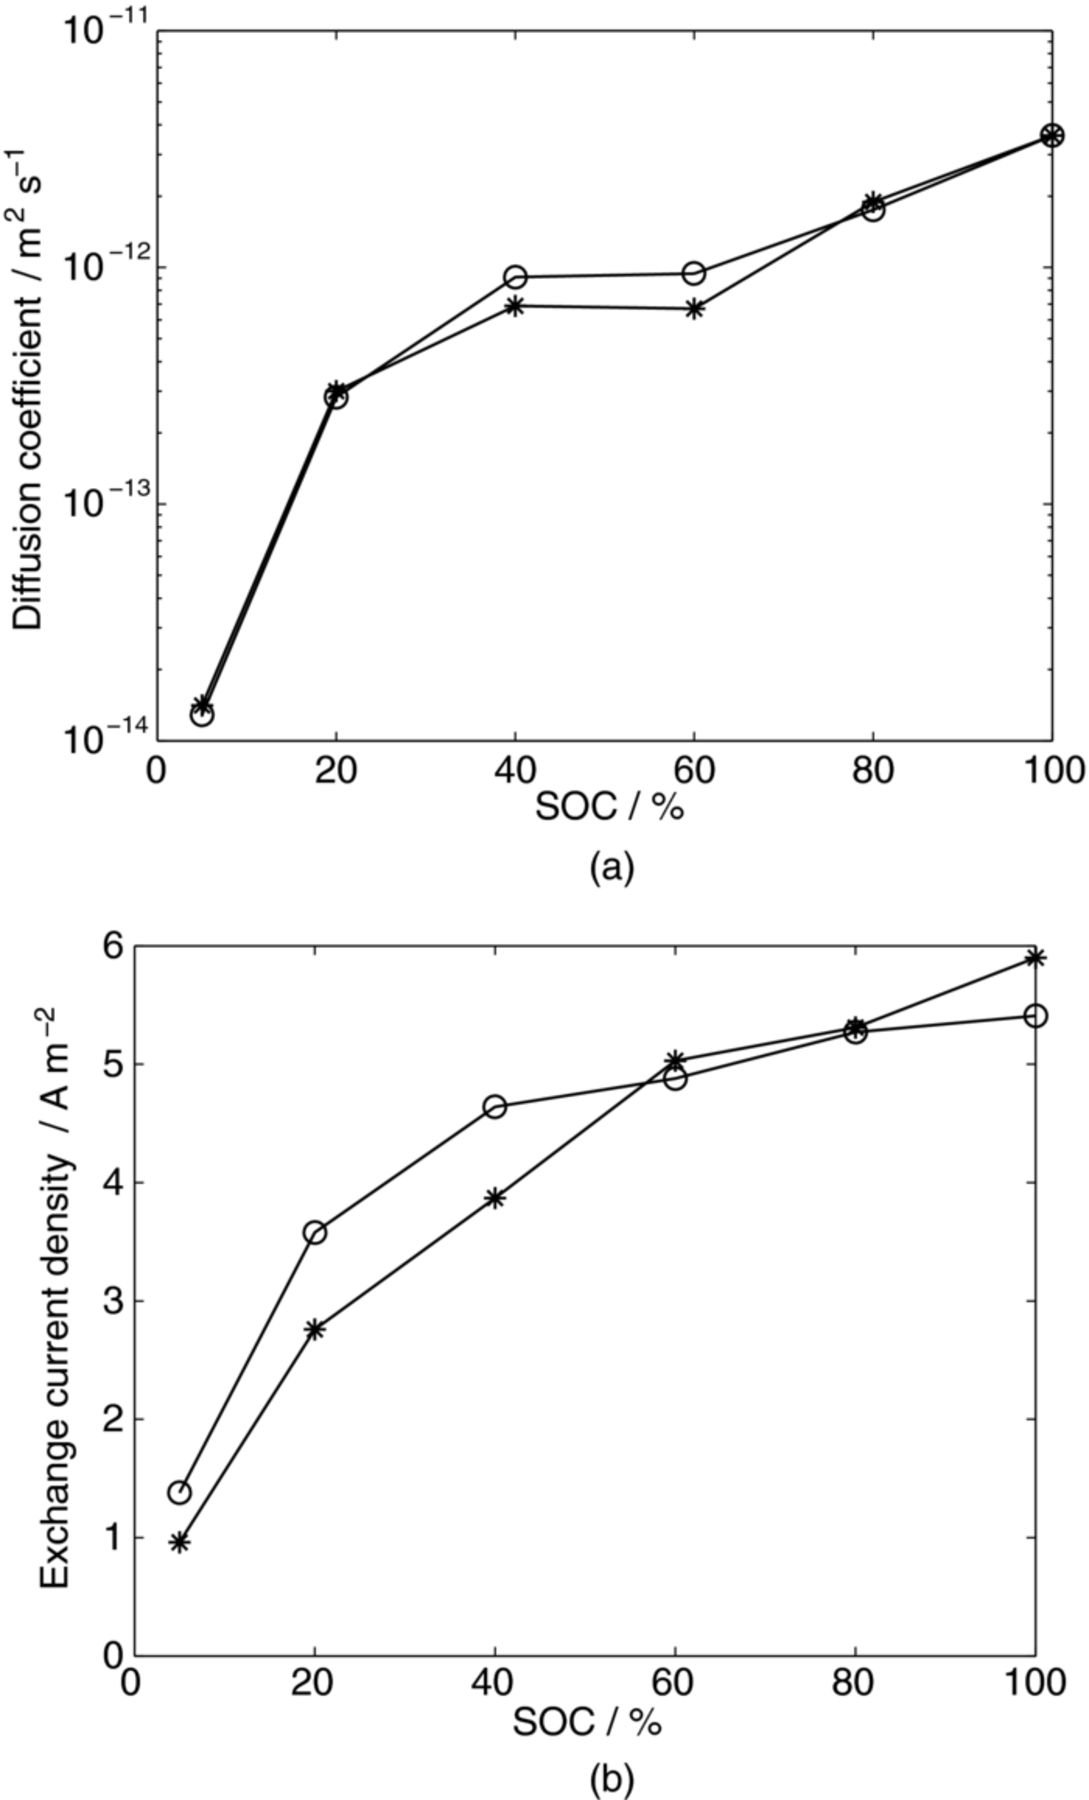
Figure 5. Optimized a) solid-phase diffusion coefficient and (b) exchange current density for unsized and sized IMS65. Notations: (o) unsized IMS65 and (*) sized IMS65.
Electronic conductivity investigation
The electronic conductivity measurements show a decrease in conductivity with lower SOC. A conductivity of 7.7·104 Sm−1 (ρ = 1/σ = 1.3·10−5 Ωm) was measured for an uncycled fiber. For a cycled fiber, the conductivity show SOC dependence and was 1.7·105 Sm−1 (5.9·10−6 Ωm) at 100% SOC and 6.2·104 Sm−1 (1.6·10−5 Ωm) at 5% SOC. The obtained data are in line with manufacturer data specifications (Table I), and the magnitude portrays a microstructure consisting of disordered carbon.38
Low electronic conductivity could result in an uneven current distribution foremost along the length of the fiber, and could in theory produce an EIS semi-circle having a more elongated (depressed) shape, which is most strikingly observed at 5% SOC. In order to investigate whether it is the additional double layer at the silver paint and not the current distribution causing the depressed semi-circle, the electronic conductivity and current distribution along the fiber length was theoretically tested (see Appendix
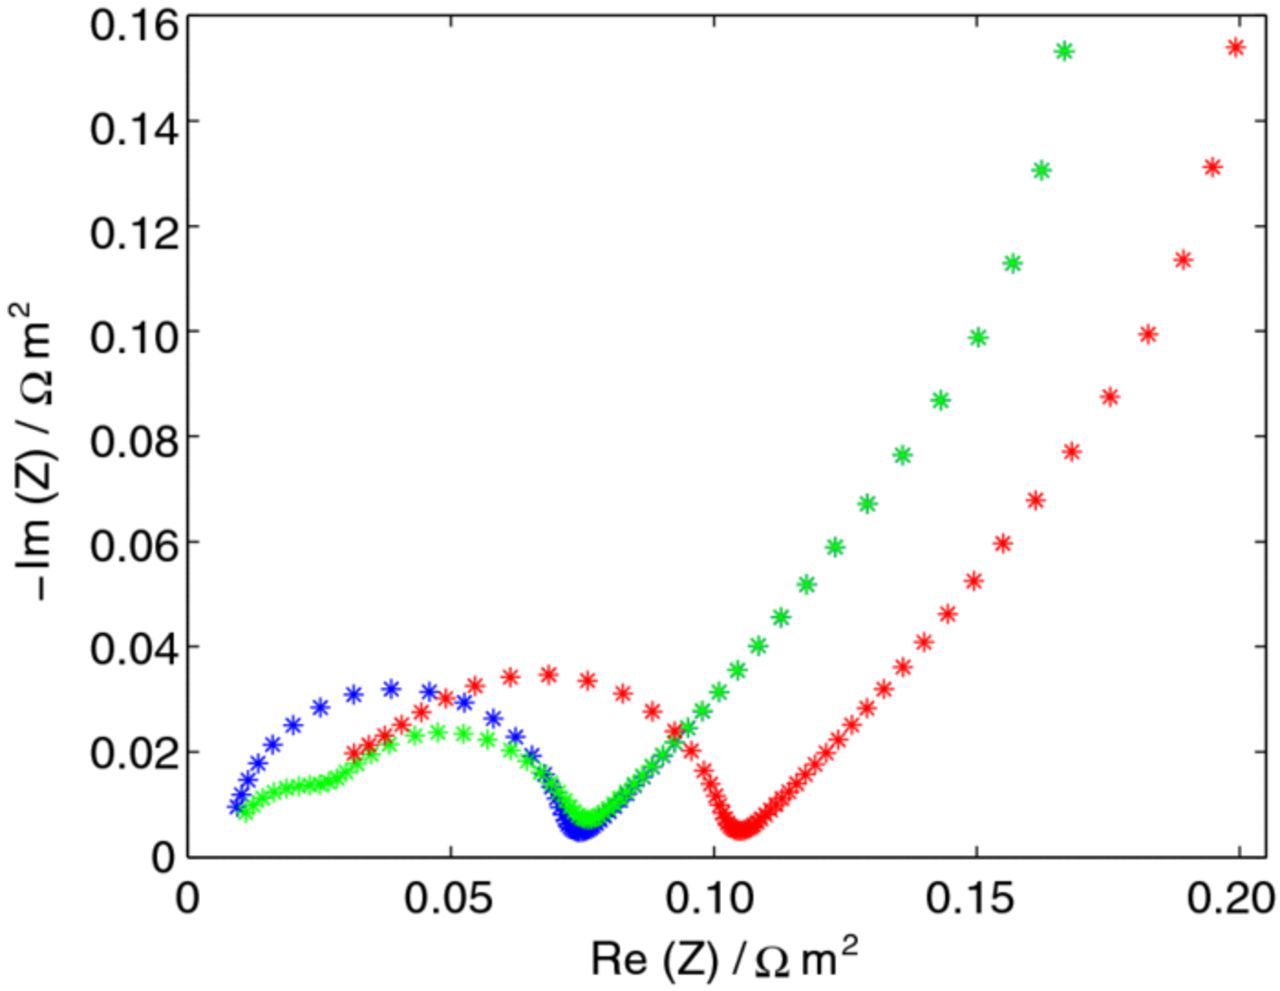
Figure 6. Simulated impedance spectra for frequencies between 1 kHz and 2 mHz at 5% SOC for the unsized carbon fiber. Plots: Fitted spectrum (green*). Spectrum when removing the additional double layer at the silver paint and accounting for current distribution along the carbon fiber length and using either the uncycled (7.7·104 Sm−1) or cycled 5% SOC electronic conductivity 6.4·104 Sm−1 (blue*) and 0.2 Sm−1 electronic conductivity (red*).
Model validation
The parameters can be validated for higher discharge (lithiation) currents with the model solved over time. In Figure 7, the experimental and simulated 0.5C discharge curves are shown as an example. The extracted parameters seem to describe the processes within the system quite well. However, at lower SOCs the polarization is slightly underestimated in the model. This could partly be related to the pronounced uneven hysteresis below 40% SOC observed in Figure 3. As indicated by the extracted physical parameters the fibers should perform well in an electrochemical system, i.e. the fiber is likely to contribute little to the polarization if utilized as electrode material. In Figure 7, the simulated 5C discharge curve without the contact resistance, Rcontact, illustrate that so is the case. Even for this high current-load the polarization increases only about 0.1 V compared to the 0.05C discharge. The impact of sizing was also investigated for the high (5C) current load. It was found that the electrochemical performance was unaffected by the sizing (c.f. dashed magenta line, sized fiber, and blue solid line, unsized fiber, Figure 7). This demonstrates again that although the exchange current densities vary slightly, the differences are too small to affect the performance.
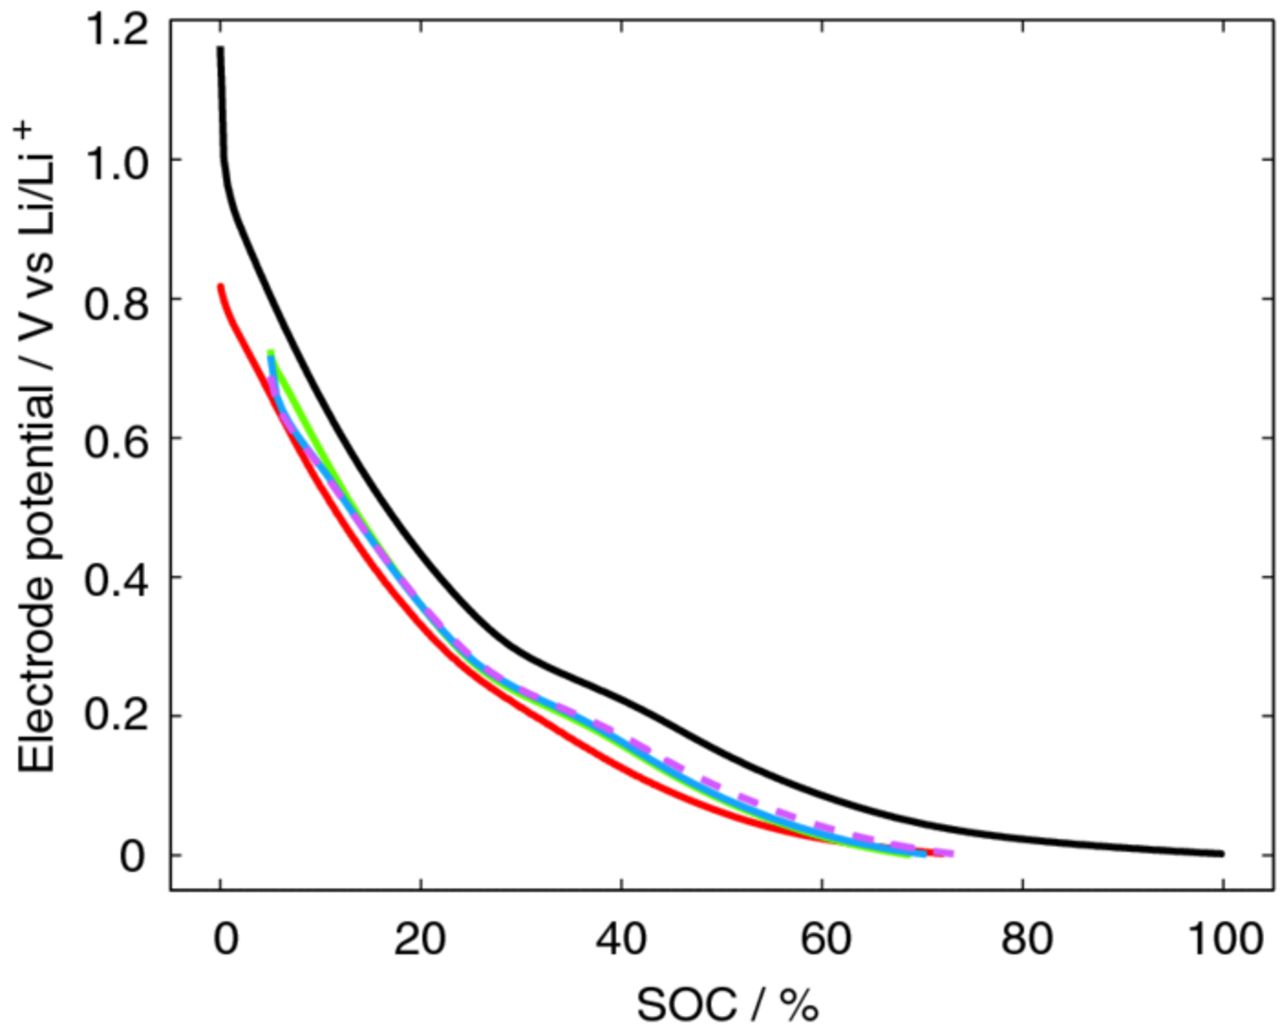
Figure 7. Simulated unsized fiber lithiation at 0.5C (solid green line) and 5C without contact resistance (solid blue line). Measured unsized fiber lithiation at 0.5C (solid red line) and 0.05C (solid black line). Simulated sized fiber lithiation at 5C without contact resistance (dashed magenta line).
Conclusions
The study has investigated the IMS65 PAN-based carbon fiber (unsized and sized), as an intended part of a structural battery, from an electrochemical point of view. To fully characterize the lithium intercalation processes electrochemically, experimental and modeling work was combined.
- Two cell designs were constructed that allowed for the determination of the intrinsic electrochemical properties in a microelectrode system. The first design utilized only well-characterized separator and electrolyte components together with a fiber and an over-sized lithium-foil counter electrode. This design enabled EIS measurements of the fiber at targeted SOCs (5, 20, 40, 60, 80, and 100% SOC) and facilitated the EIS model analysis. The second cell accommodated electronic conductivity measurements on a single fiber.
- A physics-based EIS model was successfully setup over the experimental cell and served as an efficient analysis tool, as it was able to capture the measured impedance response at all SOCs studied. The model could also be expanded to examine the influence of current distribution along the length of the carbon fiber on the EIS spectra.
From the EIS model analysis and the measured electronic conductivity the following could be concluded:
- Single IMS65 Carbon fibers have beneficial electrochemical properties compared to other carbon materials investigated with the same method.
- A strong SOC dependence was seen in the mass transport and kinetic (exchange current density) properties, as well as electronic conductivity.
- Sized IMS65 fibers may be considered to have the same electrochemical performance as an unsized fiber, although the properties, foremost the exchange current density, varies slightly.
- The electronic conductivity even for the lowest measured SOC was shown to be good and did not affect the current distribution and impedance.
- The extracted parameters could be validated against a lithiation current of 0.5C.
- The mass transport, exchange current density and electronic conductivity were improved for higher SOCs. The mass transport described by the solid-phase diffusion coefficient increased from 1.29·10−14 m2 s−1 (5% SOC) to 3.60·10−12 m2 s−1 (100% SOC), the exchange current density from 1.38 A m−2 (5% SOC) to 5.41 A m−2 (100% SOC), and the electronic conductivity from 6.2·104 S m−1 (5% SOC) to 1.7·105 S m−1 (100% SOC).
Acknowledgment
Funding by the Swedish Foundation for Strategic Research (SSF), framework grant RMA08–0002, and the SHC - Swedish Hybrid Vehicle Center are gratefully acknowledged.
: Appendix A. Model Equations
The model equations become the following after the transformation procedure:15,25–29
The lithium-ion concentration in the electrolyte is, according the concentrated solution theory,20,24 expressed as
![Equation ([A1])](https://content.cld.iop.org/journals/1945-7111/160/9/A1473/revision1/jes_160_9_A1473eqn4.jpg)
where the subscript L denotes electrolyte phase, r the radial axis, j is the imaginary unit, ω the angular frequency [rad s−1], ε the volume fraction, VLiPF6m the molar volume of the electrolyte salt, β the Bruggemann constant, DLis the diffusion coefficient of the electrolyte salt with respect to the thermodynamic driving force, 1 + ∂ln f±/∂ln cL is the thermodynamic enhancement factor, cL, tot is the total concentration of charged species, csolv the concentration of the solvent, tLi+solv the transport number with respect to the solvent,  the current density and F Faraday's constant. The subscript 0 denotes a parameter that is defined at equilibrium, i.e. initial conditions, and is assumed to be constant during the perturbation.
Consequently, the potential in the electrolyte varies according to
![Equation ([A2])](https://content.cld.iop.org/journals/1945-7111/160/9/A1473/revision1/jes_160_9_A1473eqn5.jpg)
where κ is the ionic conductivity of the electrolyte, R the universal gas constant, and T the temperature.
In the carbon fiber a variation in the lithium-ion concentration occurs, which is expressed as
![Equation ([A3])](https://content.cld.iop.org/journals/1945-7111/160/9/A1473/revision1/jes_160_9_A1473eqn6.jpg)
where DS is the diffusion coefficient in the fiber.
It was assumed that due to the good electronic conductivity of the fiber; there is no radial change in solid-phase potential.
Appendix. Surface details carbon fiber
The lithium ions either react electrochemically into the fiber or charge a double-layer on the surface of the fiber. The current density in the electrolyte at the fiber surface,  , accounts for the current that is exchanged between the electrolyte in the separator and the fiber. The current will depend on both a faradaic current due to the electrochemical reaction and a current due to charging of a double-layer and is expressed as
![Equation ([A4])](https://content.cld.iop.org/journals/1945-7111/160/9/A1473/revision1/jes_160_9_A1473eqn7.jpg)
where  is the faradaic and
  the double-layer current density.
The faradaic current density is described the Butler-Volmer equation, which is defined as
![Equation ([A5])](https://content.cld.iop.org/journals/1945-7111/160/9/A1473/revision1/jes_160_9_A1473eqn8.jpg)
where i0 is the exchange current density, αa and αc the anodic and cathodic transfer coefficients, and EOCP is the superficial open-circuit potential fiber. The Butler-Volmer equation is linearized in a limited first order series expansion.30 Consequently, each term in the expansion corresponds to the derivative of the expression describing the dependent variable (eqs. A1–A3, A5) while keeping the rest of the variables constant, as given in the following expression
![Equation ([A6])](https://content.cld.iop.org/journals/1945-7111/160/9/A1473/revision1/jes_160_9_A1473eqn9.jpg)
where
![Equation ([A7])](https://content.cld.iop.org/journals/1945-7111/160/9/A1473/revision1/jes_160_9_A1473eqn10.jpg)
![Equation ([A8])](https://content.cld.iop.org/journals/1945-7111/160/9/A1473/revision1/jes_160_9_A1473eqn11.jpg)
and
![Equation ([A9])](https://content.cld.iop.org/journals/1945-7111/160/9/A1473/revision1/jes_160_9_A1473eqn12.jpg)
where dEOCP/dcS is the slope of the OCP curve.
The current in the double layer on the fiber is formulated as
![Equation ([A10])](https://content.cld.iop.org/journals/1945-7111/160/9/A1473/revision1/jes_160_9_A1473eqn13.jpg)
where cdl is the double-layer capacity.
Appendix. Current-collector contact variations and additional double layer
Variations in contact between the carbon fiber and the current collector with SOC are likely to exist due to variations in the electronic conductivity of the fiber itself (see Results and discussion) and to the observed changes in fiber volume with lithiation.31 The model accounts for the possible inadequate contact between the current collector and fiber as described by23,29,39
![Equation ([A11])](https://content.cld.iop.org/journals/1945-7111/160/9/A1473/revision1/jes_160_9_A1473eqn14.jpg)
where φcc is the solid-phase potential at the current collector, icell the total current density perturbation in the cell, and Rcontact the resistance between the current collector and the fiber.
An indication of a second semi-circle is visible at high frequencies especially at low states-of charge. One probable origin, as the electronic conductivity was considered to be good (see Results and discussion, Appendix B), is that the electronically conductive silver-paint used to connect the carbon fiber to the current collector could create a double layer especially when the contact between the fiber and current collector is poor. The double layer has an electric potential that is lower than that of the fiber, as the contact between the silver paint and fiber may be considered to be low. The impedance of this double layer, with a capacitance denoted cdl' is assumed to be in series with the impedance of this contact resistance, R'dl, and these are put in parallel to the impedance of the fiber (the contact between the fiber and current collector excluded) to model the impact of the silver paint.
Appendix. Boundary conditions
All boundary conditions used are listed in Table A1 and the necessary coordinates are found in Figure 2. The solid-phase potential in the current collector was set to zero as a reference. The current density in the electrolyte is equal to the sum of faradaic and double-layer current at the surface of the fiber and total current density perturbation in the cell,  , at the lithium-foil counter electrode. The lithium-ion concentration in the electrolyte is determined by assuming zero anion flux onto the fiber surface and lithium-foil. For the lithium-ion concentration in the fiber, symmetry is set at the center of the fiber and a flux equal to the amount of lithium ions that is electrochemically reacting, i.e. faradaic current flux, at the surface of the fiber.
Table A1. Boundary conditions.
| Boundary settings | ||
|---|---|---|
| Dependent variable | Boundary | Expression |
 | r = rfiber | 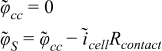 |
 | r = rfiber | 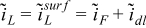 |
| r = rfiber + rsep | 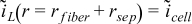 | |
 | r = rfiber and r = rfiber + rsep | 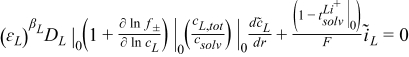 |
 | r = 0 |  |
| r = rfiber | 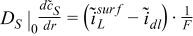 | |
: Appendix B. Implementation of Current Distribution along the Fiber Length
The large aspect ratio of the fiber, i.e. the length being ∼4000 times longer than the fiber diameter, could in theory result in an uneven current distribution along the fiber length if the electronic conductivity is limiting. An analytical expression accounting for this was set up to investigate whether the electronic conductivity causes an uneven current distribution along the length within the fiber and to determine if any observed elongated (depressed) semi-circle behavior in the EIS measurements is linked to current distribution or an additional double layer within the experimental cell setup.
The impedance that is numerically calculated as the cell impedance,  (eq. 2), does not account for any current distribution along the thin carbon fiber and assumes the same impedance locally at any point along the carbon fiber length, z,
  . Using the approach used by Lundqvist and Lindbergh,40 the current distribution can be modeled by relating to the differentiated current (along the fiber length, z direction) within the fiber,
  , and the total overpotential,
  , for the fiber with the following expression
![Equation ([B1])](https://content.cld.iop.org/journals/1945-7111/160/9/A1473/revision1/jes_160_9_A1473eqn15.jpg)
where L is the length of the carbon fiber and the apostrophe denotes the local impedance with the contact resistance between the current collector and the fiber excluded.
The twice differentiated form of the overpotential can be substituted into eq. B1 and is, assuming that a current distribution only arises in the fiber phase of the cell, expressed as
![Equation ([B2])](https://content.cld.iop.org/journals/1945-7111/160/9/A1473/revision1/jes_160_9_A1473eqn16.jpg)
where σfiber is the electronic conductivity of the fiber.
Substituting eq. B1 into eq. B2 gives the following equation
![Equation ([B3])](https://content.cld.iop.org/journals/1945-7111/160/9/A1473/revision1/jes_160_9_A1473eqn17.jpg)
The analytical solution to eq. B3 has the general solution
![Equation ([B4])](https://content.cld.iop.org/journals/1945-7111/160/9/A1473/revision1/jes_160_9_A1473eqn18.jpg)
where
![Equation ([B5])](https://content.cld.iop.org/journals/1945-7111/160/9/A1473/revision1/jes_160_9_A1473eqn19.jpg)
The constants A and B are extracted with the following boundary conditions: Only the local impedance is present in the fiber closest to the current collector, i.e. no contribution from the solid phase of the fiber, and no current density at the point furthest away from the current collector. These are expressed as
![Equation ([B6])](https://content.cld.iop.org/journals/1945-7111/160/9/A1473/revision1/jes_160_9_A1473eqn20.jpg)
![Equation ([B7])](https://content.cld.iop.org/journals/1945-7111/160/9/A1473/revision1/jes_160_9_A1473eqn21.jpg)
The derived constants are expressed as
![Equation ([B8])](https://content.cld.iop.org/journals/1945-7111/160/9/A1473/revision1/jes_160_9_A1473eqn22.jpg)
![Equation ([B9])](https://content.cld.iop.org/journals/1945-7111/160/9/A1473/revision1/jes_160_9_A1473eqn23.jpg)
For an applied current of  at the current collector, z = 0, the total impedance of the system
  when accounting for the current distribution in the fiber is calculated as
![Equation ([B10])](https://content.cld.iop.org/journals/1945-7111/160/9/A1473/revision1/jes_160_9_A1473eqn24.jpg)
where the term  represents the reintroduction of the impedance due to resistance between the fiber and current collector.
: Appendix C. List of Symbols
| c | concentration [mol m−3] |
| cdl | double-layer capacitance per fiber surface area [F m−2] |
| DL | diffusion coefficient with respect to the thermodynamic driving force in the electrolyte [m2 s−1] |
 | apparent diffusion coefficient in the electrolyte 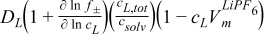 [m2 s−1] [m2 s−1] |
| DS | diffusion coefficient in the fiber [m2 s−1] |
| EOCP | open-circuit potential at the fiber surface [V] |
| F | Faraday's constant, 96487 [As mol−1] |
| i0 | exchange current per fiber surface area [A m−2] |
| icell | total current density in the experimental cell [A m−2] |
| idl | double-layer current per fiber surface area [A m−2] |
| iF | faradaic current per fiber surface area [A m−2] |
 | imaginary operator |
| j | imaginary unit,  |
| n | arbitrary parameter |
| r | radial distance [m] |
| R | universal gas constant, 8.3143 [J mol−1 K−1] |
 | real operator |
| Rcc | resistance between current collector and fiber per contact area [Ω m2] |
| tLi+solv | transport number of Li+ with solvent as reference [-] |
| T | temperature [K] |
| VLiPF6m | molar volume lithium hexafluorophosphate salt [m3 mol−1] |
| Z | impedance [Ω m2] |
 | thermodynamic enhancement factor |
| α | transfer coefficient [-] |
| β | Bruggeman constant [-] |
| ε | volume fraction [-] |
| κ | ionic conductivity of the liquid (electrolyte) phase [S m−1] |
| σ | electronic conductivity fiber [S m−1] |
| φ | electric potential [V] |
| ω | angular frequency [rad s−1] |
Subscripts
| a | anodic |
| c | cathodic |
| cell | cell |
| dl | double layer |
| exp | experimental |
| fiber | fiber |
| L | liquid (electrolyte) phase |
| sep | separator |
| sim | simulated |
| solv | solvent |
| surf | at the surface of the fiber |
| tot | total |
| |0. | at initial condition (i.e. not perturbed) |