Abstract
The scanning vibrating electrode technique (SVET) was employed to examine the effect of 'galvanic throwing power' and the distance over which a Mg-rich primer (MgRP) provided sacrificial anode-based cathodic protection to AA2024-T351. Three systems were investigated in full immersion conditions where the same MgRP was used with three different pretreatments: Non-film forming (NFF), trivalent chromium pretreatment (TCP) and anodization with a chromate seal (ACS). Experiments were conducted with two coating/defect area ratios and three parameters were monitored: 1) the maximum peak height of local anodes, inferring the location and intensity of pits, 2) the current density profile at the coating/defect interface (CDI) region and 3) total integrated anodic and cathodic current density values of defined areas in the defect region moving progressively away from the CDI. The NFF-based system was shown to provide the superior galvanic throwing power and a quasi-steady-state galvanic current distribution was detected in the defect region adjacent to the CDI indicating enhanced cathodic activity in response to the MgRP. High resistance between the MgRP and the substrate, due to the thickness of the pretreatment layer, appeared to mediate galvanic interactions in the case of TCP and ACS-based systems.
Export citation and abstract BibTeX RIS

This is an open access article distributed under the terms of the Creative Commons Attribution 4.0 License (CC BY, http://creativecommons.org/licenses/by/4.0/), which permits unrestricted reuse of the work in any medium, provided the original work is properly cited.
Aerospace aluminum alloys are highly susceptible to localized corrosion due to their heterogeneous nature.1 They rely on multilayered coatings to provide barrier protection, active corrosion protection and other specialized functions.1 Over the past few years, a commercial organic coating system containing a Mg-rich primer (MgRP) has been developed for the active corrosion protection of aerospace aluminum alloys.2–17 The commercial MgRP coating system consists of a surface pretreatment, an epoxy resin with metallic Mg pigment and, where applicable, a polyurethane topcoat. The active corrosion protection of any Al alloy is provided by galvanic coupling of more active Mg pigment in the primer which is active compared to the more noble AA2024-T351 substrate. This approach has been well established and widely reported in the design of zinc-rich primers for use on various steels.18–24 The galvanic protection potential is usually dictated by mixed potential theory and mediated by various electrical/ionic resistances between the anode and cathode such as: polymer barrier properties of the MgRP, pretreatment resistances, electrolyte chemistry, electrolyte thickness and geometry, and anode/cathode ratio.9,10 Barrier protection is afforded by the MgRP itself and also the pretreatment layer.11 Furthermore, the pretreatment may provide additional corrosion protection by the release of anionic species that inhibit both anodic and cathodic kinetics of AA2024-T351.25–32 However, the pretreatment may limit or delay sacrificial protection function of MgRP by adding electrical resistance between the anode and the cathode.4–6
Previous work on rare element-based corrosion-resistant metallic coatings has established how multi-function coatings with various modes of corrosion protection, such as sacrificial anode protection and inhibitor release can simultaneously provide barrier protection as well as active corrosion protection.33–35 One critical issue in active protection is the capacity of the reservoir of chemical inhibitor and its release characteristics.33–35 Another critical issue in active corrosion protection systems is determining the distance over which a coating can provide corrosion protection.7–12 The distance over which an active corrosion protection system can protect a scratch or a defect exposing a bare metal surface is termed 'throwing power'.9,10 The corrosion protection of a defect might be either by galvanic (sacrificial protection) or chemical (inhibitor release/redeposition) and both have their own throwing power.
The 'galvanic throwing power' of Mg on AA2024-T351 has been previously studied using multi-electrode arrays (MEA) and finite element analysis (FEA).9,10 The role of electrolyte chemistry and thickness, environmental wet-dry cycling, polymer resistances and Mg pigment depletion on the galvanic throwing power has been elucidated by both approaches.9,10 FEA successfully predicted that increasing the NaCl solution concentration by an order of magnitude increased the galvanic current density over the AA2024 by almost one order of magnitude. Increased electrolyte layer thickness resulted in less ohmic drop through the electrolyte and allowed greater cathodic polarization of the AA2024-T351 to a lower Ecouple which produced greater cathodic current densities at the far geometrical limit of the AA2024-T351 in the model.9,10 This is an indication of increased throwing power under thicker electrolyte layers, when other conditions were held constant.9,10 Regarding polymer resistance, it was found that the ionic resistance of the added polymer layer over the Mg electrode significantly mediated the galvanic current passing between anodes and cathodes and, when large enough, completely prevented the galvanic coupling of the electrodes altogether.9,10
Galvanic systems have been studied previously using MEA, FEA and post-exposure corrosion volume loss characterization to study throwing power and defect protection. In microelectrode arrays, wires of systems of interest are mounted in an epoxy matrix and galvanic current distribution between the wires are studied using zero resistance ammeters (ZRAs). However, limitations include the inability to study localized corrosion such as pitting in a continuous bare substrate as a flush mounted array of electrodes made from wires is limited by wire dimensions.9 The effect of a resistive pretreatment layer on galvanic interaction between metal-rich primer and the bare defect is also difficult to determine using these techniques. The FEA approach will not be able to account for transients as it calculates galvanic current and potential from steady state boundary conditions given by static E-I kinetics suitable for stable galvanic couples. Furthermore, volume loss measurement would not be able to account for real time galvanic interactions. In this work, an in-situ scanning vibrating electrode technique (SVET) was utilized to follow the location and intensity of current density (j) distributions of unpolarized AA2024-T3 in aqueous environments in the presence of a MgRP with an artificial defect. SVET has been previously used to elucidate localized corrosion and its inhibition for steel, magnesium and aluminum substrates using organic and inorganic inhibitors.36–43 The main advantage of using in-situ SVET over conventional electrochemical and non-electrochemical techniques is that it is capable of analyzing both the net anodic and cathodic behavior of the primer/defect galvanic couple and the local anodic activity associated with AA2024 micro-galvanic couples. The suppression of corrosion at artificial defects on AA2024 is somewhat different than that for a conventional galvanic couple in a stationary electrochemical system where anodic and cathodic kinetics are static with time. As such, the aim of this current study is to utilize SVET to semi-quantitatively assess the galvanic throwing power at an artificial defect of three pretreated MgRP systems on a AA2024-T351 substrate when fully immersed in NaCl(aq) solution. The greatest value of local anodic maxima (inferring the location and intensity of pits), the local current density profile at the coating/defect interface (CDI) region and the total integrated anodic and cathodic current density values of defined areas in the defect region moving progressively away from the CDI are presented.
Experimental
Materials
AA2024-T351 sheets of 1.6 mm thickness were pretreated with 3 different surface pretreatments. The first is Prekote, a non-film forming chromate-free surface pretreatment supplied by Pantheon containing approximately 95% water and less than 3% each of diethylene glycol monobutyl ether and N-methyl-2-pyrrolidone (NMP). This pretreatment will be referred to as non-film filming (NFF) from here onwards. The second is a trivalent chromium based pretreatment (TCP) SurTec 650, supplied by SurTec. This coating is a fluozirconate-based conversion coating with an enrichment in Cr3+ compounds such as Cr2O3 and Cr(OH)3 and a dry film thickness of 0.4 μm. The third pretreatment is anodization with hexavalent chromium sealing (ACS) with a dry film thickness of 8.9 μm. For anodization pretreatments, a thin-film sulfuric acid anodizing, MIL-A-8625F: Type II pretreatment procedure was followed.36 Pretreatment thicknesses were measured using SEM-EDS, the details of this are given elsewhere.6
The Mg-rich primer and Topcoat were both provided by Akzo Nobel Coatings (Waukegan, Illinois). The Mg-rich primer consists of one part epoxy matrix with Mg metal flake pigment of a diameter 20 μm with pigment volume concentration of 45 % (3rd generation 2100P003, Lot: 493-190) and a dry film thickness of 40 μm. The topcoat was an Aerodur 5000 High-performance Advanced Coating with 50 μm dry-film thickness, (ECM-G7875) a gloss white finish, two component polyurethane topcoat developed for military application in variety of exposure environments.44
Sample preparation
A large size defect (2.5 cm × 2.5 cm) was created on the coated samples by laser ablation. Samples were irradiated with a KrF excimer laser (λ = 248 nm, 25 ns full width at half maximum) at a repetition rate of 10 Hz and a fluence of 2 Jcm−2. All specimens were rastered using a Newport† linear actuator for a total irradiation 16–20 laser pulses per area (PPA) for the pretreatment/primer only systems and 24–28 PPA for topcoated system and a 90% overlap with a cylindrical-shaped spot size of 0.6 mm × 29 mm. The details of the equipment setup for laser ablation are reported elsewhere.45,46 A laser-pulse intensity was selected such that only the first 10 μm of the surface would be effected in order to minimize any effect of laser ablation on the microstructure. To further minimize any laser effects, the PPA were optimized for each system in such a way that the intact coating was not completely removed, leaving a few microns of intact coating on the surface. This remaining coating was removed by mechanical polishing to expose the original, unaffected AA2024-T351 microstructure. The specimens were ground to a 240 grit finish to leave a rough sample to accelerate localized corrosion. An area of ca. 10 mm ×10 mm (the exact size of which was noted in each case) was isolated in the center of the bare AA2024-T351 for control experiments. The two coating/defect ratio (CDR) configurations used in experiments are given in Figure 1. An insulating extruded PTFE self-adhesive tape was used to isolate the scan area for exposure.
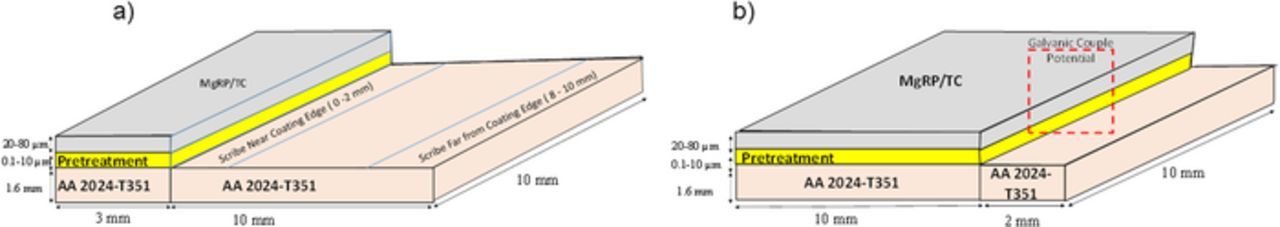
Figure 1. Sample coating/defect area ratio (CDR) configurations (a) 0.3 and (b) 5. The full area shown here was exposed to full immersion conditions in 2 M NaCl(aq) for open circuit potential measurements and SVET experiments. For the latter the full area was scanned to obtain current density distributions.
Laboratory full immersion exposures of pretreated AA2024-T351 coated with MgRP and topcoat
The global galvanic protection potential of intact coating systems, galvanic couple potential at the defect and barrier properties of intact coating system were monitored using open circuit potential (OCP) measurements and electrochemical impedance spectroscopy (EIS). All full-immersion studies reported herein were conducted in quiescent 2 M NaCl(aq) (pH: 6.9 ± 0.4) open to laboratory air. Potential control during electrochemical experiments was maintained using a Gamry Potentiostat† (Ref 600/ PCI4) or Biologic Potentiostat with computer interface software. A saturated calomel electrode (SCE) and Pt mesh were used as reference and counter electrode, respectively. A typical EIS scan was acquired in swept sine mode from 100 kHz to 0.01 Hz with six points per decade. Coated panels with intact coatings exhibiting high impedance were scanned with an AC amplitude of 80 mV to 100 mV to reduce noise. The tests were conducted in quiescent 2 M NaCl, as discussed, after 1 h exposure at open circuit for bare/pretreated/MgRP coated panels. The experiments were conducted at different full immersion exposure times for a total time duration of 36 hours to track global galvanic protection potential and barrier properties of the coatings. All of these experiments were conducted in the intact region. In a separate experiment, the galvanic protection potential was also monitored for samples with an artificial defect (which will be referred to as 'galvanic couple potential' for such systems) for two different CDR configurations as indicated in Figure 1. The laboratory full immersion study for chosen pretreatments/MgRP with/without topcoat has been studied extensively and the scatter and reproducibility are reported in our previous work.4–8
Scanning vibration electrode technique (SVET)
Scanning vibrating electrode measurements were carried out using an SVET probe comprising a 125 μm diameter platinum wire sealed in a glass sheath, so that the active portion of the probe tip consisted of a 125 μm diameter platinum micro-disc electrode with a total tip diameter of ∼250 μm. The probe vibration frequency was 140 Hz and the peak-to-peak vibration amplitude (App), as measured stroboscopically in air was 30 ±5 μm. Movement of the SVET probe-vibrator assembly was achieved using three orthogonal linear bearings driven by stepper motors (Time and Precision Ltd). The SVET voltage signal was detected using a Perkin Elmer 7265 lock-in amplifier and subject to digital signal averaging (typically of 10 successive measurements) to further enhance signal-to-noise ratio. A full description of SVET probe/vibrator assembly design, along with details on probe surface preparation and reference electrode type are given elsewhere.43 Details of SVET calibration are also reported elsewhere.43 In brief, by Ohm's law, the peak-to-peak SVET voltage signal (Vpp) is related to the current flux density (jz) along the axis of probe vibration by:
![Equation ([1])](https://content.cld.iop.org/journals/1945-7111/165/2/C27/revision1/d0001.gif)
where κ is solution conductivity such that a quantity G = κ/App may be defined as the SVET calibration factor. The SVET calibration was checked galvanostatically in NaCl (aq) electrolyte of different concentrations using a specially devised two-compartment cell. Each compartment contained a 1 cm2 Pt electrode and the two compartments were linked by a vertically orientated, electrolyte-filled glass tube of length 70 mm and of internal diameter 5 mm. During calibration, the SVET probe was inserted a distance of ca. 5 mm downward into the tube lumen. At this position, the current flux density was constant across the tube diameter and equal to the cell current divided by the internal area of cross section (minus the cross-sectional area of the SVET probe). Furthermore, the current flux was aligned vertically i.e. parallel with the tube axis and parallel with the axis of probe vibration. At all electrolyte concentrations and for jz = –15 A/m2 to 15 A/m2 plots of Vpp vs. jz gave good straight lines (correlation co-efficient > 0.998) and the values of G obtained from plot gradients agreed with those calculated using Equation 1 to within ± 10%. Bare and coated samples were completely immersed, exposed area uppermost, in an electrolyte bath containing 2 M NaCl(aq) at pH 6.5. Electrolyte thickness was kept constant at 10 mm for all chosen studies. The bath was left unstirred and in contact with room air at a nominal temperature of 20°C. The SVET probe was held vertically and scanned at a fixed height (100 μm) above the metal surface. Each scan took ca. 30–45 minutes and produced a square matrix of 9000–12000 Vpp data points. Individual Vpp values were converted to jz, using the relevant calibration factor G as described above.43 Samples were scanned immediately following immersion, and continuously thereafter for a period of 24–36 hours. The spatial resolution of SVET in experiments conducted is 100 μm. Experiments were repeated in and representative results are presented here.
Optical profilometry
A Zygo optical profilometer (Newview 7200/7300 model) was used. The environmentally exposed samples were first exposed to concentrated nitric acid for 15 minutes to remove corrosion products present in the defect as per the ASTM G-1 Standard.47 Image refinement and pit volume calculation was performed using MountainsMaps imaging topography software.48–50 Calculations were made by multiplying the average pit volume by the total number of pits and normalizing for area.
Results
Laboratory full immersion exposures of pretreated AA2024-T351 coated with MgRP and topcoat
Results for open circuit potential (or global galvanic protection potential) and low-frequency EIS measurements conducted in 2 M NaCl(aq) full immersion conditions of intact coating systems are summarized in Figures 2a and 2b, respectively. Results for MgRP systems incorporating the three pretreatments (NFF, TCP and ACS) with no topcoat, and one topcoated MgRP system with the NFF pretreatment, are presented. Typical OCP values for bare AA2024-T351 (∼ −0.51 V vs SCE) and pure Mg (∼ −1.5 V vs SCE) are shown by the labelled dashed lines. The non-topcoated NFF-based system initially exhibited very negative global galvanic protection potentials close to −1.4 V vs SCE before stabilizing at value of −1.2 V vs SCE after 12 hours for the remaining exposure time. This highly suppressed potential tending toward that of pure Mg suggests that the potential of the MgRP has a strong influence over the mixed potential of the system, an indicator of successful galvanic coupling. A similar trend in the initial stages of immersion can be observed for the ACS-based system where values are moderately suppressed toward the OCP of pure Mg before rising toward that for bare AA2024-T351 and remaining within the region of −0.75 and −0.51 V vs SCE, intermediate between the given values for pure Mg and AA2024-T351. Values for the TCP-based system remain close to that for bare AA2024-T351 throughout the 36 h experiment.
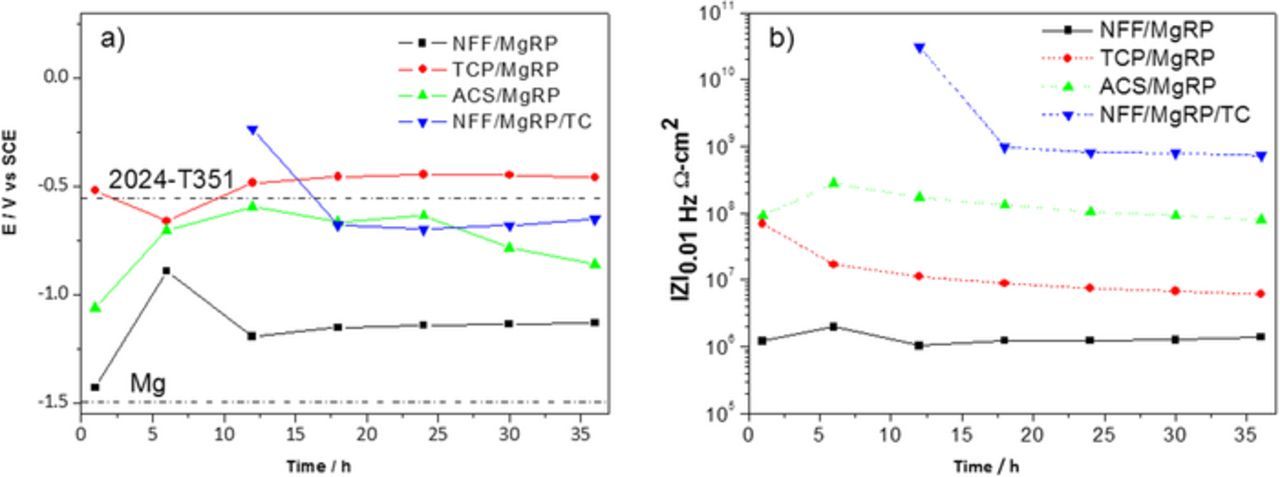
Figure 2. a) Average OCP b) Low Frequency Mod. Z vs full immersion exposure time for selected AA2024-T351/Pretreatment/MgRP with/without topcoat as indicated.
Low frequency impedance (Z0.01) measured as a function of exposure time for the three coating systems (Figure 2b) indicates that barrier degradation occurs as a function of exposure time in all cases, albeit minimally in the time frame of the experiment. A ranking order, in terms of ionic resistance, is established whereby: topcoated system >> ACS > TCP > NFF and values for the NFF-based system are 1 and 2 orders of magnitude lower than the TCP-based and ACS-based systems, respectively.
The results presented here indicate that the level of resistance (low frequency impedance (Z0.01)) afforded by the coating system (where, in this study, any deviation is wholly dependent on the pretreatment as the only variable between the uncoated systems) directly effects the global galvanic protection potential. In the case of NFF-based systems, the results suggest that the resistance of the pretreatment layer is low enough that a galvanic couple between the AA2024-T351 substrate and the MgRP primer is established and the global galvanic protection potential is mixed (demonstrated by mixed potential theory applied to a galvanic corrosion cell).10,11 For ACS-based systems, the significantly higher barrier properties can be attributed to a thick (∼9 μm) and resistive oxide layer sealed by hexavalent chromium which is reflected in a global galvanic protection potential similar to that of bare AA2024-T351 suggesting that any galvanic coupling is limited or even negligible.
Global galvanic protection potential values measured for the NFF-based topcoated system also remained in the region of bare AA2024-T351 after very positive initial values. The drop in potential observed between 12.5 hours and 17.5 hours may coincide with to a drop in ionic resistance due to increased wetting of the coating system during this period. This is demonstrated by a concurrent drop in impedance at the same immersion time shown in Figure 2b and the plateau reached after this time is three orders of magnitude greater than the non-topcoated NFF sample.
It was expected that a MgRP coating with a defect would provide the most effective sacrificial protection to the exposed substrate when in the presence of a pretreatment offering minimal resistance between the primer and substrate. The galvanic couple potential, as a function of exposure time, was also monitored for the same four systems in the presence of a defect. Two coating to defect area ratios configurations, CDR: 0.3 and CDR: 5 (Figure 1) were chosen for galvanic couple experiments and the results are summarized in Figures 3a and 3b, respectively. Typical OCP values for bare AA2024-T351 and pure Mg are again shown by the labelled dashed lines. For both CDR configurations, NFF/MgRP initially showed more negative galvanic couple potentials tending toward the potential expected for Mg. A shift to more positive potential values occurred after ∼8 hours. The TCP-based system exhibited intermediate galvanic couple potentials and indicated delayed and limited galvanic protection as can be inferred by a potential consistently more negative than that of bare AA2024-T351. In both ACS based systems and topcoated systems, the galvanic couple potential was heavily mediated where relatively positive galvanic couple potentials were observed.
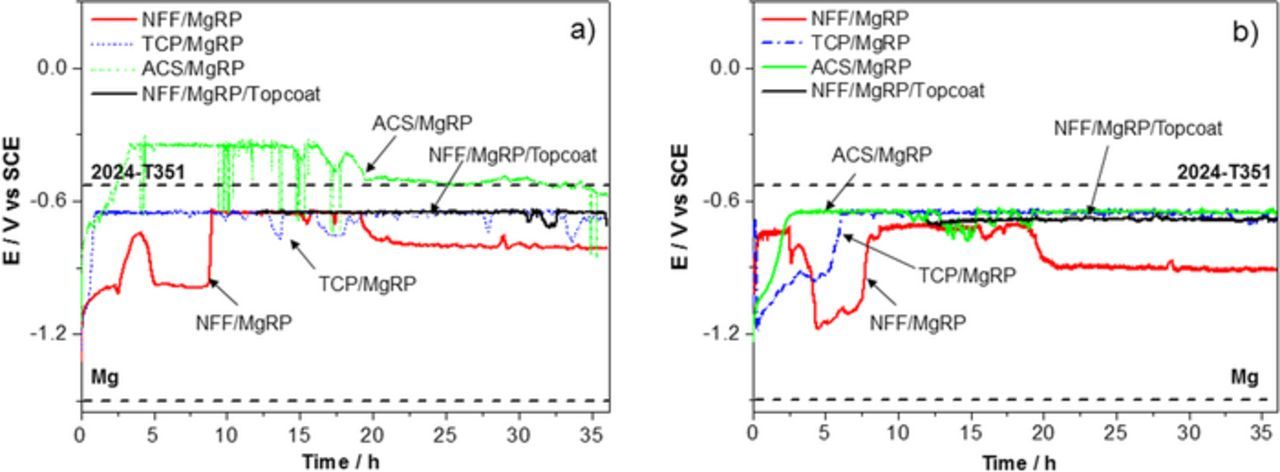
Figure 3. OCP measurements of AA2024-T351 with a coating system comprising a pretreatment (NFF, TCP or ACS), a MgRP layer with/without topcoat. Each sample has an artificial defect region exposing bare a AA2024-T351 substrate. Two coating/defect area ratios (CDR) configurations are given a) CDR: 0.3 and b) CDR: 5. Samples were fully immersed in 2 M NaCl(aq).
Localized corrosion of bare AA2024-T351
A baseline for current density distribution as a function of time for unpolarized, freely corroding bare AA2024-T351 immersed in 2 M NaCl(aq) in ambient conditions was established using repetitive in-situ SVET. Figures 4a–4e show representative current density maps obtained after 0, 4, 14, 26 and 36 hours, respectively. The data map obtained immediately upon immersion (Figure 4a) indicates that local anodic activity initiates within minutes of exposure to the 2 M NaCl(aq) solution. The first stable pit, denoted by a local anodic peak, was formed after half an hour and further pit initiation in multiple sites was observed within 4 hours of full immersion, as evidenced from Figure 4b. The time required for repassivation varied depending on individual pits with shortest period being 30 minutes and longest being 1950 minutes. The total number of visible pits formed was 25 pits per cm−2 and the average life time of each pit was 520 minutes. The maximum peak height was ∼ 30 Am−2. Figure 4f shows the visual appearance of the sample after 38 h of full immersion wherein the physical pits can be correlated to the previously discussed electrochemical pits indicated by the anodic maxima given on the current density SVET maps.
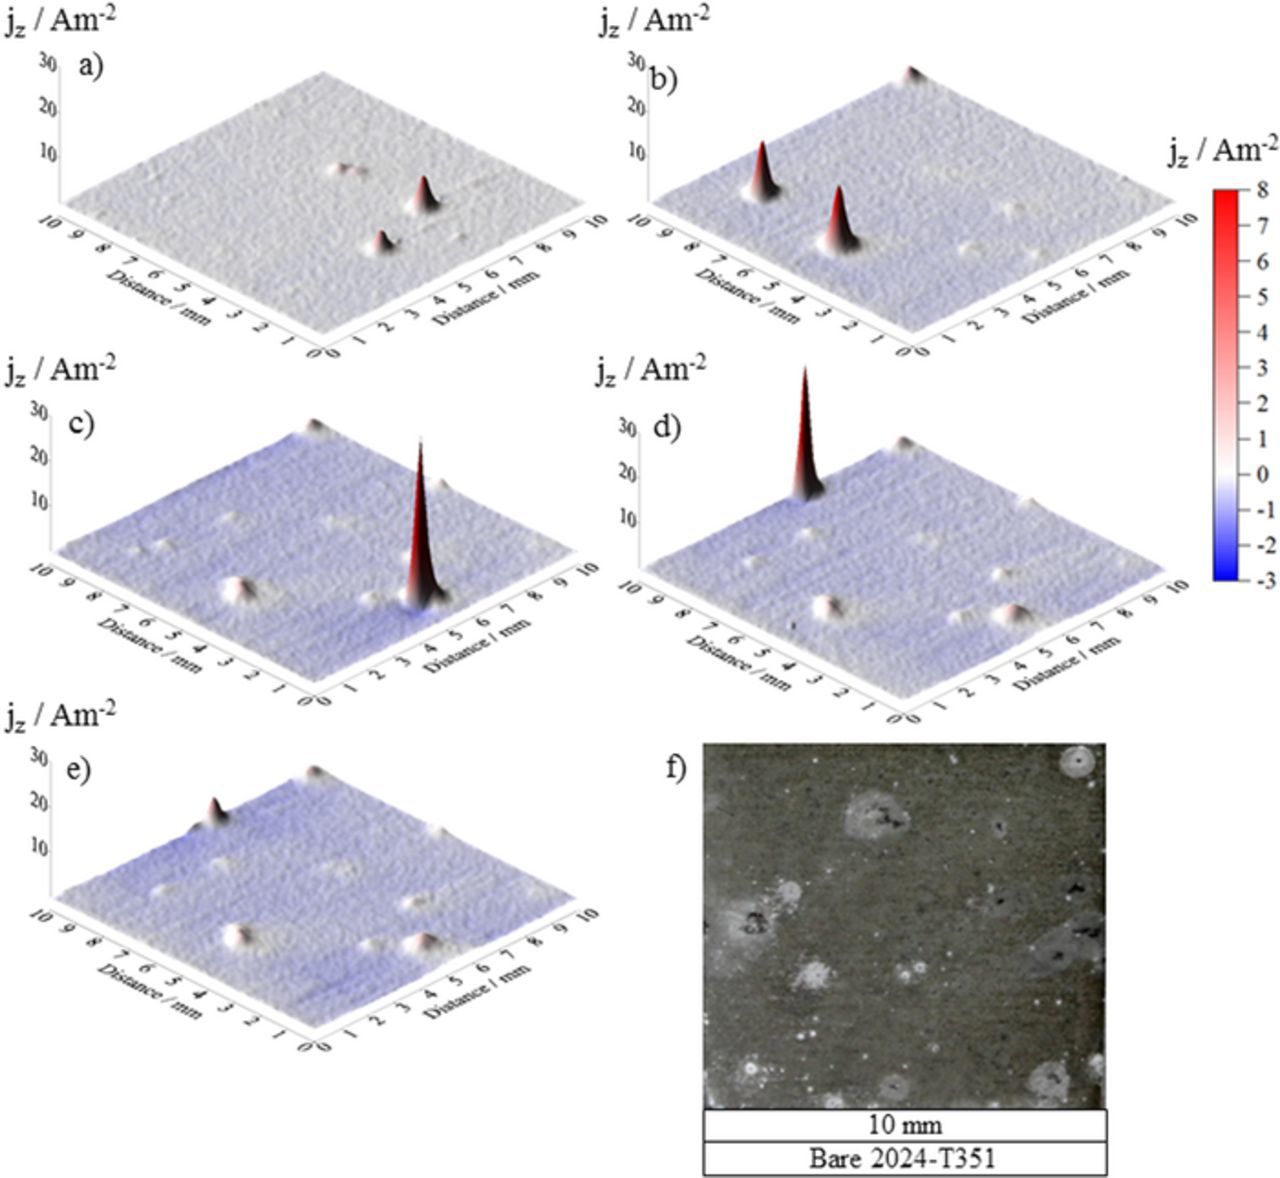
Figure 4. Surface plots showing the distribution of normal current density jz emerging from a AA2024-T351 alloy sample freely corroding in aerated 2 M NaCl solution. Data were obtained from SVET scans carried out (a) 0 h, (b) 4 h, (c) 14 h, (d) 26 h and (e) 36 h after sample immersion. (f) shows the visual appearance of the sample after 36 h immersion.
Galvanic coupling of Bare AA2024-T351 and Bare Mg
An experiment was conducted to assess the baseline anodic and cathodic current densities when bare AA2024-T351 was directly coupled to bare Mg without the constraints of an ohmic drop (as demonstrated previously by King et al. with a mixed potential theory model)10,11 caused by resistive pretreatments and polymer coatings. Figure 5a shows the surface plot of net local current density of the bare AA2024-T351 coupled to bare, commercially pure, Mg when freely corroding in 2M NaCl(aq) in ambient conditions. The surface current density map shows net anodic and cathodic activity at bare Mg and bare AA2024-T351 surfaces, respectively (Figure 5a). A representative SVET-derived current density profile across the Mg/AA2024-T351 interface is given in Figure 5b. Due to intense gas evolution on the Mg surface, high levels of noise disrupt the baseline, however, net anodic and cathodic current density values measured across the bare Mg and bare AA2024-T351 both approximate +/− 500 Am−2. A slight but progressive reduction in anodic/cathodic current densities can be observed at increasing distances in both directions from the CDI. For both substrates, in the regions directly adjacent to the joint (within ∼2 mm), a substantial increase in the respective anodic and cathodic current can be observed up to values of ∼750 Am−2. Figure 5c shows the visual appearance of the galvanic couple after 1 h of full immersion. Significant corrosion can be observed on both the Mg and AA2024-T351 surfaces. The black layer shown on the AA2024-T351 surface on the right-hand-side can be attributed to enhanced cathodic activity where the local pH of the cathodic region increases significantly resulting in cathodic corrosion of amphoteric AA2024-T351.51,52 This effect might be regulated by the resistance of Mg buried in a primer resin. The result presented here also suggests that galvanic protection offered by a MgRP coating system may be limited by the distance of the bare surface away from the coating. As such, the proceeding work assesses the area-averaged current densities of areas divided into 2 mm wide lengths in the artificial defect, comprising bare AA2024-T351, moving progressively away from the coating/defect interface.
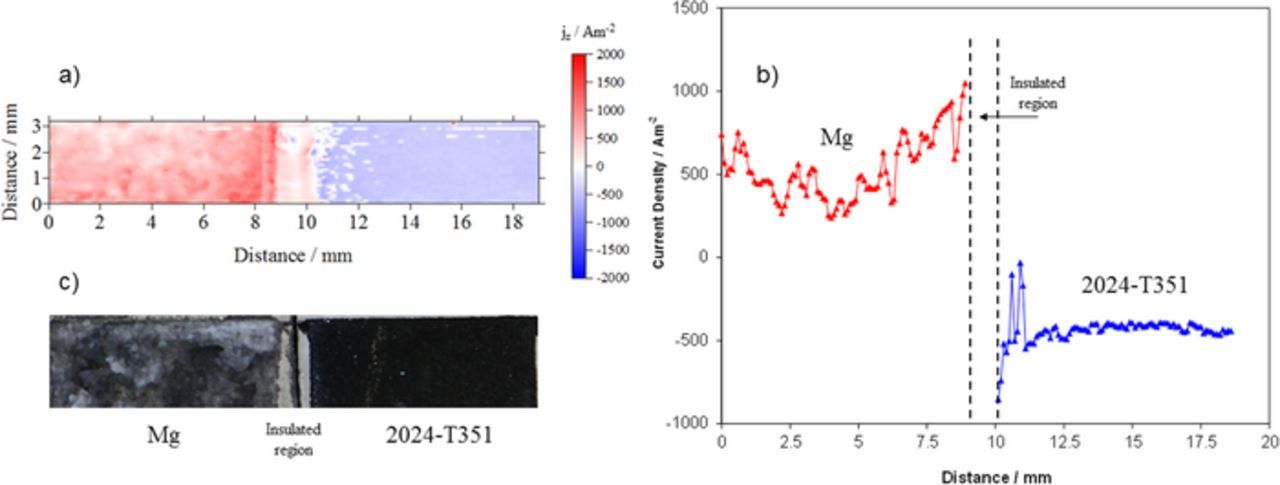
Figure 5. (a) SVET-derived surface plot showing the distribution of normal current density Jz above a AA2024-T351 alloy sample electrically coupled to pure Mg. The sample was fully immersed in aerated 2 M NaCl(aq) solution. (b) Representative SVET-derived Jz line profile across the AA2024-T351/Mg sample. (c) photographic image showing the visual appearance of the sample after 1 h immersion.
Galvanic coupling of Bare AA2024-T351 and AA2024-T351/Pretreatment/MgRP
In the current section, samples with artificial defects, as represented in Figure 1a, were chosen to study the distance range of galvanic protection offered by MgRP-based systems and the effect of any increased resistance of NFF, TCP and ACS-based pretreatments. For all experiments discussed in the current section, the small coating to defect area ratio (0.3) was chosen in order to study the effect of distance from the defect/coating interface on the galvanic protection afforded the bare AA2024-T351 when samples were fully immersed in NaCl(aq) electrolyte in ambient conditions. Immersed samples were scanned using in situ SVET over a period of 38 h and the resulting data are analyzed here in two ways:
- (1)Line profiles of representative SVET-derived current density measurements along the axis of probe vibration (jz). This will enable the study of maximum peak height and number of local anodes and the distribution of general cathodic activity as a function of distance from the CDI.
- (2)In terms of SVET-derived area-averaged anodic and cathodic current densities for specific 2 mm-wide sections in the defect area moving progressively away from the defect/coating interface (represented schematically in Figure 9).
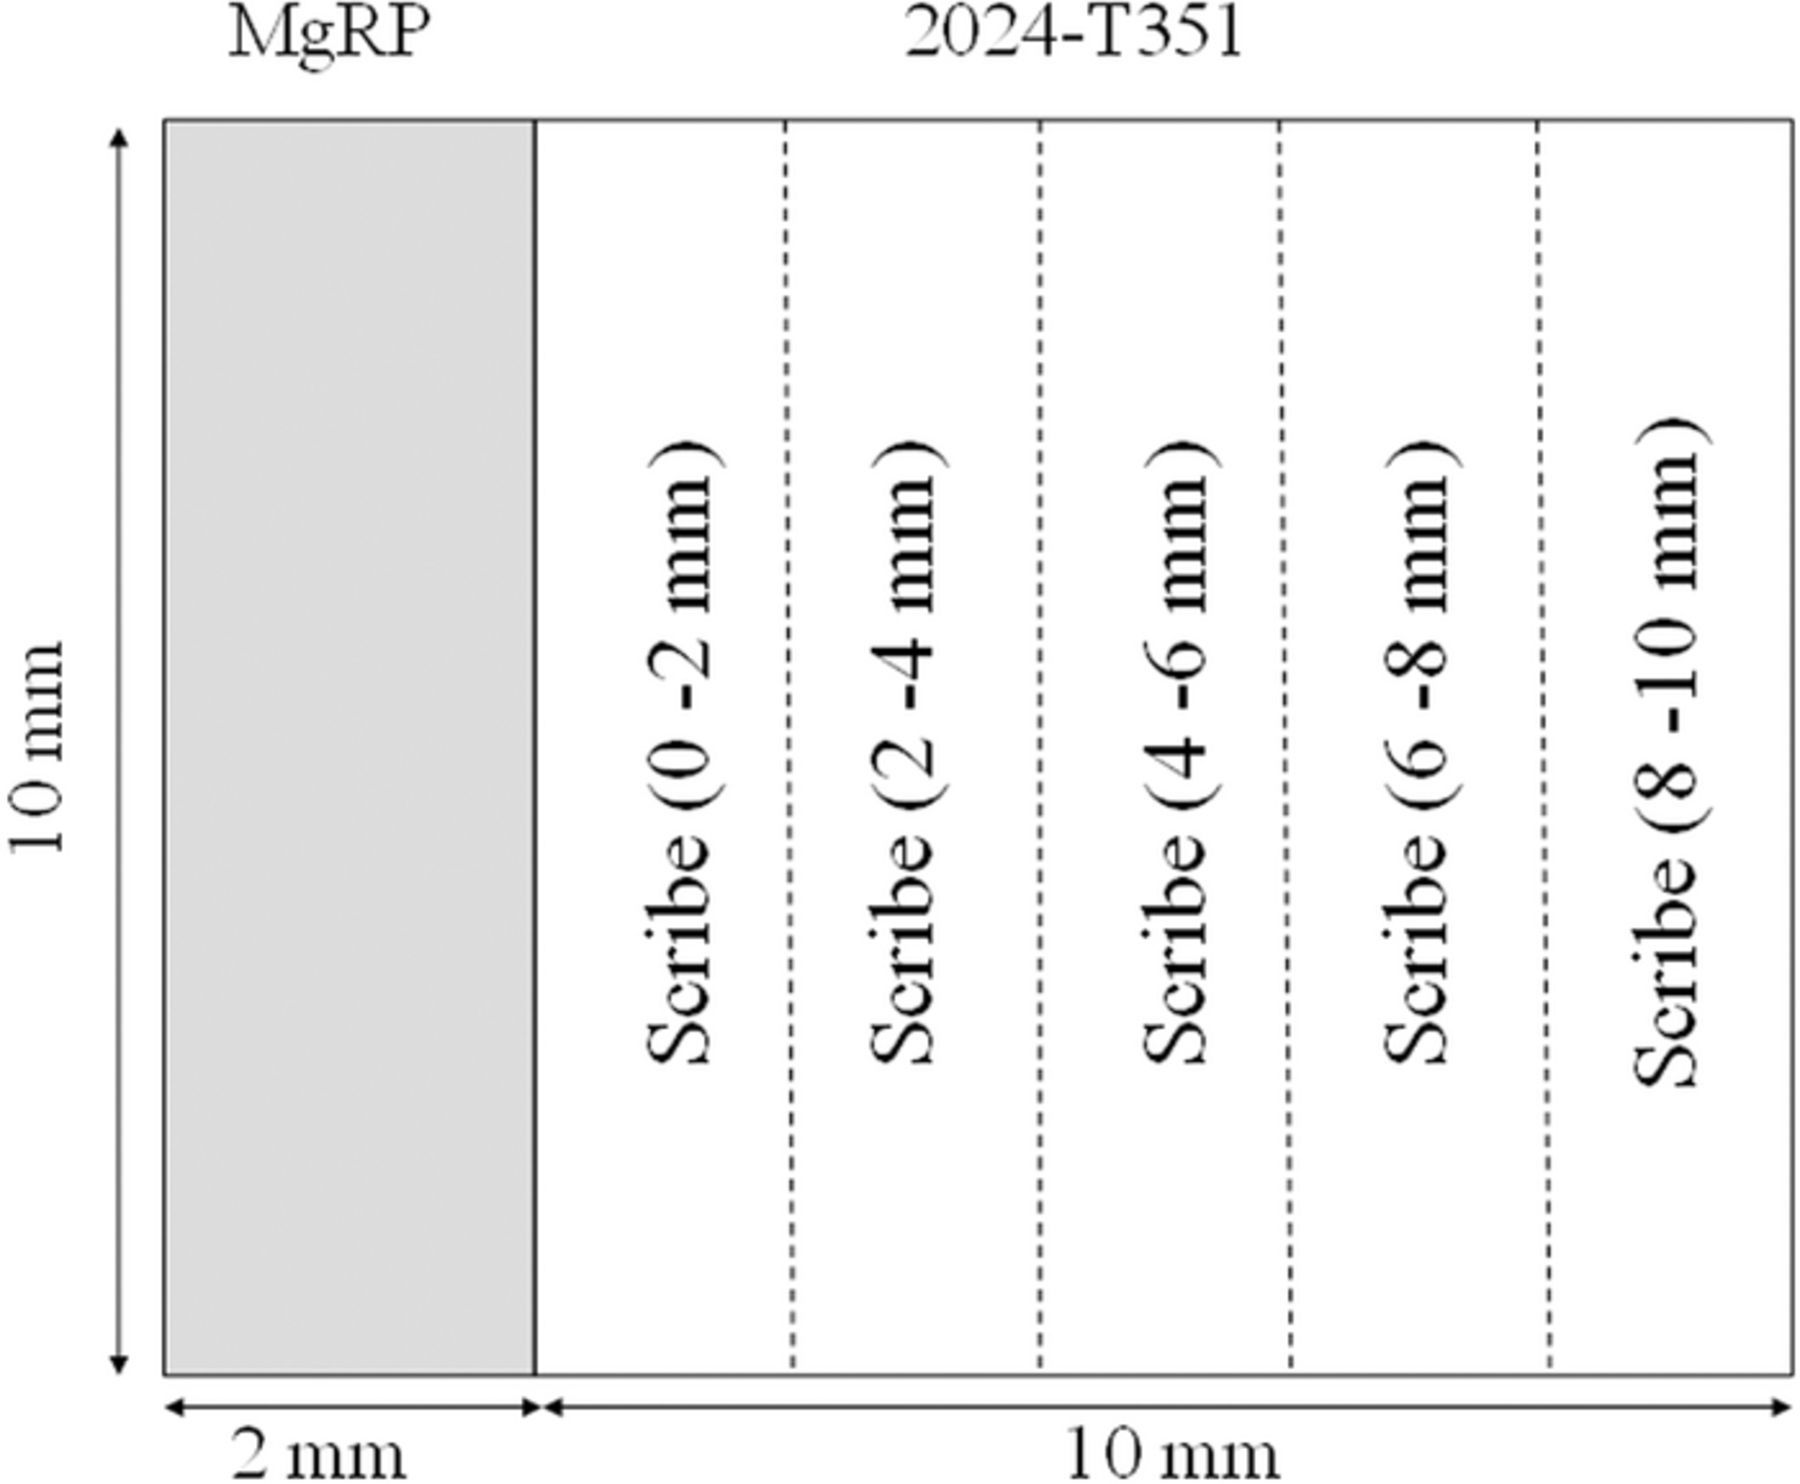
Figure 9. Schematic diagram showing the regions of interest where SVET-derived anodic and cathodic total current density values were calculated. The dotted lines indicates the separation boundaries for each region where (a) is the MgRP coating then b) 0–2 mm, c) is 2 –4 mm, d) 4–6 mm, e) 6–8 mm and f) 8–10 mm away from the defect/coating interface.
Sacrificial protection of AA2024-T351 by MgRP and role of pretreatments: preliminary trends
Figures 6, 7 and 8a–8e show representative SVET-derived current density surface maps for AA2024-T351/MgRP samples with NFF, TCP and ACS pretreatment systems, respectively. A CDR: 0.3 configuration has been used in all cases. Maps are presented at times 0, 4, 14, 24 and 36 hours after immersion and a post-exposure photograph, at 38 hours immersion time, is given. In all cases, local anodic current density maxima can be observed at the artificial defect, denoting the onset of pitting corrosion. This indicates that, for each pretreatment system, any galvanic coupling between the MgRP and the substrate was not sufficient to completely suppress all localized corrosion in the defect region. A summary of representative SVET-derived current density line profiles across the CDI and the full length of the defect region for the control experiment and each pretreatment system is given in Figure 10 at times 4, 14 and 24 hours after immersion. This enables a comparative study of any galvanic coupling and the current densities associated with individual pits for each system.
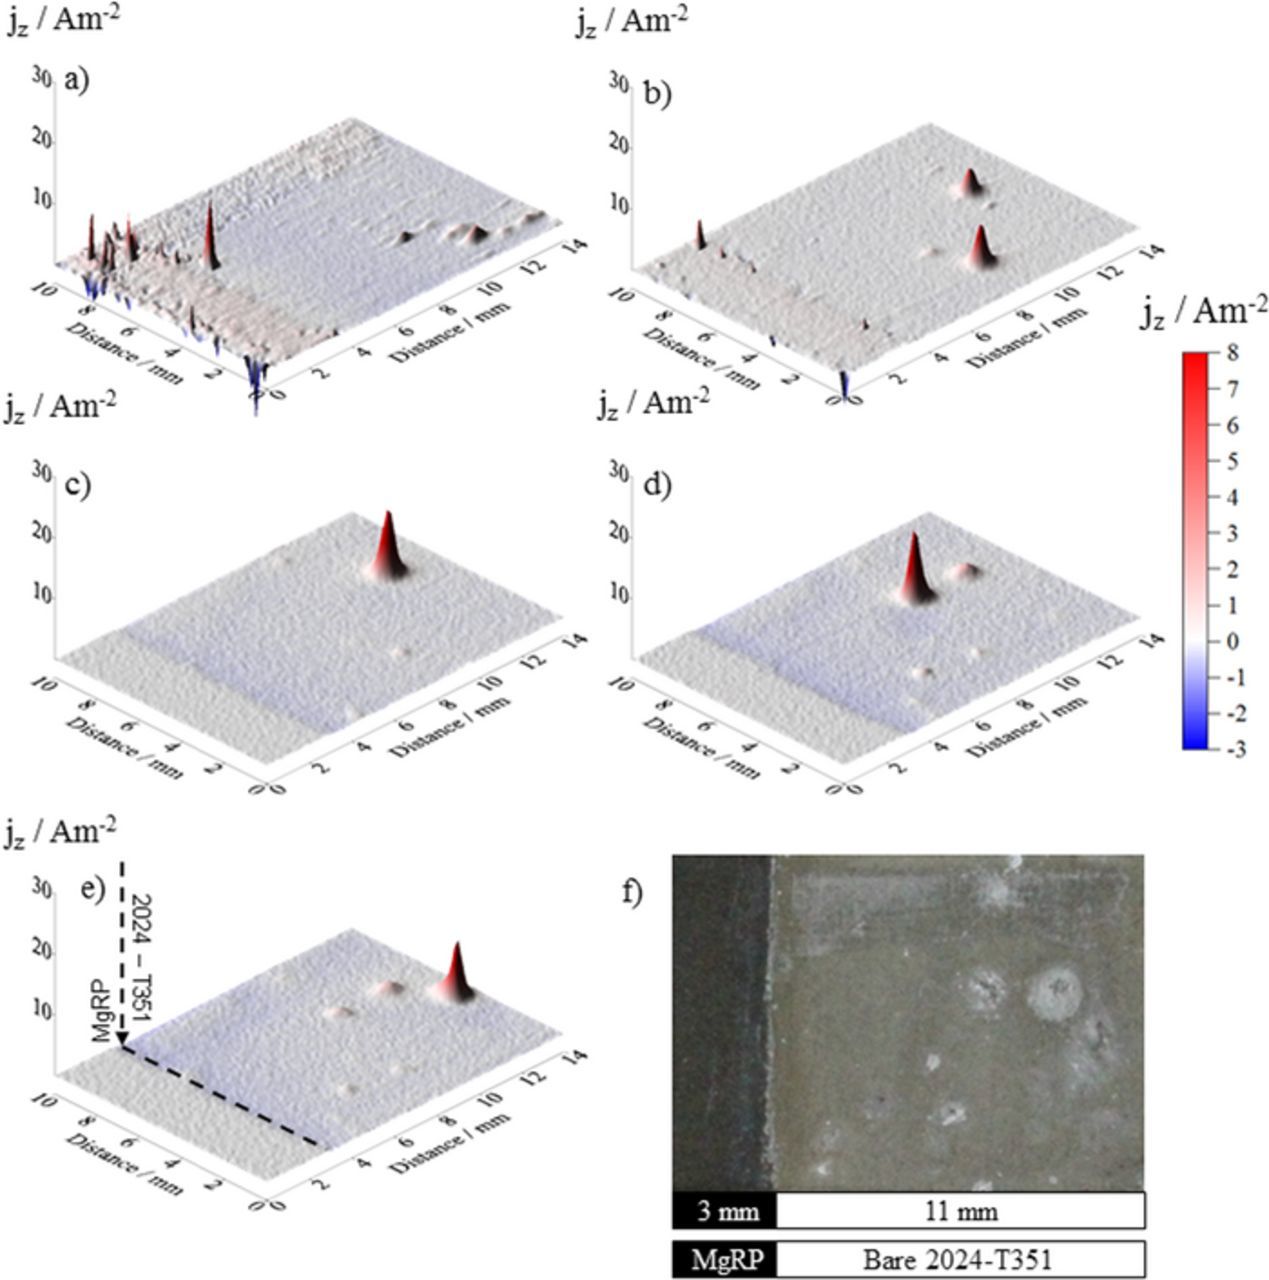
Figure 6. Surface plots showing the distribution of normal current density jz above a AA2024-T351 alloy adjacent to AA2024-T351/NFF/MgRP in aerated 2 M NaCl(aq) solution. Data was obtained from SVET scans carried out (a) 0 h, (b) 4 h, (c) 14 h, (d) 26 h and (e) 36 h after sample immersion. (f) shows the visual appearance of the sample after 38 h immersion. A coating/defect area ratio (CDR) configuration of 0.3 was used.
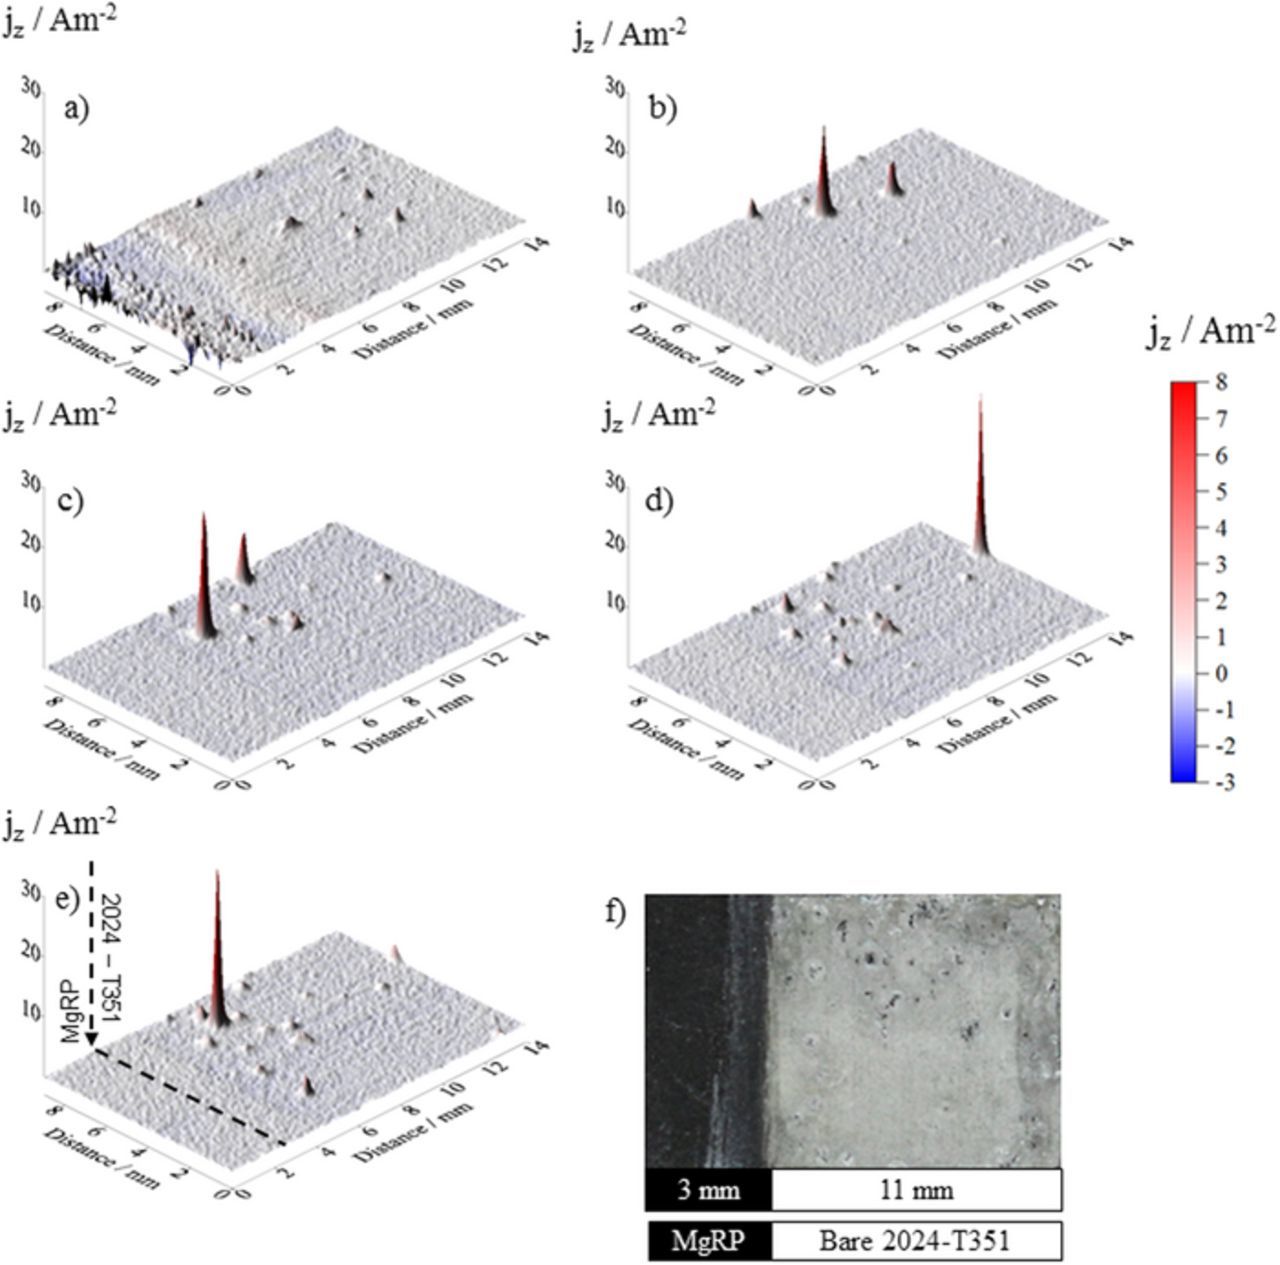
Figure 7. Surface plots showing the distribution of normal current density jz above a AA2024-T351 alloy adjacent to AA2024-T351/TCP/MgRP in aerated 2 M NaCl(aq) solution. Data was obtained from SVET scans carried out (a) 0 h, (b) 4 h, (c) 14 h, (d) 26 h and (e) 36 h after sample immersion. (f) shows the visual appearance of the sample after 38 h immersion. A coating/defect area ratio (CDR) configuration of 0.3 was used.
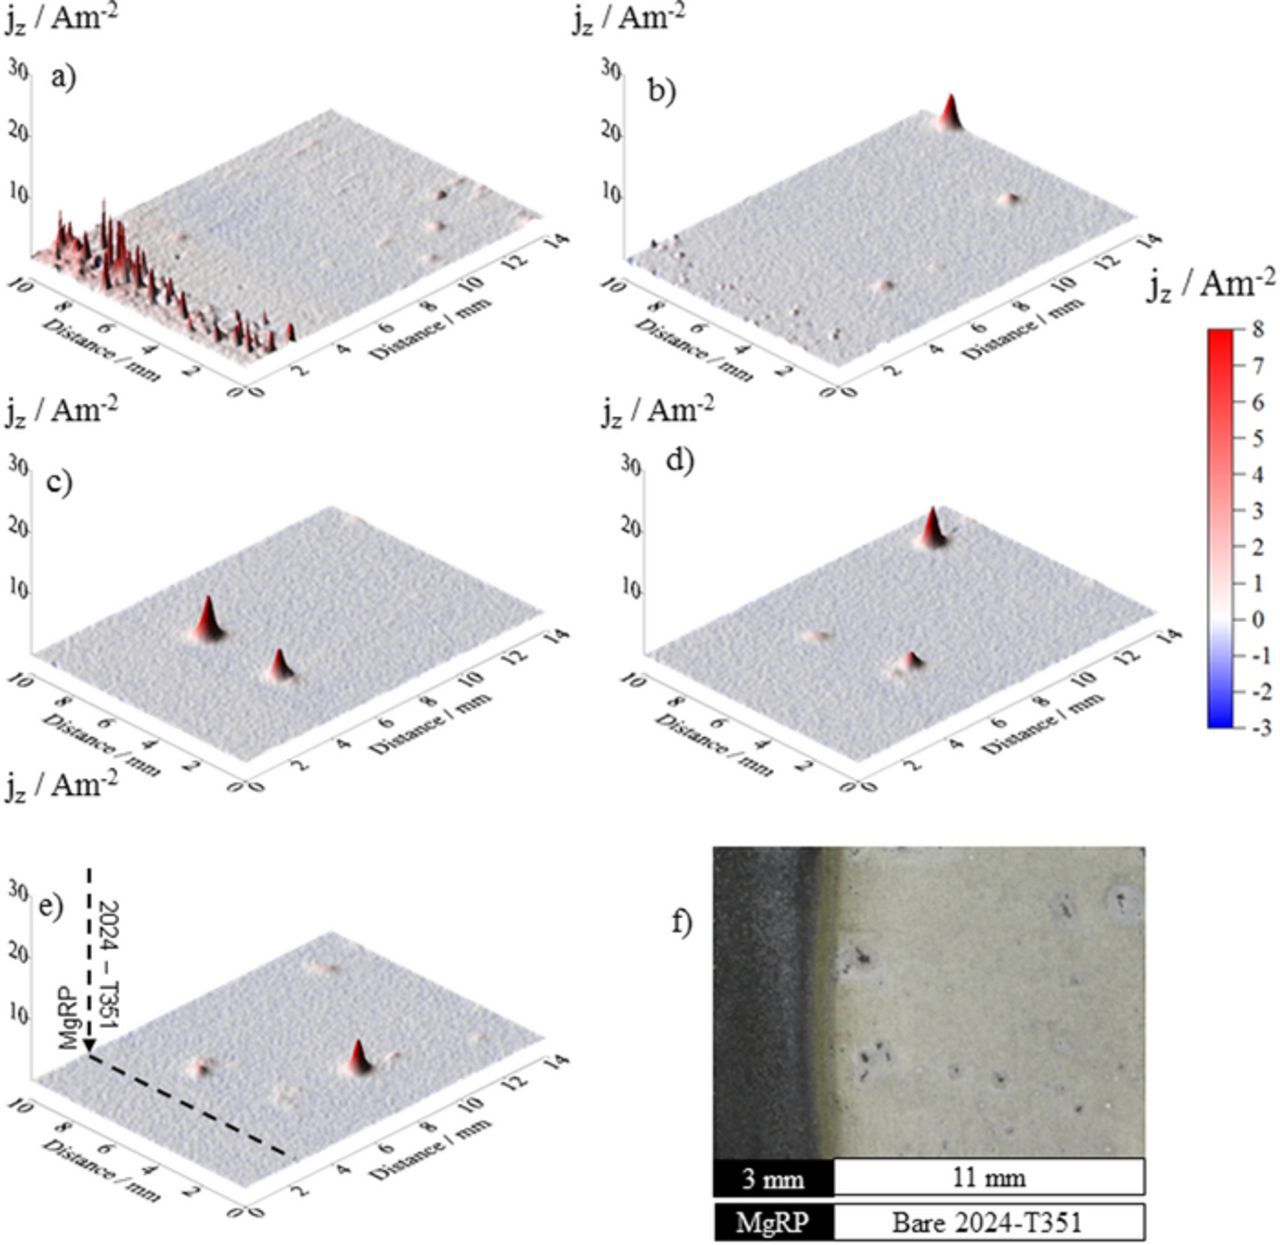
Figure 8. Surface plots showing the distribution of normal current density jz above a AA2024-T351 alloy adjacent to AA2024-T351/ACS/MgRP in aerated 2 M NaCl(aq) solution. Data was obtained from SVET scans carried out (a) 0 h, (b) 4 h, (c) 14 h, (d) 26 h and (e) 36 h after sample immersion. (f) shows the visual appearance of the sample after 38 h immersion. A coating/defect area ratio (CDR) configuration of 0.3 was used.
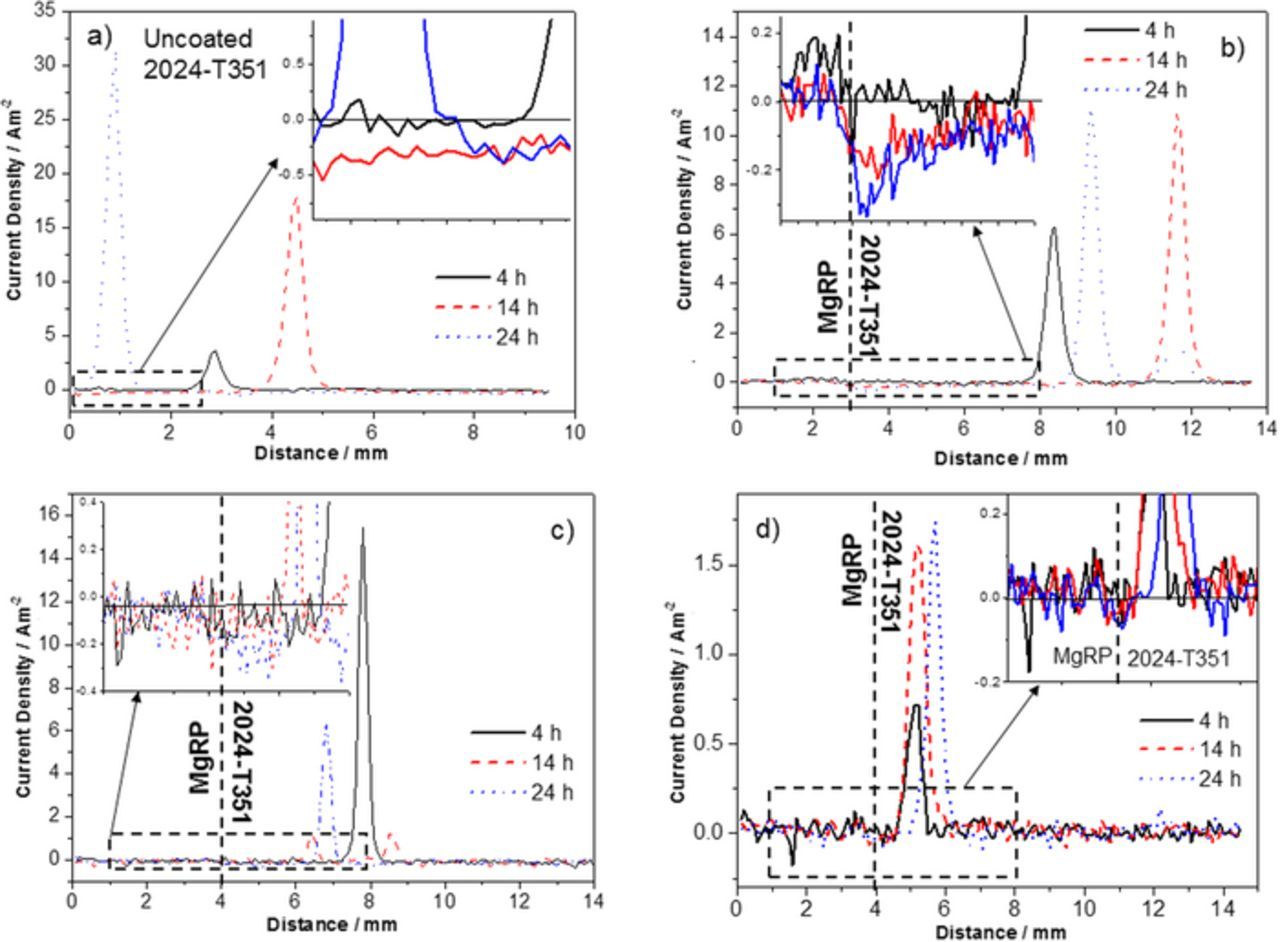
Figure 10. (a) Representative SVET-derived line profiles showing the distribution of normal current density jz above freely corroding bare AA2024-T351 alloy and (b-d) AA2024-T351 alloy adjacent to AA2024-T351/Pretreat/MgRP in aerated 2 M NaCl solution where pretreatments are b) NFF, c) TCP and d) ACS. In all cases samples were fully immersed in 2 M NaCl(aq) and the coated portion of the sample is given on the left.
The SVET-derived line profiles for bare AA2024-T351 given in Figure 10a, taken from the maps presented in Figures 4a–4e, shows intense local pits (jpit), as indicated by anodic jz maxima that increase from 3 Am−2 to ∼32 Am−2 with increasing exposure time. A corresponding increase in the cathodic current density baseline can be observed where the remainder of the non-pitted surface displays consistent values that reach −0.5 Am−2 after 24 h.
The representative SVET-derived line profiles for the NFF-based system is given in Figure 10b where two distinct regions can be observed in the defect region. The region adjacent to the CDI, extending to 4 mm away exhibits an increased quasi-steady state galvanic cathodic current density with a progressive cathodic increase to −0.35 Am−2 by 36 h. This suggests that the sufficient ingress of electrolyte to activate galvanic coupling is reliant upon the wetting of the epoxy matrix of the MgRP. The region > 4 mm away from the CDI exhibited anodic peaks with max jpit values in the region of 6–10 Am−2 which is substantially lower than that observed in the control on bare AA2024-T351. 11 anodes per cm−2 appeared over the duration of the experiment. This suggests that the MgRP offers full protection in the region 4 mm for the CDI and partial protection beyond this where jpit is much lower than the control experiment.
The representative SVET-derived line profiles for the TCP-based system (Figure 10c) show peak jpit values of ∼15 Am−2 at 4 h. These values reduce to ∼6 Am−2 by 26 h immersion time. Quasi steady-state galvanic cathodic current density at the CDI reaches values of −0.3 Am−2 by 26 h and extends to ∼2 mm from the CDI. No anodic activity is observed in this region. The lower cathodic values and presence of pits in closer proximity to the CDI (when compared to the NFF-based system) suggests that the resistance of the TCP pretreatment restricts electrical contact and thus galvanic interaction between the MgRP and the substrate such that the galvanic current is mediated. The reduction over time of pit current density could be attributed to a contribution from inhibitor ion release from the TCP pretreatment as there is no evidence to suggest that the cathodic current densities reach a sufficient level or distance to effect the pits in the remaining areas of the defect. 17 anodes per cm−2 appeared over the duration of the experiment.
In the case of ACS-based systems (Figure 10d), no increase in cathodic current density in the region adjacent to the CDI is observed. The SVET-derived current density baseline measured across the defect is shown to be uniform and also consistently low (∼0.05 Am−2) throughout the experiment. 15 anodes per cm−2 appeared in all regions of the defect and in very close proximity to the CDI over the duration of the experiment. However, substantial inhibition is observed where jpit values are shown to be an order of magnitude lower than those measured in the control experiment where max jpit values up to ∼1.8 Am−2 area measured. The lack of evidence for any galvanic current suggests that the inherently high electrical resistance of the ACS pretreatment (demonstrated in Figure 2b) severely limits galvanic interaction between the Mg in the primer and the buried AA2024-T351 surface, preventing any galvanic coupling in the presence of a penetrating electrolyte. The greatly reduced current densities of the anodic peaks suggests that an alternative mode of inhibition comes into play offering corrosion protection to the bare defect where inhibition by the leaching of anionic species from the ACS pretreatment, and their redeposition in the defect, lowers both the overall anodic and cathodic activity in the defect, this has been reported elsewhere.4,29
Sacrificial protection and the role of pretreatments: Semi-quantitative analysis
Semi-quantitative analysis of the corrosion activity for the whole scan area was carried out by determining the total SVET-derived integrated anodic and total cathodic currents (Ja and Jc, respectively) for 5 individual regions moving progressively away from the CDI (as demonstrated in Figure 9). Results are given in Figures 11 and 12 for NFF, TCP and ACS-based systems at 5 exposure times during full immersion in 2 M NaCl(aq).
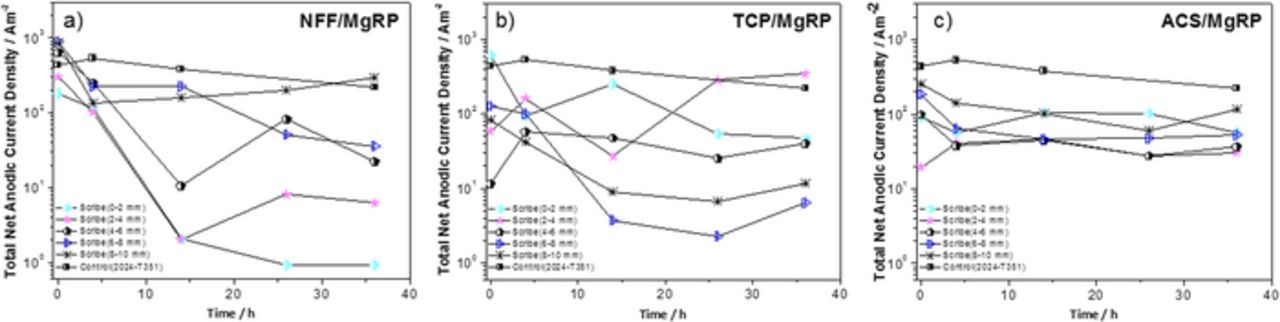
Figure 11. Total SVET-derived anodic current density as a function of exposure time for selected AA2024-T351/Pretreatment/MgRP systems; (a) NFF/MgRP, (b) TCP/MgRP and (c) ACS/MgRP. The anodic current densities were calculated at five different regions in the defect at various distances from the coating interface, as indicated in the legend. Anodic current densities for bare AA2024-T351 are provided for comparison.
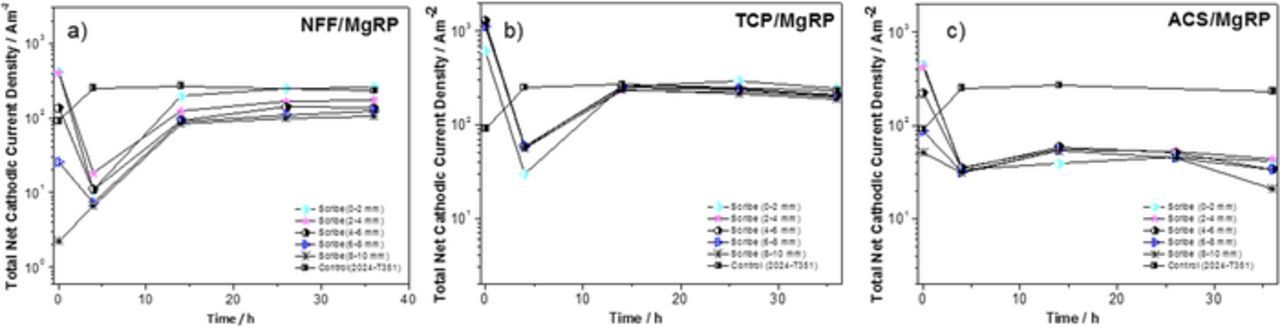
Figure 12. Total SVET-derived cathodic current density as a function of exposure time for selected AA2024-T351/Pretreatment/MgRP systems; (a) NFF/MgRP, (b) TCP/MgRP and (c) ACS/MgRP. The cathodic current densities were calculated at five different regions in the defect at various distances from the coating interface, as indicated in the legend. Cathodic current densities for bare AA2024-T351 are provided for comparison.
For NFF-based systems, all total net anodic current density (Ja) values for each distance (x) from the CDI were very similar over the first four hours of immersion. At a distance of 6–10 mm, Ja remained almost constant for the 36 h immersion period (Figure 11a) and were similar to those measured in the control experiment indicating limited corrosion protection at this distance. For a distance of 0–2 mm, i.e. the immediate vicinity of the CDI, a substantial decrease in net anodic current density is observed beyond 4 hours where values are 2–3 orders of magnitude lower than the control. The general trend for NFF-based systems is progressive increase in Ja with increasing distance from the CDI. In contrast, the total net cathodic current densities (Jc), given in Figure 12a show a slight but progressive decrease with increased distance from the CDI. This is as expected as the gradual reduction in quasi-steady state galvanic cathodic current density demonstrated in Figure 10b signifies a weakening in galvanic coupling between the MgRP and the substrate as x increases.
For the TCP-based system, there is no direct correlation between x and measured Ja values (Figure 11b). Ja values in the region up to 4 mm from the CDI are similar to the control experiment. ACS-based systems also show no direct correlation between x and measured Ja values (Figure 11c). However, between 4 h and 26 h, with the exception of the area farthest from CDI, all ACS-based Ja values are an order of magnitude lower than the control sample. For both TCP-based and ACS-based systems (Figures 12b and 12c) Jc values are relatively consistent as a function of time and also distance from CDI and no increased Jc values in the vicinity of the CDI (0 mm–2 mm region) are observed. Jc values for TCP-based systems are very similar to the control experiment and an order of magnitude lower for ACS-based systems, which would be expected in order to balance the generally lower Ja values measured for this system. The results suggest that for both TCP and ACS systems, no galvanic coupling is occurring offering sacrificial corrosion protection in the artificial defect. The reduced Ja and Jc values observed for ACS-based systems likely derive from inhibition from the leaching of inhibitor ions from the pretreatment.
Effect of coating to defect area ratio on galvanic corrosion protection
During environmental exposure, it is likely that the active ratio of coated surface to bare AA2024-T351 will vary considerably due to Mg pigment depletion during exposure and the limited conductive pathways at various stages of barrier degradation. The effect of anode to cathode ratio on the galvanic couple potential and galvanic current can be explained by mixed potential model, as reported previously by King et al.10 In addition to this effect, a higher ratio of AA2024-T351/Pretreatment/MgRP to a bare AA2024-T351 defect would enhance the area available for facilitating alternative methods of corrosion inhibition i.e. by the leaching of Mg2+ ions and/or anionic species. To assess these possibilities, experiments were carried out on unpolarized and when fully immersed in 2 M NaCl(aq)samples with a higher coating to defect area ratio than the previous experiments (CDR:5). Figure 13 summarizes representative SVET line scans obtained from SVET maps for the chosen systems after 4, 14 and 24 h of immersion. The results for NFF (Figure 13a) and TCP-based (Figure 13b) systems demonstrate the enhanced cathodic current density values in the defect region reaching −0.3 Am−2 and −0.4 Am−2, respectively. In both cases this suggests that galvanic coupling is occurring.
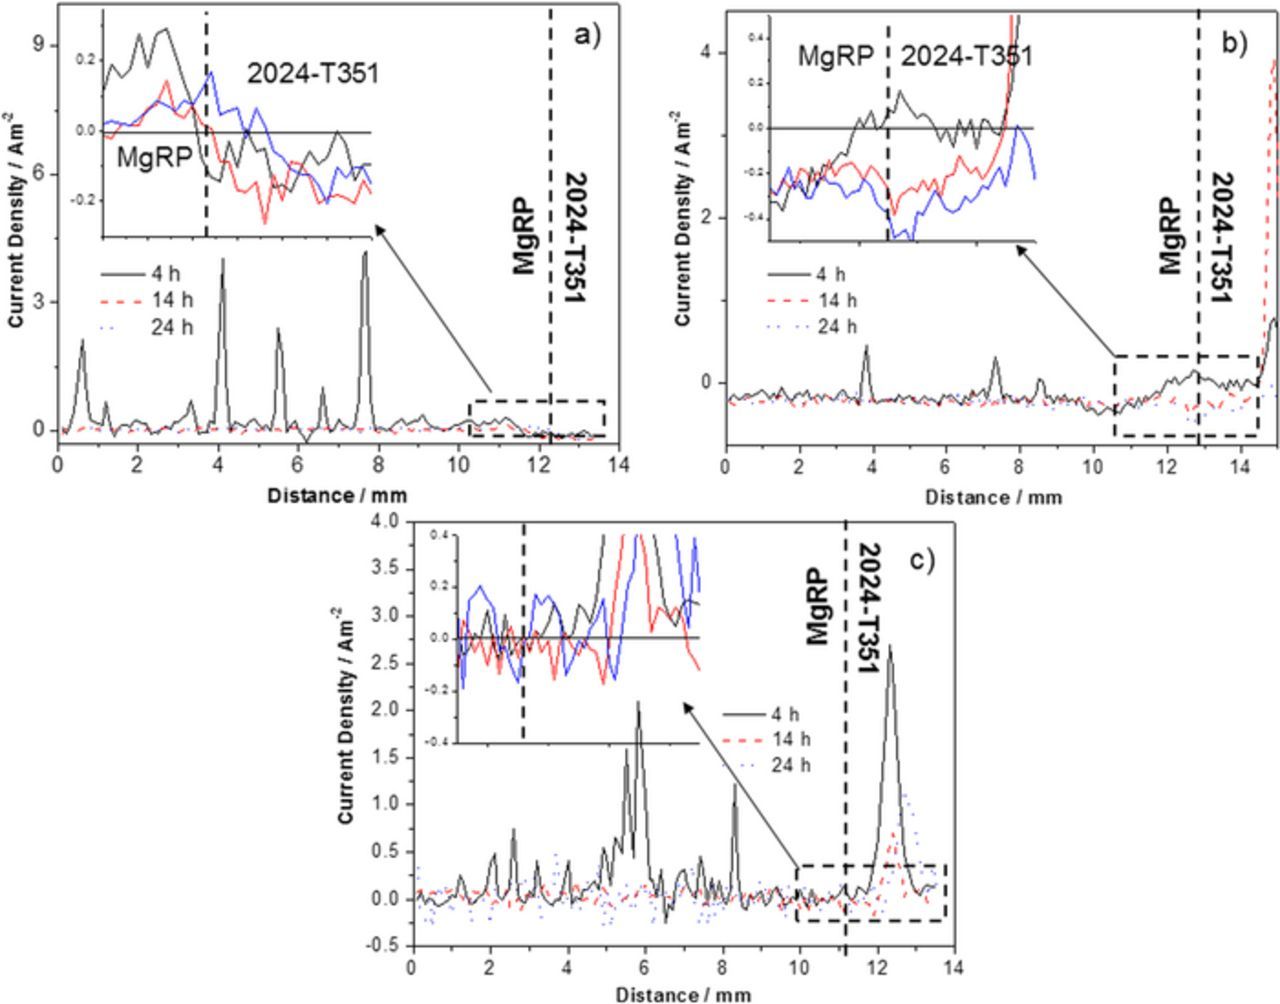
Figure 13. Representative SVET-derived line profiles showing the distribution of normal current density jz AA2024-T351 alloy adjacent to AA2024-T351/Pretreat/MgRP in aerated 2 M NaCl(aq) solution (a) NFF/MgRP, (b) TCP/MgRP and (c) ACS/MgRP. A coating/defect area ratio (CDR) configuration of 5 was used.
For the ACS-based MgRP system, cathodic activity appears to be evenly distributed along the length of the surface (including the MgRP coated region) matching the anodic peaks that are greatly suppressed in contrast to the control sample, as was the case with the CDR: 0.3 experiments. This lack of defect-specific cathodic activity is as expected because no sign of galvanic coupling was demonstrated in the OCP experiments carried out on samples with the same geometry presented here. For all three pretreatment systems, the results are consistent with previous trends observed with a small coating to defect area ratio.
The net anodic and cathodic current densities were calculated for the 2 mm defect region for each pre-treatment system, the results are summarized in Figures 14a and 14b respectively. Significantly lower SVET-derived integrated Ja values were obtained for both TCP-based and ACS-based systems at the higher CDR:5 compared to values measured in the immediate vicinity of the CDI for CDR: 0.3 (Figures 11b and 12c respectively). Results for NFF-based systems are shown to be similarly irrespective of the CDR.
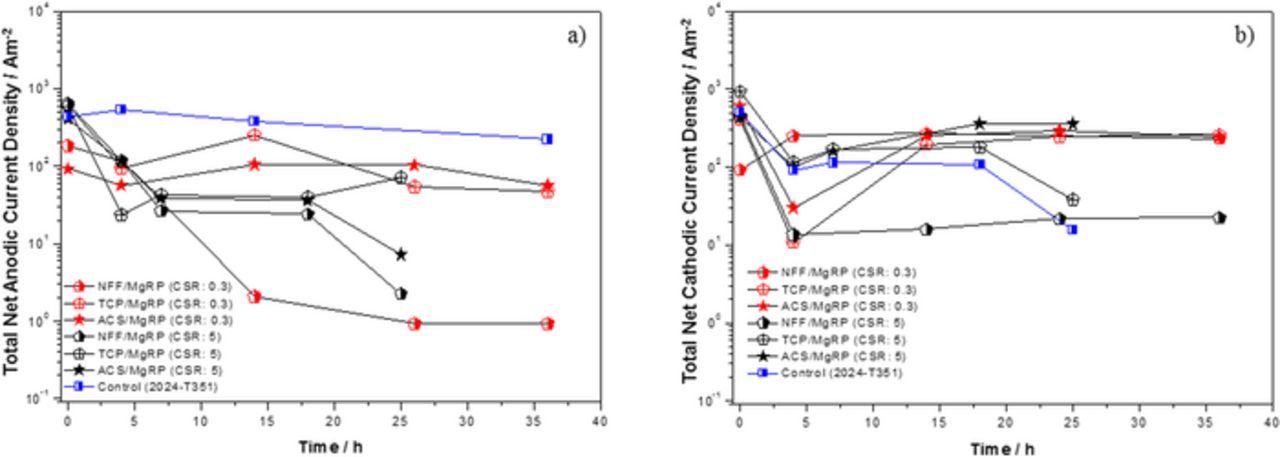
Figure 14. Total anodic (a) and cathodic (b) current density as a function of exposure time for selected AA2024-T351/Pretreatment/MgRP systems for AA2024-T351/Pretreatment/MgRP fully immersed in 2 M NaCl(aq) solution. Three pretreatment systems, NFF, TCP and ACS and given for coating/defect area ratio (CDR) configuration of 0.3 and 5. Anodic and cathodic current density for the control experiment (bare AA2024-T351) is provided for comparison.
Slightly higher anodic current densities at a higher coating to defect ratio can be correlated to enhanced anodic activity in the defect at high pH conditions before Mg(OH)2 redeposition. The change in coating to defect area ratio (CDR), simultaneously increases the area of the anode whilst decreasing the area of active cathode. In addition, there was more active surface of Mg for self-corrosion. Both of these might contribute to increased amount of Mg2+ ion in the solution as well as increased pH. This result in chemical mechanism of redeposition of Mg2+ ions in defect to form protective Mg(OH)2 in high pH conditions.53–55 The Mg(OH)2 inhibits both anodic and cathodic reaction in defect with time as could be inferred from Figures 14a and 14b. Anionic species leaching from the pretreatment might also bring down the anodic activity at defect by acting as cathodic inhibitor.28 The protection of the defect by Mg(OH)2 and anionic species leaching in both lab accelerated life testing (LALT) and field exposures for pretreated systems has been previously reported.4,7,8 Further investigation of the chemical protection mechanism and the conditions required for chemical protection will be reported in future work.56
Corrosion volume loss after long term full immersion exposures
The spatial distribution of corrosion volume loss measured in the defect region of AA2024-T351/pretreated/MgRP systems was studied using optical profilometry with 0.3 and 5 CDR configuration, as described for the aforementioned SVET experiments. In this instance, long term full immersion exposure of up to 275 h was conducted in 2 M NaCl(aq) solution to intensify the propagation of any pitting to increase measurement accuracy. Figure 15 provides a summary of corrosion volume loss (μm3/μm2) for each pretreatment in both configurations in terms of distance from the CDI (for CDR: 0.30) and in terms of total volume loss in the defect for both configurations (Figures 15a and 15b, respectively). For the NFF-based system, a significant reduction in volume loss when compared to the control experiment is demonstrated in the region ≤ 4 mm from the CDI (Figure 15a). Values are shown to be 50 times lower in this region compared to the rest of the defect where values are very similar to those measured for the control experiment. This suggests that a galvanic interaction between the MgRP and the AA2024-T351 provides some sacrificial protection in this closer region. The ACS-based system shows consistently high values, similar to those measured in the control experiment, irrespective of the distance from the CDI suggesting that no form of galvanic interaction occurs. A reduction in volume loss is demonstrated for TCP-based systems when compared to the control experiment. A contribution from galvanic protection from the MgRP is inferred by this reduction and, discounting the region directly adjacent to the CDI, volume loss values increase progressively with increasing distance from the CDI but remain consistently lower than those measured in the control experiment.
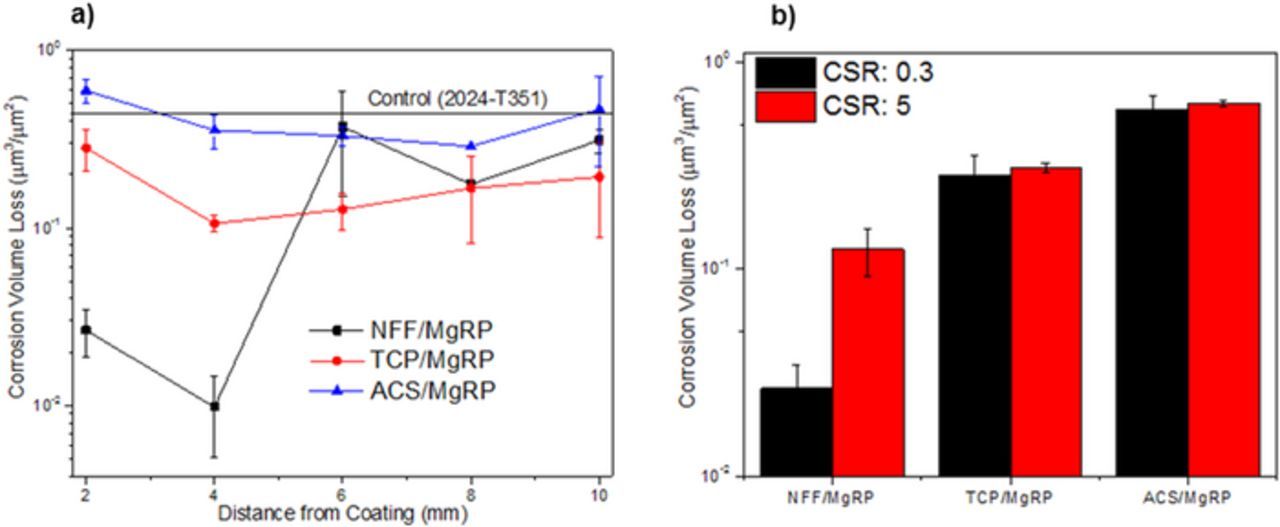
Figure 15. Corrosion volume loss of exposed bare AA2024-T351 defect region adjacent to the coating (< 2 mm) in selected coating systems after full immersion exposure in 2 M NaCl(aq) for 275 h. (a) corrosion volume loss as a function of distance from coating interface (b) corrosion volume loss as a function of coating to defect area ratio (CDR).
A summary of volume loss for the defect region within 2 mm of the CDI for both area configurations is given in Figure 15b. For the CDR: 0.3 configuration, the volume loss in this area for the NFF-based system is an order of magnitude lower than values measured for any other experiment. For a CDR: 5 configuration values were significantly reduced compared to the control and other pre-treatment systems but to a much lesser extent than CDR: 0.3. For the TCP-based and ACS-based systems there is no significant difference when comparing this portion of the defect for both area configurations. For both configurations, the TCP-based system shows a moderate reduction in volume loss compared to the control experiment. For the ACS-based system values are similar to the control experiment.
The results presented here, obtained using the optical profilometry technique, demonstrate a strong correlation to those reported using SVET, where NFF-based MgRP primer systems are shown to provide protection from pitting corrosion in the bare AA2024-T351 defect region 4 mm from the CDI. Furthermore, results for TCP-based systems show very limited galvanic interaction between the substrate and primer. ACS-based systems have shown no inhibition by galvanic interactions.
Discussion
Correlation of galvanic currents from SVET to FEA results
Previous work has utilized FEA as a tool to predict the galvanic couple current and potential distribution between Mg and AA2024-T351 in a MgRP configuration with zero pretreatment resistance.10 While the exact configurations such as electrolyte thickness, concentration and polymer resistances differ from this work, several configurations were chosen for comparison and the results are summarized in Table I where the results show good correlation. It is to be noted that while FEA predicts the galvanic current for fixed conditions, such as fixed electrolyte chemistry and thickness, SVET can be utilized to study the current density distributions as a function of actual position and time dependent electrolyte solution chemistry and pH and also surface modifications such as formation of Mg(OH)2 and effects of inhibitor leaching from the pretreatment. The FEA model uses fixed E-logi boundary conditions and predicts the quasi-steady state galvanic current and galvanic couple potential distribution. In real systems, a slight suppression of galvanic couple potential significantly affects the microgalvanic coupling of intermetallic phases which result in local pitting. The SVET method used here was able to account for both quasi-steady state current distributions as well as the role of galvanic couple potential suppression in reduction of local pitting. Modifications to the FEA model to improve correlation with environmental exposure would involve considerations for barrier properties of pretreatment and their degradation and the effect of Mg(OH)2 anionic species leaching and redeposition on galvanic current and potential distribution.
Table I. Values of galvanic corrosion at the defect as measured by SVET and estimated with FEA.
| Galvanic current at the | Galvanic current | |
|---|---|---|
| defect (SVET), A/m2 | at defect (FEA), A/m2 | |
| Case 1 (2024-T351 and Mg couple) SVET: 2 M NaCl, 10 mm electrolyte thickness, Rpolymer : 0 Ω-m2 FEA: 1 M NaCl, 0.5 mm electrolyte thickness, Rpolymer : 0 Ω-m2 | 500–1000 A/m2 | 100–1000 A/m2 |
| Case 2 (2024-T351 and NFF/MgRP couple) SVET: 2 M NaCl, 10 mm electrolyte thickness, Rpolymer : 100 Ω-m2 | ||
| FEA: 1 M NaCl, 0.1 mm electrolyte thickness, Rpolymer : 10 Ω-m2 | 0.1 – 0.2 A/m2 | 0.09 A/m2 |
Long term full immersion exposures
All SVET experiments conducted herein were carried out for a maximum immersion time of 36 h.6 No significant degradation of barrier properties of the pretreatment is likely to occur in this time frame. A further study to assess long term immersion would enable an understanding of the effect of pretreatment degradation on galvanic coupling. This would also aid the understanding of MgRP pretreatments that are enabled for sacrificial protection at a delayed exposure time.
Conclusions
The scanning vibrating electrode technique (SVET) was utilized in conjunction with standard electrochemical tests to study the galvanic throwing power of coating systems in full immersion (2 M NaCl(aq)) conditions. Each system comprised of a pretreatment and a Mg-rich primer (MgRP) for AA2024-T351 substrates.
SVET revealed that the corrosion of bare AA2024-T351 is characterized by the onset of local anodic current density maxima denoting pitting corrosion where peak values of 30 Am−2 were measured and 25 pits per cm2 initiated during a 36 h period.
- Coating systems comprising the three different pre-treatments were ranked, following EIS measurements, according to their electrical resistance of galvanic coupling between the substrate and the MgRP, whereby: NFF/topcoated system >> ACS > TCP > NFF (where the latter three pretreatments listed did not have a topcoat).
- Bare AA2024-T351 coupled to bare commercial purity (CP) Mg of identical area demonstrated intense galvanic coupling where the more noble AA2024-T351 was the cathode and the CP Mg the anode. Consistent cathodic current density values of −500 Am−2 were measured for the length of the bare AA2024-T351 whilst in the region within 1 mm of the interface this increased to −1000 Am−2. Very similar (positive) values were observed for the CP Mg.
- Inspection of SVET-derived cathodic current density data in the defect region in close proximity (within 4 mm) to the coating/defect interface (CDI) indicated galvanic coupling between the MgRP and the AA2024-T315 for NFF pretreatment systems. TCP-based systems demonstrated moderated galvanic coupling after 24 h and were limited to a 2 mm range from the CDI. For ACS-based systems no galvanic coupling was observed and values remain similar to those measured throughout the remainder of the defect region.
- For NFF-based systems with a coating/defect ratio (CDR) of 0.3, no local anodic maxima corresponding to pits were detected in the region extending to a distance of 4 mm from the CDI for periods of 36 h. Total integrated anodic current densities within the 0 mm–2 mm region were progressively reduced with increasing exposure time corresponding to a reduction of the resistance of the MgRP via the wetting of the epoxy matrix.
- TCP-based systems (CDR: 0.3) exhibited a mediated galvanic couple potential resulting in either delayed or limited sacrificial anode based protection and correlation between SVET-derived integrated anodic current density and the distance to the CDI was observed.
- ACS-based systems (CDR: 0.3) demonstrated no galvanic protection. The peak values of anodic maxima were dramatically reduced in comparison to the control experiment. However, no correlation between SVET-derived integrated anodic current density and the distance to the CDI was observed. The high resistance measured on intact ACS-based systems and the lack of increased cathodic current density near the CDI suggests that the reduction of anodic current density at pit sites is due to an alternative mode of inhibition in the form of leaching of ionic inhibitor species from the pretreatment.
- The geometric area ratio of coverage of MgRP to a bare AA2024-T351 defect affected the protection function for TCP and ACS-based systems. When the CDR was increased from 0.3 to 5, both cases exhibited lowered anodic currents with increasing exposure time. No significant cathodic protection, as indicated by the quasi steady-state current distribution was detected. This may indicate that other alternative inhibition mechanisms such as Mg(OH)2 redeposition and anionic species leaching play a prominent role for the larger CDR. NFF exhibited similar galvanic currents for both CDR configurations and the same degree of cathodic protection was indicated.
Acknowledgments
This work was supported by the U. S. DoD OUSD Corrosion University Pilot Program under the direction of Daniel Dunmire and by the National Science Foundation under NSF DMR #0906663. This material is based on research sponsored by the U. S. Air Force Academy under agreement number FA7000-13-2-0020. The U. S. Government is authorized to reproduce and distribute reprints for Governmental purposes notwithstanding any copyright notation thereon. The views and conclusions contained herein are those of the authors and should not be interpreted as necessarily representing the official policies or endorsements, either expressed or implied, of the U. S. Air Force Academy or the U. S. Government NRL/JA/7330-2014-217. Members of NAVAIR and Battelle Memorial Institute are acknowledged for the generous supply and preparation of MgRP-coated Al Alloy AA2024-T351 panels specifically: Craig Matzdorf, Frank Pepe, Jerry Curran, and William Abbott.
ORCID
C. F. Glover 0000-0002-9220-622X